Embed Size (px)
DESCRIPTION
ABT meters
Citation preview

MAHARASHTRA STATE ELECTRICITY TRANSMISSION CO. LTD.PUNE
DIN E ISO 9001: 2000
PRESENTATION BY
400 KV R.S. , Jejuri
S.M. BAKRE , M.E. , M.M.S.
EXECUTIVE ENGINEER
ABT METERS
ON

WELCOMEWELCOME

Basic Concepts• Historical Preview• Principle of working • Meters Generations
• First - Ferrari or Electromechanical • Second - Static• Third - Numeric


Electromechanical or Ferrari Meters
• The First Generation meters based on rotation of Aluminum disk within current coil and pressure coil.

Static Meter
• Advantages• High Accuracy• Low cost
• Limitations• Not ‘ intelligent ‘
Tamper can not be detected.
• Magnetic Theft

ABT Meters
• ABT means Availability based Tariff .

The term ‘Availability’ of ABT
• Indicates that the power MW should be available.
• It may specifically be noted that energy charge (at the specified plant-
specific rate) is not based on actual generation and plant output, but on
scheduled generation.

Availability as a base• For example if the rated capacity of
generator is 50 MW out of which 30 MW generation is available , the base for billing would be 30 MW and not 50 MW. 30 MW would be scheduled generation for calculating deviation if any. If 20 MW power is generated instead of scheduled 30 MW , the penalty of 30-20 = 10 MW would be imposed as UI charge.

ABT Concept • Traditional Concept :-
dw / dt
• Modern Concept :- dw/df . df/dt
• dw/df :- ABT Meters
• df./dt :- Frequency Trend

Underfrequency Relay (UFR)
• UFR Settings• 48.8 Hz• 48.6 Hz• 48.2 Hz

Frequency Trend Relay ( FTR )
•df/ dt Relay

Implementation of ABT was recommended initially at Central Generating Stations in the year 1994 by M/s ECC of USA under the study sponsored by World Bank and Asian Development Bank .

ABT tries to improve a quality of power and curtail the following
• Unacceptable rapid and high frequency deviations
• Frequent grid disturbances which result in generator tripping , power outages and grid instability.
• The pricing of power is made frequency dependent by ABT.

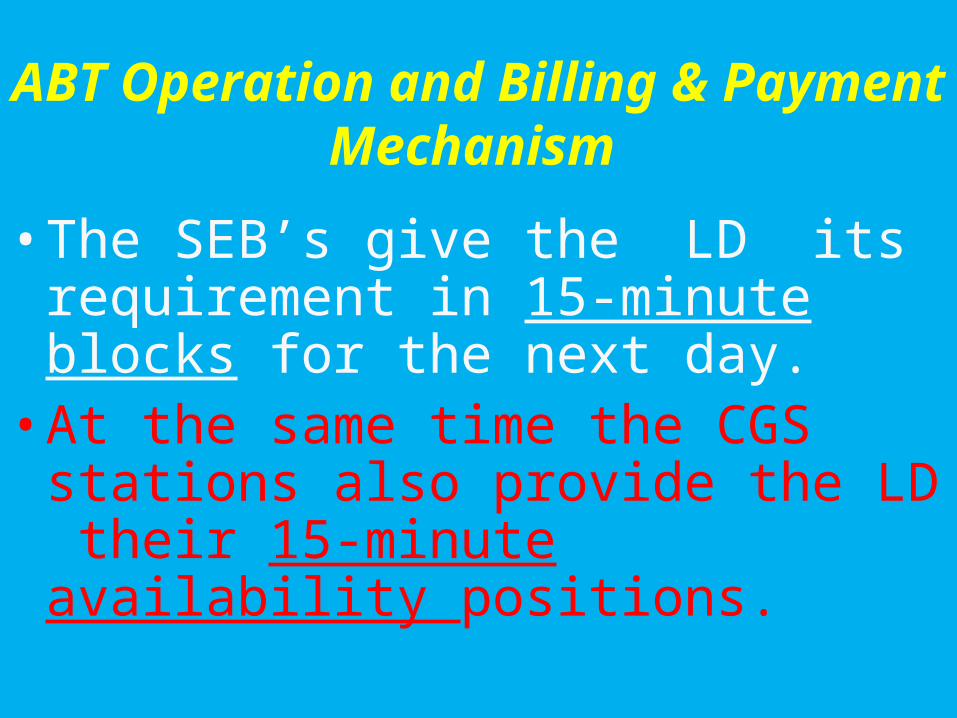
ABT Operation and Billing & Payment Mechanism
• The SEB’s give the LD its requirement in 15-minute blocks for the next day.
• At the same time the CGS stations also provide the LD their 15-minute availability positions.

ABT Operation and Billing & Payment Mechanism
Based on the declared demand and available supply, the LD provides a schedule to the SEB’s and the CGS for drawl and generation in 15-minute blocks.

ABT Operation and Billing & Payment Mechanism
• Based on the drawl and generation positions of the SEBs and the CGS stations, the UI bill is computed.

The Three-part ABT Tariff
•Fixed Charge : This is payable by the beneficiary states based on the capacity allocated to them, and is irrespective of the amount of power they draw or schedule to draw

The Three-part ABT Tariff
•Energy Charge: All the scheduled energy that is drawn is charged as per the variable energy charge of the station from which power is being drawn.
The Three-part ABT Tariff
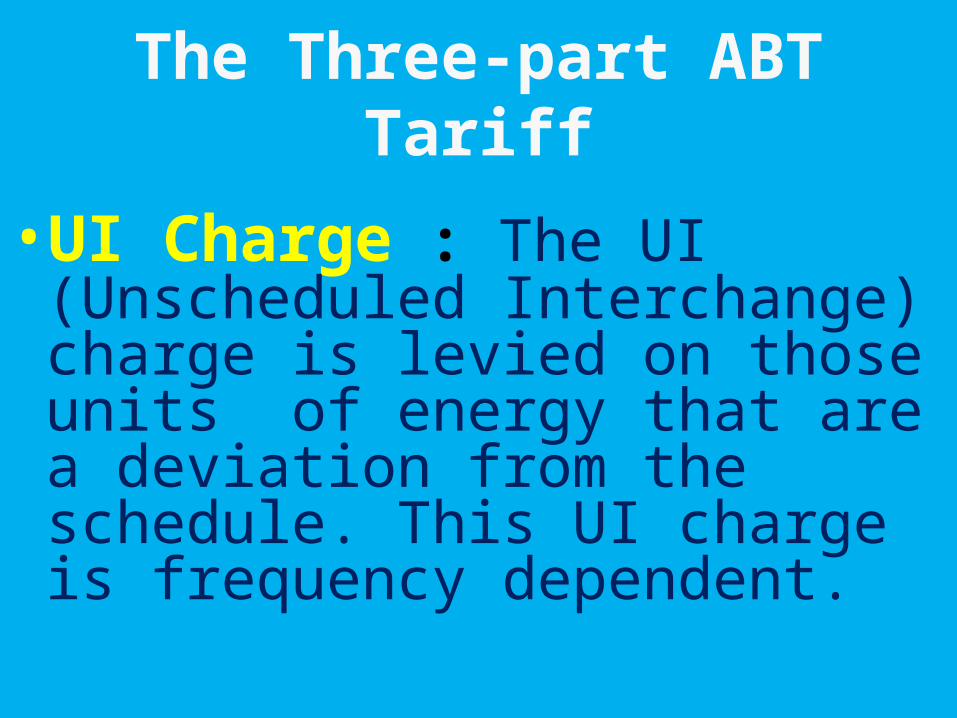
• UI Charge : The UI (Unscheduled Interchange) charge is levied on those units of energy that are a deviation from the schedule. This UI charge is frequency dependent.

Billed Amount• Billed
Amount = Fixed Charge + Energy Charge + UI Charge


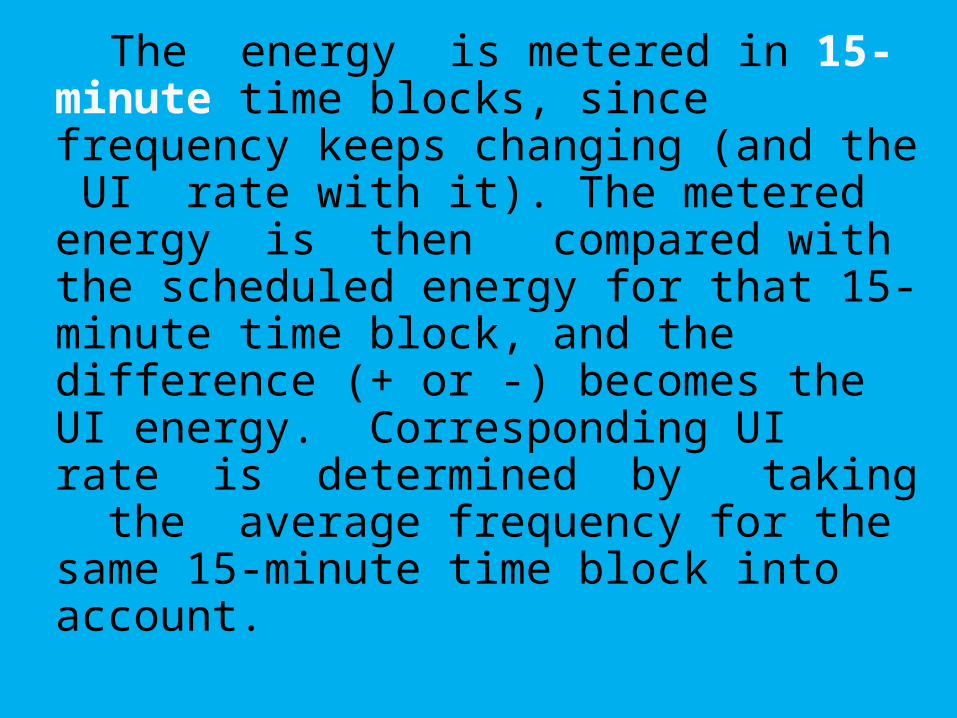
The energy is metered in 15-minute time blocks, since frequency keeps changing (and the UI rate with it). The metered energy is then compared with the scheduled energy for that 15-minute time block, and the difference (+ or -) becomes the UI energy. Corresponding UI rate is determined by taking the average frequency for the same 15-minute time block into account.

ABT Meters
• ‘ Intelligent ‘ meters
• Based on ‘polled approach ‘

Principle of working of ABT meter
• The energy is recorded in terms of pulses per kWh . The principle of working of static ABT meter is sampling . The voltage and current singles are received from PT and CT respectively .The samples of these signal at a particular instant are collected by Sample and Hold circuit . The phase difference between voltage and current is also found out . These values are analogue values .

Principle of working of ABT meter
• The CPU [ Central Processing Units ] only accepts digital signals . Therefore , the analogue signals are converted to digital by the circuit called ADC [Analogue to digital converter].The CPU processes these input signals for finding KVA [VI] , kWh [ VI cos ] , RKVA [ VI sin ] and other parameters . In order to measure the energy in terms of units , the circuit Energy to frequency converter is provided. The energy is converted into pulses . The counter counts number of pulses .

( I1 2+ I2 2 + I3 2 +I4 2 ……….. +In
2 )IRMS = ------------------------------------------------------
n
( V1 2 + V2 2 + V3 2 +V4
2 ……….. +Vn 2 )
VRMS = ------------------------------------------------------ n
V1 I1 + V2 I2 + V3 I3 +V4 I4 ……….. +Vn In W = -------------------------------------------------------
n W cos = ----------------- VRMS IRMS
Sampling of a sinusoidal wave

Functional Block Diagram of ABT Meter


3 Phase , 4 Wire Meters[ 3 wattmeter method ]

3 Phase , 4 Wire Meters
W = W1 + W2 + W3 = VI cos + VI cos + VI cos = 3 VI cos

General Arrangement
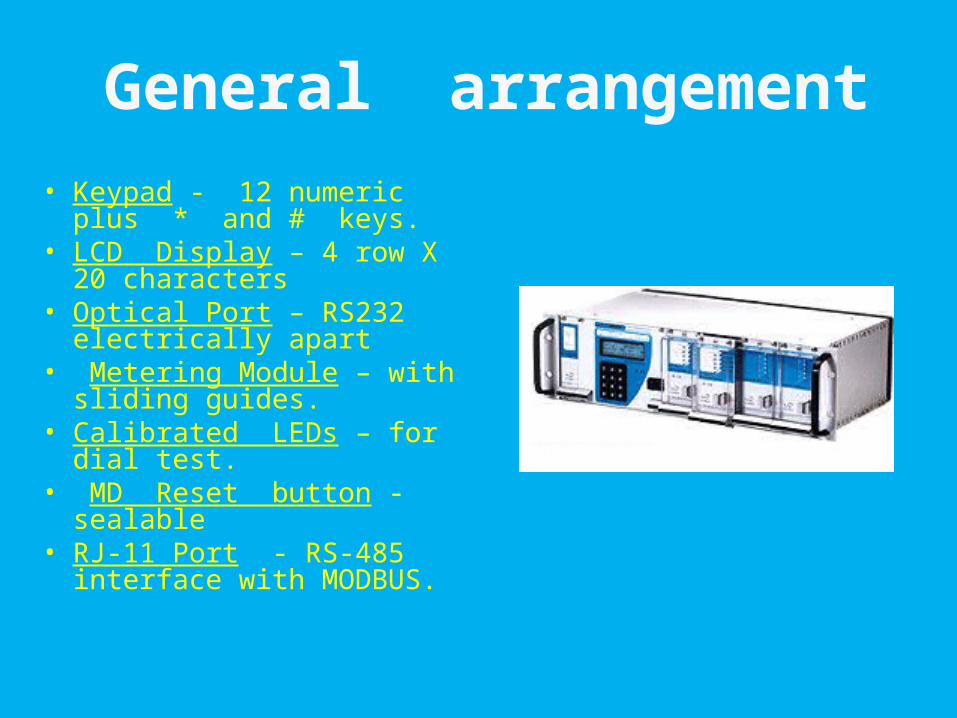
General arrangement • Keypad - 12 numeric plus
* and # keys.• LCD Display – 4 row X 20
characters • Optical Port – RS232
electrically apart • Metering Module – with
sliding guides.• Calibrated LEDs – for dial
test.• MD Reset button -
sealable • RJ-11 Port - RS-485
interface with MODBUS.


METER TESTING LAB SETUP
• Program the AC Power Source to generate a particular waveform.
• Configure the reference meter.
• Set the pulse counter to zero.
• Turn ON / OFF the switch I at the beginning / end of the test.
• Record results and make calculations.

METER TESTING LAB SETUP

ZERA

ABT Meter Testing • Dial Test - No. of
blinkings per kWh• Accuracy Test -
0.2 • Min. Current test• Max current test

Test Terminal Block (TTB)

Testing of ABT Meters

Status of ABT meters at 400 KV Jejuri SS
Feeder / ICT Type Category
400 KV Lonikand MFM T2T
400 KV Stg IV MFM T2T
ICT – HV Side ABT T2T
ICT – LV Side ABT T2T
220 KV Baramati MFM T2T
220 KV Jejuri I MFM T2T
220 KV Jejuri II MFM T2T
220 KV Phursingi MFM T2T

Advantages of ABT Meters
• These meters are capable of storing data . Therefore , the features such as load survey , energy history , tamper data etc is available. If the meter is stopped or tampered , the evidence is recorded .

Advantages of ABT Meters
• These meters have higher accuracy of the order of 0.2 .

Advantages of ABT Meters
•These meters are capable of displaying energy as per applicable tariff I.e. TOD and ABT tariff.

Advantages of ABT Meters
• In the advent of load survey data , it
is possible to monitor the consumption
pattern.

Advantages of ABT Meters• Using polled approach , the CPU detects abnormality in the metering system.

Advantages of ABT Meters
• The starting current of is very less i.e. 0.1 % of base current. Thus 1 A meter will record
1 mA consumption.
Advantages of ABT Meters
• The ABT meters have self diagnostic feature by which any
error developed in the inside component can be detected. This feature checks that the data stored in the
meter is safe and not corrupt.

Advantages of ABT Meters• These meters are user friendly.
• The display parameters are easy to understand.
• Push button operation to read display parameters is easy.
• Data retrieval through MRI [ Meter Reading Instrument ] is simple .
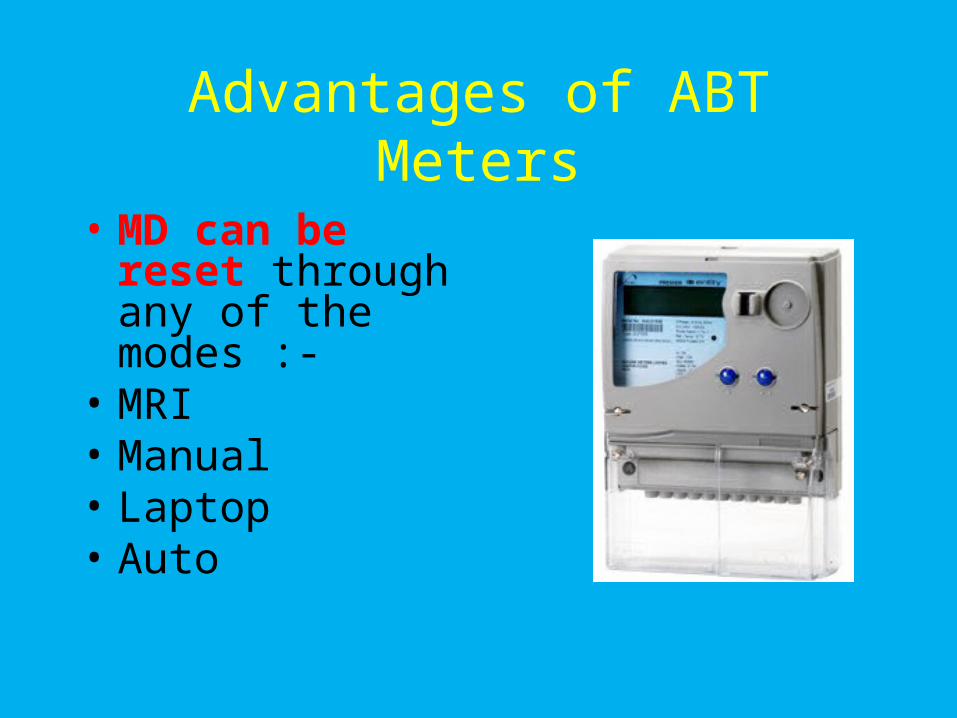
Advantages of ABT Meters
• MD can be reset through any of the modes :-
• MRI• Manual• Laptop• Auto

Advantages of ABT Meters
• Remote data retrieval possible through internet and mobile.
• Can be used in AMR [ Automatic Meter Reading ]

“OPEN ACCESS”, “WHEELING”
“Open access” and “wheeling” generally involve two parties, one supplying a certain quantum of power to the other through the regional / State grid. Any such transaction involves a number of parties, and disputes could arise in scheduling, energy accounting and commercial settlement, unless an appropriate framework is in place.

“OPEN ACCESS”, “WHEELING”
Suppose party - A has contracted to supply 10 MW round the clock to party - B (in the same State) at a certain price (which need not be disclosed to others), through the State grid. Suppose the transmission loss apportioned to this transaction has been determined as 0.5 MW. Party - B would then be entitled to receive 9.5 MW, provided party - A is actually injecting 10.0 MW into the State grid at its end. In actual operation, both injection by A and drawl by B may fluctuate over the day and the differential may vary from 0.5 MW. Who would pick up the commercial liability arising on account of these deviations? Since A and B are physically apart and operationally independent, a pragmatic solution for commercial treatment in such a case would be to meter the actual injection of A and actual drawl of B in 15-minute time blocks, and separately compute their deviations from their respective schedules (10.0 MW / 2.5 MWh for A and 9.5 MW / 2.375 MWh for B).

4 Quadrant Import Export Meter
Q2Export Lead
Q1 Import Lag
Q3Export Lag
Q4Import Lead

ABT Specifications
Parameter Value
Standard IEC 687 , CBIP 88
Definition Billing Energy
Type of meter 3 phase , 4 Wire
Voltage Rating 400KV to 11KV/110 /3 V
Temperature 27 0C

ABT Specifications
Parameter Value
Current Rating 1 Amp
Maximum Current [ 200 % of Ib ]
2 Amp
Minimum Current[ 0.1 % of Ib ]
1 mA
Class Of Accuracy 0.2
Frequency 50 Hz [ +- 5% ]

ABT SpecificationsDisplay Parameters
1 ] 3 Voltages - Vr , Vy , Vb 2 ] 3 Currents - I r , Iy , Ib 3 ] Kwh Import & 4 ] Rkvah [ Lead ] Export modes 5 ] Rkvah [ Lag ] 6 ] Kvah 7 ] Date and Time 8 ] Power Factor 9 ] KVA MD

ABT Specifications
• Modes of MD Reset • Manual• Auto• MRI • Laptop• Mobile Phone • Remote end

Load Survey Data • 60 days data
on FIFO• Integration
period of 15 minutes
• LS reset available
• LS Parameters• 3 Voltages – Vr , Vy , Vb
• 3 Currents – Ir , Iy , Ib
• Date and Time• kWh • RKVAH [ Lag ]
RKVAH [ Lead ] KVAH
KVA [ MD ]
Pf

Load Survey Data [ Graphical ]

Tamper Data• Meter CPU generates tamper
events on polled approach.
• At least 320 tamper events should be memorized.
• Current Tamper• CT Reverse• CT Short• CT Unbalance

Tamper Data
• Voltage Tamper• PT Missing• PT Low
• Power Tamper• Meter bypass

ABT Specifications• Minimum retention time for NV
RAM >= 10 Years • Total Energy for billing = true
energy + harmonic energy • Principle of working – sampling• PCB – SMT [ Surface mounting
technology ]

Surface Mount Technology [ SMT ]
• Lesser heat dissipation
• Long life of PCB and Components
• No component disconnection due to dry solder.


MRI – METER READING INSTRUMENT

SANDS MRI


Specifications of MRIstandard IEC 1109 CBIP 111
ANSI
Communication UART , RS-232 , RS-485
rate of data transfer 130 bps [ bits per second ] to 115 Kbps.
Battery 7.2 Volts , 800 mah ‘Nickel Cadmium ‘ battery
Storage Capacity 8.5 MB

Maintenance of MRI • Charging of MRI is the main maintenance
activity to be carried out. For 8 hour working , the MRI should be charged for 1 hour.
• If the MRI is not in use , it should be charged once in a week .
• It should be checked at least within a month that all MRI commands are working properly .
• Clean the surface of MRI with smooth wet cloth .

MRI Commands • DOS
Commands • DIR• Date• Time• CLS• Ver• Vol• Path
• Firmware Commands• Master import• Master export• PC_Term• SH• TP• MSZ• TPRMRM
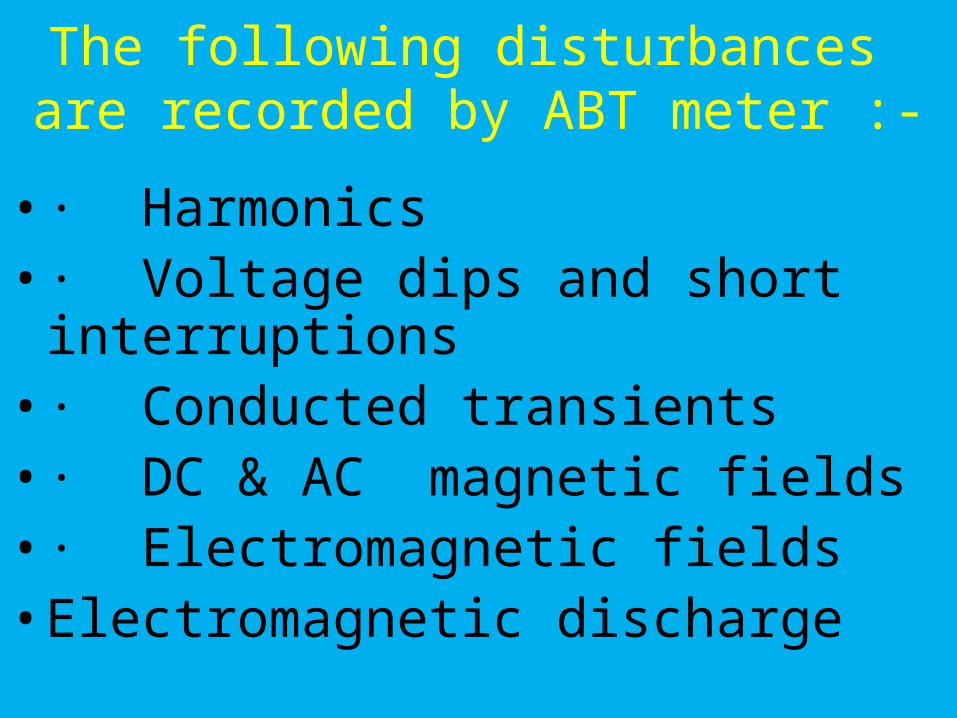
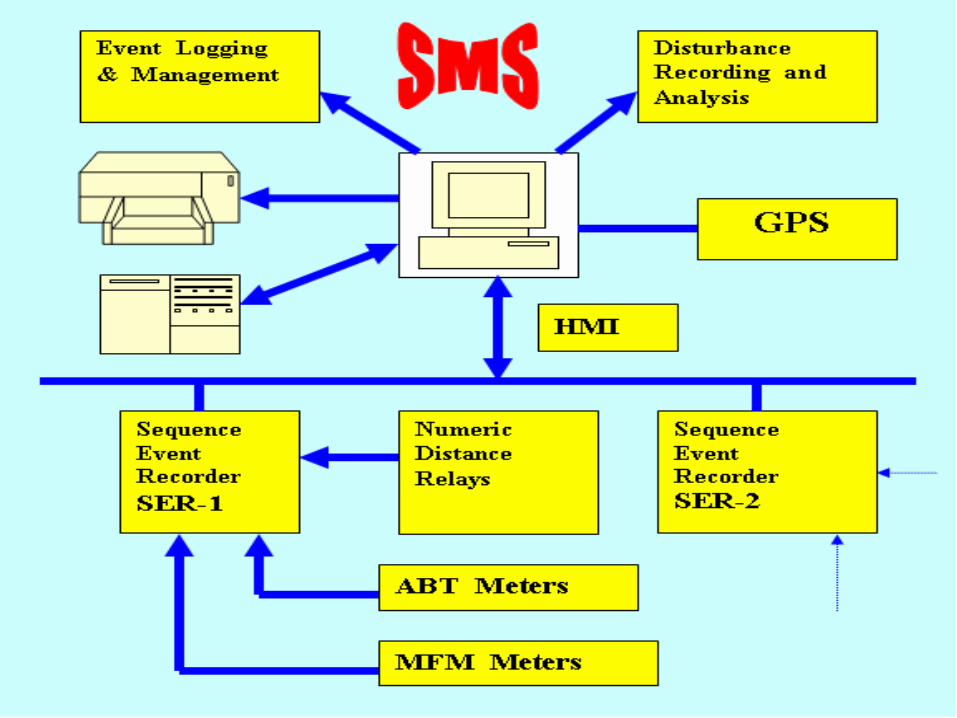
The following disturbances are recorded by ABT meter :-
• · Harmonics• · Voltage dips and short
interruptions• · Conducted transients• · DC & AC magnetic fields • · Electromagnetic fields• Electromagnetic discharge

Energy Management Software EMS
• The EMS is provided at all substations , Central Monitoring Station [ LD ] , Corporate / Zone / Circle / Division Office . The EMS is implemented for monitoring energy at interface points with inter-state / intra-state grid including all incoming & outgoing feeders / transformers / ICTs .

Energy Management Software EMS
• The ABT / MFM meters are installed at the required points . The system software automatically collects data from these meters . The metering system is provided with RS485 communication port [ in form of RJ11 connector on its back ] . The communication cable has RJ11-to-RJ11 configuration. The data is collected online on RS485 MODBUS protocol.

Energy Management Software EMS
• The data is made available at substations at the refreshing rate of 5 min using multiplexer or Data Concentrator Unit [ DCU ] and interfacing devices. The DCU stores 5 min. data for 30 days [ on FIFO ] basis . The reports can be generated. The EMS at LD has an access to their existing database i.e. Oracle 10g.


The system comprises of the following components
• Energy meters [ ABT and MFM ] at each substation.
• Data Concentrator Unit [ DCU ] at each substation.
• Global Positioning System [ GPS ] on PC at each substation.
• Data Acquisition Software [ DAS ] at each substation MYSQL as backend database.
• Networking [ switches and cables ] at each substation.
• EMS at LD with access to their existing database i.e. Oracle 10g as backend.


Pin Configuration No Pin Description
1 VR Red Phase Voltage
2 VY Yellow Phase Voltage
3 VB Blue Phase Voltage
4 IRIN Red Phase Current IN
5 IROUT Red Phase Current OUT
6 IYIN Yellow Phase Current IN
7 IYOUT Yellow Phase Current OUT
8 IBIN Blue Phase Current IN
9 IBOUT Blue Phase Current OUT
10 VN System neutral
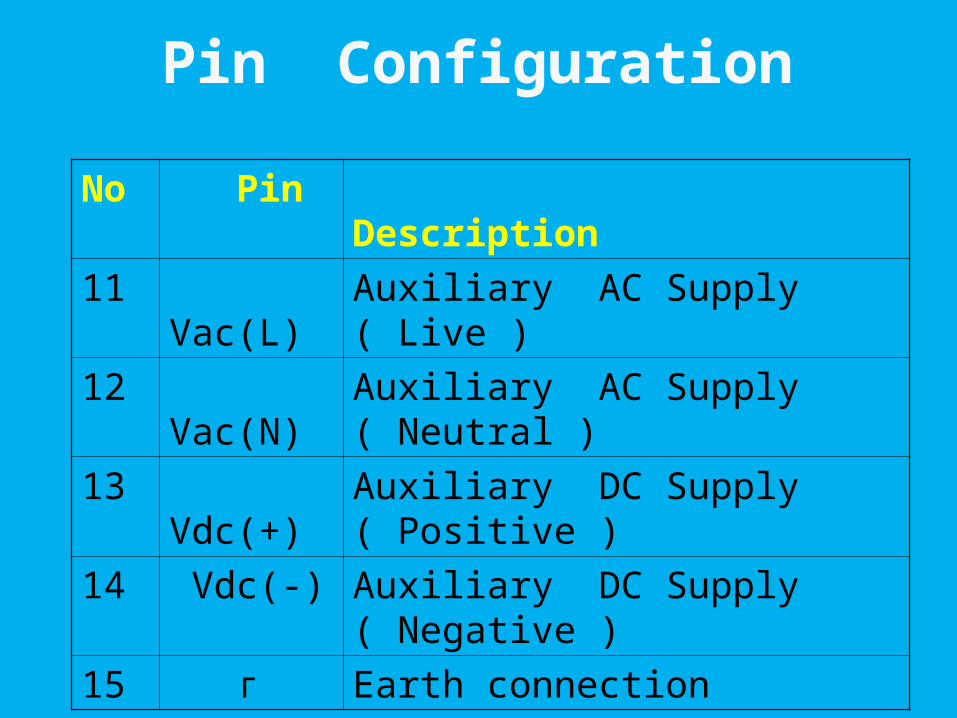
Pin Configuration
No Pin Description
11 Vac(L) Auxiliary AC Supply ( Live )
12 Vac(N) Auxiliary AC Supply ( Neutral )
13 Vdc(+) Auxiliary DC Supply ( Positive )
14 Vdc(-) Auxiliary DC Supply ( Negative )
15 г Earth connection


Reports Generation
• PC Software • Instantaneous Data
• Billing Data• Load Survey Data
• Tamper Data

Reports generated by EMS
• Energy Loss Report• Voltagewise Energy Loss
Report• Transformerwise Energy Loss
Report• Power ON/OFF Report• Voltage Profile Report

Reports generated by EMS• Min-Max report for current , voltage ,
MW , MVAR , PF < frequency.• Transformer Loading Report• Alarm Report.• Meter Replacement Report• Load Survey Report• Load Shedding Report [ manual data
entry ]• Meter Detail Report


CEA Regulations on Installation & Operation of meters
• MEAA – Meter for energy audit & accounting
MIT -Meter for interface
tariff MC - Meter for Consumer
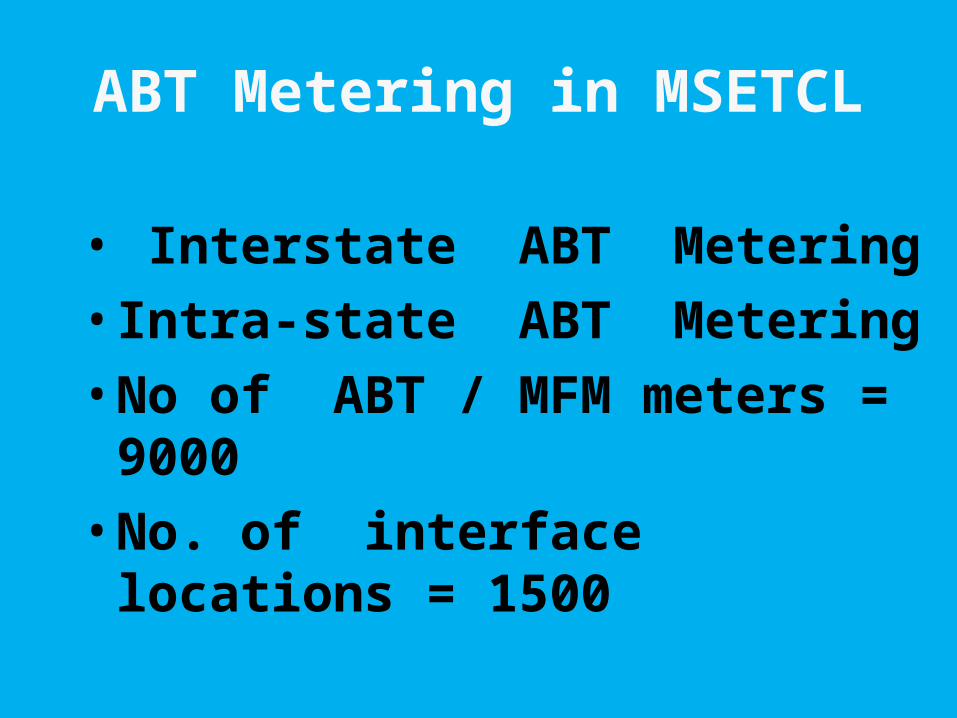
ABT Metering in MSETCL
• Interstate ABT Metering• Intra-state ABT Metering• No of ABT / MFM meters = 9000• No. of interface locations = 1500

Basics of Tulip Communication

Network Connectivity Devices
• Modems• Repeaters• Hubs• Bridges• Multiplexers• Switches• Routers• Brouters

Clint – Server Model


Modem
• Performs modulation and demodulation

Repeater
• Perform amplification of the signal to reduce attenuation.

Hubs
• Hub is the multiport repeater

Bridge •Connects two different networks

Multiplexer ( MUX )
• Combines two or more signals on high speed transmission media

Switches• Connects /
disconnects internet connectivity

Routers
•Intelligent switches

Brouters •Routers that follow all protocols

Ethernet Cable

RJ-11 Connector

Tulip Communication System

Ensure that
• Proper earthing is done.
• Network switch is ‘ ON ‘
• UPS is ‘ ON ‘

How to test Tulip connectivity ?
• Contact ‘ ABT Room ‘ at SLDC , Kalwa • At Substation end , make following
operations on ABT PC – • Click on ‘ Start ‘ button .• Click on ‘ Run ‘ • Type the word ‘ CMD’ and click ‘ OK ‘ .• Type ‘ IPCONFIG ‘ and press enter button.• Type ‘ PING_code ‘ and press enter button. • The indication ‘healthy ‘ indicates healthiness
of the Tulip link.

Check tulip configuration
• Visit the following website :- www.myconnect.tulipconnect.com
• Enter the following :-
username :- 6086
password :- satisfaction

Maintenance of ABT-Tulip System
• AC/DC supply of PC / DCU /Tulip Devices should not be switched off in any case.
• The power points should be dedicated and should not be used for other purpose such as mobile charging .
• GPS should be always charged and running • The clock of meter /PC/MRI should be
accurate and as per GPS.
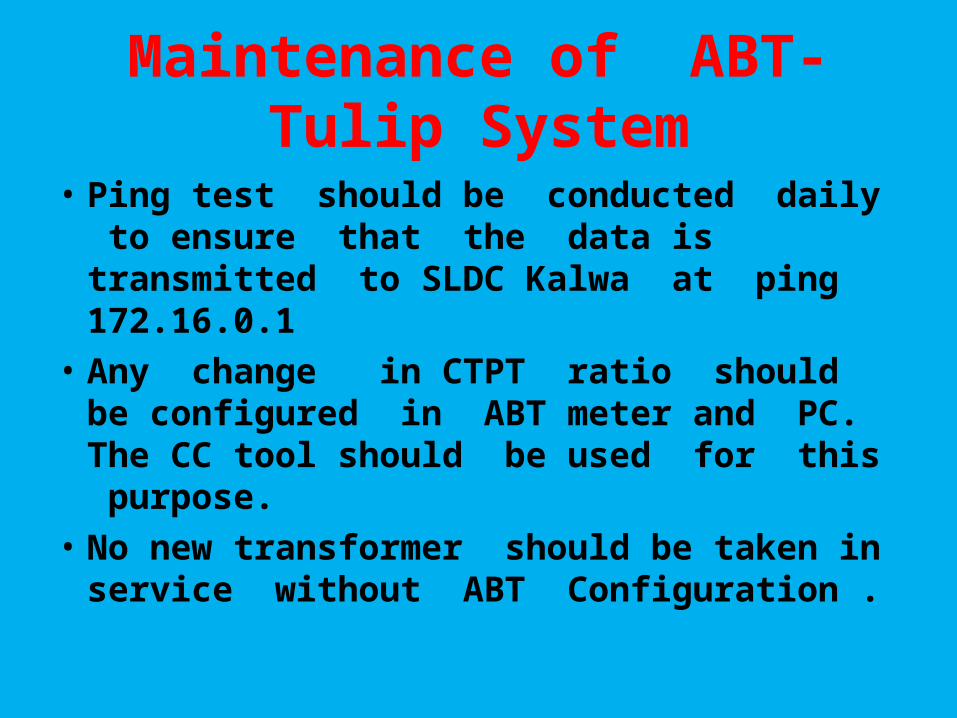
Maintenance of ABT-Tulip System
• Ping test should be conducted daily to ensure that the data is transmitted to SLDC Kalwa at ping 172.16.0.1
• Any change in CTPT ratio should be configured in ABT meter and PC. The CC tool should be used for this purpose.
• No new transformer should be taken in service without ABT Configuration .

Maintenance of ABT-Tulip System
• The wiring should be proper and should not be disturbed.
• The installation should be neat-clean and free from dust.
• In case AC supply is to be switched off , the PC should be shut down properly.
• In case of CT/PT/ meter failure , proper assessment of energy should be done.

Maintenance of ABT-Tulip System
• Data should be retrieved using MRI on first date of the month particularly in respect of T2G feeder.
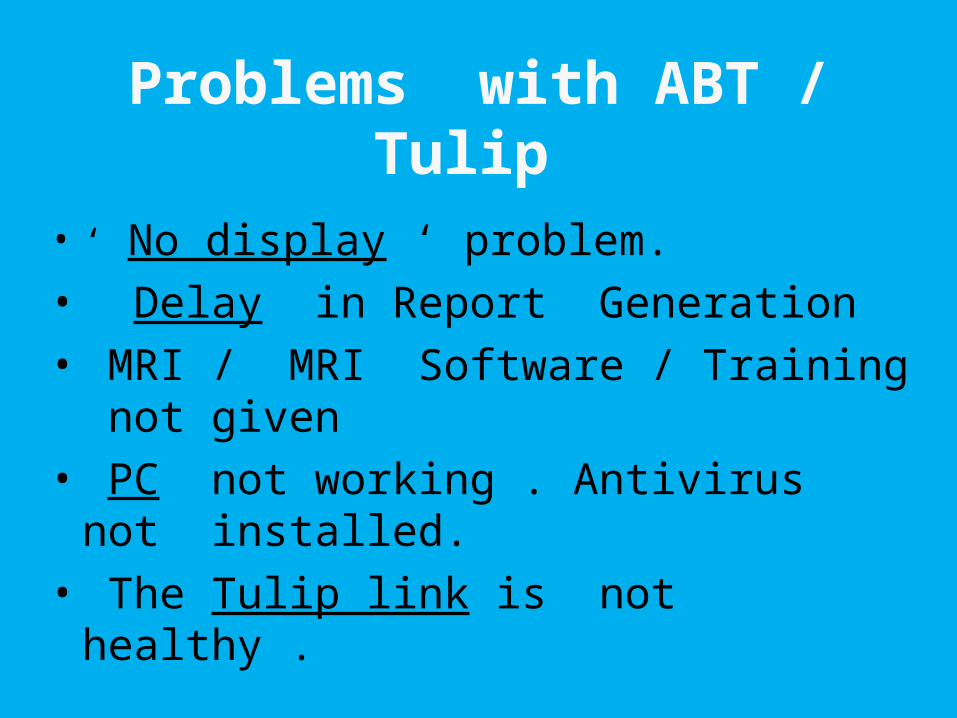
Problems with ABT / Tulip
• ‘ No display ‘ problem.• Delay in Report Generation • MRI / MRI Software / Training not given • PC not working . Antivirus not installed. • The Tulip link is not healthy .

Problems with ABT
• Energy Audit of Lines is not calculated. • Power ON/OFF Reports - EHV Substations
have bus PT and not line PT. Therefore the logic should be only ‘ Current OFF ‘ and not ‘ Voltage OFF ‘ or ‘Power OFF ‘ .
• ABT meters operate on auxiliary AC/DC supply . However , at almost all substations , ABT meters are connected on DC . This may create problem when there is DC leakage.

Problems with ABT
• UPS of ABT trips on overvoltage / undervoltage at EHV substations . Therefore , it is required to provide stabilizer instead of UPS.

Roadblocks in ABT meter commissioning
• At generating stations , the LV of generating transformer is connected directly to 33 KV bus. No CT / PT are provided.
• There is no adequate space in switchyard for providing CT/PT.
• Metering core not available in CTs. • 5 A CT are provided and not 1 A. • It is difficult to install ABT meter on outdoor
panels.

Commissioning of RTU
• RTU – Remote terminal Units• DC – data concentrators • Contract given to M/s Siemens vide MSETCL/CO/CE/CRA/RTU/T-0907/7088 dt
31-5-08.


AMR

Connectivity with ERP System
• The Data Centers of ERP are connected to Tulip Hub at SLDC kalwa .
• The substations are connected to Tulip Hub.
• The rate of data transfer is 4 mbps.
• The connectivity is established through following servers –
• - ISP Router• ( Internet Service
Provider )• - Tulip intra-net
service provider router .

Connectivity with ERP System
• Connectivity with Proxy Server
• Internet Explorer >• Internet Options >• Connections >• LAN Settings • Enter IP address of
Proxy server and Port number


TOD MetersTOD Meters

TOD Tariff
TODSlot
Shift Surcharge /incentive
A 22.00-6.00 -0.75 per KwhB 6.00 – 9.00 0C 9.00 – 12.00 +0.60 per KwhB 12.00 – 18.00 0D 18.00 – 22.00 1.00 per Kwh

HT Metering Kiosk

Thank you