Embed Size (px)
Citation preview

Applied Econometrics and International Development Vol. 14-2 (2014)
ABSORPTIVE CAPACITY COMPARED: EVIDENCE FROM SECTORAL
DATA OF OECD, ASIAN AND LATIN AMERICAN COUNTRIES
MONTINARI, Letizia*
ROCHLITZ, Michael
Abstract: In this paper, we investigate differences in and determinants of technical
efficiency across three groups of OECD, Asian and Latin American countries. As
technical efficiency determines the capacity with which countries absorb technology
produced abroad, these differences are important to understand differences in growth and
productivity across countries, especially for developing countries which depend to a large
extent on foreign technology. Using a stochastic frontier framework and data for 22
manufacturing sectors for 1996-2005, we find notable differences in technical efficiency
between the three country groups we examine. We then investigate the effect of human
capital and domestic R&D, proxied by the stock of patents, on technical efficiency. We
find that while human capital has always a strongly positive effect on efficiency, an
increase in the stock of patents has positive effects on efficiency in high-tech sectors, but
negative effects in low-tech sectors.
JEL codes: C33, O14, O33
Keywords: Absorptive Capacity, Efficiency, Stochastic Frontier Analysis, Technology
Transfer
1. Introduction
Despite the emergence of newly industrialized economies and an increasing
fragmentation of global production, most innovations are still carried out in a small
number of R&D intensive countries (Eaton and Kortum 2001, Caselli and Wilson 2004).
The large majority of developing and newly industrialized countries import technology
from these countries (Mastromarco 2008).
Gerschenkron (1962) and Abramovitz (1986) have argued that developing countries have
a higher growth potential than advanced countries, as they can realize relatively larger
productivity gains in adopting advanced technologies. In a theoretical paper, Acemoglu et
al (2006) formalized the idea that developing countries should focus on adopting foreign
technology before starting to innovate themselves. According to the case study literature,
this is indeed what happened in newly industrialized countries such as South Korea,
Taiwan or more recently China (Amsden 1989, Wade 1990, Breznitz and Murphree
2011). In all these economies, the capacity to successfully absorb foreign technology has
played a crucial role in sustaining high growth rates.
Understanding differences in absorptive capacity is thus key to understand the large
differences in productivity and income across countries (Prescott 1998). While the
technological distance from R&D intensive countries determines the scale of potential
benefits from importing technology, and trade liberalization opens up channels of
*Letizia Montinari (IMT Lucca, [email protected]) & Michael Rochlitz (IMT Lucca;
National Research University – Higher School of Economics, Moscow, [email protected])

Applied Econometrics and International Development Vol. 14-2 (2014)
26
technology transfer, the ability of a country to absorb imported technology is crucial to
realize the potential gains from catching-up and trade.
The aim of this paper is to examine levels and determinants of absorptive capacity for two
groups of industrialized and emerging economies in Asia and Latin America, and a group
of European OECD countries that also includes the US. While this last group is composed
of countries that have been leading industrialized nations for a long time, the Asian and
Latin American countries in our sample, with the exception of Japan, are mostly
developing and newly industrialized economies. Comparing these three country groups
permits us to investigate if levels and determinants of absorptive capacity systematically
differ across regions that are at different levels of economic development, and share
different political and historical contexts.
How to measure absorptive capacity? In our paper, we take technical efficiency of each
manufacturing industry in a given country as a proxy for absorptive capacity. Technical
efficiency is both measurable and a close approximation of the concept of absorptive
capacity we have in mind. To estimate levels and determinants of technical efficiency we
use stochastic frontier analysis (SFA) and sectoral data, which permits us to treat
technical efficiency and technical change as two distinct components of total factor
productivity (TFP) in each industry.
Instead of using SFA, most previous studies in the absorptive capacity literature have
employed a two-stage modelling strategy (Senhadji 2000, Miller and Upadhyay 2000,
Madsen et al. 2010, Iyer 2011), which however suffers from a number of flaws (that we
discuss in section 2). The few studies using SFA have either focused on OECD countries
(Griffith et al. 2003, 2004, Kneller and Stevens 2006), or have used aggregate data
(Mastromarco 2008, Henry et al. 2009), and do not have data for recent years. Using
sectoral instead of aggregate data permits us to get more precise results, and to distinguish
between effects on low-tech and high-tech sectors. As sectoral data has become available
only recently for many developing countries, this paper is the first one, to our knowledge,
that combines SFA with the use of sectoral data for both developed and developing
countries.
We investigate the effect of two potential determinants of absorptive capacity, namely
human capital measured by years of schooling, and the effectiveness of domestic R&D,
proxied by the stock of patents filed by a country. While most previous studies have
either examined the effects of human capital (Nelson and Phelps 1966, Cohen and
Levinthal 1989, Benhabib and Spiegel 1994, 2005) or R&D expenditure (Verspagen
1991, Fagerberg 1994, Aghion and Howitt 2005) on absorptive capacity, we follow more
recent studies that look on both determinants (Kneller and Stevens 2006). However,
instead of R&D expenditure we use stock of patents as a proxy for R&D, which to our
knowledge has not been done before in this context.
The contributions of this paper to the literature are thus twofold. To our knowledge, this
paper is the first using SFA and sectoral data to comparatively analyse efficiency levels
and determinants of absorptive capacity across three groups of developed and developing
countries. Secondly, instead of R&D expenditure, we introduce the use of stock of patents
as a proxy for R&D to the absorptive capacity literature. We find that levels of technical
efficiency slightly increase over the time span covered in our study, with the exception of
Latin America, where efficiency in high-tech sectors experiences a sharp drop after 1999.

Montinari, L., Rochlitz, M. Absorptive Capacity Compared: Evidence From Sectoral Data
27
A temporary drop in high-tech efficiency, albeit less pronounced, is also noticeable for
Asia and OECD countries after 1999. While in Europe low-tech sectors are on average
more efficient than high-tech sectors, the opposite is the case for Asia and the US, with
Latin America showing mixed results. Looking on the determinants of technical
efficiency, we find that human capital has always a strongly positive effect on efficiency,
especially in low-tech sectors. An increase in the stock of patents has positive effects on
efficiency in high-tech sectors, but negative effects in low-tech sectors, especially for
Asia and Latin America.
In the following, section 2 will discuss our empirical strategy, and section 3 presents the
data. Section 4 shows the results for our frontier estimation, for the efficiency levels and
for determinants of technical efficiency, and section 5 concludes.
2. Empirical Strategy
We use SFA, as it provides an ideal framework to estimate technical inefficiency. SFA is
preferred to the more popular two-stage modelling approach used in most of the previous
literature, since it is statistically more accurate and matches more closely the idea of
absorptive capacity we want to capture.
The two-stage approach consists in estimating TFP as residual of a parametrized
production function, and then regressing it against a number of factors which are
considered to be linked to changes in productivity (Senhadji 2000, Miller and Upadhyay
2000, Madden et al. 2001, Okabe 2002, Wang 2007, Madsen et al. 2010). However, Koop
et al. (1999) and Koop et al. (2000) point out that while in the first stage of this approach
the efficiency terms are assumed to be identically and independently distributed, in the
second stage they are a function of a number of variables which might directly enter the
production function specification (or be correlated with explanatory variables), thereby
contradicting the assumption of identically distributed inefficiency terms (Battese and
Coelli (1995), pp. 326). SFA overcomes this problem by assuming that technical
inefficiency effects of production are independently but not identically distributed, and
then by simultaneously estimating the stochastic frontier and the inefficiency model.
Another important feature of SFA is that it allows us to distinguish between technical
progress, technical efficiency, and a stochastic component of TFP. This distinction is
omitted in the two-stage approach, where TFP is used as a measure of technical
inefficiency. A third criticism concerns the use of the country with the highest TFP as the
numeraire in a measure of relative productivity, to account for the distance to the
technical frontier (Griffith et al. 2004, Kneller 2005). This approach is based on two
unrealistic assumptions. First, it assumes that the country with the highest TFP is at the
frontier, which might not be true. Secondly, it assumes that a unique technology frontier
exists for all countries. In the SFA approach, the concept of absorptive capacity is instead
related to that of production frontier, which represents the maximum output that can be
produced starting from any given input vector (i.e. the upper boundary of the production
possibilities set). Our empirical strategy is based on that of Battese and Coelli (1995).
Following their formulation, the stochastic production frontier can be expressed as
(1)

Applied Econometrics and International Development Vol. 14-2 (2014)
28
where Yijt is output, xijt is a vector of inputs of production, β is a vector of parameters to be
estimated, Vijt are random errors which capture the stochastic nature of the frontier, and
Uijt are non-negative random variables which denote technical inefficiency of production
and are obtained by a truncation at zero of the normal distribution with mean zitδ
andvariance σ2 (see Battese and Coelli 1995).
The technical inefficiency effect is
specified by the following equation
(2)
where zit is a vector of explanatory variables associated with technical inefficiency of
production, δ is a vector of unknown coefficients, and Wijt is a random variable defined by
the truncation of a normal distribution with zero mean and variance σ2. The requirement
that Uijt ≥ 0 is ensured by truncating Wijt such that Wijt ≥ -zijtδ.
To estimate equation (2), we assume a semi-translog specification (i.e. translog in k and l,
as proposed by Kneller and Stevens 2003), which provides a less restrictive functional
form for a production function
(3)
where all lower case letters represent logarithms and v = ln(ηijt), u = ln(εijt).
yijt is value added, kijt is physical capital, lijt is labour supply, pijt is domestic knowledge
measured by local R&D, and rit represents foreign knowledge spillovers, which are
assumed to be a function of the stock of R&D in the five countries that contribute most to
the global stock of R&D.
We make the simplifying assumption that technology is factor-neutral, implying that
output is separable in the production function and technology, so that we can separate
technological change pit from efficiency uijt in TFP. A quadratic time trend, year2, is also
included to measure technical progress not captured by local and foreign R&D.1 Finally, a
set of country fixed effects ci and a set of sector fixed effects sj are included to control for
country and sector specific characteristics. Following Griliches and Lichtenberg (1984),
knowledge is assumed to be an input in the production function. As Kneller and Stevens
(2006), we assume that knowledge evolves with the local stock of R&D and with foreign
knowledge spillovers, capturing technical change. To measure foreign R&D spillovers to
the domestic economy, we follow Coe and Helpman (1995) and Henry et al. (2009). They
use a bilateral-imports-share weighted sum of R&D capital stocks of trade partners. Using
the same logic, we weight the stock of R&D of the five countries that contribute most to
the total stock of R&D by the share of imported machinery and equipment from these
countries. This is motivated by the evidence that most of the world’s R&D is produced in
a small number of R&D intensive countries and imported through R&D intensive inputs
(Eaton and Kortum 2001, Caselli and Wilson 2004). Finally, we assume that knowledge
transfer is partial, depending on the degree of economic integration across countries.
Barriers to knowledge transfer are captured by weighting the stock of R&D by the
distance to the source.
1 A similar assumption is made by Henry et al. (2009).

Montinari, L., Rochlitz, M. Absorptive Capacity Compared: Evidence From Sectoral Data
29
where n is an index for the five top countries, Pnt is the stock of R&D in country n, min is
the share of machinery and equipment imported by country i from country n, and Din is
the distance between country i to country n. Technical inefficiency is defined by
(4)
where, as before, all lower case letters represent logarithms. zit is stock of patents, hit is
human capital, lowtech is a dummy variable taking value 1 when the sector is low-tech
and 0 otherwise, si are sector fixed effects, and wijt has been defined after equation (2).
The impact of knowledge on inefficiency is captured by the stock of patents. To our
knowledge, the use of stock of patents is new in the empirical literature on absorptive
capacity. Kneller and Stevens (2006) use spending on R&D in the industry to measure the
effect of knowledge on inefficiency. In our analysis, we prefer to use stock of patents as a
measure of knowledge for two reasons. First, we believe that stock of patents is a more
reliable indicator of the quality and effectiveness of knowledge production than
expenditure on R&D2. Second, we find stock of patents to be more robust to
multicollinearity problems than expenditure on R&D, given the high correlation between
spending in R&D and years of schooling that we observed (=0.77) in our preliminary
analysis.
We use average years of schooling in country i as proxy for human capital. The effect of
both stock of patents and years of schooling is allowed to vary between high-tech and
low-tech sectors. A number of studies investigate how the effect of R&D activities on
efficiency and on productivity varies between high-tech and low-tech sectors (see
Kumbhakar et al. (2011) for a literature review). Following this literature, we disentagle
the effect of R&D activities, in our paper proxied by patents, on efficiency to highlight
differences between high-tech and low-tech sectors. We follow the same line of reasoning
for human capital, although only a few studies have specifically looked at differences
between high-tech and low-tech sectors in this respect.
Finally, a set of sector fixed effects are added to control for sector specific characteristics.
If the stock of knowledge and human capital positively affect absorptive capacity in the
high-tech sectors, we should expect 1 and 3 to have a negative sign. In the low-tech
sectors, we should expect the sum of the coefficients for both the stock of patents and
years of schooling to be negative (i.e. 1 + 2 < 0 and 3 + 4 < 0 ).
3. Data
The model is estimated for a sample of 10 European and North-American OECD
countries (United Kingdom, United States, France, Germany, Italy, Belgium, Norway,
2 We are aware that our results might be slightly biased due to the fact that certain sectors feature
higher appropriability conditions of innovation than others, and that patenting might be relatively
less costly for firms in developed countries than for firms in developing countries.

Applied Econometrics and International Development Vol. 14-2 (2014)
30
Sweden, Netherlands, Denmark), 7 Asian countries (China, India, Indonesia, Japan,
Philippines, Singapore, South Korea), 5 Latin American countries (Bolivia, Chile,
Colombia, Mexico, Uruguay) and for twenty-two manufacturing industries over the
period 1996-2005.3 We divide the twenty-two manufacturing sectors into high-tech and
low-tech sectors, following the standard OECD sector classification.4
While the first group of 10 OECD countries is included as a benchmark, we have chosen
the other two country groups from regions that are characterized by different historical
and political pre-conditions, i.e. Asia and Latin America. Whereas the countries in the
first group have been among the world’s leading industrialized nations for a long time,
most countries in the two other groups are developing and newly industrialized
economies that are still at a much lower level of economic development. Many of them
share a recent history of successful economic catch-up, which makes them especially
interesting for an analysis of absorptive capacity.
Our choice of countries was limited by the availability of sectoral data. Sectoral data is
not yet available for many developing countries, and has only recently been made
available for most of the non-OECD countries in our sample. As of now, our sample is
thus the largest possible considering issues of data availability. Furthermore, we have
excluded developing countries from Africa, as data availability was very limited and
technology absorption has arguably played only a marginal role in these countries until
recently (Lall and Pietrobelli, 2002).
Data for valued added, gross fixed capital formation and number of employees are taken
from the UNIDO ISDB (3-4 digit level). Data are comparable across years, having been
deflated to 2000 prices and converted using measures of purchasing power parity (PPP) to
US$. Both the GDP deflator and the PPP conversion factor are taken from the World
Bank. The perpetual inventory method (PIM) is used to construct the capital stock.
(5)
(6)
where Kij is capital stock of sector j in country i, Iij is capital formation/investment, δK is
the depreciation rate set at 4% (Liao et al. 2009), and is the average growth in the first
five years of investment series.
Human capital is measured by average years of schooling in the population in country i,
and is taken from Barro and Lee (2010)5. The PIM is also used to compute stock of R&D
using total R&D expenditure in country i deflated to 2000 prices, and converted using
measures of purchasing power parity (PPP) to US$.
.. (7)
3 Stock of R&D, years of schooling and number of patents are available only at the country level.
4 See table 6 in the appendix.
5 Ideally, it would be better to use a closer proxy for absorptive capacity, such as the number of
university graduates in technical subjects. However, for most of the emerging economies in our
sample, such data is not yet available, or has only very recently been made available.

Montinari, L., Rochlitz, M. Absorptive Capacity Compared: Evidence From Sectoral Data
31
. (8)
where Pi is the stock of R&D in country i, Ri is the expenditure in R&D, is the
average annual growth rate of R&D and δR is the rate of depreciation of R&D stock that
we set at 15% (Griliches 1984).
Data on patents are obtained from OECD. We use the triadic patent families which are a
set of patents filed at the European Patent Office (EPO), the United States Patent and
Trademark Office (USPTO), and the Japan Patent Office (JPO), for the same invention,
by the same applicant. The PIM is used to compute the stock of patents:
(9)
(10)
where Zit is the stock of patents in country i, TPFi is the number of triadic patent families,
is the average annual growth rate of patents, and is the depretiation rate set at 15%
(Hall and MacGarvie 2010).
Foreign R&D spillovers are computed using the stock of R&D of the United States,
Japan, Germany, France and the United Kingdom, which are the countries which
contributed most to the stock of total R&D over the period 1996-2005. The share of
imported machinery and equipment is calculated by using data on total imports and
imported machinery and equipment from UN Comtrade, deflated to 2000 prices and
converted using measures of purchasing power parity (PPP) to US$.
Distance between capital cities in kilometers is taken from Gleditsch (2003). For about
50% of our observations we have a balanced panel, while for more than 63% we have 9
out of 10 years, and for almost 70% 8 out of 10 years.6 Table 1 shows the basic
descriptive statistics for all the variables of our analysis.
4. Results
4.1 Frontier Estimates
We report the results of our frontier estimation in Tables 2 and 3, with Table 2 showing
frontier estimates, and Table 3 output elasticities. Estimated elasticities are within the
range of what is found elsewhere in the literature, although we find slightly higher values
for the elasticity of value added with respect to labour than studies using data for earlier
periods (Kneller and Stevens 2006, Liao et al. 2009). For the full sample, the elasticity of
value added with respect to physical capital is 0.201, and that with respect to labour
0.802. While we find evidence for mildly increasing returns to scale for physical capital
and labour concerning OECD countries and Latin America (1.025 and 1.081), returns to
scale are slightly decreasing for Asia (0.938).
The estimated effect of the stock of local R&D on output is strongly positive and
significant at the 1% level for OECD countries (0.233), but only weakly positive and not
6 Table 7 in the Appendix summarizes the number of available sectors by country and by year.

Applied Econometrics and International Development Vol. 14-2 (2014)
32
significant for Asia (0.038). For Latin America, stock of R&D has a negative effect on
output (-0.426), significant at the 10% level.
Table 1: Descriptive Statistics
Total OECD
Q1 Med. Q2 Mean St.Dev. Q1 Med. Q2 Mean St.Dev.
y 6.57 7.98 9.2 7.8 2.06 y 7.01 8.23 9.32 8.17 1.86
k 7.18 8.85 10.3 8.68 2.19 k 8.0 9.24 10.3 9.08 1.85
l 9.43 10.8 12.2 10.7 1.98 l 9.79 11.1 12.2 10.9 1.8
p 27.6 29.2 30.3 28.8 2.08 p 28.8 29.6 30.6 29.8 1.37
r 26.6 27.3 27.8 27.2 0.7 r 27.5 27.8 27.9 27.6 0.59
z 3.4 7.22 8.83 6.38 3.42 z 7.34 8.45 9.38 8.56 1.46
h 2.07 2.23 2.38 2.17 0.31 h 2.23 2.35 2.44 2.35 0.13
Asia Latin America
Q1 Med. Q2 Mean St.Dev. Q1 Med. Q2 Mean St.Dev.
y 7.36 8.53 9.65 8.36 1.83 y 4.63 6.36 7.43 6.07 1.96
k 8.11 9.89 10.9 9.51 1.93 k 5.28 6.5 7.66 6.46 1.87
l 10.4 11.7 12.7 11.5 1.82 l 7.82 9.23 10.3 9.08 1.73
p 27.5 29.5 30.2 29.0 1.94 p 24.5 26.6 26.9 26.2 1.39
r 26.3 26.6 27.3 26.7 0.54 r 26.5 26.7 27.0 26.7 0.32
z 3.59 5.43 8.19 5.86 3.39 z 0.32 1.73 2.41 1.69 1.2
h 1.63 2.08 2.36 1.97 0.43 h 1.96 2.02 2.08 2.03 0.11
Our results for OECD countries are similar to those found by earlier studies. Kneller and
Stevens (2006) obtain slightly lower coefficients for a group of twelve OECD countries
during the period 1973-1990 (0.03-0.09, pp.10). Coe and Helpman (1995) find that for
the seven most advanced OECD countries between 1971 and 1990, the estimated
elasticity of TFP with respect to domestic R&D varies between 0.22 and 0.23, while for
the remaining group of fifteen less advanced OECD countries, the elasticity lies between
0.6 and 1 (pp. 869). Kneller (2005) finds much lower coefficients for a group of twelve
OECD countries over the same period (0.02-0.04, pp. 10), while Griffith et al. (2004)
obtain larger coefficients for the same panel of OECD countries (0.4- 0.6, pp. 889).
However, they use TFP growth instead of TFP as dependent variable, and assess the rate
of return to R&D.
We thus find that local stock of R&D directly affects production in our sample of OECD
countries. For Asia, the weaker and not significant effect suggests that local R&D plays
mainly a role in facilitating the absorption of foreign technology, instead of affecting
output directly.For Latin America, although a negative effect of the stock of local R&D
on output seems to be counter-intuitive at first sight, our results confirm findings by
earlier studies. In a study of 16 Latin American countries between 1996 and 2006,
Castillo et al. (2012) find a negative contribution of R&D expenditure to productivity,
which they attribute to recent changes in the pattern of specialization in the region in
favour of industries with low-value added content that rely less and less on domestic
R&D. Cimoli and Katz (2003) make the same argument, outlining that “dramatic changes
in the sources of technical change” have occurred in Latin America in the 1990s, with “a
rapidly increasing share of external sources emerging at the expense of domestic ones”
(Cimoli and Katz (2003), pp. 390).
Montinari, L., Rochlitz, M. Absorptive Capacity Compared: Evidence From Sectoral Data
33
Table 2: Frontier Estimates – Regression Results
Estimation of equation 2 (page 32) , dependent variable: value added
Total OECD Asia Latin America
k (capital) 0.354***
(0.024)
0.375***
(0.023)
0.360***
(0.079)
-0.142*
(0.085)
l (labour) 0.705*
(0.035)
0.503***
(0.029)
0.962***
(0.112)
1.525***
(0.129)
k2
0.003
(0.003) 0.048***
(0.005)
0.003
(0.006) 0.045***
(0.009) l2
0.013***
(0.003)
0.063***
(0.003)
0.0002
(0.009) -0.030***
(0.012) Lk -0.020***
(0.005)
-0.105***
(0.007)
-0.021
(0.012)
-0.022
(0.018)
p (R&D stock) -0.068
(0.045) 0.233***
(0.064)
0.038
(0.076) -0.426*
(0.070) r (R&D expd.) 0.026
(0.051)
0.045
(0.058)
0.030
(0.093)
0.012
(0.073)
year2
0.0006***
(0.0002)
0.0001
(0.0002) 0.0009*
(0.0005)
-0.0002
(0.0005)
Const -1.150
(0.990) -9.568***
(1.122)
-6.3***
(1.010)
4.965***
(1.034) Log-likelihood -858.355 694.804 -260.021 -106.590
N 3904 1968 1148 788
The level of significance is shown with the following notation: *** 1%, ** 5%, and * 10%;
significant results marked bold.
Table 3: Elasticity of output with respect to labour and capital (at the sample mean)
Labour Physical Capital
Total 0.802 0.201
OECD 0.924 0.101
Asia 0.763 0.175
Latin America 0.845 0.236
While import substitution policies until the 1980s had focused on the building of
domestic knowledge creation, they maintain that today those industries still relying on
domestic R&D are inefficient and lagging behind. Efficient industries are clustered within
the natural resource sectors or are performing assembly operations of imported parts
(’maquiladoras’), relying almost exclusively on foreign R&D and cheap labour. It thus
seems that our results for Latin America reflect recent structural changes on the continent,
and capture the decreasing importance of local R&D.
The estimated effect of foreign R&D spillovers on output is slightly lower than what is
found elsewhere in the literature (for example Coe and Helpman (1995) find an elasticity
of TFP with respect to foreign R&D spillovers of 0.06-0.092, and Kneller and Stevens
(2006) an elasticity of output with respect to foreign R&D of 0.084-0.091). However, for
our sample effects are not significant. This could mean that foreign R&D spillovers
through machinery and equipment imports have only a weak or indirect effect on

Applied Econometrics and International Development Vol. 14-2 (2014)
34
domestic production. As we are only capturing foreign knowledge embodied in R&D
intensive inputs, we leave out other potential channels through which foreign R&D might
affect domestic output directly, such as FDI or licensing.
4.2 Efficiency Levels
Table 4 presents efficiency scores for low-tech and high-tech sectors in each country
group. In general, efficiency scores slightly increase over the time span covered in our
study, with the exception of Latin America, where efficiency in high-tech sectors
experiences a sharp drop after 1999. A temporary drop in high-tech efficiency, albeit less
pronounced, is also noticeable for Asia and OECD countries after 1999. Possibly, the
Asian and Russian financial crises and the burst of the dot-com bubble are responsible for
this drop in high-tech efficiency around the turn of the millennium, with the effect in
Latin America being amplified by the aftermath of recent structural adjustment programs
that made the region more vulnerable to economic shocks.
Table 4: Mean efficiency by country, low- and high-tech sectors Total OECD Asia Latin America
Year l.tech h.tech l.tech h.tech l.tech h.tech l.tech h.tech
1996 0.731 0.764 0.793 0.775 0.767 0.837 0.768 0.810
1997 0.736 0.770 0.802 0.792 0.764 0.835 0.763 0.814
1998 0.737 0.771 0.796 0.803 0.770 0.823 0.773 0.801
1999 0.745 0.785 0.798 0.806 0.779 0.853 0.764 0.786
2000 0.747 0.781 0.813 0.807 0.763 0.839 0.762 0.746
2001 0.727 0.748 0.810 0.765 0.743 0.831 0.732 0.693
2002 0.727 0.744 0.804 0.763 0.756 0.834 0.739 0.671
2003 0.734 0.754 0.810 0.776 0.761 0.843 0.748 0.674
2004 0.746 0.769 0.825 0.795 0.764 0.846 0.814 0.670
2005 0.742 0.781 0.822 0.794 0.763 0.854 0.786 0.762
For the full sample, mean efficiency in low-tech sectors is slightly lower than mean
efficiency in high-tech sectors (Figure 2). However, regional differences are quite
pronounced. While from 1996 to 2000 mean efficiency for low-tech and high-tech sectors
is almost the same in OECD countries, in 2001 efficiency drops notably in high-tech
sectors, which then remain consistently less efficient than low-tech sectors. In Latin
America, high-tech sectors are more efficient than low-tech sectors until 2000, and then
experience a similar, albeit much stronger drop. Finally, in Asia high-tech sectors are
consistently more efficient than low-tech sectors.
Figures 3, 4 and 5 look on the performance of individual countries within our three
regional groups. For OECD countries, a marked drop in high-tech efficiency for France,
the Netherlands, Sweden and Italy is notable from 2000 onwards, with Italy remaining
stuck at a level of high-tech efficiency that is the lowest of all 22 countries in our sample.
On the other hand, the United States, Denmark and Norway significantly improve their
efficiency during the second half of the period observed, while efficiency levels for the
UK, Germany and Belgium remain roughly the same from 1996 to 2005 (see figure 3).

Montinari, L., Rochlitz, M. Absorptive Capacity Compared: Evidence From Sectoral Data
35
Figure 1: Mean efficiency by country group
Figure 2: Mean efficiency by country group, low-tech and high-tech sectors

Applied Econometrics and International Development Vol. 14-2 (2014)
36
Figure 3: Mean efficiency – OECD
What we capture here is probably the divergence in productivity between the US and
some Scandinavian countries on the one hand, and most European OECD countries on
the other hand, which became notable since the late 1990s and is most often attributed to
the better exploitation of ICT-induced productivity gains by the US (Van Ark B., 2003).
Less flexible and more regulated labour markets in Europe might also play a role in this
respect (Bassanini et al. 2009).
In Asia, a group of high performers includes South Korea, Japan, Singapore and the
Philippines, while Indonesia remains at a lower level of technical efficiency. India and
China lie in between, and seem to be fast catching up to the group of high-performers.
India significantly increased its efficiency between 1997 and 2005, especially in high-
tech sectors, where it has become the most efficient of all 22 countries in our sample by
2005. However, despite a 0.1 increase between 1997 and 2005, low-tech sectors are still
very inefficient in the country, so that, with the exception of Mexico, they remain the
most inefficient of all countries in our sample in 2005 (figure 4).
Figure 4: Mean efficiency – Asia
With respect to the debate about the relative importance of technical efficiency
improvements to growth in India (Bhaumik and Kumbhakar 2010, Kim and

Montinari, L., Rochlitz, M. Absorptive Capacity Compared: Evidence From Sectoral Data
37
Saravanakumar 2012), our paper thus finds evidence for an increase in technical
efficiency, especially in high-tech sectors. The marked divide that we find between
efficiency in low- and high-tech sectors also confirms conclusions by earlier studies
(D’Costa 2003), which suggest that the Indian economy is driven forward by some
efficient high-tech industries, especially in the ICT sector, while low-tech industries are
still lagging behind. With respect to China, even though we only have data for 2003-
2005, it looks as if China has successfully managed, within a short time-span, to leave the
group of low performers and join the group of high-efficiency countries.
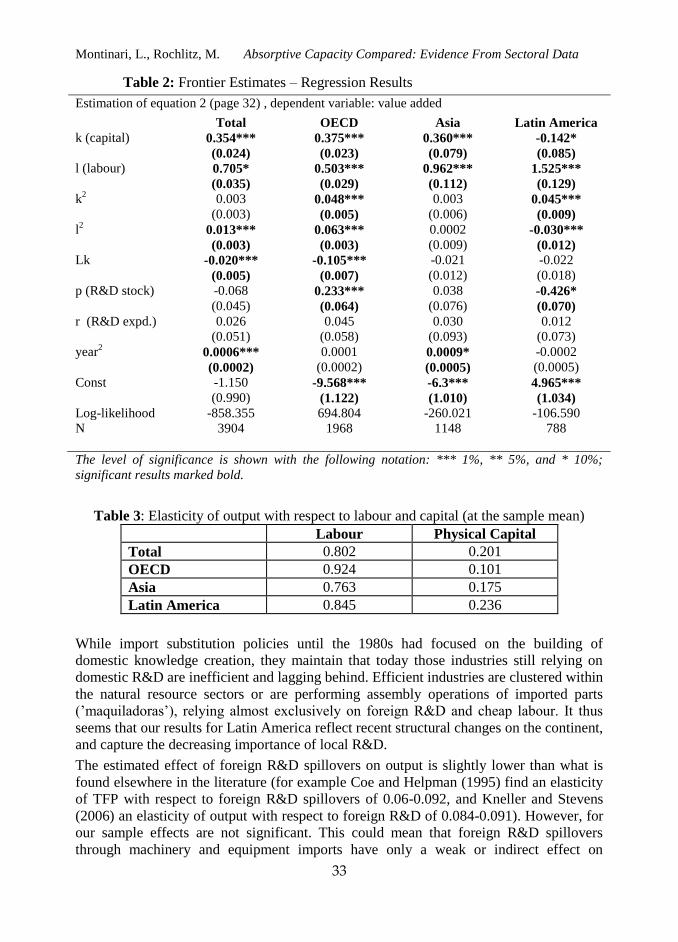
For Latin America, a sharp drop in efficiency for high-tech sectors in Chile, Mexico,
Colombia and Uruguay is notable between 1999 and 2001, followed by a slight recovery
afterwards. After 2000, high-tech sectors are consistently much less efficient in Latin
America than in OECD countries and Asia (figure 5). This drop in efficiency might be a
consequence of the series of financial crises that hit the continent around the year 2000.
Colombia was hit by a crisis in 1998, Brazil in 1999, and Argentina, Ecuador and
Uruguay in 2001, and most countries suffered from a recession for some of the years
between 1999 and 2003 (Rojas-Suarez, 2010). For Colombia and Uruguay, the year of
their respective financial crisis coincides with the drop in efficiency we notice (Figure 9
in the Appendix). Although Chile and Mexico were not directly affected, their drop in
efficiency might be related to close links with the crisis countries. For all four countries,
the drop in efficiency is closely related to negative rates of GDP growth. Chile
experienced negative GDP growth in 1999, preceding the 0.23 drop in high-tech
efficiency we notice for 2000-2001 (Figure 9).
Figure 5: Mean efficiency – Latin America
Mexico had a short recession in 2001 and low GDP growth rates for 2002 and 2003,
corresponding with a 0.15 drop in high-tech efficiency for 2000-2002 (Figure 9). In
Uruguay, GDP per capita decreased in four consecutive years between 1999 and 2002,
and high-tech efficiency by 0.13 points between 2001 and 2004. Finally, Colombia’s
GDP decreased by -4.2% in 1999, and high-tech efficiency by 0.22 points from 1999 to
2000. The fact that efficiency in high-tech sectors decreased notably during this period of
economic turbulence, while low-tech sectors remained remarkably stable, could indicate

Applied Econometrics and International Development Vol. 14-2 (2014)
38
that high-tech sectors in Latin America are more internationally integrated but also more
vulnerable to economic perturbations than low-tech sectors.
4.3 Determinants of Technical Efficiency
Stock of Patents
Table 5 reports the results of our efficiency estimation. We find that an increase in the
stock of patents has a negative and significant effect on technical inefficiency in high-tech
sectors across all country groups. A 1% increase in the stock of patents decreases
inefficiency in high-tech sectors in OECD countries by 0.219%, by 0.14% in Asia and by
0.119% in Latin America.
Table 5: Regression Results – Efficiency Determinants
Estimation of equation 4, dependent variable: technical inefficiency of production
Total OECD Asia Latin America
z (stock of
patents) -0.187***
(0.013)
-0.219***
(0.021)
-0.140***
(0.019)
-0.119*
(0.071)
low-tech*z 0.361***
(0.020)
0.232***
(0.021)
0.317***
(0.020)
0.470***
(0.074)
h (human capital) 0.660***
(0.136)
-0.843***
(0.168)
-1.876***
(0.198)
-0.363
(0.437)
low-tech*h -2.992***
(0.157)
-0.548***
(0.174)
-0.685***
(0.208)
-3.705***
(0.3402)
const. 0.838***
(0.211)
1.722***
(0.354)
1.654***
(0.413)
4.066
(0.935)
sigma squared 0.658***
(0.022)
0.291***
(0.007)
0.558***
(0.029)
0.377***
(0.022)
gamma 0.943***
(0.004)
0.974***
(0.003)
0.912***
(0.009)
0.911***
(0.012)
N 3904 1968 1148 788
The level of significance is shown with the following notation: *** 1%, ** 5%, and * 10%;
significant results marked bold.
Interestingly, this effect changes once we look on low-tech industries. Here, we
consistently find low for OECD countries, with a 1% increase in the stock of patents
leading to a 0.013% increase in inefficiency, in Asia inefficiency increases by 0.177%,
and in Latin America by 0.351% in low-tech sectors for a 1% increase in the stock of
patents.
Our findings differ from those of Kneller and Stevens (2006), who find that R&D “has
only an insignificant effect on inefficiency” (Kneller and Stevens 2006, pp. 19). Using
stock of patents instead of R&D expenditure as a proxy for the effectiveness of domestic
R&D in a stochastic frontier framework reveals a significant effect of domestic R&D on
efficiency, which however fundamentally differs between high-tech and low-tech sectors.
Large parts of the more general literature on the effects of R&D on productivity also find
such a difference between high-tech and low-tech sectors (see Kumbhakar et al. (2011)
for a literature review). While domestic R&D has generally a strong and positive impact
on productivity in high-tech sectors, the impact is low or not significant for low-tech

Montinari, L., Rochlitz, M. Absorptive Capacity Compared: Evidence From Sectoral Data
39
sectors. For instance, using a dataset of top European R&D investors over the period
2000–2005, Kumbhakar et al. (2011) find that R&D in low-tech sectors “has a minor
effect in explaining productivity”, whereas in high-tech sectors the effect of R&D on
productivity is found to be strong and positive. By analyzing a sample of 156 large
Taiwanese firms for the period 1994-2000, Tsai and Wang (2004) find a positive but very
low effect of R&D on productivity for low-tech sectors, whereas the effect was positive
and strong for high-tech sectors.
Our findings are coherent with previous studies in that we also find a substantial
difference between high-tech and low-tech sectors. However, the difference we find is
even larger, since for our sample an increase in the stock of domestic knowledge has a
positive effect on inefficiency for low-tech sectors.
This effect is much stronger in developing countries than in our group of OECD
countries. A possible explanation might be that we use patents as a proxy for
effectiveness of R&D. As patenting activity is higher in high-tech sectors (Brouwer and
Kleinknecht 1999, Lotti and Schivardi 2006), and resources for R&D are scarce, a
crowding-out effect might occur that diverts resources from R&D in low-tech to R&D in
high-tech sectors, due to expected greater returns to R&D in high-tech sectors. As we
have only aggregate data for patents, it is possible that we capture this effect in our
regression. An increase in patenting activity in an environment where resources for R&D
are relatively scarce could thus lead to the negative effect on efficiency in low-tech
sectors that we find. If this interpretation comes close to what is actually happening, it
would suggest that the crowding-out effect is stronger for Latin America than for Asia.
Human Capital
The second determinant of technical efficiency we examine is human capital, measured
by years of schooling (Barro and Lee 2010). We find that an increase in years of
schooling has almost always a strong and significant negative effect on technical
inefficiency, with the effect being stronger for low-tech sectors. For high-tech sectors,
increasing years of schooling by 1% decreases inefficiency by 0.843% in OECD
countries, by 1.876% in Asia, and by 0.363% in Latin America, although results for Latin
America are not significant. In low-tech sectors, a 1% increase in years of schooling
decreases inefficiency by 1.39% in OECD countries, by 2.56% in Asia and by 4.07% in
Latin America.
Our results are in line with those of previous studies. For a group of twelve OECD
countries, Kneller and Stevens (2006) find that a 1% increase in human capital decreases
inefficiency by 1.86%. Their coefficient is slightly higher than ours. As they look on an
earlier period (1973-1990), this could be a sign for marginal decreasing returns of human
capital over time in OECD countries. To our knowledge, there are no previous studies
that use a stochastic frontier framework and specifically look at the effect of human
capital on inefficiency in Asia and Latin America. However, looking at a group of 57
developing countries for the period 1960-2000, Mastromarco (2008) finds that increasing
human capital by 1% decreases inefficiency by 2.33%.
We find that an increase in human capital reduces technical inefficiency more in low-tech
than in high-tech sectors. This could mean that the type of human capital captured by the
years of schooling data provided by Barro and Lee (2010) is more relevant in low-tech

Applied Econometrics and International Development Vol. 14-2 (2014)
40
than in high-tech sectors. While an additional year of schooling has a strong impact on
efficiency in low-tech activities, efficiency improvements in high-tech sectors are mainly
induced by increases in “highly qualified” human capital (e.g. education at a post-
graduate and doctoral level, specialist qualifications, etc.), which are not captured by
Barro and Lee’s data on years of schooling.
Comparing OECD countries and Asia to Latin America reveals further interesting results.
Whereas in the former the effect of schooling on low-tech sectors is only slightly higher
than the effect on high-tech sectors, for Latin America the effect of schooling on
efficiency in low-tech sectors is exceptionally strong, whereas the effect on high-tech
sectors is relatively small and insignificant. This suggests that the quality of human
capital in low-tech sectors is still very low in Latin America.
5. Conclusion
Using a stochastic frontier framework and data for 22 manufacturing sectors, we found
notable differences in technical efficiency between a group of 10 OECD countries, 7
Asian countries and 5 Latin American countries. As the efficiency of a country’s
manufacturing industries is a strong determinant of their capacity to absorb technology
produced abroad, these differences are important to understand differences in growth and
productivity, especially for developing countries which depend to a large extend on
foreign technology.
We examine the effect of two potential determinants of a country’s absorptive capacity:
human capital measured by years of schooling, and the effectiveness of domestic R&D,
proxied by the stock of patents. We find that years of schooling always have a strongly
positive effect on efficiency, especially in low-tech sectors and for developing countries.
The stock of patents positively affects efficiency in high-tech sectors, but has a
consistently negative effect on efficiency in low-tech sectors, especially for Asia and
Latin America.
To our knowledge, this is the first study using a stochastic frontier approach and sectoral
data not only for OECD countries, but also for two groups of emerging economies. Using
sectoral data permits us to disaggregate the efficiency effect of schooling and stock of
patents between low-tech and high-tech sectors. However, as in many developing
countries sectoral data has only been made available recently, and is not yet available to a
sufficient extend for human capital, stock of R&D and patents, there is a lot of scope for
future work once better data becomes available.
References
Abramovitz M. (1986), Catching Up, Forging Ahead, and Falling Behind, The Journal of
Economic History, 46(2), 385-406
Acemoglu D., Aghion P., Zilibotti F. (2006), Distance to Frontier, Selection, and
Economic Growth, Journal of the European Economic Association, 4(1), 37-74
Aghion P., Howitt P. (2005), Growth With Quality-Improving Innovations: an Integrated
Framework, in Aghion P., Durlauf S. (eds.), Handbook of Economic Growth, 1(1), 68-97
Amsden A. (1989), Asia’s Next Giant: South Korea and Late Industrialization, Oxford
University Press, Oxford

Montinari, L., Rochlitz, M. Absorptive Capacity Compared: Evidence From Sectoral Data
41
Barro R., Lee J. (2010), A New Data Set of Educational Attainment in the World, 1950-
2010, NBER Working Paper No. 15902
Bassanini A., Nunziata L., Venn D. (2009), Job Protection Legislation and Productivity
Growth in OECD Countries, Economic Policy, 24(58), 349-402
Battese G., Coelli T. (1995), A Model for Technical Efficiency Effects in a Stochastic
Frontier Production Function For Panel Data, Empirical Economics, 20(2), 325-332
Benhabib J., Spiegel M. (1994), The Role of Human Capital in Economic Development:
Evidence from Aggregate Cross-Country Data, Journal of Monetary Economics, 34(2),
143-173
Benhabib J., Spiegel M. (2005), Human Capital and Technology Diffusion, in Aghion P.,
Durlauf S. (eds.), Handbook of Economic Growth, 1(1), 935-966
Bhaumik S., Kumbhakar S. (2010), Is the Post-Reform Growth of the Indian
Manufacturing Sector Efficiency Driven? Empirical Evidence from Plant-Level Data,
Journal of Asian Economics, 21(2), 219-232
Breznitz D., Murphree M. (2011), Run of the Red Queen: Government, Innovation,
Globalization, and Economic Growth in China, Yale University Press, New Haven
Brouwera, E., Kleinknecht, A. (1999), Innovative Output, and a Firm’s Propensity to
Patent: An Exploration of CIS Micro Data, Research Policy, 28(6), 615–624
Caselli F., Wilson D. (2004), Importing Technology, Journal of Monetary
Economics,51,1-32
Castillo L., Salem D., Guasch J. (2012), Innovative and Absorptive Capacity of
International Knowledge, Policy Research Working Paper No. 5931, The World Bank,
Washington
Cimoli M., Katz J. (2003), Structural Reforms, Technological Gaps and Economic
Development: a Latin American Perspective, Industrial and Corporate
Change,12(2),387-411
Coe D., Helpman E. (1995), International R&D Spillovers, European Economic Review,
39(5), 859-887
Cohen W., Levinthal D. (1989), Innovation and Learning: The Two Faces of R&D,
Economic Journal, 99(397), 569-596
D’Costa A. (2003), Uneven and Combined Development: Understanding India’s
Software Exports, World Development, 31(1), 211-226
Eaton J., Kortum S.(2001),Trade in Capital Goods,European Economic Review,45,1195-
1235
Fagerberg J. (1994), Technology and International Differences in Growth Rates, Journal
of Economic Literature, 32(3), 1147-1175
Gerschenkron A. (1962), Economic Backwardness in Historical Perspective: A Book of
Essays, Harvard University Press, Cambridge, MA
Gleditsch, K. (2003), Distance between Capital Cities Data, version 4 June 2003,
available at http://privatewww.essex.ac.uk/~ksg/data-5.html, accessed on November 15th,
2011

Applied Econometrics and International Development Vol. 14-2 (2014)
42
Griffith R., Redding S., Van Reenen (2003), R&D and Absorptive Capacity: Theory and
Empirical Evidence, Scandinavian Journal of Economics, 105(1), 99-118
Griffith R., Redding S., Van Reenen J. (2004), Mapping the Two Faces of R&D:
Productivity Growth in a Panel of OECD Industries, Review of Economics and Statistics,
86(4), 883-895
Griliches, Z. (1984), Market Value, R&D, and Patents, NBER Chapters, in Griliches Z.
(ed.), R&D, Patents and Productivity, NBER and Chicago University Press, Chicago
Griliches Z., Lichtenberg F. (1984), R&D and Productivity Growth at the Industry Level:
is There Still a Relationship?, in Griliches Z. (ed.), R&D, Patents and Productivity,
NBER and Chicago University Press, Chicago
Hall B., MacGarvie M. (2010), The Private Value of Software Patents, Research Policy,
39(7), 994-1009
Henry M., Kneller R., Milner C. (2009), Trade, Technology Transfer and National
Efficiency in Developing Countries, European Economic Review, 53(2), 237-254
Iyer K. (2011), Technology Gap, Catching-Up and Outward Orientation: Analysis of 63
Countries, Applied Econometrics and Development, 11(2),
Kim S., Saravanakumar M. (2012), Economic Reform and Total Factor Productivity
Growth in Indian Manufacturing Industries, Review of Development Economics, 16(1),
152-166
Kneller R. (2005), Frontier Technology, Absorptive Capacity and Distance, Oxford
Bulletin of Economics and Statistics, 67(1), 1-24
Kneller R., Stevens P. (2003), The Specification of the Aggregate Production Function in
the Presence of Inefficiency, Economic Letters, 81(2), 223-226
Kneller R., Stevens P. (2006), Frontier Technology and Absorptive Capacity: Evidence
from OECD Manufacturing Industries, Oxford Bulletin of Economics and Statistics,
68(1), 1-21
Koop G., Osiewalski J., Steel M. (1999), The Components of Output Growth: A
Stochastic Frontier Analysis, Oxford Bulletin of Economics and Statistics, 61(4), 455-487
Koop G., Osiewalski J., Steel M. (2000), Modelling the Sources of Output Growth in a
Panel of Countries, Journal of Business and Economic Studies, 18(3), 284-289
Kumbhakar S., Ortega-Argiles R., Potters L., Vivarelli M., Voigt P. (2011), Corporate
R&D and Firm Efficiency: Evidence from Europe’s Top R&D Investors, Journal of
Productivity Analysis, forthcoming
Lall S., Pietrobelli C. (2002), Failing to Compete: Technology Development and
Technology Systems in Africa, Edward Elgar, Cheltenham
Liao H., Liu X., Holmes M., Weyman-Jones T. (2009), The Impact of Foreign R&D on
Total Factor Productivity in the East Asian Manufacturing Industry, The Manchester
School, 77(2), 244-270
Lotti, F., Schivardi, F. (2005), Cross Country Differences in Patent Propensity: A Firm-
Level Investigation, Giornale degli Economisti e Annali di Economia, 64 (4), 469-502
Madden G., Savage S., Bloxham P. (2001), Asian and OECD International R&D
Spillovers, Applied Economic Letters, 8(7), 431-435

Montinari, L., Rochlitz, M. Absorptive Capacity Compared: Evidence From Sectoral Data
43
Madsen J., Islam R., Ang J. (2010), Catching Up to the Technology Frontier: The
Dichotomy Between Innovation and Imitation, Canadian Journal of Economics, 43(4),
1389-1411
Mastromarco C. (2008), Foreign Capital and Efficiency in Developing Countries, Bulletin
of Economic Research, 60(4), 351-374
Miller S., Upadhyay M. (2000), The Effects of Openess, Trade Orientation, and Human
Capital on Total Factor Productivity, Journal of Development Economics, 63(2), 399-423
Nelson R., Phelps E. (1966), Investment in Humans, Technological Diffusion, and
Economic Growth, American Economic Review, 56(1/2), 69-75
Okabe M. (2002), International R&D Spillovers and Trade Expansion: Evidence from
East Asian Economies, Asian Economic Bulletin, 19(2), 141-154
Prescott E. (1998), Needed: A Theory of Total Factor Productivity, International
Economic Review, 39(3), 525-551
Rojas-Suarez L. (2010), The International Financial Crisis: Eight Lessons for and from
Latin America, Working Paper No. 202, Center for Global Development, Washington
Senhadji A. (2000), Sources of Economic Growth: An Extensive Growth Accounting
Exercise, IMF Staff Papers, 47(1), 129-158
Tsai K., Wang J. (2004), R&D Productivity and the Spillover Effects of High-Tech
Industry on the Traditional Manufacturing Sector: The Case of Taiwan, World Economy,
27(10), 1555-1570
Van Ark B., Inklaar R., McGuckin R. (2003), ’Changing Gear’: Productivity, ICT and
Service Industries in Europe and the United States, in Christensen J., Maskell P. (eds.),
The Industrial Dynamics of the New Digital Economy, Edward Elgar, Cheltenham
Verspagen B. (1991), A New Empirical Approach to Catching Up or Falling Behind,
Structural Change and Economic Dynamics, 2(2), 359-380
Wade R. (1990), Governing the Market: Economic Theory and the Role of Government
in East Asian Industrialization, Princeton University Press, Princeton
Wang Y. (2007), Trade, Human Capital, and Technology Spillovers: An Industry-Level
Analysis, Review of International Economics, 15(2), 269-283
Annex on line at the journal Website: http://www.usc.es/economet/aeid.htm
Annex
Table 6: Sector classifications (ISIC Rev. 3)
15 Food and beverages low-tech
16 Tobacco products low-tech
17 Textiles low-tech
18 Wearing apparel low-tech
19 Leather, leather products and footwear low-tech
20 Wood products (excl. furniture) low-tech
21 Paper and paper products low-tech
22 Printing and publishing low-tech
23 Coke, refined petroleum products, nuclear fuel low-tech

Applied Econometrics and International Development Vol. 14-2 (2014)
44
24 Chemicals and chemical products high-tech
25 Rubber and plastics products low-tech
26 Non-metallic mineral products low-tech
27 Basic metals low-tech
28 Fabricated metal products low-tech
29 Machinery and equipment n.e.c. high-tech
30 Office, accounting and computing machinery high-tech
31 Electrical machinery and apparatus high-tech
32 Radio, television and communication equipment high-tech
33 Medical, precision and optical instruments high-tech
34 Motor vehicles, trailers, semi-trailers high-tech
35 Other transport equipment high-tech
36 Furniture, manufacturing n.e.c. low-tech
Table 7: Number of available sectors by country and year
Year ‘96 ‘97 ‘98 ‘99 ‘00 ‘01 ‘02 ‘03 ‘04 ‘05 Total
Belgium 22 22 22 22 22 22 22 154
Bolivia 18 18 18 54
Chile 18 18 18 16 16 19 19 19 19 162
China 22 22 22 66
Columbia 18 18 18 18 21 20 20 20 20 20 193
Germany 18 22 22 22 22 22 22 150
Denmark 22 22 22 22 20 20 20 19 19 19 205
France 21 21 21 21 21 21 21 21 21 21 210
Indonesia 22 22 22 22 22 22 132
India 18 18 22 22 22 22 22 22 22 22 212
Italy 22 22 22 22 22 22 22 21 21 21 217
Japan 22 22 22 22 22 22 22 22 22 22 220
S. Korea 22 22 22 22 22 22 22 22 22 22 220
Mexico 22 22 22 22 22 22 22 21 175
Netherlands 22 22 22 22 22 21 21 21 21 21 215
Norway 21 22 22 21 21 21 21 22 21 192
Philippines 22 22 22 22 88
Sweden 21 21 21 21 21 21 21 21 21 189
Singapore 21 21 21 21 21 21 21 21 21 21 210
United Kingdom 22 22 22 22 22 22 22 22 22 22 220
United States 18 22 22 22 22 22 22 22 22 22 216
Uruguay 18 22 21 21 21 21 21 21 21 21 204
Total 304 350 358 378 404 405 427 446 426 406 3904
Figure 6: Efficiency – Descriptive Statistics

Montinari, L., Rochlitz, M. Absorptive Capacity Compared: Evidence From Sectoral Data
45
Figure 7: Mean efficiency by country – OECD

Applied Econometrics and International Development Vol. 14-2 (2014)
46
Figure 8: Mean efficiency by country – Asia
Montinari, L., Rochlitz, M. Absorptive Capacity Compared: Evidence From Sectoral Data
47
Figure 9: Mean efficiency by country – Latin America
Journal published by the EAAEDS: http://www.usc.es/economet/eaat.htm