Embed Size (px)
Citation preview

ELSEVIER Earth and Planetary Science Letters 161 (1998) 19–32
Absolute paleointensity from Hawaiian lavas younger than 35 ka
Jean-Pierre Valet a,Ł, Emmanuel Tric b, Emilio Herrero-Bervera c, Laure Meynadier a,John P. Lockwood d
a Institut de Physique du Globe de Paris (IPGP), Laboratoire de Paleomagnetisme (UMR CNRS 7577), 4 Place Jussieu,75252 Paris Cedex 05, France
b Laboratoire d’Informatique pour la Mecanique et les Sciences de l’Ingenieur, Bat. 508 Universite Paris XI, 91403 Orsay Cedex, Francec Hawaii Institute of Geophysics and Planetology, University of Hawaii, 2525 Correa Road, 96822 Hawaii, USA
d U.S. Geological Survey, Hawaiian volcano Observatory, Hawaii, USA
Received 18 July 1997; revised version received 13 February 1998; accepted 12 June 1998
Abstract
Paleointensity studies have been conducted in air and in argon atmosphere on nine lava flows with radiocarbonages distributed between 3.3 and 28.2 ka from the Mauna Loa volcano in the big island of Hawaii. Determinationsof paleointensity obtained at eight sites depict the same overall pattern as the previous results for the same period inHawaii, although the overall average field intensity appears to be lower. Since the present results were determined athigher temperatures than in the previous studies, this discrepancy raises questions regarding the selection of low versushigh-temperature segments that are usually made for absolute paleointensity. The virtual dipole moments are similar tothose displayed by the worldwide data set obtained from dated lava flows. When averaged within finite time intervals, theworldwide values match nicely the variations of the Sint-200 synthetic record of relative paleointensity and confirm theoverall decrease of the dipole field intensity during most of this period. The convergence between the existing records atHawaii and the rest of the world does not favour the presence of persistent strong non-dipole components beneath Hawaiifor this period. 1998 Elsevier Science B.V. All rights reserved.
Keywords: paleomagnetism; absolute age; Mauna Loa; Hawaii
1. Introduction
There has been growing interest during the past10 years to document the variations of the geo-magnetic field intensity. The scarcity of well datedrecords of absolute paleointensity from volcanic se-quences for the period between 10 and 40 ka [1–10]is still in contrast with the continuous character ofthe records of relative paleointensity obtained from
Ł Corresponding author. E-mail: [email protected]
sediments. The global synthetic curve [11] derivedfrom 17 records of relative paleointensity documentsan almost uniform decrease of the dipole from 10ka back to 40 ka. Absolute values from well datedlava flows are needed to improve the calibration ofrelative paleointensities and possibly to analyze thecontribution of short-term non-dipole componentsthat have been smoothed out by sediments. It is alsonecessary to investigate whether apparent discrepan-cies between distinct records result from artefacts orfrom geomagnetic effects.
0012-821X/98/$19.00 1998 Elsevier Science B.V. All rights reserved.PII S 0 0 1 2 - 8 2 1 X ( 9 8 ) 0 0 1 3 3 - 2
20 J.-P. Valet et al. / Earth and Planetary Science Letters 161 (1998) 19–32
Studies of absolute paleointensity from theHawaiian islands are useful to meet these goalsbut also to document further the possible existenceof significant non-dipole sources in the middle ofthe Pacific. The study performed by Mankinen andChampion [1] indicates that they were present duringthe past 50 ka but virtually absent between 12 ka and5 ka B.P. In contrast, the records of absolute paleoin-tensity published [2] from cores SOH-4 and HSDP[12] drilled on the Big Island of Hawaii have beeninterpreted as reflecting the long-term presence ofsignificant fluctuating non-dipole terms back to peri-ods as old as 400 ka. One particular aspect of theselast two studies is that they have been obtained fromdrilled cores. It was thus interesting to document fur-ther these observations by studying additional wellexposed dated lava flows from the same area on theBig Island of Hawaii. As a first step this study wasfocused on the period younger than 35 ka.
2. Sampling
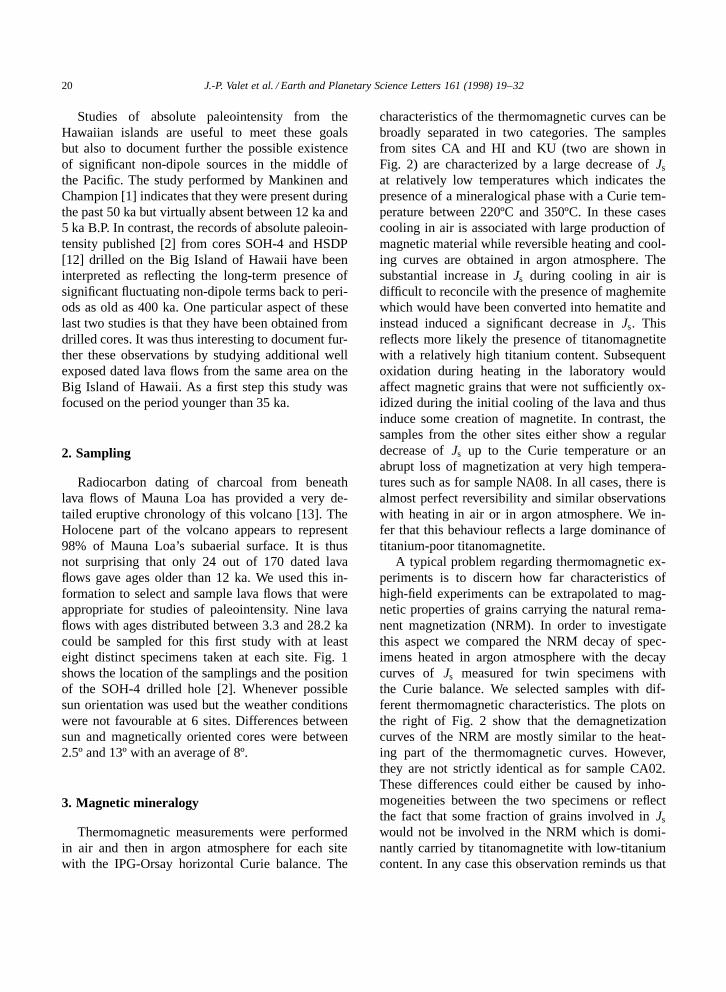
Radiocarbon dating of charcoal from beneathlava flows of Mauna Loa has provided a very de-tailed eruptive chronology of this volcano [13]. TheHolocene part of the volcano appears to represent98% of Mauna Loa’s subaerial surface. It is thusnot surprising that only 24 out of 170 dated lavaflows gave ages older than 12 ka. We used this in-formation to select and sample lava flows that wereappropriate for studies of paleointensity. Nine lavaflows with ages distributed between 3.3 and 28.2 kacould be sampled for this first study with at leasteight distinct specimens taken at each site. Fig. 1shows the location of the samplings and the positionof the SOH-4 drilled hole [2]. Whenever possiblesun orientation was used but the weather conditionswere not favourable at 6 sites. Differences betweensun and magnetically oriented cores were between2.5º and 13º with an average of 8º.
3. Magnetic mineralogy
Thermomagnetic measurements were performedin air and then in argon atmosphere for each sitewith the IPG-Orsay horizontal Curie balance. The
characteristics of the thermomagnetic curves can bebroadly separated in two categories. The samplesfrom sites CA and HI and KU (two are shown inFig. 2) are characterized by a large decrease of Js
at relatively low temperatures which indicates thepresence of a mineralogical phase with a Curie tem-perature between 220ºC and 350ºC. In these casescooling in air is associated with large production ofmagnetic material while reversible heating and cool-ing curves are obtained in argon atmosphere. Thesubstantial increase in Js during cooling in air isdifficult to reconcile with the presence of maghemitewhich would have been converted into hematite andinstead induced a significant decrease in Js. Thisreflects more likely the presence of titanomagnetitewith a relatively high titanium content. Subsequentoxidation during heating in the laboratory wouldaffect magnetic grains that were not sufficiently ox-idized during the initial cooling of the lava and thusinduce some creation of magnetite. In contrast, thesamples from the other sites either show a regulardecrease of Js up to the Curie temperature or anabrupt loss of magnetization at very high tempera-tures such as for sample NA08. In all cases, there isalmost perfect reversibility and similar observationswith heating in air or in argon atmosphere. We in-fer that this behaviour reflects a large dominance oftitanium-poor titanomagnetite.
A typical problem regarding thermomagnetic ex-periments is to discern how far characteristics ofhigh-field experiments can be extrapolated to mag-netic properties of grains carrying the natural rema-nent magnetization (NRM). In order to investigatethis aspect we compared the NRM decay of spec-imens heated in argon atmosphere with the decaycurves of Js measured for twin specimens withthe Curie balance. We selected samples with dif-ferent thermomagnetic characteristics. The plots onthe right of Fig. 2 show that the demagnetizationcurves of the NRM are mostly similar to the heat-ing part of the thermomagnetic curves. However,they are not strictly identical as for sample CA02.These differences could either be caused by inho-mogeneities between the two specimens or reflectthe fact that some fraction of grains involved in Js
would not be involved in the NRM which is domi-nantly carried by titanomagnetite with low-titaniumcontent. In any case this observation reminds us that
J.-P. Valet et al. / Earth and Planetary Science Letters 161 (1998) 19–32 21
Fig. 1. Schematic map of the big island of Hawaii showing the location of the sections.

22 J.-P. Valet et al. / Earth and Planetary Science Letters 161 (1998) 19–32
Fig. 2. Typical thermomagnetic experiments performed on samples from three sites heated in air and in argon atmosphere. Reversibleheating (in black) and cooling curves are observed in argon atmosphere. The thermomagnetic characteristics are compared with theevolution of the NRM during thermal demagnetization on the right.
J.-P. Valet et al. / Earth and Planetary Science Letters 161 (1998) 19–32 23
selecting samples for paleointensity experiments byreferring to their thermomagnetic characteristics isquite delicate.
4. Paleointensity experiments
4.1. Modification to the Coe–Thellier’s procedure
The measurements of paleointensity were per-formed in the shielded room of the paleomagneticlaboratory of IPGP. The oven used for this purposeis characterized by accurate control of temperatureprovided by three thermocouples located within thesample holder. A field of 20 µT was applied dur-ing heating and cooling to induce TRMs (the fieldgradient does not exceed 0.2 µT). Two differentsets of experiments have been conducted, one byheating and cooling in air, the second one by heat-ing in argon and cooling in nitrogen atmosphere.A total of 68 samples (38 heated in air and 30 inargon atmosphere) have been subjected to paleoin-tensity experiments by using a revised version of theThellier–Coe technique [14]. The usual procedurerelies on demagnetization of the NRM first (by heat-ing in zero field) and then acquisition of partial ther-moremanence (pTRM). A drawback inherent to thisapproach is that creation of chemical magnetization(CRM) with unblocking temperatures higher than thelast heating step is difficult to be detected becausethe corresponding magnetic grains were randomlyreoriented in zero field during demagnetization ofthe NRM. In contrast, the advantage of inducing apTRM first is that those grains are realigned in thedirection of the laboratory field. After subsequentdemagnetization in zero field to extract the NRM,the spurious component of magnetization is thusdetected by a kink of the vector towards the direc-tion of the laboratory field in the demagnetizationdiagrams. Another advantage is that pTRM checksperformed at steps Ti�1 are performed directly byreheating in presence of the field instead of heatingin zero field the previous TRM imparted at step Ti
between ambient temperature and Ti�1. In fact, thisapproach was described first by Aitken et al. [15] andadds to the advantages of the Thellier–Thellier andCoe procedures. In order to document at best mag-netomineralogical changes caused by heating, the
pTRM checks have been performed systematicallyat each temperature, one step down the last heatingstep.
4.2. Demagnetization of the NRM
Thermal demagnetization of the NRM was inte-grated within the procedure for paleointensity exper-iments. Typical demagnetization diagrams obtainedfrom twin (or from adjacent) samples heated in airand in argon can be compared in Fig. 3. Overall,better results have been obtained by heating in argonas acquisition of CRM was observed for 23% ofthe specimens in air and 13% in argon. This statis-tics include the 6 samples from site WA (3 in air,3 in argon) that were rejected for this reason. Theother samples did not show any striking differencebetween the two procedures. In most cases, a verysoft component was removed above 150ºC and in afew cases a harder component persisted up to 300–350ºC. Above 350ºC a univectorial component de-creased linearly towards the origin. Since none of thesampled flows was overlain by other units no sam-ple was affected by reheating and other subsequentprocesses. The characteristic component of magne-tization (ChRM) was calculated by fitting a straightline through the origin of the demagnetization di-agrams [16]. The results summarized in Table 1show that the mean declinations are comprised be-tween 335º and 18º with a dominant tendency forwestward declinations. The inclinations comprisedbetween 25º and 45º (the axial dipole inclination atthe site is 35.5º) are within the variability expectedfrom the paleosecular variation.
One sample per site has been stepwise demagne-tized by alternating field (AF). The demagnetizationdiagrams shown on the right of Fig. 3 confirm theprevious observations. In many cases a soft com-ponent, which corresponds more or less with thelow-temperature component, is removed after 10mT and is thus likely associated with multidomaingrains. The characteristic component is in most casesisolated after 20 mT.
4.3. Paleointensity
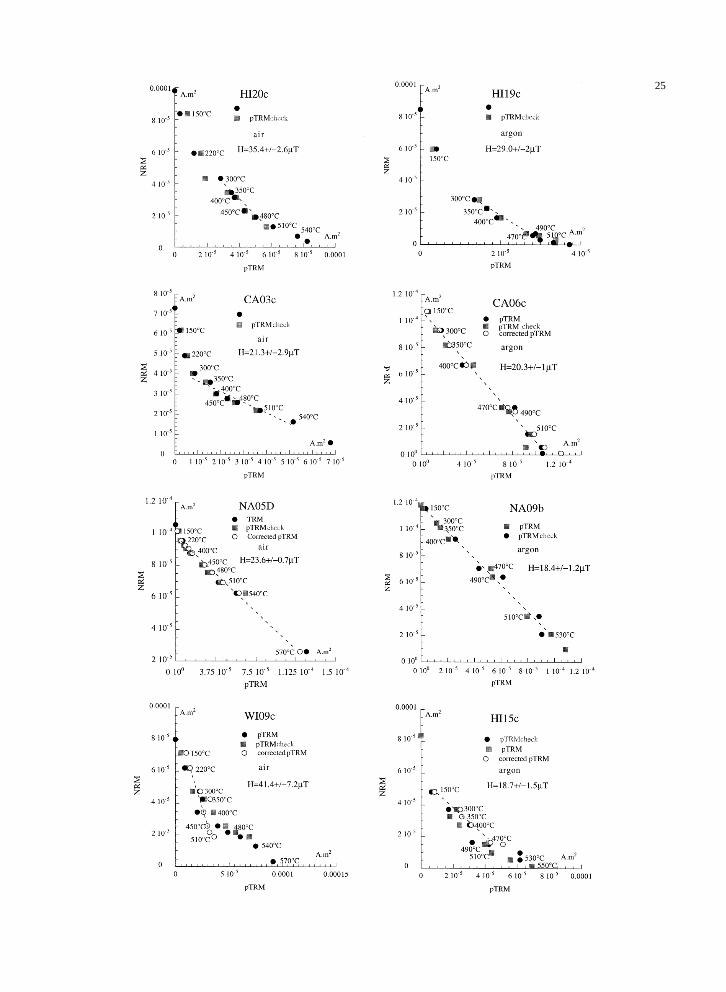
Fig. 4 shows NRM–TRM diagrams reflecting typ-ical paleointensity experiments on samples heated in

24 J.-P. Valet et al. / Earth and Planetary Science Letters 161 (1998) 19–32
Fig. 3. Typical demagnetization diagrams of samples heated in zero field in air and in argon atmosphere. The occasional presenceof magnetization components with unblocking temperatures as high as 250–350ºC prevents determinations of absolute paleointensityin the low temperature range. Demagnetization diagrams by alternating fields (all at the same steps) are shown on the right.
Fig. 4. NRM–TRM diagrams. Black dots represent the NRM-TRM points. The pTRM checks performed after every step are shown byshaded squares. In the lower two diagrams the final paleointensity has been calculated from corrected data (opened squares) [18].
J.-P. Valet et al. / Earth and Planetary Science Letters 161 (1998) 19–32 25

26 J.-P. Valet et al. / Earth and Planetary Science Letters 161 (1998) 19–32
Table 1Paleodirections at each site
Site Age (ka) n=N D I α95 k Polarity
CA 10.20 š 0.04 6=6 334.6 39.2 7.4 83.4 NHI (01–08) and (19–26) 3.35 š 0.03 10=11 355.2 40.6 6.5 56.8 NHI (09–18) 28.14 š 0.33 5=5 339.1 26.5 10.1 58.5 NHO 10.89 š 0.03 6=6 343.8 30.2 3.3 414 NKU 8.36 5=5 355.8 25.6 4.9 247 NNA 16.39 š 0.08 7=7 18.8 44.7 5.7 112 NPI 14.13 6=7 340.5 30.9 4.4 234 NWI 4.12 6=6 348.1 40.2 6.3 115 N
n=N gives the number of samples used to calculate the final direction and the total number of samples measured; D, I , are the averagedvalues of the declination and inclination; α95, is the 95% confidence cone about the average direction; k, is the precision parameter ofFisher
air (right column) and in argon. The paleointensitydeterminations were obtained from the slope of theArai diagrams [17] which gives the ratio betweenthe paleofield and the laboratory field. Special carewas taken to interpret the Arai diagrams within thesame range of temperatures as for the ChRM. Thisrules out any component of magnetization for tem-peratures lower than 300ºC unless a clear and uniqueslope would be present. Note that in most casesthere is a significant change in slope between lowand high temperatures which reflects magnetizationcomponents dominantly carried by multidomain andmonodomain grains respectively. A total of 35 out of69 samples (18 heated in air and 17 in argon) yieldedstraightforward paleointensity determinations. All 6samples from site WA were affected by lightning and20 samples from the other sites were unsuitable forany determination because they were associated withCRM acquisition (12 samples) as reflected by theevolution of the NRM or affected by lightning. Theeight remaining samples (2 heated in air) charac-terized by non-linear Arai diagrams and=or negativepTRM checks could not be used for direct determina-tion of paleointensity. However, since pTRM checkswere performed systematically at every temperaturestep, we could apply the technique of corrections[18] based on the hypothesis that the loss (or gain)of TRM induced by mineralogical transformationscorresponds with the deviation between the pTRMcheck and the initial TRM. In fact, the correctionswere applied first as a routine to all the samples.Obviously, samples with positive pTRM checks arecharacterized by the same TRM values before and
after correction and in these cases only the uncor-rected values were taken into consideration. It mustalso be clear that the corrections were applied at alltemperature steps and were not restrained to a giveninterval. In some cases (e.g. CA06c and NA05d)corrections applied to samples with a few negativepTRM checks can yield the same slope as withoutcorrections. This is simply because the successivedeviations in TRMs compensate each other. Typ-ical NRM–TRM plots with corrected pTRMs areshown in the two diagrams at the bottom of Fig. 4.The corrections restored linear plots for each of theeight samples. The corrected samples are relativelywell distributed among the different sites and donot reach more than 50% of the specimens per site(30% on the average). This allows us to compare thedeterminations obtained after correction with the de-terminations of the uncorrected samples at each site.The purpose of this comparison is not to excludecorrected samples with marginal paleointensity esti-mates, but to provide an ultimate check of the overallreliability of the corrected results. The dispersionbetween corrected and uncorrected results is typi-cally the same as in any study that does not includecorrections.
Finally, paleointensity estimates have thus beenobtained for a total of 43 samples and the resultsare summarized in Table 2 with the usual param-eters accompanying the interpretation of the Araidiagrams. All sites incorporate specimens that havebeen treated by the two techniques (air or argon). Fi-nally, an average paleointensity has been calculatedfor the 8 distinct flows retained in this study by using

J.-P. Valet et al. / Earth and Planetary Science Letters 161 (1998) 19–32 27
Table 2Results of absolute paleointensity in air and in argon. The results with an asterisk have been obtained after correction [17].
Sample Atmosphere Hl N 1T f g q w Ha š ¦Ha Fa š SD VADM VDM(µT) (ºC) (µT) (µT) (1022 A m2) (1022 A m2)
CA03c air 42.8 7 300–540 0.48 0.77 2.72 1.36 21.3 š 2.9 21.3 š 2.9CA02d argon 20.0 5 150–470 0.11 0.46 0.15 0.90 19.0 š 6.6CA03b argon 20.0 5 300–490 0.45 0.72 3.63 2.09 22.6 š 2.0CA06b argon 20.0 7 150–510 1.00 0.83 16.9 6.38 20.3 š 1.0CA08b argon 20.0 6 150–490 0.75 0.73 6.19 3.10 17.3 š 1.5 19.9 š 1.9 4.5 š 0.4 4.4 š 0.4
HI01c air 42.0 5 120–400 0.79 0.44 2.99 1.72 43.0 š 5.0HI01d air 42.0 5 120–400 0.86 0.56 3.39 1.70 34.9 š 4.9HI20c air 42.4 7 300–540 0.50 0.77 5.27 2.63 35.4 š 2.6HI22c air 42.4 7 300–540 0.58 0.79 6.69 1.85 33.0 š 4.1HI26c air 42.4 7 300–540 0.41 0.78 2.14 1.07 33.7 š 5.0 36.1 š 0.6HI08d* argon 20.0 4 300–470 0.53 0.68 1.34 0.77 39.3 š 10.5HI19c argon 20.0 6 300–510 0.54 0.73 5.81 2.90 29.0 š 2.0HI21b argon 20.0 6 150–490 0.77 0.70 4.88 2.44 39.5 š 4.4 34.5 š 4.9 8.0 š 0.9 7.6 š 0.9
HI15d air 42.6 9 220–570 0.29 0.54 1.33 0.66 20.2 š 2.4 20.2 š 2.4HI15c* argon 20.0 5 150–470 0.56 0.71 4.92 2.84 18.7 š 1.5HI16b argon 20.0 5 150–470 0.54 0.69 1.53 0.88 16.8 š 4.1HI16c* argon 20.0 4 300–470 0.33 0.66 0.69 0.49 22.0 š 7.0HI17b argon 20.0 4 150–400 0.36 0.54 0.87 0.62 20.3 š 4.5 18.9 š 1.9 4.3 š 0.4 4.6 š 0.4
Ho02c air 42.7 6 400–570 0.68 0.77 13.8 6.89 22.2 š 0.9 22.2 š 0.9Ho03b argon 20.0 4 300–470 0.41 0.61 3.22 2.28 23.3 š 1.8Ho04c argon 20.0 6 150–490 0.70 0.70 9.16 5.29 18.6 š 1.0Ho06c argon 20.0 5 150–470 0.71 0.67 3.87 2.24 18.3 š 2.3 19.6 š 2.3 4.6 š 0.5 4.8 š 0.5
KU01c air 42.9 7 220–510 0.43 0.75 2.48 1.11 29.8 š 3.9KU04c air 42.9 5 220–450 0.48 0.66 3.02 1.51 24.3 š 2.6 26.7 š 2.7KU03* argon 20.0 5 350–510 0.49 0.61 3.74 2.16 39.2 š 3.1KU06* argon 20.0 5 300–490 0.46 0.61 0.75 0.43 26.3 š 5.3 32.3 š 6.4 7.1 š 1.3 7.6 š 1.4
NA01c air 42.8 5 450–570 0.63 0.64 5.82 3.36 27.3 š 1.9NA04c air 42.8 5 400–540 0.46 0.61 21.8 12.6 22.8 š 0.3NA05d air 42.9 5 450–570 0.58 0.51 10.2 5.89 23.6 š 0.7NA06c air 42.9 5 450–570 0.60 0.70 8.12 4.69 21.8 š 1.1NA07c air 42.8 6 400–570 0.80 0.72 11.2 5.59 28.5 š 1.5NA08c air 42.9 8 300–570 0.73 0.72 6.47 2.64 23.5 š 1.9 24.2 š 2.4NA09b argon 20.0 6 150–490 0.45 0.72 5.04 2.52 18.4 š 1.2 18.4 š 1,2 5.4 š 0.7 4.8 š 0.6
PI06c* air 42.8 4 220–400 0.38 0.49 0.55 0.32 20.0 š 6.7 20.0 š 6.7PI03b argon 20.0 5 150–470 0.65 0.63 2.49 1.44 22.3 š 3.6PI04b argon 20.0 5 150–470 0.64 0.64 2.77 1.60 24.2 š 3.6PI06b* argon 20.0 6 150–490 0.58 0.65 3.39 1.69 15.2 š 1.7 20.4 š 3.8 4.6 š 0.7 4.7 š 0.7
WI01c air 42.0 8 220–540 0.73 0.83 3.84 1.57 45.7 š 7.2WI05c air 42.0 4 400–510 0.42 0.64 2.74 1.94 58.2 š 5.7WI09c* air 42.0 5 220–450 0.50 0.71 2.15 1.24 41.4 š 7.2 46.7 š 7.1WI01b argon 20.0 5 350–510 0.31 0.55 1.91 1.35 52.8 š 4.6WI08c argon 20.0 6 150–490 0.57 0.73 4.42 2.21 37.4 š 3.5WI09b argon 20.0 5 150–470 0.64 0.62 2.27 1.31 41.7 š 7.4 42.9 š 6.5 10.4 š 1.6 9.9 š 1.5
Hl is the magnetic field induced in the laboratory; N is the number of points used to determine paleointensity; 1T gives the interval oftemperature used in the calculation; f , g and q are the NRM fraction, the gap factor and the quality factor [5]; w is the weighting factor;Ha is the paleointensity estimate for an individual specimen, and ¦Ha is its standard error; Fa gives the weighted average paleointensityvalues from the measurements in air and in argon and SD is the standard deviation associated with the weighted average. VADM is thevirtual axial dipole moment with its standard deviation; VDM is the virtual dipole moment with its standard deviation

28 J.-P. Valet et al. / Earth and Planetary Science Letters 161 (1998) 19–32
the weighting factor w as defined by Prevot et al.[19]. The results are summarized in Table 2.
5. Results and discussion
The final values of absolute paleointensity havebeen plotted in Fig. 5a as a function of the age ofthe lava flows. Ages used for this study were de-rived from laboratory radiocarbon dates and werenot corrected for temporal variations in atmospheric14C content. Consequently, the 14C ages older than10,000 years should probably be corrected to olderages. However, the corrections published so far [20–22] do not exceed 2 to 3 ka which, given the un-certainties on other ages published in the literature,do not hamper the comparison with the other records(the previous results have been published withoutcorrections). Within the limits imposed by the num-ber of flows, the present results depict a decreasein field intensity between 5 and 20 ka. The datasets obtained from all the other studies performed inthe same area [1–3] are shown also in Fig. 5a forcomparison. The results from core SOH-4 lie signif-icantly above the other values. Since the three datasets were obtained from very close sites, such differ-ences cannot be due to local non-dipole componentsbut could reflect inaccuracies in the age calibration(a unique age of 42 ka with a 15 ka large uncertainty)or other biases. The results of the present study de-pict the same overall variations as those derived fromthe records published by Coe et al. [3] and Mankinenand Champion [1]. However, they lie significantlybelow the determinations obtained in these studieswithin the interval between 9 and 17 ka B.P. It hasbeen suggested that this behaviour could be a directconsequence of alteration during heating, a processthat would progressively increase the TRM capac-ity of the rock and induce a concave-up curvatureof the NRM–TRM curves. This does not seem tobe the case for the following reasons. Two of thesites (CA and NA) with ages comprised within thisinterval are characterized by linear NRM–TRM dia-grams which yield the same paleointensity estimatesat all temperatures. The second interesting observa-tion relies on the results obtained by normalizing theNRM intensity by the anhysteretic remanent magne-tization (ARM) produced in a 80 mT AF peak field
and a 0.05 mT DC field, i.e., without performingany thermal treatment. Noticeably the slopes derivedfrom the NRM versus ARM diagrams after stepwiseAF demagnetization (Fig. 5b) of these two parame-ters provide an estimate of ‘relative paleointensity’which depict the same variations as the slopes ob-tained from the NRM versus TRM Arai plots ofthe adjacent specimen from the same sample. Thus,alteration, if ever it happened during the heatingprocess, did not affect the determination of absolutepaleointensity. Another possibility could be that thesamples lost a substantial part of their initial NRMby long-term exposure in the weathering conditions.However, we do not see why low temperatures wouldyield a better determination in this case, and there isno reason why a larger amount of magnetic grainswould be involved in high-temperature laboratoryTRMs. Additional studies on recent lava flows arenow in progress to constrain further questions relatedto the range of appropriate temperatures to be usedfor determination of absolute paleointensity.
It is interesting to compare the Hawaiian paleoin-tensity results with the other records from the restof the world that incorporated dating for each lavaflow. We calculated the virtual axial dipole moment(VADM) using the weighted data points of meanpaleointensity given in Table 2. In order to comparefield estimates from different areas we have plottedthe VADMs as a function of age in Fig. 6a. None ofthe eight present lava flows yields a paleointensitythat lies significantly outside the worldwide data set.Thus, within the limits imposed by the error barsinherent to all the determinations we infer that thepresent results from Hawaii do not require a long-term presence of large and fluctuating non-dipolefield components under this area during this period.Note that it would have been more appropriate toplot VDMs instead of VADMs but some studies donot incorporate inclination values and the compila-tions published so far rely exclusively on VADMs.Since the inclinations do not lie significantly awayfrom the inclination of the axial dipole there is nomajor difference between VDMs and VADMs in thepresent study.
The recent period, between 0 and 12 ka, incorpo-rates a very large number of records. McElhinny andSenanayake [10] used averaged values of intensityover finite time intervals to remove the effects of

J.-P. Valet et al. / Earth and Planetary Science Letters 161 (1998) 19–32 29
Fig. 5. (a) Values of absolute paleointensity obtained in this study (black squares) and results published previously from the same area.Mankinen and Champion [1] (shaded lozenges), Coe et al. [3] (shaded triangles) and Garnier et al. [2] (open circles). (b) Comparisonbetween the relative variations of paleointensity derived from AF demagnetization of NRM and ARM and the absolute values obtainedfrom the NRM-TRM diagrams. The agreement between the two sets of results indicates that no mineralogical changes affected thedeterminations of absolute paleointensity.
the non-dipole components. Merrill et al. presentedrecently [23] an update version of the results whichcover the past 50 ka. This approach provides also thepossibility of comparing volcanic and sedimentaryrecords. Although the number of records between 12and 40 ka remains significantly lower than for therecent period, we calculated the arithmetic mean of
the absolute paleointensities within successive inter-vals of 5 ka. Since the number of data is relativelyweak and the ages of the lava flows are irregularlydistributed within the successive intervals, each av-erage field intensity has been associated with theaverage age of the records within the correspondinginterval. The results of this compilation have been

30 J.-P. Valet et al. / Earth and Planetary Science Letters 161 (1998) 19–32
Fig. 6. (a) Virtual axial dipole moments (VADMs) obtained in this study (black circles) and results obtained on dated flows from therest of the world including Hawaii (squares). For comparison the synthetic sedimentary curve Sint-200 is shown in dashed lines. (b)Worldwide data set of VADMs obtained from dated lava flows and averaged within successive time intervals of five thousand years. Notethe overall good agreement with Sint-200.
plotted in Fig. 6b (only the results from McElhinnyand Senanayake [10] have been reported between 0and 12 ka) along with the lower and upper envelopesof Sint-200. The values of the Sint-200 record [11]have been converted into VADMs after performinga linear regression of each data set. A simple mul-tiplicative factor was necessary to match the tworegression lines and was thus used to convert the
Sint-200 values into VADMs. Given the irregular-ities in the temporal distribution of the data, eachinterval has a different statistical weight and onecould thus suspect the stability of the results. How-ever, the pattern of the variations is very regular anda running average yields the same trend.
The most striking feature is that the two data setsare in excellent agreement and confirm that the mean

J.-P. Valet et al. / Earth and Planetary Science Letters 161 (1998) 19–32 31
dipole field increased continuously between 40 and10 ka. However, the resolution of the results does notallow us to observe whether short-time scale featureswould be superimposed on the long-term trend. Be-cause the non-dipole field vary on time scales thatdo not exceed a few hundred years (unless standingcomponents would persist over long periods), high-resolution sedimentary records could well be moreappropriate to explore this possibility.
6. Conclusion
This study has provided records of absolute pa-leointensity from the island of Hawaii which fitwith those derived from the worldwide data set forthe period 0–30 ka. This observation is difficultto reconcile with the hypothesis of persistent largenon-dipole field components beneath Hawaii duringthis period. The existing absolute field intensitiesbetween 10 and 40 ka obtained from dated lavaflows and the records of relative paleointensity fromsediments display identical variations which docu-ment a regular decrease of the dipole field. It mustbe emphasized that this picture emerges only fromrecords that incorporate accurate dating of any sin-gle lava flow. This is not surprising given the largeand short-term variability of the geomagnetic field.A particular aspect of the present study is that somedeterminations seem to be lower than previous val-ues from lava flows with about the same ages. Sincemedium and high temperatures have been used todetermine the absolute paleointensity in the presentcase, the differences between parallel studies raise upinteresting aspects regarding the appropriate temper-atures to use for paleointensity determinations andthe relationship with the magnetic material. Furtherwork on this matter is in progress on contempora-neous flows. We just notice that several theoreticalrock magnetic observations [24,25] and other indi-rect estimates obtained in this study would support torely preferably on determinations obtained from seg-ments including high temperatures. Given the errorbars inherent to most field determinations by the ex-isting techniques it is obviously impossible to extractthe actual influence of non-dipole field components.Only statistical treatments performed from a largenumber of data will hopefully offer this possibility.
Acknowledgements
This study was supported by the INSU-CNRSprogram ‘Interieur de la Terre’. This is IPGP contri-bution No. 1520. [FA]
References
[1] E.A. Mankinen, D.E. Champion, Broad trends in geomag-netic paleointensity on Hawaii during holocene time, J.Geophys. Res. 98 (1993) 7959–7976.
[2] F. Garnier, C. Laj, E. Herrero-Bervera, C. Laj, H. Guillou,D.M. Thomas, Geomagnetic field intensity over the last42,000 years from core SOH-4, Big Island, Hawaii, J.Geophys. Res. 101 (B1) (1996) 585–600.
[3] R.S. Coe, S. Gromme, E.A. Mankinen, Geomagnetic pa-leointensities from radiocarbon-dated lava flows on Hawaiiand the question of the pacific non-dipole low, J. Geophys.Res. 83 (1978) 1740–1756.
[4] M.F. Barbetti, K. Flude, Geomagnetic variation during thelate Pleistocene period and changes in the radiocarbon timescale, Nature 279 (1979) 202–205.
[5] J.S. Salis, Variation seculaire du champ magnetique ter-restre. Directions et paleointensites sur la periode 7000–70000 ans B.P., dans la chaıne de Puys, Memoires etDocuments du Centre Armoricain d’Etude Structurale desSocles, Rennes, France, 1987.
[6] P. Roperch, N. Bonhommet, S. Levi, Paleointensity of theearth’s magnetic field during the Laschamp excursion andits geomagnetic implications, Earth Planet. Sci. Lett. 88(1988) 209–219.
[7] A. Chauvin, R. Duncan, N. Bonhommet, S. Levi, Paleoin-tensity of the Earth’s magnetic field and K–Ar dating of theLouchardiere volcanic flow (central France): New evidencefor the Laschamp excursion, Geophys. Res. Lett. 16 (1989)1189–1192.
[8] A. Chauvin, P.Y. Gillot, N. Bonhommet, Paleointensity ofthe Earth’s magnetic field recorded by two late Quaternaryvolcanic sequences at the island of La Reunion (IndianOcean), J. Geophys. Res 96 (1991) 1981–2006.
[9] H. Tanaka, A. Otsuka, T. Tachibana, M. Kono, Paleointen-sities for 10–22 ka from volcanic rocks in Japan and NewZealand, Earth Planet. Sci. Lett. 122 (1994) 29–42.
[10] M.W. McElhinny, W.E. Senanayake, Variation in the ge-omagnetic dipole, 1. The past 50000 years, J. Geomagn.Geoelectr. 34 (1982) 39–51.
[11] Y. Guyodo, J.P. Valet, Relative variations in geomagneticintensity from sedimentary records: the past 200 thousandyears, Earth Planet. Sci. Lett 143 (1996) 23–36.
[12] F. Garnier, C. Laj, E. Herrero-Bervera, C. Kissel, D.M.Thomas, Preliminary determinations of geomagnetic fieldintensity for the last 400 kyr from the Hawaii ScientificDrilling Project core, Big Island, Hawaii, J. Geophys. Res.101 (1996) 11665–11673.

32 J.-P. Valet et al. / Earth and Planetary Science Letters 161 (1998) 19–32
[13] J.P. Lockwood, Mauna Loa eruptive history — The prelim-inary radiocarbon record, Am. Geophys. Union, Washing-ton, DC, 1995, pp. 81–94.
[14] R.S. Coe, The determination of paleointensities of theEarth’s magnetic field with emphasis on mechanisms whichcould cause non-ideal behavior in Thellier’s method, J.Geomagn. Geoelectr. 19 (1967) 157–179.
[15] M.J. Aitken, A.L. Allsop, G.D. Bussel, M.B. Winter, De-termination of the intensity of the earth’s magnetic fieldduring archeological times: reliability of the Thellier tech-nique, Rev. Geophys. 26 (1988) 3–12.
[16] J.L. Kirschvink, The least-squares line and plane and theanalysis of paleomagnetic data, Geophys. J. R. Astron. Soc.62 (1980) 699–718.
[17] T.Y. Nagata, Arai, K. Momose, Secular variation of the geo-magnetic total force during the last 5000 years, J. Geophys.Res. 68 (1963) 5277–5282.
[18] J.P. Valet, J. Brassart, I. Le Meur, V. Soler, X. Quidelleur, E.Tric, P.Y. Gillot, Absolute paleointensity and magnetomin-eralogical changes, J. Geophys. Res 101 (1996) 25029–25044.
[19] M. Prevot, E.A. Mankinen, R.S. Coe, C.S. Gromme, TheSteens Mountain (Oregon) geomagnetic polarity transition,
2. Field intensity variations and discussion of reversalsmodels, J. Geophys. Res 90 (1985) 10417–10448.
[20] E. Bard, B. Hamelin, R.G. Fairbanks, A. Zindler, Cali-bration of the 14C timescale over the past 30,000 yearsusing mass spectrometric U–Th ages from Barbados corals,Nature 345 (1990) 405–409.
[21] E. Bard, M. Arnold, B. Hamelin, Present status of the radio-carbon calibration for the late Pleistocene. 4th Int. Conf. onPaleoceanography ICP-IV, Kiel, Germany, Abstract, 1992.
[22] A. Mazaud, C. Laj, E. Bard, M. Arnold, E. Tric, Geomag-netic field control of 14C production over the last 80 kyr:implication for the radiocarbon time-scale, Geophys. Res.Lett. 18 (1991) 1885–1888.
[23] R.T. Merrill, M. McElhinny and P.L. McFadden, The Mag-netic Field of the Earth. International Geophysics Series,Vol. 63, Academic Press, New York, NY, 1996.
[24] R.J. Enkin, D.J. Dunlop, A micromagnetic study of pseudosingle-domain remanence in magnetite, J. Geophys. Res. 92(1987) 12726–12740.
[25] E. McClelland, Theory of CRM acquired by grain growth,and its implications for TRM discrimination and paleoin-tensity determination in igneous rocks, Geophys. J. Int. 126(1996) 271–280.