Embed Size (px)
Citation preview


About the Cover
On our cover this year, we delve into the social, economic and environmental implications of sustainability. To us, sustainability is a product of well thought decisions and responsible actions – that represent building blocks for creating sound economic value and giving back to the communities we are a part of.
Now with another year drawing to a close, we reiterate our commitment to build a sustainable future – one that stands on our promise of increased efficiency, balanced growth and healthier ecosystems for all.

Table of Contents
02 Company Profile
06 Company Information
08 Organogram
09 Management Team
10 Nature of Business
13 Entity Rating
14 Board of Directors
16 Management Committees
18 Vision
19 Mission Statement
20 Policies
22 Core Values
23 Code of Conduct
24 Decade at a Glance
26 Horizontal and Vertical Analysis
30 Value Added and its Distribution
31 Sources and Application of Funds
32 Corporate Social Responsibility
35 Corporate Calendar
36 Notice of Annual General Meeting
40 Directors’ Report to the Shareholders
49
52 Shareholders’ Information
60 Statement of Compliance with the Code of Corporate Governance
62 Review Report on Statement of Compliance with Best Practices of Code of Corporate Governance
63 Auditors’ Report to the Members
65 Financial Statements
ڈائریکٹرز کی رپورٹ برائے شیرئ ہولڈرز
124 Directors’ Report on the Consolidated Financial Statements
126
127 Auditors’ Report to the Members on the Consolidated Financial Statements
128 Consolidated Financial Statements
201 Video Conference Facility
203
205 Electronic Transmission Consent
207
209 Form of Proxy
211
مجموعی مالیاتی حسابات پر ڈائریکٹرز کی رپورٹ
وڈیو کانفرنس کی سہولت
اظہار رضا مندی بابت ترسیل برق روی
تشکیل نیابت داری
ANNUAL REPORT OF PACKAGES LIMITED 2015
1

Packages Limited was established in 1957 as a joint venture between the Ali Group of Pakistan and Akerlund & Rausing of Sweden, to convert paper and paperboard into packaging for consumer industry. Over the years, Packages has continued to enhance its facilities to meet the growing demand of packaging products.
In 1968, with IFC participation, Packages integrated upstream by establishing a Pulp and Paper Mill with a capacity of 24,000 tons per year based on waste paper and agricultural by-products i.e. wheat straw and river grass. With growing demand the capacity was increased periodically and in January 2003, total capacity was nearly 100,000 tons per year.
In 1982, Packages modified a paper machine to produce tissue paper in response to growing awareness and demand for hygienic and disposable
Company Profile
Packages Limited is Pakistan’s leading packaging solution provider. Our job is to deliver high quality packaging in the most efficient, profitable and sustainable way. We are primarily a business to business company and our customer base includes some of the world’s best-known branded consumer products companies across industries.
We are also a leading manufacturer of tissue paper products. Our leadership position in tissue products is a result of our ability to offer products manufactured under highest standards of hygiene and quality to meet the household and cleanliness needs of our consumers. We provide a complete range of tissue paper products that are convenient, quick and easy to use.
Historical Overview tissues. The “Rose Petal” brand name was launched with facial tissues and was later expanded to include toilet paper, kitchen roll, and table napkins.
In 1986, the Company established a flexible packaging unit to cater to the increasing demand from consumers for sophisticated packaging used primarily in the food industry.
In 1993, a joint venture agreement was signed with Mitsubishi Corporation of Japan for the manufacture of Polypropylene films at the Industrial Estate in Hattar, Khyber Pakhtunkhwa. This project, Tri-Pack Films Limited, commenced production in June 1995 with equity participation by Packages Limited, Mitsubishi Corporation, Al-Tawfeek Company for Investment Funds, Saudi Arabia and general public. Packages Limited owns 33.33 % of Tri-Pack Films Limited’s equity.
2

In July, 1994, Coates Lorilleux Pakistan Limited (currently DIC Pakistan Limited), in which Packages Limited has 54.98 % ownership, commenced production and sale of printing inks.
During the same year, the Company initiated the capacity expansion of its Paper and Board Mill to 65,000 tons per year and conversion capacity to 56,000 tons per year. At the same time, the Company also upgraded the quality of Packages’ products and substantially improved pollution control to meet the World Bank environmental guidelines. The said expansion was completed in 1998 at a cost of PKR 2.7 billion.
In 1996, Packages entered into a joint venture agreement with Printcare (Ceylon) Limited for the production of flexible packaging materials in Sri Lanka. The project, Packages Lanka (Private) Limited, in which Packages Limited has 79.07 % ownership, commenced production in 1998.
During 1999-2000, Packages successfully completed the expansion of the flexible packaging line by installing a new rotogravure printing machine and enhancing the carton line by putting up a new Lemanic rotogravure inline printing and cutting creasing machine. In addition, a new 8 color Flexographic printing machine was also installed in the flexible packaging line in 2001.
Packages commenced production of corrugated boxes from its plant in Karachi in 2002.
In 2005, the Company embarked upon its Paper & Board expansion plan at a new site ‘Bulleh Shah Paper Mill (currently Bulleh Shah Packaging (Private) Limited), almost tripling its capacity from 100,000 tons per annum to 300,000 tons per annum. Capacity expansion at Bulleh Shah Paper Mill was completed in two phases. In the first phase, Brown
Board Machine PM-6 along-with high yield straw pulping & OCC plants and its back processes such as 11 MW Power House, Gas Turbine and Primary Effluent Treatment Plant were capitalised and commercial operations were commenced during the year 2007. Second phase comprising of Writing and Printing Paper Machine PM-7, De-inking Pulp Plant, 41MW Power House, Steam Turbine and Secondary Effluent Treatment Plant was completed in the year 2009.
In 2008, the Company embarked upon capacity expansion in its tissue division through installation of a new tissue paper manufacturing machine PM-9 with production capacity of 33,000 tons per annum. With this capacity expansion, the Company is now in a position to take benefit from export potential of tissue products in the international market, particularly the Middle East.
ANNUAL REPORT OF PACKAGES LIMITED 2015
3

During 2011, a lamination machine was installed in the flexible department at a cost of PKR 96 million. This was Pakistan’s first high speed solvent-less automatic lamination machine. It has turret winders for automatic reel and a capacity of 450 meters per minute.
The rebuild project of Paper Machine PM-6, installed at Bulleh Shah Paper Mill, was completed in the second quarter of 2011 leading to capacity expansion of 30,000 tons. The machine started commercial operations with enhanced capability of producing high value added liquid packaging and bleached board. Moreover, the Corrugator Machine in Kasur Plant was upgraded in 2011 to improve efficiency, reliability, enhance capacity and reduce waste. This upgrade activity resulted in increased capacity of 14%.
In 2012, the Company invested in a New Rotogravure Machine for its
Flexible Packaging Business with a total estimated project cost of PKR 326 million as part of the Company’s efforts to remain abreast of improved technological developments in the Packaging business. In the same year, to enable continuous growth and technical development in the Paper & Paperboard segment, Packages signed a 50/50 Joint Venture agreement with Stora Enso OYJ Group of Finland in its 100% wholly owned subsidiary, Bulleh Shah Packaging (Private) Limited. The Joint Venture included Paper & Paperboard and Corrugated business operations at Kasur and Karachi. The Joint Venture Agreement with Stora Enso OYJ Group, signed in 2012, was implemented in 2013 and Packages completed the transfer of assets and related obligations of Paper & Paperboard and Corrugated business operations to Bulleh Shah Packaging (Private) Limited along with cash equity injection. Packages now holds 65% equity in Bulleh Shah Packaging
(Private) Limited. The joint venture partner, Stora Enso OYJ Group, is actively involved in providing technical expertise to further enhance the Paper & Paperboard and Corrugated business operations.
During 2014, the Company invested in a new Offset Printing Line in continuation of its efforts to remain abreast of improved technological developments in the Packaging business. The new Offset Printing Line commenced its commercial operations during the first quarter of 2014 and had made available additional capacity to meet growing customer demands in the Folding Carton business.
As part of its asset and income diversification strategy, the Company, in May 2014 initiated development of a high quality retail mall at its Lahore land through its wholly owned subsidiary, Packages Construction (Private) Limited.
Packages Limited
Bulleh-ShahPackaging (Private)
Limited (65.00%)
Calcipack (Private) Limited
(100%)
Joint Venture
IGI InsuranceLimited
(10.61%)
DIC PakistanLimited
(54.98%)
Packages Lanka (Private)
Limited (79.07%)
Anemone Holdings Limited
(100%)
Flexible Packages
Convertors (Pty)Limited
(55.00%)
PackagesConstruction
(Private) Limited (99.99%)
Tri-Pack FilmsLimited
(33.33%)
IGI InvestmentBank Limited
(2.17%)
Subsidiaries Associates
4

PIC
In 2015, as a part of its continuing efforts towards technological up gradation, the Company invested in a new toilet roll line to cater to the growing demand. A new brand by the name of “Maxob” produced on this machine has been launched during the year.
The Company’s development of a high quality retail mall at its Lahore land is underway. The construction of the mall is based on inputs from international retail consultants.
Year 2015Further, during 2015, the Board of Directors resolved to start a 50/50 joint venture with Omya Group of Switzerland. The joint venture will set up a production facility to supply a range of high quality ground calcium carbonate products.
In line with strategy to diversify and enter into new high growth markets, in June 2015, the Company completed the acquisition of 55% share in the operation of a flexible packaging company in South Africa.
ANNUAL REPORT OF PACKAGES LIMITED 2015
5

Board of DirectorsTowfiq Habib Chinoy (Chairman) (Non-Executive Director)
Syed Hyder Ali(Chief Executive & Managing Director)(Executive Director)
Rizwan Ghani(General Manager) (Executive Director)
Jari Latvanen (Non-Executive Director)
Josef Meinrad Mueller(Non-Executive Director)
Muhammad Aurangzeb(Independent Director)
Shamim Ahmad Khan(Non-Executive Director)
Syed Aslam Mehdi(Non-Executive Director)
Syed Shahid Ali(Non-Executive Director)
Tariq Iqbal Khan (Non-Executive Director)
AdvisorSyed Babar Ali
Chief Financial OfficerKhurram Raza Bakhtayari
Company SecretaryAdi J. Cawasji
Rating AgencyPACRA
Credit Rating Long-term : AAShort-term : A1+
AuditorsA.F. Ferguson & Co.Chartered Accountants
Legal AdvisorsHassan & Hassan - LahoreOrr, Dignam & Co. - Karachi
Shares RegistrarFAMCO Associates (Pvt.) Ltd8-F, Next to Hotel FaranNursery, Block 6, P.E.C.H.S.Shahrah-e-FaisalKarachi-75400PABX : (021) 34380101 : (021) 34380105 : (021) 34384621-3Fax : (021) 34380106Email : [email protected]
Bankers & LendersAllied Bank LimitedAskari Bank LimitedBank Alfalah LimitedBank Al-Habib LimitedDeutsche Bank A.G.Dubai Islamic Bank Pakistan LimitedHabib Bank LimitedHabib Metropolitan Bank LimitedInternational Finance Corporation (IFC)JS Bank LimitedMCB Bank LimitedMeezan Bank LimitedNIB Bank LimitedSamba Bank LimitedSoneri Bank LimitedStandard Chartered Bank (Pakistan) LimitedThe Bank of PunjabThe Bank of Tokyo - Mitsubishi UFJ, LimitedUnited Bank Limited
Head Office & WorksShahrah-e-RoomiP.O. Amer SidhuLahore - 54760, PakistanPABX : (042) 35811541-46Fax : (042) 35811195
Offices
Registered Office & Regional Sales Office
4th Floor, The ForumSuite No. 416 - 422, G-20, Block 9Khayaban-e-Jami, CliftonKarachi - 75600, PakistanPABX : (021) 35874047-49 : (021) 35378650-51 : (021) 35831618, 35833011Fax : (021) 35860251
Regional Sales Office
2nd Floor, G.D. Arcade73-E, Fazal-ul-Haq Road, Blue AreaIslamabad - 44000, PakistanPABX : (051) 2348307 - 9 : (051) 2806267Fax : (051) 2348310
Zonal Sales Offices
C-2, Hassan Arcade Nusrat RoadMultan Cantt. - 60000, PakistanTel. & Fax: (061) 4504553
2nd Floor Sitara TowerBilal chowk, Civil Lines, Faisalabad PakistanTel : (041) 2602415Fax : (041) 2629415
Web Presencewww.packages.com.pk
Company Information
6

Colombo, Sri LankaPackages Lanka (Private) Limited
ANNUAL REPORT OF PACKAGES LIMITED 2015
7

Organogram
GENERAL MANAGER
BOARD OF DIRECTORS
INDUSTRIAL PERFORMANCE (ENVIRONMENT, HEALTH & SAFETY)
HUMAN RESOURCE
CHIEF EXECUTIVE & MANAGING DIRECTOR
CHIEF FINANCIAL OFFICER
HEAD OF CONSUMER PRODUCTS DIVISION
FINANCE INFORMATIONTECHNOLOGY
HEAD OF PACKAGING DIVISION
FLEXIBLEPACKAGING
FOLDINGCARTONS
ROLL COVERS ANDMECHANICAL FABRICATION
ADMINISTRATION
8

Management Team
From Left to Right(Sitting)
Syeda Henna Babar Ali(Advisor Tissue Division)
Asghar Abbas(Head of Packaging Division)
Syed Hyder Ali(Chief Executive and Managing Director)
Rizwan Ghani(General Manager)
Khurram Raza Bakhtayari(Chief Financial Officer)
From Left to Right(Standing)
Numan Noor(Business Unit Manager - Folding Cartons)
Ather Ayub Khan(Business Unit Manager - Roll Covers and Mechanical Fabrication)
Syed Asim Shamim(Business Unit Manager - Flexible Packaging)
Shaheen Sadiq(Head of Consumer Products Division)
Kaifee Siddiqui(Head of Human Resource)
Sajjad Iftikhar(Chief Investment Officer)
ANNUAL REPORT OF PACKAGES LIMITED 2015
9
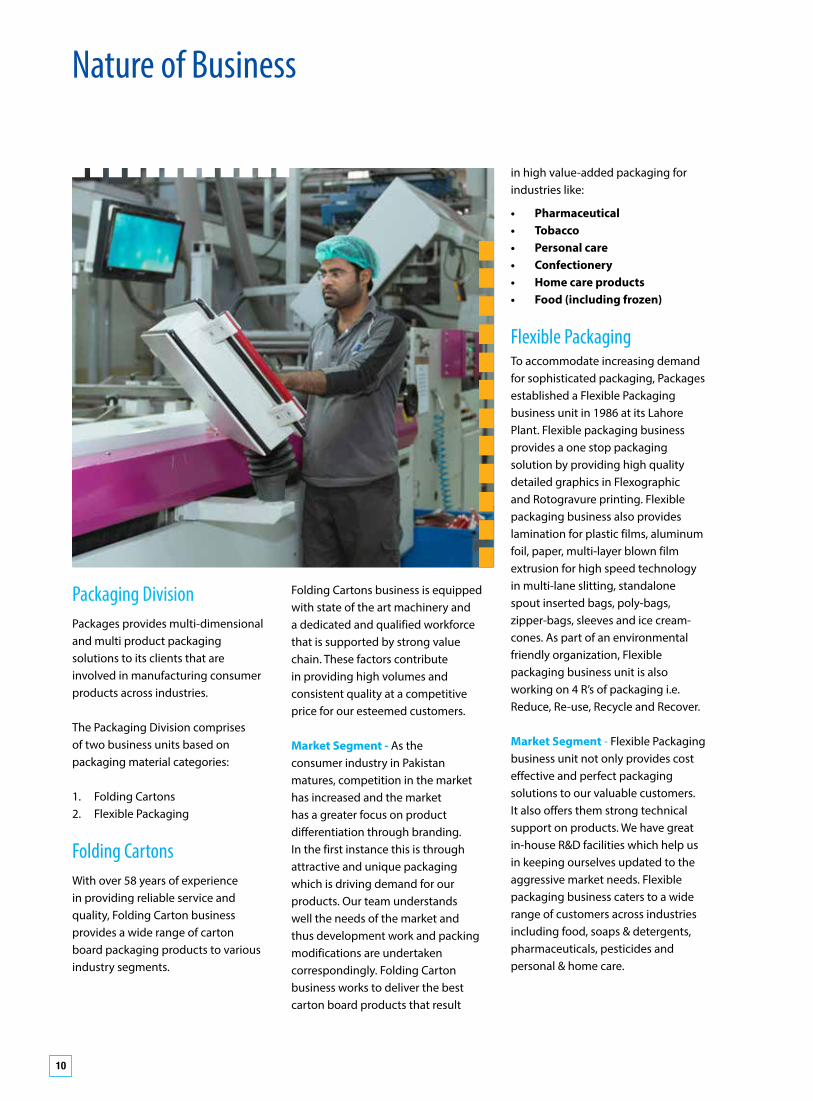
Packaging DivisionPackages provides multi-dimensional and multi product packaging solutions to its clients that are involved in manufacturing consumer products across industries.
The Packaging Division comprises of two business units based on packaging material categories:
1. Folding Cartons2. Flexible Packaging
Folding CartonsWith over 58 years of experience in providing reliable service and quality, Folding Carton business provides a wide range of carton board packaging products to various industry segments.
Nature of Business
in high value-added packaging for industries like:
• Pharmaceutical• Tobacco • Personal care• Confectionery• Home care products• Food (including frozen)
Flexible PackagingTo accommodate increasing demand for sophisticated packaging, Packages established a Flexible Packaging business unit in 1986 at its Lahore Plant. Flexible packaging business provides a one stop packaging solution by providing high quality detailed graphics in Flexographic and Rotogravure printing. Flexible packaging business also provides lamination for plastic films, aluminum foil, paper, multi-layer blown film extrusion for high speed technology in multi-lane slitting, standalone spout inserted bags, poly-bags, zipper-bags, sleeves and ice cream-cones. As part of an environmental friendly organization, Flexible packaging business unit is also working on 4 R’s of packaging i.e. Reduce, Re-use, Recycle and Recover.
Market Segment - Flexible Packaging business unit not only provides cost effective and perfect packaging solutions to our valuable customers. It also offers them strong technical support on products. We have great in-house R&D facilities which help us in keeping ourselves updated to the aggressive market needs. Flexible packaging business caters to a wide range of customers across industries including food, soaps & detergents, pharmaceuticals, pesticides and personal & home care.
Folding Cartons business is equipped with state of the art machinery and a dedicated and qualified workforce that is supported by strong value chain. These factors contribute in providing high volumes and consistent quality at a competitive price for our esteemed customers.
Market Segment - As the consumer industry in Pakistan matures, competition in the market has increased and the market has a greater focus on product differentiation through branding. In the first instance this is through attractive and unique packaging which is driving demand for our products. Our team understands well the needs of the market and thus development work and packing modifications are undertaken correspondingly. Folding Carton business works to deliver the best carton board products that result
10

Consumer Products DivisionPackages started commercial production of tissue and other consumer products in 1982 at the Lahore Plant. We currently provide a complete range of tissue and personal hygiene products that are convenient, quick and easy to use; ranging from facial tissues to tissue rolls, table napkins, pocket packs, kitchen towels, party packs, paper plates and cups. We understand that tissue and allied products are seen as a luxury item without the requisite attention being paid to the hygiene element. Packages has always attempted to develop the market for this business segment through education of the population on the hygiene associated with the use of the products.
Product development has always been our focus based on the demands and needs of our consumers. Great effort is put into producing improved and innovative products to make life hygienic and comfortable for our consumers.
BrandsKey brands of Consumer Products Division are:
• Rose Petal• Tulip• Maxob• Double Horse
Certifications The disciplined, motivated and hardworking team of Packages Limited has never compromised on the standards of work environment. This positive professional attitude has helped the business divisions
to acquire numerous certifications including:
- ISO 22000 : 2005 + PASS 223- ISO 14001 : 2004- ISO 18001 : 2007- SMETA- Halal (S.A.N.H.A)
Packaging Division is also certified for URSA (Unilever Responsible Sourcing Audit) and Forest Stewardship Council (Chain of Custody) FSC CoC. The Company is heads on with implementation of Total Productive Maintenance (TPM) to achieve zero downtimes, defects and accidents.
Service DepartmentsPackages believes that its entire operations have to be in line with the needs of the customers. Our operations are supported by excellent service departments who consistently strive to deliver what the customers need on timely basis.
Customer Services Department (CSD)Our Customer Services Department (CSD) constantly monitors production and supply chain to ensure on-time delivery to the customer to ensure that the right quality product reaches the customer at the right time. CSD also performs core liaison function to arrange development activities as well as technical support and after sales support to customers. Customer complaints are followed by proper feedback and management reporting so that customers are always given the due attention they require.
Pre-Press DepartmentPre-Press is the nerve center of Packages Limited where concepts and ideas are developed and woven with marketing strategies of customers to attract the end users of the products produced by our customers.
ANNUAL REPORT OF PACKAGES LIMITED 2015
11

The department has been revolutionised over the last two decades and now follows the design process completely in soft form; images and texts are simultaneously directed from computers to:
• Image setters;• Plate making devices (CDI, Digital System for Flexo); and• Digital engraving machines
In the Art and Camera Department, Packages has high-tech computer systems where digital files are produced instead of photographic negatives. For achieving high quality in all of printing methods (Roto, Flexo and Offset), Pre-Press department is equipped with the latest technology in cylinder, photo polymer and plate making equipment which provides support to various production departments.
Pre-press converts the packaging design according to the technical
requirements on any printing technique like Gravure, Flexography and Offset without compromising the creative integrity of designs.
Research and Development (R&D)Research & Development continues to be one of Packages’ unique selling points. As the consumer industry focuses on cost control, limiting carbon footprint and an overall mindset of “more with less”, innovation is the name of the game.
The Research and Development department at Packages is tirelessly working to understand consumer needs and providing innovations on both design and structure based on global trends. The department also plays a key role in supporting the customers in their cost control initiatives as we see the growth of our customers business as our success.
Supply ManagementSupply Management function came into existence to provide one window operation to the Business Units encompassing material procurement, logistics (for incoming materials and outgoing finished goods), warehousing, miscellaneous services and waste sales. In order to rationalise the vendor base and to include quality vendors, vendor development has also become one of the integral activities of the division.
Nature of Business
12

Rating Type Rating CommentLong - Term AA (Double A) Very high credit rating. AA Rating denote a very low expectation of credit risk. This indicates very strong capacity for timely payment of financial commitment. This capacity is not significantly vulnerable to foreseeable events.
Short - Term A1+(A One Plus) Obligations supported by the highest capacity for timely repayment.
Long Term AAShort Term A1+Rated by: The Pakistan Credit Rating Agency LimitedRating as on: June 2015
Entity Rating of Packages LimitedANNUAL REPORT OF PACKAGES LIMITED 2015
13

Board of Directors
MR. TOWFIQ HABIB CHINOYMr. Towfiq Habib Chinoy, Non-executive Director, has been associated with the Company as Chairman of the Board of Directors since 2008. He is the Managing Director of International Steels Limited and holds chairmanship of Jubilee General Insurance Company Limited and HBL Asset Management Limited. He also holds directorship of IGI Investment Bank Limited. He is also the Chairman of the Board of Governors of Indus Valley School of Arts and Architecture and Trustee of Mohatta Palace Gallery Trust and Habib University Foundation.
MR. RIZWAN GHANIMr. Rizwan Ghani joined the Company in 1982 and currently holds the position of Director and General Manager of the Company. He has a post graduate diploma in Business Studies from United Kingdom and has served as Managing Director of Packages Lanka (Private) Limited. Currently, he holds directorship of Packages Lanka (Private) Limited and Anemone Holdings Limited, Mauritius and is serving on the Board of Trustees of Packages Foundation.
MR. JOSEF MEINRAD MUELLERMr. Josef Meinrad Mueller is associated with the Company as a Non-executive Director. He was born in Switzerland where he obtained his education including an MBA from IMD (formerly IMEDE) in Lausanne where he also served as an Executive-in-Residence. He has over 36 years of senior international management experience at the Nestle Group in developed and emerging markets. He is familiar with Pakistan where he served as Managing Director of Nestle Pakistan Limited during 1992-1995. Throughout his international career, he was entrusted with several senior leadership positions in different countries, including his important role as CEO and Chairman of Nestle in the Greater China Region. Following his retirement from the Nestle Group, Mr. Mueller continues to remain very active in the international business world as an independent business advisor.
SYED HYDER ALISyed Hyder Ali joined Packages Limited in July 1987 and presently holds the position of Managing Director of the Company. He has done his Masters in Sciences from Institute of Paper Chemistry and has also served as Mill Manager of Paper and Paperboard operations of the Company. He holds directorship in several other companies including IGI Insurance Limited, IGI Life Insurance Limited, International Steels Limited, Nestle Pakistan Limited, Packages Construction (Private) Limited, Packages Lanka (Private) Limited, Sanofi-Aventis Pakistan Limited, Tri-Pack Films Limited, Tetra Pak Pakistan Limited, Bulleh Shah Packaging (Private) Limited, KSB Pumps Company Limited and Flexible Packages Convertors (Proprietary) Limited, South Africa. He is also serving on the board of several philanthropic, educational, charitable and business support organizations including Pakistan Centre for Philanthropy, National Management Foundation, Packages Foundation, Syed Maratib Ali Religious and Charitable Trust Society, Babar Ali Foundation and World Wide Fund for Nature. He is also board member of Ali Institute of Education, International Chamber of Commerce and Lahore University of Management Sciences.
MR. JARI LATVANEN Mr. Jari Latvanen is associated with the Company as a Non-executive Director. He is a strategic leader and food industry specialist. He has got a solid track record in the food industry and is currently leading innovative and interactive organizations focusing on active consumer based marketing. He brings with him unique understanding of consumers and retailers from working with strong brands in the food industry. He has held various leadership positions within Nestlé i.e. Managing Director - Nestlé Czech Republic and Slovakia, Assistant Vice President - Zone Europe Nestlé, HQ Switzerland and Managing Director - Nestlé Sweden, Marketing Director - Nestlé Nordics. He has been Chief Executive Officer of Findus Nordic from 2010 to 2014. In year 2013, he was awarded with the prestigious Swedish Food Prize 2013 for managing the infamous horse meat scandal and acting as a whistle blower. He has also been awarded with White Guide Award and Taste Developer of the Year 2013.
14

MR. MUHAMMAD AURANGZEBMr. Muhammad Aurangzeb is an Independent Director of the Company and has over 27 years of banking experience. He has served as Non-executive Director of RBS Berhad and was also a member of the Risk Management, Remuneration and Nominating Committee, all of which are sub-committees of the board. He has also served on Boards of various business schools, Aga Khan Foundation and ABN AMRO Foundation. Presently, he is Executive Vice President Morgan Chase for whole of Asia.
SYED ASLAM MEHDISyed Aslam Mehdi, Non-executive Director, has a Masters degree in Business Administration from Institute of Business Administration, Karachi and has been associated with the Group companies in various capacities over the years. He also served as the General Manager of the Company from September 2008 to September 2014. Currently, he is the Managing Director of Bulleh Shah Packaging (Private) Limited and holds directorship of DIC Pakistan Limited, Packages Construction (Private) Limited, Tri-Pack Films Limited, Tetra Pak Pakistan Limited and Printcare PLC, Sri Lanka. He is also the member of the Board of Governors of the National Management Foundation and is serving on the Board of Trustees of Packages Foundation.
MR. TARIQ IQBAL KHANMr. Tariq Iqbal Khan is associated with the Company as a Non-executive Director. He is a Fellow member of the Institute of Chartered Accountants of Pakistan, with diversified experience of more than 40 years. He has held leading policy-making positions in various associations and institutions in the country, including being a Founding Director and President of Islamabad Stock Exchange, Commissioner and Acting Chairman Securities and Exchange Commission of Pakistan and Managing Director/Chairman at Investment Corporation of Pakistan/National Investment Trust. He is currently a member on the Board of Gillette Pakistan Limited, International Steels Limited, Lucky Cement Limited, National Refinery Limited, Silk Bank Limited, Pakistan Oilfields Limited and FFC Energy Limited.
MR. SHAMIM AHMAD KHANMr. Shamim Ahmad Khan is associated with the Company as Non-executive Director. He has served various government organizations in different capacities namely Securities and Exchange Commission of Pakistan and Ministry of Commerce. He has also been engaged with consultancy assignments for Asian Development Bank and other organizations. Currently, he holds directorship of Abbott Laboratories Pakistan Limited, Attock Refinery Limited, IGI Insurance Limited, IGI Life Insurance Limited and Karandaaz (Pvt) Limited. He is also a member of the Advisory Committee of Center for International Private Enterprise Pakistan, Board of Governors of Sustainable Development Policy Institute and is serving on the Board of Trustees of Packages Foundation.
SYED SHAHID ALI Syed Shahid Ali is currently associated with the Company as Non-executive Director. He also holds directorship of several other companies including Treet Corporation Limited, Treet Assets (Private) Limited, Treet Power Limited, Loads Limited, IGI Insurance Limited, Ali Automobiles Limited, First Treet Manufacturing Modaraba, Global Econo Trade (Private) Limited, Multiple Auto Parts Industries (Private) Limited, Specialised Autoparts Industries (Private) Limited and Specialised Motorcycles (Private) Limited. He is also actively involved in social and cultural activities and holds senior positions on the governing boards of several hospitals and philanthropic organizations including Liaquat National Hospital.
ANNUAL REPORT OF PACKAGES LIMITED 2015
15

Management Committees
Executive Committee
Syed Hyder Ali Chairman(Executive Director)
Rizwan Ghani Member(Executive Director)
Executive Committee is involved in day to day operations of the Company and is authorised to conduct every business except the businesses to be carried out by the Board of Directors as required by section 196 of the Companies Ordinance, 1984. The Executive Committee meets periodically to review operating performance of the Company against pre-defined objectives, commercial business decisions and investment and funding requirements. The Executive Committee is also responsible for formulation of business strategy, review of risks and their mitigation plan.
Audit Committee
Tariq Iqbal Khan Chairman (Non-Executive Director)
Muhammad Aurangzeb Member(Independent Director)
Shamim Ahmad Khan Member(Non-Executive Director)
Syed Aslam Mehdi Member(Non-Executive Director)
Syed Shahid Ali Member(Non-Executive Director)
Adi J. Cawasji Secretary(Company Secretary)
The terms of reference of the Audit Committee is derived from the Code of Corporate Governance applicable to listed companies in Pakistan. The Audit Committee is, among other things, responsible for recommending to the Board of Directors the appointment of external auditors by the Company’s shareholders and considering any questions of resignation or removal of external auditors, audit fees and provision by external auditors of any service to the Company in addition to audit of its financial statements. In the absence of strong grounds to proceed otherwise, the Board of Directors act in accordance with the recommendations of the Audit Committee in all these matters.
The terms of reference of the Audit Committee also include the following:
a) Determination of appropriate measures to safeguard the Company’s assets;
b) Review of quarterly, half-yearly and annual financial statements of the Company, prior to their approval by the Board of Directors, focusing on:
• Major judgmental areas;
• Significant adjustments resulting from the audit;
• The going-concern assumption;
• Any changes in accounting policies and practices;
• Compliance with applicable accounting standards;
• Compliance with listing regulations and other
statutory and regulatory
requirements ; and
• Significant related party transactions
c) Review of preliminary announcements of results prior to publication;
d) Facilitating the external audit and discussion with external auditors of major observations arising from
16

interim and final audits and any matter that the auditors may wish to highlight (in the absence of management, where necessary);
e) Review of management letter issued by external auditors and management’s response thereto;
f ) Ensuring coordination between the internal and external auditors of the Company;
g) Review of the scope and extent of internal audit and ensuring that the internal audit function has adequate resources and is appropriately placed within the Company;
h) Consideration of major findings of internal investigations of activities characterised by fraud, corruption and abuse of power and management’s response there to;
i) Ascertaining that the internal control systems including financial and operational controls, accounting systems for timely and appropriate recording of purchases and sales, receipts and payments, assets and liabilities and the reporting structure are adequate and effective;
j) Review of the Company’s statement on internal control systems prior to endorsement by the Board of Directors and internal audit reports;
k) Instituting special projects, value for money studies or other investigations on any matter specified by the Board of Directors, in consultation with the Chief Executive Officer and to consider remittance of any matter to the external auditors or to any other external body;
l) Determination of compliance with relevant statutory requirements;
m) Monitoring compliance with the best practices of corporate governance and identification of significant violations thereof; and
n) Consideration of any other issue or matter as may be assigned by the Board of Directors
Human Resource and Remuneration (HR & R) Committee
Towfiq Habib Chinoy Chairman(Non-Executive Director)
Syed Hyder Ali Member(Executive Director)
Shamim Ahmad Khan Member(Non-Executive Director)
Syed Aslam Mehdi Member(Non-Executive Director)
Mr. Tariq Iqbal Khan Member(Non-Executive Director)
Mr. Kaifee Siddiqui Secretary(Head of Human Resource)
This Committee is responsible for:
a) Recommending human resource management policies to the Board;
b) Recommending to the Board the selection, evaluation, compensation (including retirement benefits) and succession planning of the CEO;
c) Recommending to the Board the selection, evaluation, compensation (including retirements benefits) of GM, CFO, Company Secretary and Head of Internal Audit; and
d) Consideration and approval on recommendations of CEO on such matters for key management positions who report directly to CEO or GM.
System and Technology Committee
Rizwan Ghani Chairman(Executive Director)
Khurram Raza Bakhtayar Member(Chief Financial Officer)
Suleman Javed Member (Manager ERP)
This Committee is responsible for:
a) Devising the I.T strategy within the organization to keep all information systems of the Company updated in a fast changing environment. This committee is also responsible for evaluating Enterprise Resource Planning (ERP) solutions and data archiving solutions to achieve Company’s overall goal towards Green Office Project;
b) Reviewing and recommending information technology proposals suggested by management;
c) Promoting awareness of all stakeholders on needs for investment in technology and related research work; and
d) Reviewing and assessing Company’s systems and procedures, recommending proposals on technological innovations including plant up-gradation, technology improvements etc. with relevant cost benefit analysis.
ANNUAL REPORT OF PACKAGES LIMITED 2015
17
VisionPosition ourselves to be a regional player of quality packaging and consumer products.
Improve on contemporary measures including cost, quality, service, speed of delivery and mobilization.
Keep investing in technology, systems and human resource to effectively meet the challenges every new dawn brings.
Develop relationships with all our stakeholders based on sustainable cooperation, upholding ethical values, which the shareholders, management and employees represent and continuously strive for.
18

Mission StatementTo be a leader in the markets we serve by providing quality products and superior service to our customers, while learning from their feedback to set even higher standards for our products.
To be a Company that continuously enhances its superior technological competence to provide innovative solutions to customer needs.
To be a Company that attracts and retains outstanding people by creating a culture that fosters openness, and innovation, promotes individual growth and rewards initiative and performance.
To be a Company which combines its people, technology, management systems and market opportunities to achieve profitable growth while providing fair returns to its investors.
To be a Company that endeavors to set the highest standards in corporate ethics in serving the society.
ANNUAL REPORT OF PACKAGES LIMITED 2015
19

Policies
Integrated Management System (IMS) PolicyWe intend to be a world class Company that not only delivers quality goods & services but also takes care of its employees’ health, safety & environment as a whole.
We are committed to achieving this by:
1. Complying with all applicable laws and regulatory requirements;
2. Setting objectives and targets for reviewing and improving management systems;
3. Developing an effective IMS system to prevent incidents/accidents, ill health, pollution, waste, hazards and environmental impacts;
4. Ensuring that all food related packaging material is produced, stored and delivered in safe and hygienic condition as per relevant requirements;
5. Continually improving our Environment, Health & Safety (EHS) and food safety management system effectiveness;
6. Creating a safe and work friendly environment for all stakeholders; and
7. Implementing individual accountability to comply with
IMS requirements
This policy is applicable to each individual whether employee, contractor / sub-contractor, supplier, visitor and all other stakeholders of the Company.
20

Total Productive Maintenance (TPM) PolicyWe believe that TPM provides the life cycle approach of improving the overall performance of the machine /equipment through:
• Improving productivity by highly motivated staff / workers
• Satisfying the customers needs by delivering the right quantity at right time with desired quality.
We are committed to following the TPM principles to enhance our competitive position in the market and hence financial position by achieving:
• Zero accidents;
• Zero breakdowns; and
• Zero defects
Quality PolicyPackages Limited is strongly committed to produce quality products that conform to consumer’s requirements at a competitive price.
We shall continually improve our Quality Management System (QMS) and quality performance of all business processes.
We shall set quality objectives at all levels and allocate appropriate resources to achieve them.
We shall ensure all employees are well aware of company quality policy and are motivated to apply it in their areas of responsibility.
Whistle blowing PolicyWe are committed to high standards of ethical, moral and legal business conduct. In line with our commitment to open communication, this policy aims to provide an avenue for employees to raise concerns and reassurance that they will be protected from reprisals or victimization for whistle blowing.
This whistle blowing policy is intended to protect the staff if they raise concerns such as:
• Incorrect financial reporting;
• Unlawful activity;
• Activities that are not in line with Packages’ policy, including the Code of Conduct; or
• Activities which otherwise amount to serious improper conduct.
ANNUAL REPORT OF PACKAGES LIMITED 2015
21

Core Values
Underlying everything we do and everything we believe in is a set of core values. These guide us to deal with every aspect of any issue we might encounter in our personal and professional lives. These values help us grow inside & outside, personally and as an organization.
Good GovernanceWe are committed to running our business successfully and efficiently, providing long term benefits to our employees and shareholders, and enriching the lives of those whom we serve by fulfilling our corporate responsibility to the best of our ability. We expect excellence from all processes, whether they relate to policy formation and accounting procedures or product development and customer service.
Work EnvironmentOur policies and core values are aimed towards creating an informal yet stimulating team-oriented work environment with a culture of sharing and open communication. We cherish the diversity of viewpoint of every
individual; we realise this encourages innovation and develops character.
All employees have the right to a stress and injury free work environment. We ensure our employee health and safety by providing various in-house facilities such as a gym and making sure that all staff understand and uphold our safety policy. All our employees are permitted and encouraged to afford time and attention to personal concerns.
Our PeopleThe success of any organization is largely dependent on the people working for it. Each member of our team is considered equally important and provided constant training, motivation and guidance. We possess a dedicated staff of the highest caliber committed to making our business a success. We ensure that every employee has the opportunity for maximum professional development. To achieve this goal, we seek to provide challenging work prospects for all employees. Each person is compensated and rewarded for his or her performance and hard work on a strict merit basis.
ConservationWe expect and encourage our employees to actively participate in community service and to take care of the environment entrusted to us as citizens sharing the earth’s resources.
Customer SatisfactionWe are customer-driven; we go the extra mile to make sure our clients’ expectations are met and exceeded on every issue. We partner with leading companies to arm ourselves with the latest technology and provide customers with innovative solutions in the most cost-effective manner available.
Ethical BehaviorWe make it clear that being a sincere, honest and decent human being takes precedence over everything else. In the Packages family, there is an all-round respect for elders, tolerance for equals and affection for youngsters. Managers are expected to lead from the front, train junior colleagues through delegation, resolve conflicts quickly, be visible at all times and act as role models for others.
22

Code of Conduct
Packages Limited has built a reputation for conducting its business with integrity , in accordance with high standards of ethical behavior and in compliance with the laws and regulations that govern our business. This reputation is among our most valuable assets and ultimately depends upon the individual actions of each of our employees all over the country.
Packages Limited code of conduct has been prepared to assist each of us in our efforts to not only maintain but enhance this reputation. It provides guidance for business conduct in a number of areas and references to more detailed corporate policies for further direction.
The adherence of all employees to high standards of integrity and ethical behavior is mandatory and benefits all stakeholders viz. our customers, our communities, our shareholders and ourselves.
The Company carefully checks for compliance with the Code by providing suitable information, prevention and control tools and ensuring transparency in all transactions and behaviors by taking creative measures if and when required.
Packages Limited Code of Conduct applies to all affiliates, employees and others who act for us countrywide, within all sectors, regions, areas and functions.
General PrinciplesCompliance with the law, regulations, statutory provisions, ethical integrity and fairness is a constant commitment and duty of all packages employees and characterises the conduct of the organisation.
The Company’ s business and activities have to be carried out in a transparent, honest and fair way, in good faith and in full compliance. Any form of discrimination, corruption, forced or child labor is rejected. Particular attention is paid to the acknowledgment and safeguarding of the dignity, freedom and equality of human beings.
All employees, without any distinction or exception whatsoever, respect the principles and contents of the Code in their actions and behaviors while performing their functions according to their responsibilities, because compliance with the Code is fundamental for the quality of their working and professional performance. Relationships among employees, at all levels, must be characterised by honesty, fairness, cooperation, loyalty and mutual respect.
The belief that one is acting in favor or to the advantage of the Company can never, in any way, justify – not even in part – any behavior that conflicts with the principles and content of the Code.
The Code aims at guiding the “Packages team” with respect to standards of conduct expected in areas where improper activities could result in adverse consequences to the company, harm its reputation or diminish its competitive advantage.
Every employee is expected to adhere to, and firmly inculcate in his / her everyday conduct, this mandatory framework; any contravention or deviation will be regarded as misconduct and may attract disciplinary action in accordance with the Company service rules and relevant laws.
Statement of Ethical PracticesIt is the basic principle of Packages Limited to obey the law of the land and comply with its legal system. Accordingly every director and employee of the company shall obey the law. Any director and employee guilty of violation will be liable to disciplinary consequences because of the violation of his / her duties.
Employees must avoid conflicts of interest between their private financial activities and conduct of Company business.
All business transactions on behalf of Packages Limited must be reflected accordingly in the accounts of the Company. The image and reputation of Packages Limited is determined by the way each and every one of us acts and conducts himself / herself at all times.
We are an equal opportunity employer. Our employees are entitled to a safe and healthy workplace.
Every manager and supervisor shall be responsible to see that there is no violation of laws within his / her area of responsibility which proper supervision could have prevented. The manager and supervisor shall still be responsible if he / she delegates particular tasks.
ANNUAL REPORT OF PACKAGES LIMITED 2015
23

Decade at a Glance
(Rupees in Million) 2015 2014 2013 2012 2011 2010 2009 2008 2007 2006
Assets Employed: Fixed Assets at Cost 10,036 9,835 9,744 9,275 28,472 27,749 26,887 25,789 23,691 18,217 Accumulated Depreciation / Amortisation 6,055 5,973 5,956 5,749 10,057 9,101 7,605 6,323 5,502 4,984 Net Fixed Assets 3,981 3,861 3,788 3,526 18,415 18,649 19,282 19,466 18,189 13,233 Other Non-Current Assets 45,037 47,445 41,122 20,893 16,402 12,442 8,347 8,645 10,413 6,026 Current Assets 7,918 8,548 8,359 7,030 8,841 8,534 7,979 6,923 4,837 3,414 Current Liabilities 4,904 5,130 5,331 4,482 3,442 2,421 1,743 5,617 1,965 2,312 Net Current and Other Non-Current Assets 48,051 50,864 44,150 23,441 21,800 18,555 14,583 9,952 13,285 7,128 Assets of Disposal Group - - - 14,543 - - - - - - Net Assets Employed 52,031 54,725 47,938 41,510 40,215 37,204 33,865 29,418 31,473 20,361
Financed By: Paid up Capital 884 864 844 844 844 844 844 844 734 699 Reserves 45,593 47,567 39,640 28,173 26,666 24,480 20,967 15,429 17,437 12,974 Preference Shares / Convertible stock reserve 1,310 1,572 1,606 1,606 1,606 1,606 1,606 - - - Shareholder’s Equity 47,786 50,003 42,090 30,623 29,115 26,930 23,417 16,273 18,171 13,673 Deferred Liabilities 488 467 654 748 2,525 2,317 2,478 841 956 688 Long Term Finances 3,757 4,255 5,195 4,471 8,575 7,956 7,971 12,304 12,347 6,000 Total Non-Current Liabilities 4,245 4,722 5,848 5,219 11,100 10,274 10,448 13,145 13,302 6,688 Liabilities of Disposal Group - - - 5,669 - - - - - - Total Funds Invested 52,031 54,725 47,938 41,510 40,215 37,204 33,865 29,418 31,473 20,361
Invoiced Sales - Gross 18,711 17,627 17,314* 13,871* 13,797* 21,837 16,533 14,301 10,540 9,028 Materials Consumed 9,005 9,131 9,131* 7,407* 7,282* 10,211 8,685 7,639 5,108 4,247 Cost of Goods Sold 12,664 12,873 12,893* 10,270* 10,071* 17,733 13,736 11,281 7,829 6,552 Gross Profit 3,361 2,215 1,995* 1,475* 1,315* 803 307 943 1,199 1,295Employees Remuneration 1,732 1,521 1,363* 1,018* 912* 1,502 1,229 1,033 835 758 Profit / (loss) from Operations 1,828 947 997* 1,011* 872* (104) (384) 405 588 758 Profit / (loss) before Tax 3,803 2,750 2,194* 2,378* 1,037* (317) 5,770 (308) 4,633 6,348 Profit / (loss) after Tax 3,295 2,536 1,796* 1,488* 161* (332) 4,064 (196) 4,326 6,101 EBITDA (from operations) 2,497 1,383 1,268* 1,103* 896* 1,242 719 955 1,167 1,098
Key Ratios: Profitability Gross Profit Ratio (%) 20.98 14.68 13.40* 12.56* 11.55* 4.33 2.19 7.72 13.28 16.50 Profit before Tax (%) 23.73 18.22 14.74* 20.25* 9.11* (1.71) 41.08 (2.52) 51.31 80.90 EBITDA Margin to Sales (%) 15.58 9.16 8.51* 9.40* 7.87* 6.70 5.12 7.81 12.93 14.00 Total Assets Turnover Ratio 0.28 0.25 0.28* 0.37* 0.26* 0.47 0.39 0.35 0.27 0.35 Fixed Assets Turnover Ratio 4.27 4.18 4.35* 3.75* 0.62* 1.04 0.73 1.08 0.87 2.54
Liquidity Current Ratio 1.61 1.67 1.57 1.57 2.57 3.52 4.58 1.23 2.46 1.48 Quick Ratio 1.15 1.13 1.07 1.03 0.96 1.57 1.72 0.43 0.97 0.55
Gearing Debt : Equity Ratio 8:92 8:92 11:89 15:85 24:76 23:77 25:75 44:56 40:60 30:70 Return on Equity (%) 6.90 5.07 4.27* 4.85* 0.55* (1.23) (13.05) (1.20) 4.39 14.80
Investment Basic EPS (Rs.) 37.42 29.89 21.28* 17.64* 1.90* (3.94) 48.16 (2.32) 58.96 87.30 Diluted EPS (Rs.) 33.62 26.59 20.01* 17.09* 1.90* (3.94) 44.72 (2.32) - - Price - Earning Ratio 15.56 22.70 12.81* 8.57* 43.43* (32.65) 2.99 (34.98) 6.17 2.41 Interest Cover Ratio 7.08 4.67 3.61* 5.52* 3.16* 0.74 5.55 0.81 13.84 92.93 Dividend Yield (%) 2.58 1.32 2.93 2.98 1.81 2.53 2.26 - - 2.86 Dividend Cover Ratio 2.46 3.23 2.66* 3.92* 1.27* (1.21) 14.82 - - 14.55 Cash Dividend % 150.00 90.00 80.00 45.00 15.00 32.50 32.50 - - 60.00 Stock Dividend % - - - - - - - - 15.00 5.00 Break-up Value per Ordinary share (Rs.) 519.99 554.26 479.78 343.89 326.02 300.12 258.49 192.85 247.65 195.66 Market Value per Ordinary Share - Year End (Rs.) 582.11 678.29 272.63 151.16 82.72 128.61 144.00 81.19 363.80 210.00 Cash Dividend per Share 15.00 9.00 8.00 4.50 1.50 3.25 3.25 - - 6.00 * Represents continuing operation** Excluding effect of capital gain and reversal of impairment / (impairment loss) on available for sale financial assets, if any
24

(Rupees in Million) 2015 2014 2013 2012 2011 2010 2009 2008 2007 2006
Assets Employed: Fixed Assets at Cost 10,036 9,835 9,744 9,275 28,472 27,749 26,887 25,789 23,691 18,217 Accumulated Depreciation / Amortisation 6,055 5,973 5,956 5,749 10,057 9,101 7,605 6,323 5,502 4,984 Net Fixed Assets 3,981 3,861 3,788 3,526 18,415 18,649 19,282 19,466 18,189 13,233 Other Non-Current Assets 45,037 47,445 41,122 20,893 16,402 12,442 8,347 8,645 10,413 6,026 Current Assets 7,918 8,548 8,359 7,030 8,841 8,534 7,979 6,923 4,837 3,414 Current Liabilities 4,904 5,130 5,331 4,482 3,442 2,421 1,743 5,617 1,965 2,312 Net Current and Other Non-Current Assets 48,051 50,864 44,150 23,441 21,800 18,555 14,583 9,952 13,285 7,128 Assets of Disposal Group - - - 14,543 - - - - - - Net Assets Employed 52,031 54,725 47,938 41,510 40,215 37,204 33,865 29,418 31,473 20,361
Financed By: Paid up Capital 884 864 844 844 844 844 844 844 734 699 Reserves 45,593 47,567 39,640 28,173 26,666 24,480 20,967 15,429 17,437 12,974 Preference Shares / Convertible stock reserve 1,310 1,572 1,606 1,606 1,606 1,606 1,606 - - - Shareholder’s Equity 47,786 50,003 42,090 30,623 29,115 26,930 23,417 16,273 18,171 13,673 Deferred Liabilities 488 467 654 748 2,525 2,317 2,478 841 956 688 Long Term Finances 3,757 4,255 5,195 4,471 8,575 7,956 7,971 12,304 12,347 6,000 Total Non-Current Liabilities 4,245 4,722 5,848 5,219 11,100 10,274 10,448 13,145 13,302 6,688 Liabilities of Disposal Group - - - 5,669 - - - - - - Total Funds Invested 52,031 54,725 47,938 41,510 40,215 37,204 33,865 29,418 31,473 20,361
Invoiced Sales - Gross 18,711 17,627 17,314* 13,871* 13,797* 21,837 16,533 14,301 10,540 9,028 Materials Consumed 9,005 9,131 9,131* 7,407* 7,282* 10,211 8,685 7,639 5,108 4,247 Cost of Goods Sold 12,664 12,873 12,893* 10,270* 10,071* 17,733 13,736 11,281 7,829 6,552 Gross Profit 3,361 2,215 1,995* 1,475* 1,315* 803 307 943 1,199 1,295Employees Remuneration 1,732 1,521 1,363* 1,018* 912* 1,502 1,229 1,033 835 758 Profit / (loss) from Operations 1,828 947 997* 1,011* 872* (104) (384) 405 588 758 Profit / (loss) before Tax 3,803 2,750 2,194* 2,378* 1,037* (317) 5,770 (308) 4,633 6,348 Profit / (loss) after Tax 3,295 2,536 1,796* 1,488* 161* (332) 4,064 (196) 4,326 6,101 EBITDA (from operations) 2,497 1,383 1,268* 1,103* 896* 1,242 719 955 1,167 1,098
Key Ratios: Profitability Gross Profit Ratio (%) 20.98 14.68 13.40* 12.56* 11.55* 4.33 2.19 7.72 13.28 16.50 Profit before Tax (%) 23.73 18.22 14.74* 20.25* 9.11* (1.71) 41.08 (2.52) 51.31 80.90 EBITDA Margin to Sales (%) 15.58 9.16 8.51* 9.40* 7.87* 6.70 5.12 7.81 12.93 14.00 Total Assets Turnover Ratio 0.28 0.25 0.28* 0.37* 0.26* 0.47 0.39 0.35 0.27 0.35 Fixed Assets Turnover Ratio 4.27 4.18 4.35* 3.75* 0.62* 1.04 0.73 1.08 0.87 2.54
Liquidity Current Ratio 1.61 1.67 1.57 1.57 2.57 3.52 4.58 1.23 2.46 1.48 Quick Ratio 1.15 1.13 1.07 1.03 0.96 1.57 1.72 0.43 0.97 0.55
Gearing Debt : Equity Ratio 8:92 8:92 11:89 15:85 24:76 23:77 25:75 44:56 40:60 30:70 Return on Equity (%) 6.90 5.07 4.27* 4.85* 0.55* (1.23) (13.05) (1.20) 4.39 14.80
Investment Basic EPS (Rs.) 37.42 29.89 21.28* 17.64* 1.90* (3.94) 48.16 (2.32) 58.96 87.30 Diluted EPS (Rs.) 33.62 26.59 20.01* 17.09* 1.90* (3.94) 44.72 (2.32) - - Price - Earning Ratio 15.56 22.70 12.81* 8.57* 43.43* (32.65) 2.99 (34.98) 6.17 2.41 Interest Cover Ratio 7.08 4.67 3.61* 5.52* 3.16* 0.74 5.55 0.81 13.84 92.93 Dividend Yield (%) 2.58 1.32 2.93 2.98 1.81 2.53 2.26 - - 2.86 Dividend Cover Ratio 2.46 3.23 2.66* 3.92* 1.27* (1.21) 14.82 - - 14.55 Cash Dividend % 150.00 90.00 80.00 45.00 15.00 32.50 32.50 - - 60.00 Stock Dividend % - - - - - - - - 15.00 5.00 Break-up Value per Ordinary share (Rs.) 519.99 554.26 479.78 343.89 326.02 300.12 258.49 192.85 247.65 195.66 Market Value per Ordinary Share - Year End (Rs.) 582.11 678.29 272.63 151.16 82.72 128.61 144.00 81.19 363.80 210.00 Cash Dividend per Share 15.00 9.00 8.00 4.50 1.50 3.25 3.25 - - 6.00 * Represents continuing operation** Excluding effect of capital gain and reversal of impairment / (impairment loss) on available for sale financial assets, if any
** ** ******
** ** **
ANNUAL REPORT OF PACKAGES LIMITED 2015
25

Horizontal & Vertical Analysis
2015 15 vs 14 2014 14 vs 13 2013 13 vs 12 2012 12 vs 11 2011 11 vs 10 2010 Re-stated Re-stated Equity & Liabilities Rs. % Rs. % Rs. % Rs. % Rs. % Rs.
Share Capital & Reserves Issued, subscribed and paid up capital 884 2.34 864 2.35 844 - 844 - 844 - 844Reserves 41,878 (6.45) 44,766 17.64 38,054 22.46 31,075 10.28 28,179 16.35 24,219 Preference shares / convertible stock reserve 1,310 (16.65) 1,572 (2.14) 1,606 - 1,606 - 1,606 - 1,606 Unappropriated profit / (loss) 3,715 32.64 2,801 76.60 1,586 (154.65) (2,902) 91.80 (1,513) (679.69) 261
Non-Current Liabilities Long term finances 3,729 (11.81) 4,229 (18.20) 5,170 15.63 4,471 (47.86) 8,575 7.77 7,957Deferred tax 246 (15.95) 293 (42.92) 513 60.31 320 (83.64) 1,956 (9.78) 2,168 Liabilities against assets subject to finance lease 28 7.66 26 7.02 24 100.00 - - - - - Retirement benefits 40 100.00 - (100.00) 1 (99.81) 307 (24.57) 407 243,612.57 0.17 Deferred liabilities 202 15.46 175 24.70 140 15.70 121 (25.31) 162 8.72 149
Current Liabilities Current portion of long-term liabilities 392 91.64 205 0.34 204 (79.60) 1,000 162.47 381 2,621.43 14 Finances under mark up arrangements - secured 884 (29.95) 1,263 (16.83) 1,518 87.64 809 1.63 796 464.54 141 Derivative financial instruments - - - (100.00) 27 (83.64) 165 100.00 - - - Trade and other payables 3,278 4.24 3,145 3.04 3,052 54.38 1,977 14.21 1,731 (3.51) 1,794 Accrued finance cost 349 (32.52) 518 (2.33) 530 - 530 (0.75) 534 13.14 472 Liabilities directly associated with non-current assets classified as held-for-sale - - - - - (100.00) 5,669 100.00 - - -Total 56,936 (4.88) 59,854 12.36 53,269 15.82 45,992 5.35 43,658 10.18 39,625
VERTICAL ANALYSIS(Rupees in Million ) 2015 2014 2013 2012 2011 2010 Re-stated Re-stated Equity & Liabilities Rs. % Rs. % Rs. % Rs. % Rs. % Rs. %
Share Capital & Reserves Issued, subscribed and paid up capital 884 1.55 864 1.44 844 1.58 844 1.84 844 1.93 844 2.13Reserves 41,878 73.55 44,766 74.79 38,054 71.44 31,075 67.57 28,179 64.54 24,219 61.12 Preference shares / convertible stock reserve 1,310 2.30 1,572 2.63 1,606 3.01 1,606 3.49 1,606 3.68 1,606 4.05 Unappropriated profit / (loss) 3,715 6.52 2,801 4.68 1,586 2.98 (2,902) (6.31) (1,513) (3.47) 261 0.66 Non-Current Liabilities Long term finances 3,729 6.55 4,229 7.07 5,170 9.71 4,471 9.72 8,575 19.64 7,957 20.08 Deferred tax 246 0.43 293 0.49 513 0.96 320 0.70 1,956 4.48 2,168 5.47 Liabilities against assets subject to finance lease 28 0.05 26 0.04 24 0.05 - - - - - - Retirement benefits 40 0.07 - - 1 0.00 307 0.67 407 0.93 0.17 0.00 Deferred liabilities 202 0.35 175 0.29 140 0.26 121 0.26 162 0.37 149 0.38 Current Liabilities Current portion of long-term liabilities 392 0.69 205 0.34 204 0.38 1,000 2.17 381 0.87 14 0.04 Finances under mark up arrangements - secured 884 1.55 1,263 2.11 1,518 2.85 809 1.76 796 1.82 141 0.36 Derivative financial instruments - - - - 27 0.05 165 0.36 - - - - Trade and other payables 3,278 5.76 3,145 5.25 3,052 5.73 1,977 4.30 1,731 3.96 1,794 4.53 Accrued finance cost 349 0.61 518 0.86 530 0.99 530 1.15 534 1.22 472 1.19 Liabilities directly associated with non-current assets classified as held-for-sale - - - - - - 5,669 12.33 - - - - Total 56,936 100.00 59,854 100.00 53,269 100.00 45,992 100.00 43,658 100.00 39,625 100.00
Balance SheetHORIZONTAL ANALYSIS(Rupees in Million )
26
0 10,000 20,000 30,000 40,000 50,000 60,000
2015
2014
2012
2013
2011
2010
Share Capital & Reserves Non-Current Liabilities Current Liabilities
Equity and Liabilities (Rupees in Million)
26,930
29,116
30,623 5,219
11,100
10,274 2,421
68% 26% 6%
3,442
67% 25% 8%
10,15067% 11% 22%
42,090 5,848 5,33179% 11% 10%
50,002 4,722 5,13083% 8% 9%
47,787 4,245 4,90484% 7% 9%

2015 15 vs 14 2014 14 vs 13 2013 13 vs 12 2012 12 vs 11 2011 11 vs 10 2010 Re-stated Re-stated Assets Rs. % Rs. % Rs. % Rs. % Rs. % Rs.
Non-current assets Property, plant and equipment 3,804 3.21 3,686 0.57 3,665 5.96 3,459 (81.15) 18,346 (1.45) 18,615Intangible assets 21 (45.45) 37 15.63 32 (21.95) 41 5.13 39 1,850.00 2 Investment property 155 12.63 138 51.65 91 250.00 26 (13.33) 30 (6.25) 32 Investments 44,998 (4.88) 47,304 15.24 41,048 97.38 20,796 27.68 16,288 33.30 12,219 Long term loans and deposits 39 (25.95) 53 (20.90) 67 (30.93) 97 (12.61) 111 (13.95) 129 Retirement benefits - (100.00) 88 1,366.67 6 100.00 - (100.00) 3 (96.84) 95
Current Assets Stores and spares 488 (1.00) 493 (13.36) 569 23.16 462 (52.81) 979 (6.76) 1,050 Stock-in-trade 1,780 (20.21) 2,231 8.04 2,065 8.12 1,910 (57.80) 4,526 23.36 3,669 Trade debts 1,781 16.64 1,527 (5.91) 1,623 (28.82) 2,280 29.25 1,764 7.36 1,643 Loans, advances, deposits, prepayments and other receivables 1,346 (25.09) 1,797 6.27 1,691 309.44 413 (9.23) 455 71.70 265 Income tax receivable 2,421 7.70 2,248 3.31 2,176 35.75 1,603 70.35 941 22.85 766 Cash and bank balances 102 (59.63) 252 6.78 236 (34.81) 362 105.68 176 (84.56) 1,140 Non-current assets classified as held-for-sale - - - - - (100.00) 14,543 100.00 - - - Total 56,936 (4.88) 59,854 12.36 53,269 15.82 45,992 5.35 43,658 10.18 39,625
VERTICAL ANALYSIS(Rupees in Million ) 2015 2014 2013 2012 2011 2010 Re-stated Re-stated Assets Rs. % Rs. % Rs. % Rs. % Rs. % Rs. %
Non-current assets Property, plant and equipment 3,804 6.68 3,686 6.16 3,665 6.88 3,459 7.52 18,346 42.02 18,615 46.97 Intangible assets 21 0.04 37 0.06 32 0.06 41 0.09 39 0.09 2 0.01 Investment property 155 0.27 138 0.23 91 0.17 26 0.06 30 0.07 32 0.08 Investments 44,998 79.03 47,304 79.03 41,048 77.06 20,796 45.22 16,288 37.31 12,219 30.84 Long term loans and deposits 39 0.07 53 0.09 67 0.13 97 0.21 111 0.25 129 0.33 Retirement benefits - - 88 0.15 6 0.01 - - 3 0.01 95 0.24 Current Assets Stores and spares 488 0.86 493 0.82 569 1.07 462 1.00 979 2.24 1,050 2.65 Stock-in-trade 1,780 3.13 2,231 3.73 2,065 3.88 1,910 4.15 4,526 10.37 3,669 9.26 Trade debts 1,781 3.13 1,527 2.55 1,623 3.05 2,280 4.96 1,764 4.04 1,643 4.15 Loans, advances, deposits, prepayments and other receivables 1,346 2.36 1,797 3.00 1,691 3.17 413 0.90 455 1.04 265 0.67 Income tax receivable 2,421 4.25 2,248 3.76 2,176 4.08 1,603 3.49 941 2.16 766 1.93 Cash and bank balances 102 0.18 252 0.42 236 0.44 362 0.79 176 0.40 1,140 2.88 Non-current assets classified as held-for-sale - - - - - - 14,543 31.62 - - - - Total 56,936 100 59,854 100 53,269 100 45,992 100 43,658 100 39,625 100
HORIZONTAL ANALYSIS(Rupees in Million )
ANNUAL REPORT OF PACKAGES LIMITED 2015
27
0 10,000 20,000 30,000 40,000 50,000 60,000
2015
2014
2012
2013
2011
2010
Operating Fixed Assets Other Non - Current Assets Current Assets
Assets (Rupees in Million)
18,649
18,415
3,526 20,893
16,402
12,442 8,534
47% 31% 22%
8,841
42% 38% 20%
21,5738% 45% 47%
3,788 41,121 8,3607% 77% 16%
3,861 47,445 8,548
7% 79% 14%
3,981 45,037 7,918
7% 79% 14%

Horizontal & Vertical Analysis
2015 15 vs 14 2014 14 vs 13 2013 13 vs 12 2012 12 vs 11 2011 11 vs 10 2010 Re-stated Re-stated Rs. % Rs. % Rs. % Rs. % Rs. % Rs.
Continuing operations Local sales 18,683 6.26 17,582 1.95 17,245 24.89 13,808 0.62 13,723 (33.38) 20,598 Export sales 28 (37.70) 45 (34.12) 69 9.52 63 (14.86) 74 (94.03) 1,239 Gross sales 18,711 6.15 17,627 1.81 17,314 24.82 13,871 0.54 13,797 (36.82) 21,837 Sales tax and excise duty (2,657) 5.63 (2,516) 4.60 (2,405) 13.98 (2,110) (11.83) (2,393) (26.75) (3,267)Commission (29) 18.91 (24) 16.49 (21) 31.25 (16) (11.11) (18) (47.06) (34)Net sales 16,025 6.21 15,087 1.34 14,888 26.76 11,745 3.15 11,386 (38.57) 18,536 Cost of sales (12,664) (1.63) (12,873) (0.16) (12,893) 25.54 (10,270) 1.98 (10,071) (43.21) (17,733)Gross profit 3,361 51.79 2,215 11.00 1,995 35.25 1,475 12.17 1,315 63.76 803 Administrative expenses (753) (4.38) (787) 33.89 (588) 82.61 (322) 12.20 (287) (43.84) (511)Distribution and marketing costs (678) 16.87 (580) (1.01) (586) 46.50 (400) 3.63 (386) (33.33) (579)Project expenditure - - - - - - - (100.00) (56) 1,300.00 (4)Other operating expenses (347) 56.38 (222) 44.14 (154) 396.77 (31) 675.00 (4) (73.33) (15)Other operating income 244 (24.25) 322 (2.08) 329 13.84 289 (0.34) 290 43.56 202 Profit / (loss) from operations 1,828 92.91 947 (4.88) 996 (1.48) 1,011 15.94 872 (938.46) (104)Finance costs (643) (14.44) (752) (11.06) (845) 60.04 (528) 9.09 (484) (60.00) (1,210)Investment income 2,618 2.51 2,554 25.00 2,043 33.18 1,534 47.50 1,040 4.31 997 Reversal of impairment / (impairment) on investments - - - - - (100.00) 361 (192.33) (391) 100.00 - Profit / (loss) before tax 3,803 38.30 2,750 25.32 2,194 (7.74) 2,378 129.32 1,037 (427.13) (317)Tax (507) 137.83 (213) (46.43) (398) (55.28) (890) 1.60 (876) 5,740.00 (15)Profit / (loss) for the year from Continuing operations 3,295 29.93 2,536 41.22 1,796 20.70 1,488 824.22 161 (148.49) (332)Loss for the year from Discontinued operations - - - - (249) 93.66 (3,929) (127.24) (1,729) (100.00) - Profit / (loss) for the year 3,295 29.93 2,536 63.95 1,547 163.38 (2,441) (55.68) (1,568) (372.29) (332)Basic earnings / (loss) per share - From Continuing operations 37.42 29.89 21.28 17.64 1.90 - From Discontinued operations - - (2.95) (46.56) (20.48) - From profit / (loss) for the year 37.42 29.89 18.33 (28.92) (18.58) 3.94
Diluted earnings / (loss) per share - From Continuing operations 33.62 26.59 20.01 17.09 1.90 - From Discontinued operations - - (2.95) (46.56) (20.48) - From profit / (loss) for the year 33.62 26.59 17.06 (29.47) (18.58) 3.94 The financial information is based upon audited financial results of the company of respective periods unless represented in accordance with applicable financial reporting framework.
Profit and Loss Account
HORIZONTAL ANALYSIS(Rupees in Million )
28

2015 2014 2013 2012 2011 2010 Re-stated Re-stated Rs. % Rs. % Rs. % Rs. % Rs. % Rs. %
Continuing operations Local sales 18,683 99.85 17,582 99.74 17,245 99.60 13,808 99.55 13,723 99.46 20,598 94.33Export sales 28 0.15 45 0.26 69 0.40 63 0.45 74 0.54 1,239 5.67 Gross sales 18,711 100.00 17,627 100.00 17,314 100.00 13,871 100.00 13,797 100.00 21,837 100.00 Sales tax and excise duty (2,657) (14.20) (2,516) (14.27) (2,405) (13.89) (2,110) (15.21) (2,393) (17.34) (3,267) (14.96)Commission (29) (0.16) (24) (0.14) (21) (0.12) (16) (0.12) (18) (0.13) (34) (0.16)Net sales 16,025 85.64 15,087 85.59 14,888 85.99 11,745 84.67 11,386 82.53 18,536 84.88 Cost of sales (12,664) (67.68) (12,873) (73.03) (12,893) (74.47) (10,270) (74.04) (10,071) (72.99) (17,733) (81.21)Gross profit 3,361 17.96 2,215 12.56 1,995 11.52 1,475 10.63 1,315 9.53 803 3.68 Administrative expenses (753) (4.02) (787) (4.47) (588) (3.40) (322) (2.32) (287) (2.08) (511) (2.34)Distribution and marketing costs (678) (3.62) (580) (3.29) (586) (3.38) (400) (2.88) (386) (2.80) (579) (2.65)Project expenditure - - - - - - - - (56) (0.41) (4) (0.02)Other operating expenses (347) (1.86) (222) (1.26) (154) (0.89) (31) (0.22) (4) (0.03) (15) (0.07)Other operating income 244 1.30 322 1.83 329 1.90 289 2.08 290 2.10 202 0.93 Profit / (loss) from operations 1,828 9.77 947 5.37 996 5.75 1,011 7.29 872 6.32 (104) (0.48)Finance costs (643) (3.44) (752) (4.26) (845) (4.88) (528) (3.81) (484) (3.51) (1,210) (5.54)Investment income 2,618 13.99 2,554 14.49 2,043 11.80 1,534 11.06 1,040 7.54 997 4.57 Reversal of impairment / (impairment) on investments - - - - - - 361 2.60 (391) (2.83) - - *Profit / (loss) before tax 3,803 20.32 2,750 15.60 2,194 12.67 2,378 17.14 1,037 7.52 (317) (1.45)Tax (507) (2.71) (213) (1.21) (398) (2.30) (890) (6.42) (876) (6.35) (15) (0.07)Profit / (loss) for the year from Continuing operations 3,295 17.61 2,536 14.39 1,796 10.37 1,488 10.73 161 1.17 (332) (1.52)Loss for the year from Discontinued operations - - - - (249) - (3,929) - (1,729) - - Profit / (loss) for the year 3,295 17.61 2,536 14.39 1,547 8.93 (2,441) (17.60) (1,568) (11.36) (332) (1.52)Basic earnings/ (loss) per share - From Continuing operations 37.42 29.89 21.28 17.64 1.90 - From Discontinued operations - - (2.95) (46.56) (20.48) - From profit / (loss) for the year 37.42 29.89 18.33 (28.92) (18.58) 3.94
Diluted earnings / (loss) per share - From Continuing operations 33.62 26.59 20.01 17.09 1.90 - From Discontinued operations - - (2.95) (46.56) (20.48) - From profit / (loss) for the year 33.62 26.59 17.06 (29.47) (18.58) 3.94 The financial information is based upon audited financial results of the company of respective periods unless represented in accordance with applicable financial reporting framework.
VERTICAL ANALYSIS(Rupees in Million )
ANNUAL REPORT OF PACKAGES LIMITED 2015
29
0 10 20 30 40 50 60 70 80 90 100
2015
2014
2012*
2013*
2011*
2010
Materials Consumed Fuel & Power Depreciation & Amortisation
Cost of Sales (Other Components) Selling & Administrative Expenses Financial Costs & Other Charges *Represents Continuing Operations only
Profit and Loss - Breakup of Major Expenses as % of Sales
47%
53%
53%
53%
52%
49%
6%
4%
4%
6%
6%
5%
5%
5%
7%
8%
8%
14% 5%
12%
11%
13%
14%
12%
14%
5%
7%
5%
5%
5%
7%
2%
3%
3%
2%
2%

Value Added and Its Distribution
(Rupees in thousand) 2015 2014 2013 Wealth Generated
Sales 18,711,298 17,627,358 20,712,895 Dividend Income 2,617,891 2,553,678 2,043,111 Other Income 244,022 322,147 380,164
21,573,211 100% 20,503,183 100% 23,136,170 100%
Wealth Distributed
Bought-in-materials & Services 14,358,651 67% 14,481,180 71% 17,439,557 75%
To Employees Remuneration, benefits and facilities 1,732,494 8% 1,520,773 7% 1,632,963 7%
To Government Income Tax, Sales Tax, Custom & Excise Duties, Workers’ Funds, EOBI & Social Security Contribution, Professional & Local Taxes 1,448,365 7% 1,159,540 6% 1,405,733 6% To Providers of Capital Cash dividend to the ordinary shareholders 1,340,693 6% 786,416 4% 675,036 3%Finance Costs 643,032 3% 751,551 4% 1,090,129 5%
Retained for Reinvestment & Future Growth / (Utilized from reserves) 2,049,976 9% 1,803,723 8% 892,752 4%
21,573,211 100% 20,503,183 100% 23,136,170 100%
Bought-in-materials & services
Retained for re-investment & future growth
Finance cost
Shareholders
Government
Employees
Wealth Generated & Distribution - 2015 (Percentage)
8%
7%
6%
3%
9%
67%
Bought-in-materials & services
Retained for reinvestment & future growth
Finance cost
Shareholders
Government
Employees
Wealth Generated & Distribution - 2014 (Percentage)
7%6%
4%
4%
8%
71%
The statement below shows value added by the operations of the Company and its distribution to the stakeholders
30

Sources and Application of Funds
(Rupees in thousand) 2015 2014 2013 2012 2011 2010
Cash flow from operating activities
Cash generated from / (used in) operations 3,182,034 1,432,406 2,530,095 395,637 (810,780) 2,048,790
Finance costs paid (811,384) (764,241) (1,090,306) (1,509,395) (1,423,001) (988,292)
Taxes paid (686,226) (535,873) (548,880) (758,677) (431,528) (490,263)
Payments for accumulating compensated absences (23,533) (17,079) (81,855) (28,670) (10,524) (16,805)
Retirement benefits paid (15,329) (13,450) (320,767) (73,960) (62,831) (50,488)
Net cash generated from / (used in) operating activities 1,645,562 101,763 488,287 (1,975,065) (2,738,664) 502,942
Cash flow from investing activities
Fixed capital expenditure (713,480) (629,738) (824,797) (1,234,627) (1,225,371) (633,758)
Investment - net (2,437,175) (600,000) (2,274,953) 4 3,035 50,968
Net decrease in long-term loans and deposits 13,311 14,448 11,499 13,768 17,556 11,148
Proceeds from disposal of property, plant and equipment 91,023 106,792 69,982 113,764 190,023 25,034
Proceeds from assets written off due to fire - - 102,003 233,463 384,563 -
Dividends received 2,617,891 2,553,678 2,043,111 1,534,440 1,037,255 946,292
Net cash (used in) / generated from investing activities (428,430) 1,445,180 (873,155) 660,812 407,061 399,684
Cash flow from financing activities
Re-payment of long-term finances - secured (200,000) (600,000) (1,100,000) (5,485,714) (14,286) -
Proceeds from long-term finances - - 1,000,000 2,000,000 1,000,000 -
Liabilities against assets subject to finance lease - net (7,038) (3,599) 27,884 - - -
Dividend paid (782,731) (671,684) (378,218) (126,044) (273,574) (272,938)
Net cash (used in) / generated from financing activities (989,769) (1,275,283) (450,334) (3,611,758) 712,140 (272,938)
Net increase / (decrease) in cash and cash equivalents 227,363 271,660 (835,202) (4,926,011) (1,619,463) 629,688
Cash and cash equivalents at the beginning of the year (1,010,104) (1,281,764) (5,546,562) (620,551) 998,912 369,224
Cash and cash equivalents transferred to joint venture - - 5,100,000 - - -
Cash and cash equivalents at the end of the year (782,741) (1,010,104) (1,281,764) (5,546,562) (620,551) 998,912
Operating Activities (Rupees in Million)
-3,000
-2,500
-2,000
-1,500
-1,000
-500
0
500
1,000
1,500
2,000
201520142013201220112010
503
(2,739)
(1,975)
488
102
1,646
Investing Activities (Rupees in Million)
-900
-600
-300
0
300
600
900
1,200
1,500
201520142013201220112010
400 407
661
(873)
1,445
(428)
Financing Activities (Rupees in Million)
-4,000
-3,500
-3,000
-2,500
-2,000
-1,500
-1,000
-500
0
500
1,000
201520142013201220112010
(273)
712
(3,612)
(450)
(1,275)
(990)
Over the last six years
ANNUAL REPORT OF PACKAGES LIMITED 2015
31

Corporate Social Responsibility
Packages Limited recognises the importance of being a good corporate citizen in the conduct of its business as well as fulfilling its corporate and social obligations. We have always acknowledged our social responsibility to the health and well-being of the communities in which we operate. We are committed to the principle of ‘giving back to the society’.
Our commitment to our stakeholders and the community are exemplified through our Corporate Social Responsibility (CSR) activities.
EnvironmentWe are a member of the global network of green offices project of the World Wide Fund for Nature, and the first company in Pakistan to be awarded Green Office diploma in the manufacturing sector. Green Office is an environmental service for / by offices. With its help, work places are able to reduce their burden on the environment, achieve savings and slow down environmental changes.
We have phased out Chloro Fluoro Carbons (CFCs) according to Montreal Protocol and have been consistently reducing the consumption of Hydro Chloro Fluoro Carbons (HCFCs) by replacing them with approved gases to curtail our contribution to the greenhouse effect.
We routinely conduct energy audits to identify projects that can efficiently use, reduce or recycle energy. Replacement of factory’s
conventional lights with energy efficient & environment friendly lights is an ongoing process as is installation of solar panels. Lux Monitoring and Motion Sensors are also being installed in phases to reduce energy cost. Lux sensors are being used to measure the amount of available daylight and adjust the light levels accordingly to reduce unnecessary energy consumption by utilising natural light resources while ensuring appropriate light levels are maintained.
32

Through these activities, we demonstrate our commitment to the community to protect the environment.
Health and SafetyEnsuring the protection of the health and well-being of our employees, customers and the communities in which we operate is an ongoing process and has always been one of our chief concerns.
Our main procedures in safety include comprehensive risk assessment and controls, permit to work, log out tag out, near miss reporting, incident reporting, emergency response, and compliance evaluation procedures. All newly hired employees go through safety orientation programs and sign an affidavit of their awareness. We routinely conduct trainings, both internal and external, regarding occupational health and safety, dengue prevention, road safety, safe removal of waste, first aid and fire safety. In 2015, amongst other trainings, an EHS awareness theater production was carried out for our employees to create awareness about the importance of environment and health related issues through a candid and relatable platform. During the year, road safety violation tickets (within the factory) were introduced as well as area specific hazard and control posters.
We became certified for Food Safety System Certification (FSSC). FSSC is part of the world’s fastest growing Global Food Safety Initiative (GFSI) certification program accredited by The Consumer Goods Forum. Through this system, we ensure that the packaging material and tissue we manufacture is procured, processed,
stored and transported by adopting and implementing the hygiene standards and controls. We have also acquired ‘Halal Certification’ from South African National Halal Authority (S.A.N.H.A).
We are also making progress in our focus areas of behavior based safety and controlling risks with engineering as well as administrative controls and thus minimising the risk of injuries and accidents.
SocietyWe firmly believe that for an organisation to be successful and for it to create value for its shareholders, it must also create value for its society. We consider it our responsibility to make sustainable positive impact on the communities in which we operate. Whether it’s through the grants we provide to various organizations that share our mission or through the inspiring volunteer efforts, we are passionate about helping people live better.
We strive to contribute to societal welfare through providing educational opportunities,
employment, sponsoring various events, promoting culture, arts and awareness campaigns.
Community Welfare SchemesIn our 58 years as a corporate citizen, we have consistently and consciously tried to make a difference in the society by our corporate giving, assistance in community development and supporting groups; aiming for a progressive social change and the up-lift of the community at large. During the year, we formed ‘Packages Foundation’ through which we have offered our contributions and assistance to a number of hospitals and trusts and various non-profit organizations.
Rose FestivalEvery spring more than three hundred types of roses welcome our esteemed guests to the ‘The Packages Rose Festival’. The vividly decorated gardens are graced by the presence of our customers, vendors, employees and guests from the local community. Another essential attraction in this famous event is the spectacular display of different types of peacocks.
ANNUAL REPORT OF PACKAGES LIMITED 2015
33
Promoting Traditional ‘Mela’ CultureWe always look forward to arranging different events to promote traditional activities within the society. ‘Mela’ is one of such activities which we have been organizing for the last many years. The objective of this event is to provide traditional entertainment to the family members of our employees and the residents of our vicinity. More than 1,000 families participate in the event every year.
Sports Activities“Health is the thing that makes you feel that now is the best time of the year” – we at Packages believe that mental exertion must be balanced by physical activity; resultantly promotion of sports has always played a vital role in our CSR initiatives. To carry out all these sports activities, we have an in house sports complex. Some of the activities that aim to promote sports at grass root level within the country are:
• Jaffar Memorial Inter School Hockey Tournament
• Babar Ali Foundation Inter School Football Tournament
• Babar Ali Foundation Inter School Hockey Tournament for Girls
In addition, we offer sports facilities for our employees as well. Everyyear, inter-departmental tournament starts the sports year of Packages and ends with the annual sports day celebrations. These sports activities also provide a platform to the employees to become part of the Packages Sports Teams which represents the Company in different sports competitions.
Human CapitalOur people are our greatest asset. We are committed to attracting, retaining and developing the highest quality and most dedicated work force. We strive to hire and promote people on the basis of their qualifications, performance and abilities, and are determined to provide equal opportunities to our employees and a work environment free of any form of discrimination.
TrainingsEmployee training needs are periodically reviewed, and various in-house and customised training programs are arranged as needed for production, marketing, human resource, supply management and finance personnel.
During the year, the Company has launched an online learning management system. This system is designed to allow employees easy access to available internal and external trainings being arranged by the management. The training calendar is published at the beginning of the year so that employees may plan their attendance in advance.
The Company also holds a recreational training at the end of each year primarily for sales team and allied personnel from various departments as a team building exercise and to freshen up the employees after the whole year’s hard work.
The objective of these programs is to develop human resource and provide personnel with the necessary technical and soft skills to enhance performance and prepare individuals for higher roles and responsibilities.
Fair Price ShopWe have established a fair price shop for our employees to facilitate them in the purchase of their grocery items. We provide subsidy on purchase of pulses for the workers. Fair Price shop is also offering other general stores and clothing items on no profit no loss basis to employees.
ScholarshipsWe offer merit scholarships to the children of our employees to appreciate their talent and promote healthy competition in the form of monitory re-imbursements that vary with the level of education.
Hajj FacilityEvery year, Packages has the privilege to send 10 of its employees for Hajj through ballot. This includes 7 employees from non-executive staff and 3 from executive and management staff. We bear all expenses of these employees pertaining to this religious offering.
Long Service AwardsEvery year, as a token of appreciation for the continued association with us, we give awards to our employees who achieve a significant milestone of service years.
Corporate Social Responsibility
34

Corporate Calendar
Major Events and Meetings Date
Audit Committee and BOD meetings to consider annual accounts of the Company for the year ended December 31, 2014 February 25, 2015
Annual General Meeting of shareholders to consider annual accounts of the Company for the year ended December 31, 2014 and dividend announcement April 16, 2015
Audit Committee and BOD meetings to consider quarterly accounts of the Company for the quarter ended March 31, 2015 and to consider approval to start 50/50 joint venture with Omya Group of Switzerland April 22, 2015
Completion of the acquisition of 55% shareholding of Flexible Packages Convertors (Proprietary) Limited June 01, 2015
Audit Committee meeting to consider half yearly accounts of the Company for the period ended June 30, 2015 August 19, 2015
BOD meeting to consider half yearly accounts of the Company for the period ended June 30, 2015 August 20, 2015
Audit Committee and BOD meetings to consider quarterly accounts of the Company for the period ended September 30, 2015 October 19, 2015
Incorporation of CalciPack (Private) Limited as a wholly-owned subsidiary of Packages Limited November 13, 2015
BOD meeting to consider approval of investment in the right shares offered by Tri-Pack Films Limited December 30, 2015
ANNUAL REPORT OF PACKAGES LIMITED 2015
35

Notice of Annual General Meeting
Notice is hereby given that the 61st Annual General Meeting of Packages Limited will be held on Monday, April 25, 2016 at 10.30 a.m. at the Beach Luxury Hotel, Moulvi Tamizuddin Khan Road, Karachi to transact the following business:
1. To confirm the minutes of the Extraordinary General Meeting of the Company held on January 21, 2016;
2. To receive and adopt the Audited Accounts of the Company for the year ended December 31, 2015 together with the Directors and Auditors Reports thereon;
3. To consider and approve the payment of cash dividend for the year ended December 31, 2015 as recommended by the Board of Directors:
a) to the preference share/convertible stock holder (International Finance Corporation) at the rate of Rs. 19.00 (10%) per
preference share/convertible stock of Rs. 190 in terms of the Subscription Agreement between Packages Limited and International Finance Corporation;
b) to the ordinary shareholders at the rate of Rs. 15.00 (150%) per ordinary share of Rs. 10; and
4. To appoint Auditors for the year 2016 and to fix their remuneration
Karachi February 25, 2016
By Order of the Board
Adi J. CawasjiCompany Secretary
36

Notes:
1. Closure of Share Transfer Books
The Share Transfer Books of the Company will remain closed from April 18, 2016 to April 25, 2016 (both days inclusive). Transfers received in order at the office of the Company’s Registrars, Messrs FAMCO ASSOCIATES (PVT.) LIMITED, 8-F, Next to Hotel Faran, Nursery, Block 6, P.E.C.H.S., Shahrah-e-Faisal, Karachi-75400 by close of business on April 15, 2016 will be treated in time for payment of the final dividend to the transferees.
2. Participation in the Annual General Meeting
All members entitled to attend and vote at the Meeting, are entitled to appoint another person in writing as their proxy to attend and vote on their behalf. A proxy need not be a member of the Company. A corporate entity, being a member, may appoint any person, regardless whether they are a member or not, as
its proxy. In case of corporate entities, a resolution of the Board of Directors / Power of Attorney with specimen signature of the person nominated to represent and vote on behalf of the corporate entity, shall be submitted to the Company along with a completed proxy form. The proxy holders are requested to produce their national CNICs or original passports at the time of the Meeting.
In order to be effective, duly completed and signed proxy forms must be received at the Company’s Registered Office at 4th Floor, The Forum, Suite # 416-
422, G-20, Block 9, Khayaban-e-Jami, Clifton, Karachi-75600 at least 48 hours before the time of the Meeting.
3. Notice to Shareholders who have not provided their CNICs
As directed by the SECP through its Circular No.EMD/D-II/Misc/2009-1342 dated April 4, 2013, dividend warrants cannot be issued without valid CNICs. All shareholders holding physical shares who have not submitted their valid CNICs are requested to send attested copies of their valid CNICs along with their folio numbers to the Company’s Shares Registrar. In the absence of a shareholder’s valid CNIC, the Company will be constrained to withhold dispatch of dividend to such shareholders.
4. Deduction of Income Tax from Dividend
(i) The Government of Pakistan through Finance Act, 2015 has made certain amendments in Section 150 of the Income Tax Ordinance, 2001 whereby different rates are prescribed for deduction of withholding tax on the amount of dividend paid by the companies. These tax rates are as under:
(a) For filers of income tax returns: 12.5%
(b) For non-filers of income tax
returns: 17.5 % To enable the Company to make
tax deduction on the amount of cash dividend @12.5% instead of 17.5%, all the shareholders whose names are not entered
into the Active Tax-payers List (ATL) provided on the website of FBR, despite the fact that they are filers, are advised to make sure that their names are entered into ATL, otherwise tax on their cash dividend will be deducted @17.5% instead @12.5%.
(ii) For any query/problem/information, the investors may contact the company and/or the Share Registrar at the following phone numbers or email addresses:-
Contact persons: Mr. S.M. Munawar Moosvi Tel. # 92 21 35831618 / 35831664
/ 35833011 Email: munawar.moosvi@
packages.com.pk Mr. Ovais Khan Tel. # 92 21 34380101-2 Email: [email protected]
(iii) The corporate shareholders having CDC accounts are required to have their National Tax Number (NTN) updated with their respective participants, whereas corporate physical shareholders should send a copy of their NTN certificate to the company or its Share Registrar i.e. Messrs FAMCO ASSOCIATES (PVT.) LIMITED. The shareholders while sending NTN or NTN certificates, as the case may be, must quote company name and their respective folio numbers.
5. Payment of Dividend Electronically (E-Mandate)
In order to enable a more efficient method of cash dividend, through its Circular No.8(4) SM/CDC 2008 of April 5, 2013, the SECP has announced
ANNUAL REPORT OF PACKAGES LIMITED 2015
37

an e-dividend mechanism where shareholders can get their dividend credited directly into their respective bank accounts electronically by authorising the Company to do so. Accordingly, all non-CDC shareholders are requested to send their bank account details to the Company’s Registrar. Shareholders who hold shares with CDC or Participants / Stock Brokers, are advised to provide the mandate to CDC or their Participants / Stock Brokers.
6. Audited Financial Statements through E-Mail
SECP through its Notification SRO 787(I)/2014 dated September 8, 2014, has allowed the circulation of Audited Financial Statements along with the Notice of Annual General Meeting to the members of the Company through email. Therefore, all members who wish to receive the soft copy of Annual Report are requested to send their email addresses. The consent form for electronic transmission can be downloaded from the Company’s website:
www.packages.com.pk
The Company shall, however, provide hard copy of the Audited Financial Statements to its shareholders, on request, free of cost, within seven days of receipt of such request.
The Company shall place the financial statements and reports on the Company’s website: www.packages.com.pk at least twenty one (21) days prior to the date of the Annual General Meeting in terms of SRO 634(I)/2014 dated July 10, 2014 issued by the SECP.
7. Change of Address and Non-Deduction of Zakat Declaration Form
Physical shareholders are requested to notify any change in their addresses immediately and if applicable provide their non-deduction of Zakat Declaration Form to the Company’s Shares Registrar, Messrs FAMCO ASSOCIATES (PVT.) LIMITED. Furthermore, if not provided earlier, members holding shares in CDC / Participants accounts are also requested to update their addresses and if applicable, to provide their non-deduction of Zakat Declaration Form to CDC or their Participants / Stock Brokers.
8. Video Conference Facility Form (English and Urdu) is
attached in the Annual Report. Please fill out and submit to registered address of the Company 10 days before holding of the Annual General Meeting.
If the Company receives consent from members holding in aggregate 10% or more shareholding residing at a geographical location, to participate in the meeting through video conference at least 10 days prior to date of meeting, the Company will arrange video conference facility in the city subject to availability of such facility in that city.
The Company will intimate members regarding venue of video conference facility at least 5 days before the date of the Annual General Meeting along with complete information necessary to enable them to access the facility.
9. Guidelines for CDC Account Holders
CDC account holders will have to follow the guidelines with respect to attending the Meeting and appointing of Proxies as issued by the Securities and Exchange Commission of Pakistan through its Circular 1 of January 26, 2000.
10. Form of Proxy Form of proxy in English and
Urdu is attached in the Annual Report and should be witnessed by two persons whose names, addresses and CNIC Numbers are mentioned on the forms.
Notice of Annual General Meeting
38

ANNUAL REPORT OF PACKAGES LIMITED 2015
39

Directors’ Report to the Shareholders
The Directors of the Company have the pleasure in submitting their Annual Report along with the audited financial statements of the Company for the year ended December 31, 2015.
Financial PerformanceYour Company has performed well during the current year and the summarized financial performance is as follows:
2015 2014 Rupees in million
Net sales from Operations 16,025 15,087
EBITDA – operations 2,497 1,383Depreciation & amortization (567) (536)
EBIT – operations 1,931 847Finance costs (643) (752)Other operating (expenses) / income – net (103) 100Investment income 2,618 2,554
Earnings before tax 3,802 2,749Tax (507) (213)
Earnings after tax 3,295 2,536
Basic Earnings per share – Rupees 37.42 29.89
Invoiced Sales - Net (Rupees in Million)
* Represents Continuing Operations only
0
5,000
10,000
15,000
20,000
20152014201320122011* * *2010
18,5
36
11,3
86
11,7
45 13,5
58 15,0
87
16,0
25
Earnings per Share (Rupees)
* Represents Continuing Operations only
-5
0
5
10
15
20
25
30
35
40
17.6
4
(3.94
)
1.90
21.2
8
29.8
9
37.4
2
20152014201320122011* * *2010
40

Operations have achieved net sales of Rs. 16,025 million in 2015 against net sales of Rs. 15,087 million of last year representing sales growth of 6%.
The operations generated Earnings before Interest, Tax, Depreciation and Amortisation (EBITDA) of Rs. 2,497 million during 2015 against Rs. 1,383 million of 2014 resulting in an increase of Rs. 1,115 million. The improvement in earnings is primarily due to prudent management of raw material costs, lower fuel and energy costs and production efficiencies.
The Company actively focused on strengthening its working capital cycle during 2015 and took initiatives to rationalise inventory levels and trade debtors. The working capital as a percentage to sales ratio improved to 13% as at December 31, 2015 compared to 16% as at December 31, 2014. Continued improvements in working capital efficiency resulted in positive cash flow generation from operations.
Packaging DivisionPackaging Operations have achieved net sales of Rs. 12,618 million during 2015 as compared to Rs. 12,272 million of 2014 representing sales growth of 3%. EBITDA also improved by Rs. 638 million i.e. 49% over 2014 values. The Company is continuing with its focus on revenue growth, better product mix, saving in fuel and energy costs, production efficiencies and higher capacity utilization to improve operating results of this business segment.
As a part of its continuing efforts towards technological up gradation your Company has committed to make an investment of Rs. 310 million in a new offset printing line having double coating capability in continuation of its efforts to remain abreast of improved technological developments in the Packaging business. The new line will commence its operations by the third quarter of 2016 and will add additional capacity and capability to meet growing customer demand in the folding cartons business. Your
Company has also committed to make an investment of Rs 140 million in their pre-press department for a state of the art engraving machine and cylinder making line. This investment is in line with the Company’s efforts to provide its customers with the highest quality of printing.
Consumer Products DivisionConsumer Products Division achieved sales of Rs. 3,245 million during the year 2015 as compared to Rs. 2,709 million of 2014 representing sales growth of 20%.
The Division’s EBITDA increased by Rs. 496 million in 2015 compared to 2014 values resulting from revenue growth, improved capacity utilisation, operating cost control initiatives and overall lower fuel and energy costs.
The Company invested in a new toilet roll line to cater to the growing demand. A new brand by the name of Maxob produced on this machine has been launched during the year.
ANNUAL REPORT OF PACKAGES LIMITED 2015
41

Fixed Assets (Rupees in Million)
0
5,000
10,000
15,000
20,000
25,000
30,000
27,7
49
28,4
72
9,27
5
9,74
4
9,83
5
10,0
36
201520142013201220112010
Production StatisticsThe production statistics for the period under review along with its comparison with the corresponding period are as follows:
2015 2014Consumer Products produced - tons 11,131 10,116
Carton Board & Consumer Products converted - tons 34,510 32,511
Plastics all sorts converted - tons 17,463 17,553
Investment IncomeInvestment income has increased by Rs. 64 million during 2015 over 2014 that is indicative of improved operational performance of the investee companies.
Finance CostsThe finance cost has decreased by Rs. 109 million during 2015 over 2014 mainly due to reduced mark up rates, reduced debt levels owing to better working capital management and conversion of preference shares by IFC as explained below.
Conversion of PreferenceSharesDuring the year, 2,000,000 preference shares issued to IFC were converted into ordinary shares.
This has decreased finance cost of the Company by Rs. 19 million for the year 2015 as no return on preference shares/convertible stock is payable on the converted shares in accordance with the terms of the subscription agreement signed with IFC in 2009.
During the year, 2000,000 preference share to IFC one were converted into ordinary shares. This has decreased finance cost of the Company by Rs. 19 million for the year 2015 as no return on preference shares / convertible stock is payable on the converted shares in accordance with the terms of the subscription agreement signed with IFC in 2009. On February 2, 2016 IFC exercised its right to convert 1,000,000 preference shares / convertible stock of rupees 190 each into 1,000,000 ordinary shares of Rs. 10 each. This conversion is expected to take place prior to book closure date and therefore, its effect has been taken in the dividend appropriation.
Working Capital (Rupees in Million)
0
1,000
2,000
3,000
4,000
5,000
6,000
28%
5,11
2
5,87
2
2,88
9
2,96
3
2,70
0
2,30
0
43%
25%
18%16%
13%
2015201420132012201120100
10
20
30
40
50
Working Capital Working Capital as %age to Sales
Debt to Equity (Percentage)
0
20
40
60
80
100
201520142013201220112010
Debt
23 24
15
11
8 8
77 76
85
89
92 92
Equity
Directors’ Report to the Shareholders
Acquisition of operations of Flexible Packaging Company in South AfricaDuring the year, the Company completed its acquisition of the operations of a flexible packaging company in South Africa in line with its strategy to diversify and enter into new high growth markets. The management believes that the acquisition shall be advantageous to its shareholders.
Financial ManagementThe Company’s continued focus on managing optimal levels of inventory and trade receivables, sound business performance, operating efficiencies and cost savings across the organisation helped generate positive cash flows.
The Company has an effective Cash Flow Management System in place whereby cash inflows and outflows are projected on regular basis and rigorously monitored.
Working capital requirements are planned to be financed through efficient management of trade
42

receivables, payables and inventory levels. Business unit managers are assigned working capital targets which are monitored on regular basis.
Capital expenditure is managed carefully through a rigorous evaluation of profitability and risks and regular project review for delivery on time and at budgeted cost. Large capital expenditure is further backed by long-term contracts so as to minimise cash flow risk to the business. Capital expenditure during 2015 was at Rs. 713 million.
The investment portfolio of the Company is fairly diversified, as reflected by equity participation in Nestle Pakistan Limited, Tri-Pack Films Limited, Tetra Pak Pakistan Limited, Bulleh Shah Packaging (Private) Limited, DIC Pakistan Limited, Packages Construction (Private) Limited, Packages Lanka (Private) Limited and Anemone Holdings Limited.
The Board is satisfied that there are no short or long-term financial constraints including access to credit and a strong balance sheet with December 2015 with net debt : equity ratio at 8: 92.
Risk Mitigation The Board of Directors and the Audit Committee of the Board regularly review the risk matrix in terms of impact and probability of occurrence. The senior management team, led by the Chief Executive Officer is responsible for risk mitigation measures. The Company’s ability to continually assess market conditions and then react decisively, allows the Company to manage risks responsibly and take opportunities to strengthen the position of the Company when they arise.
Credit RiskAll financial assets of the Company, except cash in hand, are subject to credit risk. The Company believes that it is not exposed to major concentration of credit risk. Exposure is managed through application of credit limits to its customers and diversification of its investment portfolio placed with ‘A’ ranked banks and financial institutions.
Liquidity RiskPrudent liquidity risk management ensures availability of sufficient funds for meeting contractual commitments. The Company’s fund management strategy aims at managing liquidity risk through internal cash generation and committed credit lines with financial institutions.
Interest Rate RiskVariable rate long-term financing is hedged against interest rate risk by holding “prepayment option”, which can be exercised upon any adverse movement in the underlying interest rates.
Foreign Exchange RiskForeign currency risk arises mainly where receivables and payables exist due to transaction in foreign currencies. The Company is mainly exposed to short-term USD/PKR and Euro/PKR parity on its import of raw materials and plant and machinery.
Capital Management The Company’s policy is to maintain a strong capital base so as to maintain investor, creditor and market confidence and to sustain future development of the business. There were no changes to the Company’s
approach to capital management during the year.
Contribution to NationalExchequerYour Company is a noteworthy contributor to the national economy and has contributed Rs. 1,448.4 million during the year 2015 to the national exchequer on account of sales tax, income tax, import duties and statutory levies.
Environment, Health & Safety Your Company is striving to meet the best environmental, health and safety standards by developing best operational practices. The prime areas of focus in 2015 continued to be food safety, fire safety and training and development.
During the year the Company got re- certifications for the following:
• SMETA• URSA• FSC COC• HALAL CERTIFICATION (stage 1
complete)• ISO 26000
Current & Quick Ratio
* Represents Continuing Operations only
0.0
0.5
1.0
1.5
2.0
2.5
3.0
3.5
4.0
201520142013201220112010
3.52
** *
1.57
0.96
1.03
1.07 1.
13
1.15
2.57
1.57 1.57 1.67 1.61
Current Ratio Quick Ratio
ANNUAL REPORT OF PACKAGES LIMITED 2015
43

Your Company is also focusing on behavior based safety and risk control which enables minimizing the risks of injuries and accidents.
Campaigns are an integral part of the environmental, health and safety initiatives; significant campaigns of 2015 include the following:
• Food Safety Campaign• Measles Campaign• “Sub Keh Do” Campaign• Dengue Prevention Campaign• Driver and Road Safety Campaign
Corporate Social Responsibility(CSR)On CSR, the Company’s management continued its focus on education, healthcare, skill development, environmental protection and social welfare during the current year.
As per decision of the Board of Directors, Packages Foundation was incorporated on June 12, 2015. The primary objective of the Foundation is to contribute towards the health, education and other charitable and welfare causes. The Company is making contributions / donations to Packages Foundation for carrying out its social work, The Company donated Rs. 10.416 million towards various causes in the current year.
Retirement FundsThere are three retirement funds currently being operated by the Company namely Provident Fund, Gratuity Fund and Management staff Pension Fund.
The value of investments of provident, gratuity and Management staff
pension funds based on their audited accounts as on December 31, 2015 were the following:
Provident Fund Rs. 2,131.396 millionGratuity Fund Rs. 362.197 millionPension Fund Rs. 1,752.322 million
AppropriationIn view of the financial results of the Company for the year 2015, the Board of directors of the Company has recommended cash dividend of 150 percent (i.e. Rs. 15 per share). Accordingly, the following appropriations have been made:
Rupees in thousand
Total comprehensive incomefor the year 2015 after appropriation of preference dividend / return 3,200,163
Un-appropriated profit brought forward 514,403
Available for appropriation 3,714,566Transfer to General reserve (1,500,000) Cash dividend (1,340,693)
To be carried forward to 2016 873,873
AuditorsThe present auditors M/s A.F Ferguson & Co., Chartered Accountants retire and offer themselves for re-appointment. They have confirmed achieving satisfactory rating by the Institute of Chartered Accountants of Pakistan (ICAP) and compliance with the Guidelines on the Code of Ethics of the International Federation of Accountants (IFAC) as adopted by ICAP.
As suggested by the Audit Committee, the Board of Directors has recommended their re-appointment as Auditors of the Company for the year ending December 31, 2016, at a fee to be mutually agreed.
Compliance with the Code ofCorporate GovernanceThe requirements of the Code of Corporate Governance as set out by the Pakistan Stock Exchange in its Listing Regulations have been adopted by the Company and have been duly complied with. A statement to this effect is annexed to the report.
Directors’ Report to the Shareholders
44

Executive Directors
Non Executive Directors
Independent
Board Composition (Percentage)
20%
10%
70%
Material ChangesThere have been no material changes since December 31, 2015 and the Company has not entered into any commitment, which would affect its financial position at the date except for those mentioned in the audited financial statements of the Company for the year ended December 31, 2015.
Changes in the Compositionof Board and its AuditCommitteeDuring the year 2015, Mr. Veli Jussi Olavi Potka, nominee of Stora Enso AB of Finland resigned and Mr. Jari Latvanen, another nominee of Stora Enso AB, was appointed in his place. The Board wishes to record its appreciation of the valuable services rendered by the outgoing Director and welcomes the new Director who will hold office for the remainder of the term of the outgoing member.
Meetings of Board of DirectorsDuring the year 2015, five (5) Board meetings were held and the number of meetings attended by each Director is given hereunder:-
Name of No. of Meetings Director attended
Mr. Towfiq Habib Chinoy(Chairman) 4
Syed Hyder Ali (Chief Executive) 5
Mr. Josef Meinrad Mueller 1
Mr. Rizwan Ghani 5
Mr. Veli-Jussi Olavi Potka (Resigned on 7 July 2015) 2
Mr. Jari Latvanen (Appointed on 7 July 2015) 1
Mr. Muhammad Aurangzeb 2
Mr. Shamim Ahmad Khan 5
Syed Aslam Mehdi 4
Syed Shahid Ali 3
Mr. Tariq Iqbal Khan 4
Leave of absence was granted to the directors who could not attend the Board meetings.
Audit CommitteeAn Audit Committee of the Board has been in existence since the enforcement of the Code of Corporate Governance, which comprises of four Non-Executive and one independent Director.
Four (4) meetings of the Audit Committee were held during the year 2015. The attendance of each Member is given hereunder –
ANNUAL REPORT OF PACKAGES LIMITED 2015
45

Name of No. of meetings Member attended
Mr. Tariq Iqbal Khan (Chairman) 3
Mr. Muhammad Aurangzeb (Independent) 1
Mr. Shamim Ahmad Khan(Non-Executive) 4
Syed Shahid Ali (Non-Executive) 3
Syed Aslam Mehdi (Non-Executive) 4
Leave of absence was granted to the Members who could not attend the Meetings of the Audit Committee.
The Audit Committee has its terms of reference which were determined by the Board of Directors in accordance with the guidelines provided in the Listing Regulations and Code of Corporate Governance.
Corporate and FinancialReporting Framework
• The financial statements together with the notes thereon
have been drawn up by the management in conformity with the Companies Ordinance, 1984. These Statements present fairly the Company’s state of affairs, the results of its operations, cash flow and changes in equity.
• Proper books of account have been maintained by the Company.
• Appropriate accounting policies have been consistently applied in the preparation of financial statements and
accounting estimates are based on reasonable and prudent judgment.
• International Accounting Standards, as applicable in Pakistan, have been followed in the preparation of the financial statements.
• The system of internal control is sound in design and has been effectively implemented and monitored and is being continuously reviewed by the internal audit function.
• There are no doubts upon the Company’s ability to continue as a going concern.
• There has been no material departure from the Best Practices of Corporate Governance, as detailed in the Listing Regulations.
• The key operating and financial data for the last ten years is annexed.
• Trading of Shares by Chief Executive, Directors, Chief Financial Officer, Company Secretary, their spouses and minor children:
Purchase of shares No. of shares
Chief Executive Officer Nil
Director 30,000
Chief Financial Officer Nil
Company Secretary Nil
Spouses Nil
Sale of Shares Nil
Pattern of ShareholdingA statement of the pattern of shareholding of certain class of shareholders as at December 31, 2015, whose disclosure is required under the reporting framework, is included in the annexed shareholders’ information.
The Directors, CEO, CFO, Company Secretary and their spouses or minor children did not carry out any trade in the shares of the Company during the year, except as noted above.
Directors’ Report to the Shareholders
46
Future Outlook The management believes that economic activity will show further improvement that will lead to increased consumption of consumer goods and hence more packaging demand. For 2016, on the back of deflation, the management strategy is to focus on achieving double digit volume growth. Furthermore, the Company will continue to focus on cost efficiencies, price rationalisation and product mix realignment.
Growth is expected in the tissue market owing to increased awareness relating to hygiene. The Company is taking steps to enhance market share and improve market penetration and will continue to focus on targeted growth initiatives, innovation, brand building and cost saving programs.
As part of its asset and income diversification strategy, the
Company’s development of a high quality retail mall at its Lahore land through its wholly owned subsidiary, Packages Construction (Private) Limited is underway.
The construction of the mall is based on inputs from international retail consultants. Space is being leased out with a tenancy mix aimed to appeal to a wide cross section of the market including major anchor tenants, cinemas, food courts, international brand specialty shops, local brands and retailers. The mall is expected to be operational in the last quarter of 2016.
Company’s Staff andCustomersThe management is thankful to the Company’s stakeholders especially its customers for their continuing confidence in its products and services. The management also wishes to express its gratitude to all the Company’s employees who have worked tirelessly and delivered outstanding performance in the backdrop of challenging economic and business environment. We appreciate their hard work, loyalty and dedication.
(Towfiq Habib Chinoy) Chairman Karachi, February 25, 2016
(Syed Hyder Ali)Chief Executive & Managing DirectorKarachi, February 25, 2016
ANNUAL REPORT OF PACKAGES LIMITED 2015
47

انداز کر دیا اثر پر کو منافع منقسمہ کے ترصف گیا ہے۔
جنوبی افریقہ میں فلیکس ایبل پیکیجنگ کمپنیکے اپریشنز کا حصول
سال کے دوران کمپنی نے جنوبی افریقہ میں ایک فلیکس ایبل پیکیجنگ کمپنی کے اپریشنز کی ذمے داری سنبھالی جو کمپنی کی جانب سے نئی اعلیاور ہونے داخل میں مارکیٹوں حامل کی گروتھ کاروبار کو مختلف سمتوں میں ڈالنے کی حکمتیقین پر امر اس انتظامیہ تھی۔ حصہ کا عملی رکھتی ہے کہ یہ کاروبار شیرئ ہولڈرز کے لئے مزید
مفید ثابت ہوگا۔
فنانشل مینجمنٹ
کمپنی نے انوینٹری کے زیادہ سے زیادہ حجم اورکاروباری مستحکم انتظام، کے وصولیابی تجارتی کارکردگی، اپریٹنگ کی صالحیتوں میں اضافے اور پورے ادارے میں اخراجات میں کمی پر مستقل توجہ دی ہے جس سے نقد رقومات کی فراوانی پر
مثبت اثرات واضح ہوئے ہیں۔
کی مینجمنٹ سسٹم فلو کیش موثر ایک کمپنی حامل ہے اور اس مقام پر کیش ان فلوز اور ائوٹاور سختی کے پر واضح کیا بنیاد پر ریگولر فلوز
ساتھ مانیٹر کیا جاتا ہے۔
ورکنگ کیپٹل کی رضوریات کو تجارتی وصولیابیوں، قابل ادائی واجبات اور انوینٹری حجم کے مستعد انتظام کے ذریعے فنانس کرنے کی منصوبہ بندیکیپٹل ورکنگ کو منیجرز یونٹ بزنس گئی۔ کی اہداف تفویض کئے گئے ہیں جن کو باقاعدہ بنیاد
پر مانیٹر کیا جاتا ہے۔
کیپٹل اخراجات منافع جات اور خطرات کی کڑی جانچ پڑتال کے ذریعے انتہائی احتیاط کے ذریعےطے اور ڈلیوری بروقت اور ہیں جاتے کئے طے سے باقاعدگی کا پراجیکٹ لئے کے الگت شدہ جائزہ لیا جاتا ہے۔ وسیع تر کیپٹل اخراجات مزیدہوتے ممکن ذریعے کے کنٹریکٹس مدتی طویل کو خطرے کے فلو کیش میں کاروبار تاکہ ہیں کم کیا جائے۔ 2015میں کیپٹل اخراجات 713ملین
روپے تھے۔
انداز شفاف فولیو پورٹ انویسٹمنٹ کا کمپنی میں مختلف سمتوں میں موڑا گیا جیسا کہ نیسلےپیک ٹیٹرا ملیٹڈ، فلمز پیک ٹرائی ملیٹڈ، پاکستان )پرائیویٹ( پیکیجنگ شاہ بلھے ملیٹڈ، پاکستان ملیٹڈ، ڈی ائی سی پاکستان ملیٹڈ، پیکیجز کنسٹرکشن
)پرائیویٹ( ملیٹڈ، پیکیجز لنکا )پرائیویٹ( ملیٹڈ اورایکویٹی میں ملیٹڈ )پرائیویٹ( ہولڈنگز مون اینی
رشاکت سے واضح ہوتا ہے۔
یا مخترص کوئی کہ ہے مطمنئ پر امر اس بورڈ تک کریڈٹ بشمول پابندی مالیاتی مدتی طویل رسائی موجود نہیں ہے اور دسمرب 2015کے ساتھ ایک مضبوط بیلنس شیٹ مع خالص قرضہ ایکویٹی
تناسب 8:92پر ہے۔
خطرات میں کمی
بورڈ اف ڈائریکٹرز اور بورڈ کی اڈٹ کمیٹی وقوعہکے خطرات میں ضمن کے منافع اور اثرات کے ہے۔ چیف لیتی جائزہ باقاعدگی سے کا میٹرکس ایگزیکٹو افیرس کی زیر قیادت سینرئ انتظامی ٹیمدار لئے ذمے پیامنوں کے خطرات میں کمی کے ہے۔ مارکیٹ کی صورتحال کا مستقل جائزہ لینے کے لئے کمپنی کی صالحیت اور اس کے بعد موثراجازت کی منٹنے سے خطرات کو کمپنی ردعمل کی کمپنی مطابق کے رضورت ساتھ کے دینے
پوزیشن مستحکم بنانے کے مواقع دیتا ہے۔
کریڈٹ کے خطرات
ماسوائے جات اثاثہ مالیاتی متامرت کے کمپنی زیرگردش نقد رقم کریڈٹ رسک سے مرشوط ہیں۔ کمپنی اس امر پر یقین رکھتی ہے کہ کریڈٹ رسک کے اہم ماخذ کو ایکسپوز نہیں کیا جاتا۔ ایکسپوزرکے حدود کی کریڈٹ لئے کے صارفین کے اس نفاذ اور ’اے‘ رینک کے حامل بینکس اور مالیاتی اداروں کے ساتھ اس کے انویسٹمنٹس پورٹ فولیوگیا بنایا ممکن ذریعے کے سیفکیشن ڈائیور کی
ہے۔
لیکویڈیٹی کے خطرات
بندوبست کا خطرات محتاط کے لیکویڈیٹی کی فنڈز مناسب لئے کے کرنے پورے معاہدے کے فنڈ کے کمپنی ہے۔ بناتا یقینی کو دستیابی انتظام کی حکمت عملی کے مقاصد اندرونی طور پر کیش جرنیشن اور مالیاتی اداروں کے ساتھ طے کردہ کریڈٹ الئنز کے ذریعے لیکویڈیٹی رسک کا
انتظام کرنا ہے۔
رشح سود کے خطرات
پے ’’پری فنانسنگ مدتی طویل کی ریٹ متغیر منٹ اپشن‘‘ کے انعقاد کے ذریعے رشح سود کےجوکہ جاتی کی نہیں ظاہر برخالف کے خطرات بنیادی رشح سود میں کسی بھی منفی اقدام کے
تحت استعامل کیا جاسکتا ہے۔
غیر ملکی زرمبادلہ کے خطرات
غیر ملکی کرنسی کے خطرات عمومی طور پر وہاں ہوتے ہیں جہاں وصولیابیاں اور ادائیگیاں غیر ملکیکمپنی ہیں۔ جاتی کی پر تبادلوں کے کرنسیوں بنیادی طور پر اپنے خام مال اور پالنٹ و مشیرنی کی درامد پر شارٹ ٹرم کے لئے امریکی ڈالر/پاک
روپے اور یورو/ پاک روپے پر کام کرتی ہے۔
کیپٹل مینجمنٹ
کمپنی کی پالیسی ایک مستحکم کیپٹل بنیاد برقرارکا مارکیٹ اور کریڈیٹر انویسٹر، تاکہ ہے رکھنا اعتامد برقرار رہے اور کاروبار کی مستقبل کا عمل بھی جاری رہے۔ اس سال بھی کیپٹل مینجمنٹ کےلئے کمپنی کی اپروچ میں کوئی تبدیلی نہیں ائی۔
قومی خزانے میں رشاکت
بڑی ایک لئے کے خزانے قومی کمپنی کی اپ کمپنی دوران 2015کے سال اور ہے دار رشاکت نے سیلز ٹیکس، انکم ٹیکس، درامدی ڈیوٹیوں اور اسٹیچوٹری لیویز کے ضمن میں قومی خزانے میں
1,448.4ملین روپے جمع کرائے۔
ماحولیات، صحت اور تحفظ
اپ کی کمپنی بہرتین اپریشنل طریقہ کار کو فروغاور صحت ماحولیاتی بہرتین ذریعے کے دینے تحفظ کے اسٹینڈرڈز پر پورا اترنے کے لئے کوشاں ہے۔ 2015میں توجہ کے منایاں شعبے فوڈ سیفٹی،
فائر سیفٹی، ٹریننگ اور ڈیولپمنٹ رہے۔
لئے ری ذیل کے نے درج کمپنی دوران سال کے :رسٹیفکیشن حاصل کیا
• )SMETA( ایس ایم ای ٹی اے• )URSA( یو ار ایس اے
• )FSC COC( ایف ایس سی سی او سی • )حالل رسٹیفکیشن )مرحلہ 1مکمل ISO 26000 •
اپ کی کمپنی رویوں میں مبنی سیفٹی اور رسک کنٹرول پر بھی توجہ دے رہی ہے جس سے زخمیمیں کرنے کم کو خطرات کے حادثات اور ہونے
مدد ملے گی۔
ماحولیاتی صحت اور تحفظ کے اقدامات کے ایک مربوط حصہ کے طور پر مختلف انداز کی مہم کومہم منایاں 2015کی ہے۔ جاتا کیا تصور رضوری
میں درج ذیل شامل ہیں:-
48

ڈائریکٹرز کی رپورٹ برائے شیرئ ہولڈرز
کمپنی کے ڈائریکٹرز سال مختتمہ 31دسمرببشمول رپورٹ ساالنہ اپنی لئے 2015کے کمپنی کے اڈٹ شدہ مالیاتی حسابات جمع
کراتے ہوئے فخر محسوس کررہے ہیں۔
مالیاتی کارکردگی
بہرتین دوران کے رواں سال نے کمپنی کی اپ مالیاتی مخترصا اور کیا مظاہرہ کا کارکردگی
کارکردگی درج ذیل کے مطابق رہی۔
2014 2015 )روپے ملین میں(
اپریشنز سےخالص سیلز 16,025 15,087
اپریشنز 2,497 1,383 فرسودگی اور کساد بازاری
EBIT آپریشنز 1,931 847 فنانس کی الگت )643( )752(
دیگر آپریٹنگ)اخراجات(/ امدنی خالص )103( 100 رسمایہ کاری آمدنی 2,618 2,554
آمدنی قبل از ٹیکس 3,802 2,749 ٹیکس )507( )213(
آمدنی بعد از ٹیکس 3,295 2,536
بنیادی آمدنی فیشیرئ- روپے 37.42 29.89
کی روپے 16,025ملین 2015میں سے اپریشنز سال گزشتہ جبکہ گئی کی حاصل سیلز خالص 15,087ملین روپے کی خالص سیلز رہی تھی جس
سے 6فیصد اضافہ ظاہر ہوا۔
اپریشنز سے 2015کے دوران امدنی قبل از منافع، ٹیکس، فرسودگی اور کساد بازاری
ملین روپے رہی جوکہ 2014میں1,383ملین روپے تھی۔ نتیجتا 1,115ملین روپے کا اضافہ ہوا۔ امدنی میں بنیادی طور پر بہرتی خام مال کی الگت کےمیں نرخوں کے انرجی اور ایندھن انتظام، موثر
کمی اور پیداواری صالحیت کی بدولت ائی۔
اپنے دوران 2015کے پر طور موثر نے کمپنی ورکنگ کیپٹل سائیکل کو مستحکم بنانے پر توجہڈیبٹرز ٹریڈ اور پیامنوں انوینٹری اور معقول دی کے لئے اقدامات کئے۔ سیلز کے تناسب کے لئے31دسمرب کیپٹل ورکنگ مطابق کے فیصدی رشح
2015 31دسمرب جوکہ تھی 16فیصد 2014میں میں بہرت ہوکر 13فیصد ہوگئی۔ ورکنگ کیپٹل میں مستقل بہرتی انے سے اپریشنز میں بھی کیش فلو
جرنیشن میں مثبت اثرات ظاہر ہوئے۔
پیکیجنگ ڈویژن
پیکیجنگ اپریشن نے 2015کے دوران 12,618ملین روپے کا خالص سیلز حاصل کیا جبکہ 2014میں یہ حجم 12,272ملین روپے تھا اور اس طرح 3فیصد کی سیلز گروتھ حاصل ہوئی۔ میں بھی2014کی یعنی ائی بہرتی تک روپے 638ملین ہوا۔ کمپنی نے کاروبار پر 49فیصد اضافہ ویلیوز بہرت مزید کو نتائج اپریٹنگ میں شعبے اس کے بنانے کے لئے ریونیو گروتھ، بہرتین پروڈکٹ مکس، فیول اور انرجی کی الگت میں بچت، پروڈکشن کی بہرت کارکردگی اور کیپسٹی یوٹیالئزیشن میں اضافہ
پر مسلسل توجہ دے رہی ہے۔
اپنی میں ضمن کے گریڈیشن اپ ٹیکنالوجیکل کمپنی کی اپ پر طور کے کوششوں مسلسل 310ملین میں الئن پرنٹنگ افسیٹ نئی ایک نے روپے کی رسمایہ کاری کا وعدہ کیا ہے جس سےکی ترقی تیکنیکی بہرتین میں بزنس پیکیجنگ ڈبل ساتھ کے تسلسل کے رکھنے برقرار کوشش نئی اس ہوگی۔ حاصل بھی کی صالحیت کوٹنگ الئن کے باقاعدہ اپریشنز کا اغاز 2016کی تیرسیکے کارٹنز فولڈنگ اور گا ہوجائے تک ماہی سہ پورا کو ہوئی طلب بڑھتی کی میں صارف بزنس کا صالحیت اور گنجائش اضافی لئے کے کرنے پریس پری- اپنے نے کمپنی اپ کی ہوگا۔ اضافہ ڈپارٹمنٹ میں ایک جدید ترین اینگر یونگ مشینروپے لئے 140ملین میکنگ الئن کے اور سیلنڈر کی رسمایہ کاری کا فیصلہ بھی کیا ہے۔ یہ رسمایہکوالٹی بہرتین کی پرنٹنگ کو اپنے صارفین کاری کی فراہمی کے لئے کمپنی کی کوششوں کا حصہ
ہے۔
کنزیومر پروڈکٹس ڈویژن
دوران 2015کے نے ڈویژن پروڈکٹس کنزیومر جبکہ کی حاصل سیلز کی روپے 3,245ملین 2014میں یہ حجم 2,709ملین روپے تھا جس سے
20فیصد سیلز گروتھ ظاہر ہوتی ہے۔
ڈویژن کے 2015میں سال 2014کیتک روپے 496ملین میں مقابلے کے ویلیوز کیپسٹی بہرت گروتھ، ریونیو جو ہوا اضافہ کا یوٹیالئزیشن، اپریٹنگ الگت پر کنٹرول کے اقداماتالگت کی انرجی اور فیول پر طور مجموعی اور
میں کمی کے باعث ممکن ہوسکا۔
کمپنی نے بڑھتی ہوئی طلب کو پورا کرنے کے لئے نئی ٹوائیلٹ رول الئن میں بھی رسمایہ کاری کی۔ایک پر بنے ہوئے سال کے دوران اس نئی مشین میں مارکیٹ کو میکسوب برانڈ نئے
متعارف کرایا گیا۔
پروڈکشن کے اعداد و شامر
زیر جائزہ مدت کے دوران پروڈکشن کے اعداد وشامر گزشتہ سال کے مقابلے میں درج ذیل ہیں:
2014 2015
اشیائے صارفتیار کردہ- ٹنز 11,131 10,116
کارٹن بورڈ اور کنزیومرپروڈکٹس- کنورٹڈ- ٹنز 34,510 32,511
پالسٹک متام اقسامکنورٹڈ- ٹنز 17,463 17,553
انویسٹمنٹ امدنی
انویسٹمنٹ امدنی میں سال 2015کے دوران سالاضافہ کا روپے 64ملین میں مقابلے 2014کے اپریشنل بہرتین کی کمپنیوں کار رسمایہ جو ہوا
کارکردگی کا اظہار ہے۔
فنانس کے اخراجات
فنانس کے اخراجات سال 2015کے دوران 2014میں 109ملین روپے تک کم ہوگئے جو بنیادی طور پر رشح سود میں کمی، بہرت ورکنگ کیپٹل مینجمنٹ کے باعث قرضوں کے حجم میں کمی اور ائی ایفمنتقلی، جیسا ترجیحی شیرئز کی سی کی جانب باعث کے ہے، گئی کردی وضاحت میں ذیل کہ
ممکن ہوئی۔
ترجیجی شیرئز کی منتقلی
سال رواں کے دوران ائی ایف سی کو جاری کردہمیں شیرئز عمومی شیرئز 2,000,000ترجیحی سےسال2015کیلئےکمپنی اس گئے۔ کئے منتقل کی فنانسنگ الگت میں سال 19ملین روپے تک کی کمی ائی کیونکہ سال 2009میں ائی ایف سی کےمعاہدے کی رشائط کردہ سبسکرپشن ساتھ طے کے مطابق منتقل کردہ شیرئز پر ترجیحی شیرئز /ادائیگی قابل منافع پر کوئی اسٹاک مستقل شدہ نہیں ہوتا۔ 2فروری 2016کو ائی ایف سی نے اپنے اختیارات کو بروئے کار التے ہوئے 190روپے مالیت کے 1,000,000ترجیحی شیرئز/ منتقل شدہ اسٹاک کو ہر ایک 10روپے مالیت کے 1,000,000عمومی شیرئز میں منتقل کیا۔ یہ منتقلی کتاب کی بندش کی تاریخ سے پہلے متوقع ہے لہذا اس کے اثرات
EBITDA
2,497)EBITDA(
)MAXOB(
)536( )567(
EBITDA
EBITDA
ANNUAL REPORT OF PACKAGES LIMITED 2015
49

رشکت کردہ ممربکانام اجالس کی تعداد
جناب طارق اقبال 3 جناب محمد اورنگ زیب 1 جناب شمیم احمد خان 4 سید شاہد علی 3 سید اسلم مہدی 4
اڈٹ کمیٹی کے اجالسوں میں رشکت نہ کرنےیا نہچھٹی لئے کے حارضی غیر کو ممربان والے انے
منظور کردی گئی تھی۔
حامل کی ریفرنس اف ٹرمز اپنے کمیٹی اڈٹ اف کوڈ اور ریگولیشنز لسٹنگ تعین کا جن ہے کارپوریٹ گورنینس میں فراہم کردہ رہنام ہدایات کے مطابق بورڈ اف ڈائریکٹرز کی جانب سے کیا
گیا ہے۔
کارپوریٹ اور فنانشل رپورٹنگ فریم ورک
• مالیاتی حسابات مع ان پر نوٹس کمپنیز ارڈیننس کے عین مطابق مینجمنٹ کی جانب سے تیار کئے گئے ہیں۔ یہ حسابات شفاف انداز میں کمپنی کے رضوری امور، اپریشنز کے نتائج، کیش
فلو اور ایکویٹی میں تبدیلی کو ظاہر کرتے ہیں۔
• کمپنی کی جانب سے اکائونٹس کی باقاعدہ بکسکو تیار کیا جاتا ہے۔
• موزوں ترین اکائونٹنگ پالیسیاں مستقل طور پر مالیاتی حسابات کی تیاری میں الگو کی جاتی ہیں اور اکائونٹنگ کے تخمینہ جات مناسب اور درست
فیصلے پر منحرص ہوتے ہیں۔
•بین االقوامی اکائونٹنگ اسٹینڈرڈز، جیسا کہ پاکستان میں نافذ العمل ہیں، کو مالیاتی حسابات
کی تیاری کے لئے الگو کیا جاتا ہے۔
•اندرونی کنٹرول کا نظام اپنے ڈیزائن کے اعتبار سے مستحکم ہے اور موثر طور پر نافذ العمل اور زیر نگرانی ہونے کے ساتھ انٹرنل اڈٹ فنکشن کے
ذریعے مستقل طور پر اس کا جائزہ لیا جاتا ہے۔
•کمپنی کی صالحیت کے بارے میں اس حوالےسے کوئی شبہ نہیں کہ یہ چلتا ہوا کاروباری ادارہ ہے۔
• کارپوریٹ گورنینس کے بہرتین طریقہ کار، جیسا کہ لسٹنگ ریگولیشنز میں تفصیل دی گئی ہے کی
کوئی خالف ورزی نہیں کی گئی ہے۔
• گزشتہ دس سالوں کے لئے بنیادی اپریٹنگ اورمالیاتی تفصیل منسلک ہے۔
•چیف ایگزیکٹو، ڈائریکٹرز، چیف فنانشل افیرس کمپنی سیکریٹری، ان کے رشیک حیات اور نابالغ بچوں کی جانب سے شیرئز کی ٹریڈنگ درج ذیل
ہے:۔
شیرئز کی خریداری شیرئز کی تعداد
چیف ایگزیکٹو افیرس کوئی نہیں ڈائریکٹر 30,000 چیف فنانشل افیرس کوئی نہیں کمپنی سیکریٹری کوئی نہیں رشیک حیات کوئی نہیں شیرئز کی فروخت کوئی نہیں
شیرئ ہولڈنگ کا پیٹرن
ہولڈنگ شیرئ کی کالس مختلف کی ہولڈرز شیرئ 31دسمرب مبطابق اسٹیٹمنٹ ایک کا پیٹرن کے 2015، جس کا اظہار رپورٹنگ فریم ورک کے تحت رضوری ہے، شیرئ ہولڈرز کی معلومات کے منسلکہ
ضمیمہ میں شامل کردیا گیا ہے۔
کمپنی او، ایف سی او، ای سی ڈائریکٹرز، سیکریٹری اور ان کے رشیک حیات و نابالغ بچے سال کے دوران کمپنی کے شیرئز میں کسی قسمکا جن ماسوائے ہے نہیں ملوث میں تجارت کی
تذکرہ اوپر کیا گیا ہے۔
مستقبل پر نظر
معاشی کہ ہے رکھتی یقین پر امر اس انتظامیہ کیونکہ گی کرے ظاہر بہرتی مزید رسگرمی ہے رہی بڑھ کھپت اور طلب کی صارف اشیائے اور پیکیجنگ مصنوعات کی مانگ میں بھی مزیدپس کے فلیشن ڈی لئے 2016کے ہوگا۔ اضافہ ہندسوں انتظامی حکمت عملی میں دو پر منظر پر مشتمل ویلیو میٹرک گروتھ کے حصول پر توجہپر براں ڈویژن الگت مزید مرکوز کی جائے گی۔ مکس پروڈکٹ اور راشنالئزیشن پرائس کنٹرول، ری االئنمنٹ پر بھی توجہ دینے کا سلسلہ جاری
رکھے گا۔
حفظان صحت کے اصولوں کے بارے میں بڑھتیٹشو باعث کے رکھنے مدنظر کو اگاہی ہوئی ہے۔ توقع کی گروتھ قدر قابل میں مارکیٹ کی کمپنی مارکیٹ شیرئ میں اضافے اور مارکیٹ میں اثرورسوخ بڑھانے کے لئے کئی اقدامات کررہی ہےلئے کے حصول کے ترقی مطابق کے اہداف اور
اقدامات، نئی مصنوعات، برانڈ بلڈنگ اور باکفایتپروگراموں پر توجہ کا سلسلہ جاری رکھا جائے گا۔
اپنے اثاثہ جات اور امدنی کو مختلف سمتوں میں توسیع دینے کی حکمت عملی کے حصے کے طوراعلی معیار کا ریٹیل ایک پر کمپنی کا الہور میں مال زیر تکمیل ہے جو مکمل طور پر اس کے ذیلیکے ملیٹڈ )پرائیویٹ( کنسٹرکشن پیکیجز ادارے
ذریعے پایہ تکمیل تک پہنچایا جارہا ہے۔
مال کی تعمیر بین االقوامی ریٹیل کنسلٹینٹس کی مشاورت سے جاری ہے۔ جگہ کو کرایہ داری کے امتزاج کے ساتھ لیز پر دیا گیا ہے جو مارکیٹ کےاینکر کرایہ دار، وسیع تر شعبہ جات بشمول اہم بالخصوص برانڈ، انٹرنیشنل کورٹس، فوڈ سینامز، دکانیں، لوکل برانڈز اور ریٹیلرز کے لئے کشش کا باعث ہوگا۔ یہ مال متوقع طور پر 2016کی اخری
سہ ماہی میں اپریشنل ہوجائے گا۔
کمپنی کا اسٹاف اور صارفین
انتظامیہ کمپنی کے اسٹیک ہولڈرز بالخصوص اپنےپر مکمل اور رسوسز اپنی مصنوعات صارفین کی
اعتامد کے لئے ان کی مشکور ہے۔
اظہار کا خوشی اپنی بھی پر امر اس انتظامیہ کرتی ہے کہ کمپنی کے متام مالزمین نے چیلنجنگغیر اپنی میں ماحول کاروباری اور اقتصادی معمولی کارکردگی اور انتھک محنت کا اظہار کیا۔ ہم ان کی کاوشوں، محنت، ایامنداری اور عزم کو
خراج تحسین پیش کرتے ہیں۔
(توفیق حبیب چنائے)چیرئمین
کراچی، فروری 25، 2016
(سید حیدر علی)چیف ایگزیکٹو و منیجنگ ڈائریکٹر
کراچی، فروری 25، 2016
)نان ایگزیکوٹیو(
)نان ایگزیکوٹیو(
)نان ایگزیکوٹیو(
)ازاد(
)چیرئمین(
1984
50

• فوڈ سیفٹی کمپین • خرسہ کی اگاہی مہم • سب کہہ دو مہم • ڈینگی سے تحفظ کی مہم • ڈرائیور اور روڈ سیفٹی مہم
کارپوریٹ سوشل ریسپانسیبلیٹی
انتظامیہ نے کی کمپنی پر ار ایس سی مستقل طور پر توجہ دیتے ہوئے تعلیم، ہیلتھ کیرئ،سامجی اور تحفظ ماحولیاتی ڈیولپمنٹ، اسکل بہبود میں تعاون کا سلسلہ سال رواں بھی جاری
رکھا۔
بورڈ اف ڈائریکٹرز کے فیصلے کے مطابق پیکیجزگیا دیا تشکیل 2015کو 12جون کو فائونڈیشن اور تعلیم صحت، مقصد بنیادی کا فائونڈیشن میں ضمن کے مقاصد سامجی و امداد دیگر معاونت فراہم کرنا ہے۔کمپنی اپنے سامجی کاموں کی انجام دہی کے لئے پیکیجز فاونڈیشن کو روپے فراہم کرتی رہی۔ کمپنی نے سال میںامداد دیتے ہوئے مختلف کاموں کے لیے 10.416 ملین
پاکستانی روپے فراہم کیے۔
ریٹائرمنٹ فنڈز
تین پر طور موجودہ سے جانب کی کمپنی ریٹائرمنٹ فنڈز بنام پراویڈنٹ فنڈ، گریجویٹی فنڈ
اور پینشن فنڈ کو اپریٹ کیا جارہا ہے۔
کی رسمایہ فنڈز پنشن اور گریجویٹی پراویڈنٹ، کاریوں کی مالیت 31دسمرب 2015کو ان کے اڈٹ
شدہ اکائونٹس کے مطابق درج ذیل تھی۔
پراویڈنٹ فنڈ ملین روپے گریجویٹی فنڈ ملین روپے پنشن فنڈ ملین روپے
(Appropriation) ترصف
نتائج مالیاتی کے کمپنی لئے 2015کے سال نے ڈائریکٹرز اف بورڈ کے کمپنی نظر پیش کے 150فیصد نقد منافع منقسمہ )یعنی 15روپے فیتناسب ذیل درج لہذا ہے کی سفارش کی شیرئ(
حاصل کیے گئے۔
روپے ہزاروں میں
سال2015 کے لئے336.050 ملین روپے کے ترجیحی منافع
منقسمہ /منافع کے تناسبکے بعد مجموعی جامع امدنی 3,200,163 غیر مختص شدہ منافع
جو ائندہ کیلئے شامل کیا گیا 514,403 تناسب کیلئے دستیاب 3,714,566 جرنل ریزرو کے لئے منتقلی )1,500,000( نقد منافع منقسمہ )1,340,693(
اڈیٹرز
اینڈ فرگوسن ایف اے میرسز اڈیٹرز موجودہ کمپنی چارٹرڈ اکائونٹینٹس سبکدوش ہورہے ہیں اور انہوں نے خود کو دوبارہ تقرری کے لئے پیش کیا ہے۔ انہوں نے انسٹی ٹیوٹ اف چارٹرڈ اکائونٹینٹس اف پاکستان کی جانب سے اطمینان بخش ریٹنگ حاصل کی ہے اور انٹرنیشنل فیڈریشن اف اکائونٹینٹ کے ضابطہ اخالق پر مشتمل گائیڈ الئنز کی مکمل پاسداری کی ہے جو کہ کی جانب سے رائج کی گئی تھیں جیسا کہ اڈٹ کمیٹی کی جانب سے تجویز کیا۔ اس کے مطابق بورڈ افوالے ہونے ختم 2016کو 31دسمرب نے ڈائریکٹرز سال کے لئے باہمی طور پر طے کردہ معاوضے پردوبارہ کی ان حیثیت سے کی اڈیٹرز کے کمپنی
تقرری کی سفارش کی ہے۔
کارپوریٹ گورنینس کے ضابطہ پر عملدرامد
ان سے جانب کی ایکسچینج اسٹاک پاکستان گورنینس کارپوریٹ میں ریگولیشنز لسٹنگ کی جنہیں ہیں گئی کی درج کی رشائط ضوابط کے کمپنی کی جانب سے رائج کیا جاچکا ہے اور ان پر باقاعدہ عملدرامد کیا جارہا ہے۔ اس سلسلے میں
ایک اسٹیٹمنٹ رپورٹ کے ساتھ منسلک ہے۔
رضوری ترامیم
ض دسمرب2015سے اب تک کوئی رضوری ترامیم نہیں کی گئیں اور نہ کمپنی نے کوئی نیا معاہدہ کیا ہے جوکہ سال مختتمہ 31دسمرب 2015کے لئےدرج میں حسابات مالیاتی شدہ اڈٹ کے کمپنی مالیاتی پوزیشن کے عالوہ اس تاریخ تک کسی بھی
مالیاتی پوزیشن پر اثر انداز ہوگا۔
میں تشکیل کی کمیٹی اڈٹ کی اس اور بورڈ تبدیلیاں
سال 2015کے دوران فن لینڈ کی اسٹورا انیسو اے بی کے نامزد کردہ مسٹر ویلی جوسی اوالوی پوٹکا
انیسو اسٹورا جگہ کی ان اور دیدیا استعفی نے اے بی نے مسٹر یاری لیٹوانین کو نامزد کیا۔ بورڈ کی خواہش ہے کہ سبکدوش ہونے والے ڈائریکٹر کی قابل قدر خدمات کو خراج تحسین پیش کرنے اور جانے والے ممرب کی جگہ افس سنبھالنے والےریکارڈ کلامت خیرمقدمی لئے کے ڈائریکٹر نئے
کئے جائیں۔
بورڈ اف ڈائریکٹرز کے اجالس
اجالس )5( پانچ کے بورڈ دوران 2015کے سال ڈائریکٹر کی جانب ایک ہر اور گئے کئے منعقد ذیل کے درج تفصیل میں رشکت کی اجالس سے
مطابق ہے۔
رشکت کردہ منرب اجالسوں کی شامر ڈائریکٹر کا نام تعداد
1 جناب توفیق حبیب چنائے 4 )چیرئمین(
2 سید حیدر علی 5 )چیف ایگزیکٹو(
3 جناب جوزف میرنیڈ میولر 1
4 جناب رضوان غنی 5
5 جناب ویلی-جوسی اوالوی پوٹکا 2 جوالئی کو مستعفی ہو گئے
6 جناب یاری لیٹوانین 1 ) جوالئی 2015( کو تقرری ہوئی
7 جناب محمد اورنگ زیب 2
8 جناب شمیم احمد خان 5
9 سید اسلم مہدی 4
10 سید شاہد علی 3
11 جناب طارق اقبال خان 4
والے کرپانے نہ رشکت میں اجالسوں کے بورڈ منظور چھٹی لئے کے حارضی غیر کو ڈائریکٹرز
کردی گئی تھی۔
اڈٹ کمیٹی
گورنینس کارپوریٹ کمیٹی اڈٹ ایک کی بورڈ کے ضابطہ کے نفاذ سے موجود ہے جو چار نان-
ایگزیکٹو اور ایک ازاد ڈائریکٹر پر مشتمل ہے۔
)4( چار کے کمیٹی اڈٹ دوران 2015کے سال اجالس منعقد ہوئے اور اس میں ہر ایک ڈائریکٹر
کی حارضی درج ذیل کے مطابق رہی:۔
7
7
2015 ()
2016873,873 کے لئے منتقل کردہ
31
””
(CSR)
)CSR(
2015
2,131.396362.197
1,752.322
)ICAP(
)ICAP(
ANNUAL REPORT OF PACKAGES LIMITED 2015
51

Shareholders’ Information
Registered Office4th Floor, The Forum Suite # 416-422, G-20, Block 9Khayaban-e-Jami, Clifton Karachi-75600Tel. # 92 21 35831618 / 35831664 35833011 35874047 - 49Fax # 92 21 35860251
Shares Registrar FAMCO Associates (Pvt.) Ltd8-F, Next to Hotel FaranNursery, Block 6, P.E.C.H.SShahrah-e-FaisalKarachi-75400Tel. # 92 21 34380101-5 92 21 34384621-3Fax # 92 21 34380106
52

Listing on Stock ExchangePackages equity shares are listed on the Pakistan Stock Exchange.
Listing FeesThe annual listing fee for the financial year 2015-16 has been paid to the stock exchange within the prescribed time limit.
Stock CodeThe stock code for dealing in equity shares of Packages at the Pakistan Stock Exchange is PKGS.
Shares RegistrarPackages’ shares department is operated by FAMCO Associates (Pvt.) Ltd and serves around 3,766 shareholders. It is managed by a well-
experienced team of professionals and is equipped with the necessary infrastructure in terms of computer facilities and comprehensive set of systems and procedures for conducting the Registration function.
The Shares Registrar has online connectivity with Central Depository Company of Pakistan Limited. It undertakes activities pertaining to dematerialisation of shares, share transfers, transmissions, issue of duplicate / re-validated dividend warrants, issue of duplicate / replaced share certificates, change of address and other related matters.
For assistance, shareholders may contact either the Registered Office or the Shares Registrar.
Contact persons:Mr. S.M. Munawar MoosviTel. # 92 21 35831618 / 35831664 / 35833011Fax # 92 21 35860251
Mr. Ovais KhanTel. # 92 21 34380101-5 92 21 34384621-3Fax # 92 21 34380106
Service StandardsPackages has always endeavored to provide investors with prompt services. Listed below are various investor services and the maximum time limits set for their execution: For requests received through post Over the counter
Transfer of shares 30 days after receipt 30 days after receipt
Transmission of shares 30 days after receipt 30 days after receipt
Issue of duplicate share certificates 30 days after receipt 30 days after receipt
Issue of duplicate dividend warrants 5 days after receipt 5 days after receipt
Issue of revalidated dividend warrants 5 days after receipt 5 days after receipt
Change of address 2 days after receipt 15 minutes
Well qualified personnel of the Shares Registrar have been entrusted with the responsibility of ensuring that services are rendered within the set time limits.
Statutory Compliance During the year, the Company has complied with all applicable provisions, filed all returns / forms and furnished all the relevant particulars as required under the Companies Ordinance, 1984 and allied rules, the Securities and Exchange Commission of Pakistan (SECP) Regulations and the listing requirements.
ANNUAL REPORT OF PACKAGES LIMITED 2015
53

Dematerialisation of SharesThe equity shares of the Company are under the dematerialisation category. As of date 73.02% of the equity shares of the Company have been dematerialised by the shareholders.
Dividend AnnouncementThe Board of Directors of the Company has recommended for the financial year ended December 31, 2015 payment of cash dividend as follows:-
a) to the preference share /convertible stock holder (International Finance Corporation) at the rate of Rs. 19.00 (10%) per preference share /convertible stock of Rs. 190.00 in terms of the Subscription Agreement between Packages Limited and International Finance Corporation (2014: 10% or Rs. 19.00 per preference share /convertible stock of Rs. 190.00).
b) to the ordinary shareholders at the rate of 150% (Rs. 15.00 per ordinary share of Rs. 10.00) subject to approval by the ordinary shareholders of the Company at the Annual General Meeting (2014: cash dividend at the rate of 90% or Rs. 9.00 per ordinary share).
Book Closure DatesThe Register of Members and Share Transfer Books of the Company will remain closed from April 18, 2016 to April 25, 2016 both days inclusive.
Dividend RemittancePreference dividend / return will be paid to the preference / convertible stockholder prior to payment of ordinary dividend to the ordinary shareholders.
Ordinary dividend declared and approved at the Annual General Meeting will be paid well before the statutory time limit of 30 days:
a) For shares held in physical form: to shareholders whose names appear in the Register of Members of the company after entertaining all requests for transfer of shares lodged with the Company on or before the book closure date.
b) For shares held in electronic form: to shareholders whose names appear in the statement of beneficial ownership furnished by CDC as at end of business on book closure date.
Withholding of Tax & Zakat onOrdinary Dividend As per the provisions of Section 150 of the Income Tax Ordinance, 2001, Income Tax is deductible at source on dividend payable by the Company at the rate of 12.5% for filers of income tax returns, wherever applicable, and at the rate of 17.5% for non-filers of income tax returns.
Zakat is also deductible at source from the ordinary dividend at the rate of 2.5% of the face value of the share, other than corporate holders or individuals who have provided an undertaking for non-deduction.
Dividend WarrantsCash dividends are paid through dividend warrants addressed to the ordinary shareholders whose names appear in the Register of Shareholders at the date of book closure. Ordinary shareholders are requested to deposit those warrants into their bank accounts, at their earliest, thus helping the Company to clear the unclaimed dividend account.
Share Price Movement (Share price on PSX (Rupees / Share))
Jan Feb Mar Apr May Jun Jul Aug Sep Oct Nov Dec0
100
200
300
400
500
600
700
800
652646
490
542519
550
589
525 511 519538
557
750 743
649
603576
632667
629594
565
648 635
Highest Lowest
Trading Volume (Volume of share traded on the KSE (in thousands))
Jan Feb Mar Apr May Jun Jul Aug Sep Oct Nov Dec0
200
400
600
800
1,000
1,200
1,400
1,600
1,800
2,000
938
84
293
1,89
2
175
540
231
1,63
4
329 40
91,
956
1130
Shareholders’ Information
54

Investors’ GrievancesTo date none of the investors or shareholders has filed any letter of complaint against any service provided by the Company to its shareholders.
Legal ProceedingsNo case has ever been filed by shareholders against the company for non-receipt of shares / refund.
General Meetings & VotingRightsPursuant to section 158 of the Companies Ordinance, 1984, Packages Limited holds a General Meeting of shareholders at least once a year. Every shareholder has a right to attend the General Meeting. The notice of such meeting is sent to all the shareholders at least 21 days before the meeting and also advertised in at least one English and one Urdu newspaper having circulation in Karachi, Lahore and Islamabad.
Shareholders having holding of at least 10% of voting rights may also apply to the Board of Directors to call for meeting of shareholders, and if the Board does not take action on such application within 21 days, the shareholders may themselves call the meeting.
All ordinary shares issued by the Company carry equal voting rights. Generally, matters at the general meetings are decided by a show of hands in the first instance. Voting by show of hands operates on the principle of “One Member-One Vote”. If majority of shareholders raise their hands in favor of a particular resolution, it is taken as passed, unless a poll is demanded.
Since the fundamental voting principle in a Company is “One Share-One Vote”, voting takes place by a poll, if demanded. On a poll being taken, the decision arrived by poll is final, overruling any decision taken on a show of hands.
Break-up Value Per Ordinary Share (Rupees)
0
100
200
300
400
500
600
201520142013201220112010
300.
12
326.
02
343.
89
479.
78
560.
68
525.
88
Market Value Per Share (Rupees)
0
100
200
300
400
500
600
700
800
201520142013201220112010
128.
61
82.72 15
1.16
272.
63
678.
29
582.
11
Proxies
Pursuant to Section 161 of the Companies Ordinance, 1984 and according to the Memorandum and Articles of Association of the Company, every shareholder of the Company who is entitled to attend and vote at a general meeting of the Company can appoint another person as his/her proxy to attend and vote instead of him/her. Every notice calling a general meeting of the Company contains a statement that a shareholder entitled to attend and vote is entitled to appoint a proxy. A proxy may not be a member of the Company.
The instrument appointing a proxy (duly signed by the shareholder appointing that proxy) should be deposited at the office of the Company not less than forty-eight (48) hours before the meeting.
Web Presence Updated information regarding the Company can be accessed at Packages website, www.packages.com.pk. The website contains the latest financial results of the Company together with Company’s profile, the corporate philosophy and major products.
ANNUAL REPORT OF PACKAGES LIMITED 2015
55

Pattern of ShareholdingThe shareholding pattern of the equity share capital of the Company as at December 31, 2015 is as follows:
Shareholding Number of Total From To shareholders shares held
1 100 1,835 37,096
101 500 715 204,129
501 1,000 310 242,800
1,001 5,000 503 1,178,820
5,001 10,000 125 914,974
10,001 15,000 56 684,018
15,001 20,000 27 480,798
20,001 25,000 24 549,462
25,001 30,000 21 588,310
30,001 35,000 13 424,180
35,001 40,000 11 418,972
40,001 45,000 15 637,301
45,001 50,000 8 385,009
50,001 55,000 7 367,096
55,001 60,000 5 289,248
60,001 65,000 2 124,167
65,001 70,000 5 340,732
70,001 75,000 1 70,638
75,001 80,000 1 76,413
80,001 85,000 2 161,588
90,001 95,000 3 274,176
95,001 100,000 7 689,066
100,001 105,000 2 202,100
105,001 110,000 2 214,691
110,001 115,000 2 226,859
125,001 130,000 2 252,183
130,001 135,000 1 133,636
135,001 140,000 1 136,999
150,001 155,000 2 302,950
155,001 160,000 3 478,098
160,001 165,000 1 161,746
165,001 170,000 1 166,150
180,001 185,000 1 184,000
185,001 190,000 1 185,850
190,001 95,000 1 193,484
195,001 200,000 3 595,584
205,001 210,000 1 206,609
220,001 225,000 1 221,210
255,001 260,000 1 259,300
265,001 270,000 1 265,960
270,001 275,000 1 273,390
Shareholding Number of Total From To shareholders shares held
275,001 280,000 1 276,734
285,001 290,000 1 287,290
300,001 305,000 2 608,597
305,001 310,000 1 307,820
325,001 330,000 1 326,252
345,001 350,000 1 350,000
385,001 390,000 1 389,000
390,001 395,000 1 393,000
400,001 405,000 1 403,055
410,001 415,000 1 414,100
440,001 445,000 1 440,806
450,001 455,000 1 451,801
505,001 510,000 1 509,200
530,001 535,000 1 533,853
535,001 540,000 1 535,373
555,001 560,000 1 556,000
615,001 620,000 1 616,300
635,001 640,000 1 639,935
665,001 670,000 1 666,879
685,001 690,000 1 689,078
695,001 700,000 1 697,603
820,001 825,000 1 821,714
860,001 865,000 2 1,726,137
895,001 900,000 1 897,750
965,001 970,000 1 968,500
990,001 995,000 1 990,641
1,015,001 1,020,000 1 1,016,263
1,195,001 1,200,000 1 1,198,668
1,660,001 1,665,000 1 1,660,479
1,790,001 1,795,000 1 1,791,159
2,070,001 2,075,000 1 2,075,000
2,285,001 2,290,000 1 2,287,175
3,095,001 3,100,000 1 3,097,030
3,160,001 3,165,000 1 3,160,607
3,255,001 3,260,000 1 3,256,676
3,915,001 3,920,000 1 3,917,505
4,240,001 4,245,000 1 4,240,078
4,850,001 4,855,000 1 4,851,903
5,395,001 5,400,000 1 5,396,650
21,130,001 21,135,000 1 21,133,101
TOTAL 3,766 88,379,504
56

Number of Number ofShareholders’ category shareholders shares held
i. Associated Companies, Undertakings and Related Parties (name wise details) GURMANI FOUNDATION 1 1,198,668 IGI INSURANCE LIMITED 2 21,522,101 BABAR ALI FOUNDATION 1 3,097,030 PACKAGES LIMITED EMPLOYEES’ GRATUITY FUND 2 104,494 PACKAGES LIMITED EMPLOYEES’ PROVIDENT FUND 2 2,067,893 PACKAGES LIMITED MANAGEMENT STAFF PENSION FUND 2 660,036
Total: 10 28,650,222
ii. Mutual Funds (name wise details) CDC - TRUSTEE ABL ISLAMIC PENSION FUND - EQUITY SUB FUND 1 1,800 CDC - TRUSTEE ABL PENSION FUND - EQUITY SUB FUND 1 700 CDC - TRUSTEE ABL STOCK FUND 1 126,000 CDC - TRUSTEE AKD INDEX TRACKER FUND 1 6,539 CDC - TRUSTEE AL MEEZAN MUTUAL FUND 1 689,078 CDC - TRUSTEE AL-AMEEN SHARIAH STOCK FUND 1 897,750 CDC - TRUSTEE ALFALAH GHP ALPHA FUND 1 28,500 CDC - TRUSTEE ALFALAH GHP ISLAMIC STOCK FUND 1 10,600 CDC - TRUSTEE ALFALAH GHP STOCK FUND 1 45,000 CDC - TRUSTEE APF-EQUITY SUB FUND 1 7,500 CDC - TRUSTEE APIF - EQUITY SUB FUND 1 11,000 CDC - TRUSTEE ASKARI ASSET ALLOCATION FUND 1 35,000 CDC - TRUSTEE ASKARI EQUITY FUND 1 33,000 CDC - TRUSTEE ATLAS ISLAMIC STOCK FUND 1 50,000 CDC - TRUSTEE ATLAS STOCK MARKET FUND 1 70,000 CDC - TRUSTEE FAYSAL ISLAMIC ASSET ALLOCATION FUND 1 15,000 CDC - TRUSTEE FIRST CAPITAL MUTUAL FUND 1 7,400 CDC - TRUSTEE FIRST HABIB STOCK FUND 1 9,300 CDC - TRUSTEE HBL - STOCK FUND 1 160,000 CDC - TRUSTEE HBL IPF EQUITY SUB FUND 1 9,400 CDC - TRUSTEE HBL MULTI - ASSET FUND 1 27,150 CDC - TRUSTEE HBL PF EQUITY SUB FUND 1 8,450 CDC - TRUSTEE MCB PAKISTAN ASSET ALLOCATION FUND 1 185,850 CDC - TRUSTEE MCB PAKISTAN ISLAMIC STOCK FUND 1 80,500 CDC - TRUSTEE MCB PAKISTAN STOCK MARKET FUND 1 861,250 CDC - TRUSTEE MEEZAN BALANCED FUND 1 535,373 CDC - TRUSTEE MEEZAN ISLAMIC FUND 1 4,851,903 CDC - TRUSTEE MEEZAN TAHAFFUZ PENSION FUND - EQUITY SUB FUND 1 451,801 CDC - TRUSTEE NATIONAL INVESTMENT (UNIT) TRUST 1 4,240,078 CDC - TRUSTEE NIT ISLAMIC EQUITY FUND 1 95,800 CDC - TRUSTEE NIT-EQUITY MARKET OPPORTUNITY FUND 1 29,982 CDC - TRUSTEE PAKISTAN CAPITAL MARKET FUND 1 53,150 CDC - TRUSTEE PAKISTAN SARMAYA MEHFOOZ FUND 1 43,600 CDC - TRUSTEE UBL RETIREMENT SAVINGS FUND - EQUITY SUB FUND 1 53,650 CDC - TRUSTEE UBL STOCK ADVANTAGE FUND 1 393,000 CDC - TRUSTEE AL-AMEEN ISLAMIC RET. SAV. FUND-EQUITY SUB FUND 1 42,800 CDC - TRUSTEE FIRST HABIB ISLAMIC BALANCED FUND 1 6,100
Informationas required under the Code of Corporate Governance
ANNUAL REPORT OF PACKAGES LIMITED 2015
57

Number of Number ofShareholders’ category shareholders shares held
CDC - TRUSTEE HBL ISLAMIC STOCK FUND 1 49,800 CDC - TRUSTEE PAK. INT. ELEMENT ISLAMIC ASSET ALLOCATION FUND 1 69,400 MCFSL - TRUSTEE ASKARI ISLAMIC ASSET ALLOCATION FUND 1 27,000 MCBFSL - TRUSTEE ABL ISLAMIC STOCK FUND 1 166,150
Total: 41 14,486,354
iii. Directors and their spouse(s) and minor children (name wise details) MUHAMMAD AURANGZEB 1 500 RIZWAN GHANI 1 100 SHAMIM AHMAD KHAN 1 603 SYED ASLAM MEHDI 1 9,781 SYED HYDER ALI 1 2,287,175 SYED SHAHID ALI SHAH 1 2,000 TOWFIQ HABIB CHINOY 1 50,071
Total: 7 2,350,230
iv. Executives 11 5,009,125
v. Public Sector Companies and Corporations 3 4,739,419
vi. Banks, Development Finance Institutions, Non-Banking Finance Institutions, Insurance Companies, Takaful, Modaraba and Pension Funds 35 4,487,790
vii. Shareholders holding five percent or more voting rights in the Listed Company (name wise details)
CDC - TRUSTEE MEEZAN ISLAMIC FUND 1 4,851,903 IGI INSURANCE LIMITED 1 21,133,101 STORA ENSO AB 1 5,396,650
Total: 3 31,381,654
58

No. of No. of Shareholders’ category shareholders shares Percentage
1 Directors, Chief Executive Officer, and their spouses and minor children 7 2,350,230 2.66
2 Associated Companies, undertakings and related parties 10 28,650,222 32.42
3 Banks Development Financial Institutions, Non Banking Financial Institutions 18 2,718,747 3.08
4 Insurance Companies 13 5,940,048 6.725 Modarabas and Mutual Funds 43 14,487,113 16.396 Shareholder holding 10% 1 21,133,101 23.917 General Public:
a. Local 3,539 19,492,471 22.05b. Foreign 6 7,008,339 7.93
8 Others 130 7,732,334 8.75
Total (excluding: shareholder holding 10%) 3,766 88,379,504 100.00
Share Price and Volume
The monthly high and low prices and the volume of shares traded on the Stock Exchange during the financial year 2015 are as under:
Share price on Volume of shares the PSX (Rs.) traded
Month Highest Lowest
January 750.00 652.00 937,650
February 742.99 646.00 84,450
March 648.95 490.39 292,550
April 602.59 542.10 1,892,250
May 576.00 519.10 175,100
June 631.85 550.00 539,550
July 667.00 589.00 230,650
August 628.90 525.00 1,634,100
September 594.00 511.05 329,200
October 564.99 519.25 408,600
November 648.00 538.00 1,956,350
December 634.50 556.50 1,130,150
ANNUAL REPORT OF PACKAGES LIMITED 2015
59
This statement is being presented to comply with the Code of Corporate Governance (the “Code”) contained in Regulation No 5.19 of the Pakistan Stock Exchange for the purpose of establishing a framework of good governance, whereby a listed company is managed in compliance with the best practices of corporate governance.
The Company has applied the principles contained in the Code in the following manner:
1. The Company encourages representation of independent non-executive directors and directors representing minority interests on its Board of Directors. At present the Board includes:
Category Names
Independent Director Mr. Muhammad Aurangzeb
Executive Directors Syed Hyder Ali Mr. Rizwan Ghani
Non-Executive Directors Mr. Towfiq Habib Chinoy Mr. Josef Meinrad Mueller Syed Aslam Mehdi Mr. Shamim Ahmad Khan Syed Shahid Ali Mr. Tariq Iqbal Khan Mr. Jari Latvanen
The Independent Director meets the criteria of independence under clause 5.19.1 (b) of the Code.
2. The Directors have confirmed that none of them is serving as a director on more than seven listed companies, including this Company (excluding the listed subsidiaries of listed holding companies).
3. All the resident directors of the Company are registered as taxpayers and none of them has defaulted in payment of any loan to a banking company, a DFI or an NBFI or, being a member of stock exchange, has been declared as a defaulter by that stock exchange.
4. A casual vacancy that occurred on the Board on July 7, 2015 was filled up by the Directors on the same day.
Statement of Compliance With the Code of Corporate Governance for the year ended December 31, 2015
5. The Company has prepared a “Code of Conduct” and has ensured that appropriate steps have been taken to disseminate it throughout the Company along with its supporting policies and procedures.
6. The Board has developed a Vision / Mission Statement, overall corporate strategy and significant policies of the Company. A complete record of particulars of significant policies along with the dates on which they were approved or amended has been maintained.
7. All the powers of the Board have been duly exercised and decisions on material transactions, including appointment and determination of remuneration and terms and conditions of employment of the CEO, other executive and Non-Executive Directors, have been taken by the Board.
8. The meetings of the Board were presided over by the Chairman and, in his absence, by a Director elected by the Board for this purpose and the Board met at least once in every quarter. Written notices of the Board meetings, along with agenda and working papers, were circulated at least seven days before the meetings. The minutes of the meetings were appropriately recorded and circulated.
9. The Company arranged one orientation course for its Directors during the year to apprise them of their duties and responsibilities. As per clause 5.19.7 of the Code, eight directors meet the certification requirements, while the remaining two directors need to obtain the certification under the directors training program which meets the criteria specified by the Securities and Exchange Commission of Pakistan by June 2016.
10. The Board had approved appointment of CFO, Company Secretary and Head of Internal Audit, including their remuneration and terms and conditions of employment as determined by the CEO. No new appointments of CFO, Company Secretary and Head of Internal Audit have been made during the year.
11. The Directors’ Report for this year has been prepared in compliance with the requirements of the Code and fully describes the salient matters required to be disclosed.
60

12. The financial statements of the Company were duly endorsed by CEO and CFO before approval of the Board.
13. The Directors, CEO and executives do not hold any interest in the shares of the Company other than that disclosed in the pattern of shareholding.
14. The Company has complied with all the corporate and financial reporting requirements of the Code.
15. The Board has formed an Audit Committee. It comprises of five members including one Independent Director and four Non-executive Directors, including the Chairman.
16. The meetings of the Audit Committee were held at least once every quarter prior to approval of interim and final results of the Company as required by the Code. The terms of reference of the Committee have been formed and advised to the Committee for compliance.
17. The Board has formed a Human Resource and Remuneration Committee. It comprises of five members, of whom four are non-executive directors, including the Chairman.
18. The Board has set up an effective internal audit function manned by suitably qualified and experienced personnel for the purpose and are conversant with the policies and procedures of the Company.
19. The statutory auditors of the Company have confirmed that they have been given a satisfactory rating under the quality control review program of the ICAP, that they or any of the partners of the firm, their spouses and minor children do not hold shares of the Company and that the firm and all its partners are in compliance with International Federation of Accountants (IFAC) guidelines on code of ethics as adopted by the ICAP.
20. The statutory auditors or the persons associated with them have not been appointed to provide other services except in accordance with the listing regulations and the auditors have confirmed that they have observed IFAC guidelines in this regard.
21. The ‘closed period’, prior to the announcement of interim / final results, and business decisions, which may materially affect the market price of the Company’s securities, was determined and intimated to directors, employees and stock exchange.
22. Material / price sensitive information has been disseminated among all market participants at once through stock exchange.
23. We confirm that all other material principles enshrined in the Code have been complied with.
(Towfiq Habib Chinoy)ChairmanKarachi, February 25, 2016
ANNUAL REPORT OF PACKAGES LIMITED 2015
61

We have reviewed the enclosed Statement of Compliance with the best practices contained in the Code of Corporate Governance (‘the Code’) prepared by the Board of Directors of Packages Limited (‘the Company’) for the year ended December 31, 2015 to comply with the Listing Regulation No. 5.19 of the Pakistan Stock Exchange, where the Company is listed.
The responsibility for compliance with the Code is that of the Board of Directors of the Company. Our responsibility is to review, to the extent where such compliance can be objectively verified, whether the Statement of Compliance reflects the status of the Company’s compliance with the provisions of the Code and report if it does not and to highlight any non-compliance with the requirements of the Code. A review is limited primarily to inquiries of the Company’s personnel and review of various documents prepared by the Company to comply with the Code.
As a part of our audit of financial statements we are required to obtain an understanding of the accounting and internal control systems sufficient to plan the audit and develop an effective audit approach. We are not required to consider whether the Board of Directors’ statement on internal control covers all risks and controls, or to form an opinion on the effectiveness of such internal controls, the Company’s corporate governance procedures and risks.
The Code requires the Company to place before the Audit Committee, and upon recommendation of Audit Committee, place before the Board of Directors for their review and approval its related party transactions distinguishing between transactions carried out on terms equivalent to those that prevail in arm’s length transactions and transactions which are not executed at arm’s length
Review Report to the Members on the Statement of Compliance with the Code of Corporate Governance
price and recording proper justification for using such alternate pricing mechanism. We are only required and have ensured compliance of requirement to the extent of approval of the related party transactions by the Board of Directors upon recommendation of the Audit Committee. We have not carried out any procedures to determine whether the related party transactions were undertaken at arm›s length price or not.
Based on our review, nothing has come to our attention which causes us to believe that the Statement of Compliance does not appropriately reflect the Company’s compliance, in all material respects, with the best practices contained in the Code as applicable to the Company for the year ended December 31, 2015.
A.F. Ferguson & Co. Chartered AccountantsLahore, March 11, 2016
Name of engagement partner:Asad Aleem Mirza
62

63
ANNUAL REPORT OF PACKAGES LIMITED 2015
63
(a) in our opinion, proper books of account have been kept by the Company as required by the Companies Ordinance, 1984;
(b) in our opinion
(i) the balance sheet and profit and loss account together with the notes thereon have been drawn up in conformity with the Companies Ordinance, 1984, and are in agreement with the books of account and are further in accordance with accounting policies consistently applied except for the changes resulted on initial application of standards, amendments, or an interpretation to the existing standards as stated in note 2.2.1 to the annexed financial statements, with which we concur;
(ii) the expenditure incurred during the year was for the purpose of the Company’s business; and
(iii) the business conducted, investments made and the expenditure incurred during the year were in accordance with the objects of the Company;
(c) in our opinion and to the best of our information and according to the explanations given to us, the balance sheet, profit and loss account, statement of comprehensive income,
We have audited the annexed balance sheet of Packages Limited as at December 31, 2015 and the related profit and loss account, statement of comprehensive income, statement of changes in equity and cash flow statement, together with the notes forming part thereof, for the year then ended and we state that we have obtained all the information and explanations which, to the best of our knowledge and belief, were necessary for the purposes of our audit.
It is the responsibility of the Company’s management to establish and maintain a system of internal control, and prepare and present the above said statements in conformity with the approved accounting standards and the requirements of the Companies Ordinance, 1984. Our responsibility is to express an opinion on these statements based on our audit.
We conducted our audit in accordance with the auditing standards as applicable in Pakistan. These standards require that we plan and perform the audit to obtain reasonable assurance about whether the above said statements are free of any material misstatement. An audit includes examining, on a test basis, evidence supporting the amounts and disclosures in the above said statements. An audit also includes assessing the accounting policies and significant estimates made by management, as well as, evaluating the overall presentation of the above said statements. We believe that our audit provides a reasonable basis for our opinion and, after due verification, we report that:
statement of changes in equity and cash flow statement together with the notes forming part thereof conform with approved accounting standards as applicable in Pakistan, and, give the information required by the Companies Ordinance, 1984, in the manner so required and respectively give a true and fair view of the state of the Company’s affairs as at December 31, 2015 and of the profit, total comprehensive income, changes in equity and its cash flows for the year then ended; and
(d) in our opinion Zakat deductible at source under the Zakat and Ushr Ordinance, 1980, was deducted by the Company and deposited in the Central Zakat Fund established under section 7 of that Ordinance.
A.F. Ferguson & Co.Chartered AccountantsLahore, March 11, 2016
Name of engagement partner: Asad Aleem Mirza
AUDITORS’ REPORT TO THE MEMBERS

64
64
65
65
ANNUAL REPORT OF PACKAGES LIMITED 2015
Financial StatementsFor the year ended December 31, 2015

66
66
BALANCE SHEETas at December 31, 2015
(Rupees in thousand) Note 2015 2014
EQUITY AND LIABILITIES
CAPITAL AND RESERVES Authorised capital 150,000,000 (2014: 150,000,000) ordinary shares of Rs. 10 each 1,500,000 1,500,000 22,000,000 (2014: 22,000,000) 10% non-voting preference shares / convertible stock of Rs. 190 each 4,180,000 4,180,000 Issued, subscribed and paid up capital 88,379,504 (2014: 86,379,504) ordinary shares of Rs. 10 each 5 883,795 863,795 Reserves 6 41,878,330 44,766,414 Preference shares / convertible stock reserve 7 1,309,682 1,571,699 Accumulated profit 3,714,566 2,800,819
47,786,373 50,002,727 NON-CURRENT LIABILITIES
Long term finances 7 3,729,181 4,228,815 Liabilities against assets subject to finance lease 8 27,653 25,685 Deferred tax 9 246,120 292,841 Retirement benefits 10 40,425 –Deferred liabilities 11 201,576 174,581
4,244,955 4,721,922 CURRENT LIABILITIES
Current portion of long term liabilities 12 392,285 204,696 Finances under mark up arrangements - secured 13 884,481 1,262,596 Trade and other payables 14 3,278,124 3,144,680 Accrued finance costs 15 349,282 517,634
4,904,172 5,129,606 CONTINGENCIES AND COMMITMENTS 16 – –
56,935,500 59,854,255

67
67
ANNUAL REPORT OF PACKAGES LIMITED 2015
(Rupees in thousand) Note 2015 2014
ASSETS
NON-CURRENT ASSETS
Property, plant and equipment 17 3,804,477 3,685,677 Investment property 18 155,426 137,787 Intangible assets 19 20,729 37,652 Investments 20 44,997,518 47,304,365 Long term loans and deposits 21 39,247 52,558 Retirement benefits 10 - 87,881
49,017,397 51,305,920
CURRENT ASSETS
Stores and spares 22 488,061 492,967 Stock-in-trade 23 1,780,177 2,230,500 Trade debts 24 1,781,022 1,527,372 Loans, advances, deposits, prepayments and other receivables 25 1,346,088 1,797,214 Income tax receivable 26 2,421,015 2,247,790 Cash and bank balances 27 101,740 252,492
7,918,103 8,548,335
56,935,500 59,854,255
The annexed notes 1 to 47 form an integral part of these financial statements.
Towfiq Habib Chinoy Syed Hyder Ali Rizwan Ghani Chairman Chief Executive & Managing Director Director

68
68
(Rupees in thousand) Note 2015 2014
Local sales 18,682,977 17,581,898 Export sales 28,321 45,460
18,711,298 17,627,358
Less: Sales tax and excise duty 2,657,232 2,515,545 Commission 29,089 24,463
2,686,321 2,540,008 Net sales 16,024,977 15,087,350 Cost of sales 28 (12,663,569) (12,872,825)
Gross profit 3,361,408 2,214,525
Administrative expenses 29 (752,730) (787,249)Distribution and marketing costs 30 (677,944) (580,062)Other operating expenses 31 (347,105) (221,968)Other income 32 244,022 322,147
Profit from operations 1,827,651 947,393
Finance costs 33 (643,032) (751,551)Investment income 34 2,617,891 2,553,678
Profit before tax 3,802,510 2,749,520 Tax 35 (507,094) (213,216)
Profit for the year 3,295,416 2,536,304
Earnings per share Basic Rupees 43 37.42 29.89 Diluted Rupees 43 33.62 26.59
The annexed notes 1 to 47 form an integral part of these financial statements.
Towfiq Habib Chinoy Syed Hyder Ali Rizwan Ghani Chairman Chief Executive & Managing Director Director
PROFIT AND LOSS ACCOUNTfor the year ended December 31, 2015

69
69
ANNUAL REPORT OF PACKAGES LIMITED 2015
(Rupees in thousand) 2015 2014
Profit for the year 3,295,416 2,536,304 Other comprehensive income: Items that will not be reclassified to profit or loss Remeasurement of retirement benefits liability / asset (136,067) 82,823 Tax effect 40,814 (28,988)
(95,253) 53,835 Items that may be reclassified subsequently to profit or loss (Deficit) / surplus on remeasurement of available for sale financial assets (4,744,022) 5,656,334
Other comprehensive (loss) / income for the year - net of tax (4,839,275) 5,710,169 Total comprehensive (loss) / income for the year (1,543,859) 8,246,473 The annexed notes 1 to 47 form an integral part of these financial statements.
Towfiq Habib Chinoy Syed Hyder Ali Rizwan Ghani Chairman Chief Executive & Managing Director Director
STATEMENT OF COMPREHENSIVE INCOMEfor the year ended December 31, 2015

70
70
Balance as on December 31, 2013 843,795 2,876,893 23,566,916 11,610,333 1,605,875 1,585,716 42,089,528
Appropriation of funds
Transferred to general reserve account - - - 700,000 - (700,000) -
Total transactions with owners, recognised directly in equity
Final dividend for the year ended December 31, 2013
Rs. 8.00 per share - - - - - (675,036) (675,036)
Conversion of preference shares / convertible stock into
ordinary share capital (2,000,000 ordinary shares
of Rs. 10 each) 20,000 355,938 - - (34,176) - 341,762
20,000 355,938 - - (34,176) (675,036) (333,274)
Total comprehensive income for the year ended
December 31, 2014
Profit for the year - - - - - 2,536,304 2,536,304
Other comprehensive income:
Surplus on remeasurement of available for sale financial assets - - 5,656,334 - - - 5,656,334
Remeasurement of retirement benefit asset / liability - net of tax - - - - - 53,835 53,835
Total comprehensive income for the year - - 5,656,334 - - 2,590,139 8,246,473
Balance as on December 31, 2014 863,795 3,232,831 29,223,250 12,310,333 1,571,699 2,800,819 50,002,727
Appropriation of funds
Transferred to general reserve account - - - 1,500,000 - (1,500,000) -
Total transactions with owners, recognised directly in equity
Final dividend for the year ended December 31, 2014
Rs. 9.00 per share - - - - - (786,416) (786,416)
Conversion of preference shares / convertible stock into
ordinary share capital (2,000,000 ordinary shares
of Rs. 10 each) 20,000 355,938 - - (262,017) - 113,921
20,000 355,938 - - (262,017) (786,416) (672,495)
Total comprehensive income for the year ended
December 31, 2015
Profit for the year - - - - - 3,295,416 3,295,416
Other comprehensive income:
Deficit on remeasurement of available for sale financial assets - - (4,744,022) - - - (4,744,022)
Remeasurement of retirement benefit asset / liability - net of tax - - - - - (95,253) (95,253)
Total comprehensive (loss) / income for the year - - (4,744,022) - - 3,200,163 (1,543,859)
Balance as on December 31, 2015 883,795 3,588,769 24,479,228 13,810,333 1,309,682 3,714,566 47,786,373
The annexed notes 1 to 47 form an integral part of these financial statements.
Preference shares / Share Share Fair value General convertible Accumulated(Rupees in thousand) capital premium reserve reserve stock reserve profit Total
Towfiq Habib Chinoy Syed Hyder Ali Rizwan Ghani Chairman Chief Executive & Managing Director Director
STATEMENT OF CHANGES IN EQUITYfor the year ended December 31, 2015
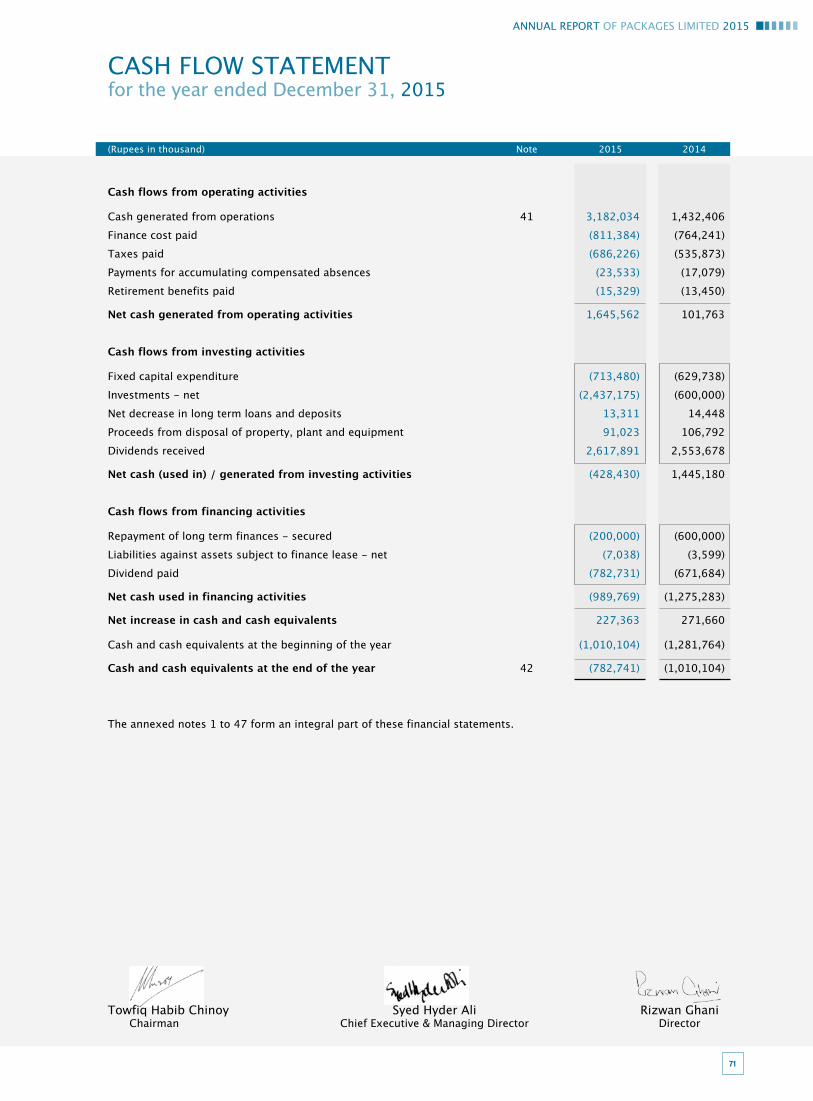
71
71
ANNUAL REPORT OF PACKAGES LIMITED 2015
Towfiq Habib Chinoy Syed Hyder Ali Rizwan Ghani Chairman Chief Executive & Managing Director Director
(Rupees in thousand) Note 2015 2014
Cash flows from operating activities
Cash generated from operations 41 3,182,034 1,432,406 Finance cost paid (811,384) (764,241)Taxes paid (686,226) (535,873)Payments for accumulating compensated absences (23,533) (17,079)Retirement benefits paid (15,329) (13,450)
Net cash generated from operating activities 1,645,562 101,763 Cash flows from investing activities
Fixed capital expenditure (713,480) (629,738)Investments - net (2,437,175) (600,000)Net decrease in long term loans and deposits 13,311 14,448 Proceeds from disposal of property, plant and equipment 91,023 106,792 Dividends received 2,617,891 2,553,678
Net cash (used in) / generated from investing activities (428,430) 1,445,180 Cash flows from financing activities
Repayment of long term finances - secured (200,000) (600,000)Liabilities against assets subject to finance lease - net (7,038) (3,599)Dividend paid (782,731) (671,684)
Net cash used in financing activities (989,769) (1,275,283)
Net increase in cash and cash equivalents 227,363 271,660
Cash and cash equivalents at the beginning of the year (1,010,104) (1,281,764)
Cash and cash equivalents at the end of the year 42 (782,741) (1,010,104) The annexed notes 1 to 47 form an integral part of these financial statements.
CASH FLOW STATEMENTfor the year ended December 31, 2015

72
72
1. Legal status and nature of business
Packages Limited (‘the Company’) is a public limited company incorporated in Pakistan and is listed on Pakistan Stock Exchange. It is principally engaged in the manufacture and sale of packaging materials and tissue products. The registered office of the Company is situated at 4th Floor, the Forum, Suite No. 416 - 422, G-20, Block 9, Khayaban-e-Jami, Clifton, Karachi, Pakistan. Head office and factory is located at Shahrah-e-Roomi, P.O. Amer Sidhu, Lahore, Pakistan.
The Company also holds investment in companies engaged in the manufacture and sale of inks, flexible
packaging material, paper, paperboard and corrugated boxes, biaxially oriented polypropylene (BOPP) film and cast polypropylene (CPP) film, and companies engaged in insurance and real estate business.
2. Basis of preparation
2.1 These financial statements have been prepared in accordance with the requirements of the Companies Ordinance, 1984 (‘the Ordinance’) and the approved accounting standards as applicable in Pakistan. Approved accounting standards comprise of such International Financial Reporting Standards (IFRS) issued by the International Accounting Standards Board and Islamic Financial Accounting Standards (IFAS) issued by the Institute of Chartered Accountants of Pakistan as are notified under the Companies Ordinance, 1984, provisions of and directives issued under the Companies Ordinance, 1984. Wherever the requirements of the Companies Ordinance, 1984 or directives issued by Securities and Exchange Commission of Pakistan differ with the requirements of IFRS or IFAS, the requirements of the Companies Ordinance, 1984 or the requirements of the said directives prevail.
2.2 Initial application of standards, amendments or an interpretation to existing standards
The following amendments to existing standards have been published that are applicable to the Company’s financial statements covering annual periods, beginning on or after the following dates:
2.2.1 Amendments to published standards effective in current year
New and amended standards and interpretations mandatory for the first time for the financial year beginning January 01, 2015:
Annual improvements 2012 are applicable for annual periods beginning on or after July 01, 2014. These amendments include changes from the 2010-12 cycle of the annual improvements project, that affect 7 standards: IFRS 2, ‘Share-based payment’, IFRS 3, ‘Business Combinations’, IFRS 8, ‘Operating segments’, IFRS 13, ‘Fair value measurement’, IAS 16, ‘Property, plant and equipment’ and IAS 38, ‘Intangible assets’, Consequential amendments to IFRS 9, ‘Financial instruments’, IAS 37, ‘Provisions, contingent liabilities and contingent assets’, and IAS 39, ‘Financial instruments – Recognition and measurement’. The application of these amendments has no material impact on the Company’s financial statements.
Annual improvements 2013 are applicable for annual periods beginning on or after July 01, 2014. The amendments
include changes from the 2011-13 cycle of the annual improvements project that affect 4 standards: IFRS 1, ‘First time adoption’, IFRS 3, ‘Business combinations’, IFRS 13, ‘Fair value measurement’ and IAS 40, ‘Investment property’. The application of these amendments has no material impact on the Company’s financial statements.
IAS 19 (Amendments), ‘Employee benefits’ is applicable on accounting periods beginning on or after July 01,
2014. These amendments apply to contributions from employees or third parties to defined benefit plans. The objective of the amendments is to simplify the accounting for contributions that are independent of the number of years of employee service, for example, employee contributions that are calculated according to a fixed percentage of salary. The application of these amendments has no material impact on the Company’s financial statements.
IFRS 10, ‘Consolidated financial statements’ is applicable on accounting periods beginning on or after January
01, 2015. This standard builds on existing principles by identifying the concept of control as the determining factor in whether an entity should be included within the consolidated financial statements. The standard provides additional guidance to assist in determining control where this is difficult to assess. The application of this standard has no material impact on the Company’s financial statements.
NOTES TO AND FORMING PART OF THE FINANCIAL STATEMENTSfor the year ended December 31, 2015

73
73
ANNUAL REPORT OF PACKAGES LIMITED 2015
IFRS 11, ‘Joint arrangements’ is applicable on accounting periods beginning on or after January 01, 2015. IFRS 11 is a more realistic reflection of joint arrangements by focusing on the rights and obligations of the parties to the arrangement rather than its legal form. There are two types of joint arrangements: joint operations and joint ventures. Joint operations arise where a joint operator has rights to the assets and obligations relating to the arrangement and therefore accounts for its share of assets, liabilities, revenue and expenses. Joint ventures arise where the joint operator has rights to the net assets of the arrangement and therefore equity accounts for its interest. Proportional consolidation of joint ventures is no longer allowed. The application of this standard has no material impact on the Company’s financial statements.
IFRS 12, ‘Disclosures of interests in other entities’ is applicable on accounting periods beginning on or after
January 01, 2015. This standard includes the disclosure requirements for all forms of interests in other entities, including joint arrangements, associates, special purpose vehicles and other off balance sheet vehicles. The application of this standard has no material impact on the Company’s financial statements.
Amendments to IFRS 10, 11 and 12 on transition guidance are applicable on accounting periods beginning on
or after January 01, 2015. These amendments also provide additional transition relief in IFRS 10, 11 and 12, limiting the requirement to provide adjusted comparative information to only the preceding comparative period. For disclosures related to unconsolidated structured entities, the amendments will remove the requirement to present comparative information for periods before IFRS 12 is first applied. The application of these amendments has no material impact on the Company’s financial statements.
Amendments to IFRS 10, 11 and IAS 27 on consolidation for investment entities are applicable on accounting
periods beginning on or after January 01, 2015. These amendments mean that many funds and similar entities will be exempt from consolidating most of their subsidiaries. Instead, they will measure them at fair value through profit or loss. The amendments give an exception to entities that meet an ‘investment entity’ definition and which display particular characteristics. Changes have also been made in IFRS 12, ‘Disclosures of interests in other entities’ to introduce disclosures that an investment entity needs to make. The application of these amendments has no material impact on the Company’s financial statements.
IFRS 13, ‘Fair value measurement’ is applicable on accounting periods beginning on or after January 01, 2015.
This standard aims to improve consistency and reduce complexity by providing a precise definition of fair value and a single source of fair value measurement and disclosure requirements for use across IFRS. The requirements, which are largely aligned between IFRS and US GAAP, do not extend the use of fair value accounting but provide guidance on how it should be applied where its use is already required or permitted by other standards within IFRS or US GAAP. The application of this standard has no material impact on the Company’s financial statements expect for certain additional fair value disclosures as provided in note 44.4.
2.2.2 Standards, amendments and interpretations to existing standards that are not yet effective and have not
been early adopted by the Company
The following amendments and interpretations to existing standards have been published and are mandatory for the Company’s accounting periods beginning on or after January 01, 2016 or later periods, but the Company has not early adopted them:
Annual improvements 2014 are applicable for annual periods beginning on or after January 01, 2016. The
amendments include changes from the 2012-14 cycle of the annual improvements project that affect 4 standards: IFRS 5, ‘Non current assets held for sale and discontinued operations’ regarding methods of disposal, IFRS 7, ‘Financial instruments: Disclosures’ with consequential amendments to IFRS 1 regarding servicing contracts, IAS 19, ‘Employee benefits’ regarding discount rates and IAS 34, ‘Interim financial reporting’ regarding disclosure of information. The Company shall apply these amendments from January 01, 2016 and does not expect to have a material impact on its financial statements.
Amendments to IAS 16, ‘Property, plant and equipment’ and IAS 41, ‘Agriculture’, regarding bearer plants
are applicable on accounting periods beginning on or after January 01, 2016. These amendments change the financial reporting for bearer plants, such as grape vines, rubber trees and oil palms. The IASB decided

74
74
that bearer plants should be accounted for in the same way as property, plant and equipment because their operation is similar to that of manufacturing. Consequently, the amendments include them within the scope of IAS 16 instead of IAS 41. The produce growing on bearer plants will remain within the scope of IAS 41. These amendments do not have a material impact on the Company’s financial statements.
Amendments to IAS 16, ‘Property, plant and equipment’ and IAS 38, ‘Intangible assets’ are applicable on
accounting periods beginning on or after January 01, 2016. IASB has clarified that the use of revenue based methods to calculate the depreciation of an asset is not appropriate because revenue generated by an activity that includes the use of an asset generally reflects factors other than the consumption of the economic benefits embodied in the asset. The IASB has also clarified that revenue is generally presumed to be an inappropriate basis for measuring the consumption of the economic benefits embodied in an intangible asset. The Company shall apply these amendments from January 01, 2016 and does not expect to have a material impact on its financial statements.
IAS 27 (Amendments), ‘Separate financial statements’ are applicable on accounting periods beginning on or
after January 1, 2016. These provide entities the option to use the equity method to account for investments in subsidiaries, joint ventures and associates in their separate financial statements. The Company shall apply these amendments from January 01, 2016 and has not yet evaluated whether it shall change its accounting policy to avail this option.
IFRS 9, ‘Financial instruments’ - classification and measurement is applicable on accounting periods beginning on or after January 01, 2015. This standard on classification and measurement of financial assets and financial liabilities will replace IAS 39, ‘Financial instruments: Recognition and measurement’. IFRS 9 has two measurement categories: amortised cost and fair value. All equity instruments are measured at fair value. A debt instrument is measured at amortised cost only if the entity is holding it to collect contractual cash flows and the cash flows represent principal and interest. For liabilities, the standard retains most of the requirements of IAS 39 . These include amortised-cost accounting for most financial liabilities, with bifurcation of embedded derivatives. The main change is that, in cases where the fair value option is taken for financial liabilities, the part of a fair value change due to an entity’s own credit risk is recorded in other comprehensive income rather than the income statement, unless this creates an accounting mismatch. This change will mainly affect financial institutions. This IFRS is under consideration of the relevant Committee of the Institute of Chartered Accountants of Pakistan. The Company has yet to assess the impact of these changes on its financial statements.
IFRS 9, ‘Financial instruments’ is applicable on accounting periods beginning on or after January 01, 2018. IASB
has published the complete version of IFRS 9, ‘Financial Instruments’, which replaces the guidance in IAS 39. This final version includes requirements on the classification and measurement of financial assets and liabilities; it also includes an expected credit losses model that replaces the incurred loss impairment model used today. This IFRS is under consideration of the relevant Committee of the Institute of Chartered Accountants of Pakistan. The Company has yet to assess the impact of these changes on its financial statements.
Amendments to IFRS 10, ‘Consolidated financial statements’ and IAS 28, ‘Investments in associates and joint
ventures’ are applicable on accounting periods beginning on or after January 01, 2016. These amendments address an inconsistency between the requirements in IFRS 10 and those in IAS 28 in dealing with the sale or contribution of assets between an investor and its associate or joint venture. The main consequence of the amendments is that a full gain or loss is recognised when a transaction involves a business, whether it is housed in a subsidiary or not. A partial gain or loss is recognised when a transaction involves assets that do not constitute a business, even if these assets are housed in a subsidiary. The Company shall apply these amendments from January 01, 2016 and does not expect to have a material impact on its financial statements.
Amendments to IFRS 10, ‘Consolidated financial statements’ and IAS 28, ‘Investments in associates and joint
ventures’ are applicable on accounting periods beginning on or after January 01, 2016. These amendments clarify the application of the consolidation exception for investment entities and their subsidiaries. The Company shall apply these amendments from January 01, 2016 and does not expect to have a material impact on its financial statements.

75
75
ANNUAL REPORT OF PACKAGES LIMITED 2015
IFRS 11 (Amendment), ‘Joint arrangements’ on acquisition of an interest in a joint operation is applicable on accounting periods beginning on or after 01 January 2016. This amendment adds new guidance on how to account for the acquisition of an interest in a joint operation that constitutes a business. The amendments specify the appropriate accounting treatment for such acquisitions. The Company shall apply this amendment from January 01, 2016 and does not expect to have a material impact on its financial statements.
IFRS 14, ‘Regulatory deferral accounts’ is applicable on accounting periods beginning on or after January 01,
2016. This standard permits first time adopters to continue to recognise amounts related to rate regulation in accordance with their previous GAAP requirements when they adopt IFRS. However, to enhance comparability with entities that already apply IFRS and do not recognise such amounts, the standard requires that the effect of rate regulation must be presented separately from other items. The Company shall apply this standard from January 01, 2016 and does not expect to have a material impact on its financial statements.
IFRS 15, ‘Revenue from contracts with customers’ is applicable on accounting periods beginning on or after
January 01, 2017. This is a converged standard from the IASB and FASB on revenue recognition. The standard will improve the financial reporting of revenue and improve comparability of the top line in financial statements globally. The Company shall apply this standard from January 01, 2017 and does not expect to have a material impact on its financial statements.
Amendments to IAS 1, ‘Presentation of financial statements’ on the disclosure initiative are applicable on annual
periods beginning on or after January 01, 2016, subject to EU endorsement. These amendments are part of the IASB initiative to improve presentation and disclosure in financial reports. The Company has yet to assess the impact of these amendments on its financial statements.
3. Basis of measurement
3.1 These financial statements have been prepared under the historical cost convention except for revaluation of certain financial instruments at fair value and recognition of certain employee retirement benefits at present value.
3.2 The Company’s significant accounting policies are stated in note 4. Not all of these significant policies require
the management to make difficult, subjective or complex judgments or estimates. The following is intended to provide an understanding of the policies that the management considers critical because of their complexity, judgment and estimation involved in their application and impact on these financial statements. Judgments and estimates are continually evaluated and are based on historical experience, including expectations of future events that are believed to be reasonable under the circumstances. These judgments involve assumptions or estimates in respect of future events and the actual results may differ from these estimates. The areas involving a higher degree of judgments or complexity or areas where assumptions and estimates are significant to the financial statements are as follows:
i) Estimated useful life of property, plant and equipment - note 4.2 ii) Provision for employees’ retirement benefits - note 4.7 & 10 iii) Provision for tax - note 35
4. Significant accounting policies
The significant accounting policies adopted in the preparation of these financial statements are set out below. These policies have been consistently applied to all the years presented, unless otherwise stated.
4.1 Tax
Current
Provision of current tax is based on the taxable income for the year determined in accordance with the prevailing law for taxation of income. The charge for current tax is calculated using prevailing tax rates or tax rates expected to apply to the profit for the year, if enacted. The charge for current tax also includes adjustments, where considered necessary, to provision for tax made in previous years arising from assessments framed during the year for such years.

76
76
Deferred
Deferred tax is accounted for using the balance sheet liability method in respect of all temporary differences arising from differences between the carrying amount of assets and liabilities in the financial statements and the corresponding tax bases used in the computation of the taxable profit. Deferred tax liabilities are generally recognised for all taxable temporary differences and deferred tax assets are recognised to the extent that it is probable that taxable profits shall be available against which the deductible temporary differences, unused tax losses and tax credits can be utilised.
Deferred tax is calculated at the rates that are expected to apply to the period when the differences reverse
based on tax rates that have been enacted or substantively enacted by the balance sheet date. Deferred tax is charged or credited in the profit and loss account, except in the case of items credited or charged to equity in which case it is included in equity.
4.2 Property, plant and equipment
Property, plant and equipment, except freehold land, are stated at cost less accumulated depreciation and any identified impairment loss. Freehold land is stated at cost less any identified impairment loss. Cost in relation to certain plant and machinery signifies historical cost, gains and losses transferred from equity on qualifying cash flow hedges as referred to in note 4.17 and borrowing costs as referred to in note 4.20.
Asset subject to finance lease are initially recognised at the lower of present value of minimum lease payments
under the lease agreements and the fair value of the assets. Subsequently these assets are stated at cost less accumulated depreciation and any identified impairment loss.
Depreciation on all property, plant and equipment is charged to profit on the straight-line method so as to write
off the depreciable amount of an asset over its estimated useful life at the following annual rates:
- Buildings 2.5% to 20% - Plant and machinery 6.25% to 33.33% - Other equipments 10% to 33.33% - Furniture and fixtures 10% to 20% - Vehicles 20% The assets’ residual values and useful lives are reviewed, at each financial year end, and adjusted if impact on
depreciation is significant. The Company’s estimate of the residual value of its property, plant and equipment as at December 31, 2015 has not required any adjustment as its impact is considered insignificant.
Depreciation on additions to property, plant and equipment is charged from the month in which an asset is
acquired or capitalised while no depreciation is charged for the month in which the asset is disposed off. The Company assesses at each balance sheet date whether there is any indication that property, plant and
equipment may be impaired. If such indication exists, the carrying amounts of such assets are reviewed to assess whether they are recorded in excess of their recoverable amount. Where carrying amounts exceed the respective recoverable amount, assets are written down to their recoverable amounts and the resulting impairment loss is recognised in profit and loss account. The recoverable amount is the higher of an asset’s fair value less costs to sell and value in use. Where an impairment loss is recognised, the depreciation charge is adjusted in the future periods to allocate the asset’s revised carrying amount over its estimated useful life.
Subsequent costs are included in the asset’s carrying amount or recognised as a separate asset, as appropriate,
only when it is probable that future economic benefits associated with the item shall flow to the Company and the cost of the item can be measured reliably. All other repair and maintenance costs are charged to profit and loss account during the period in which they are incurred.
The gain or loss on disposal or retirement of an asset represented by the difference between the sale proceeds
and the carrying amount of the asset is recognised as an income or expense.
77
77
ANNUAL REPORT OF PACKAGES LIMITED 2015
Capital work-in-progress is stated at cost less any identified impairment loss.
4.3 Investment property
Property not held for own use or for sale in the ordinary course of business is classified as investment property. The investment property of the Company comprises land and buildings and is valued using the cost method i.e. at cost less any accumulated depreciation and any identified impairment loss.
Depreciation on buildings is charged to profit on the straight line method so as to write off the depreciable amount
of building over its estimated useful life at the rates ranging from 3.33% to 6.67% per annum. Depreciation on additions to investment property is charged from the month in which a property is acquired or capitalised while no depreciation is charged for the month in which the property is disposed off.
The assets’ residual values and useful lives are reviewed, at each financial year end, and adjusted if impact
on depreciation is significant. The Company’s estimate of the residual value of its investment property as at December 31, 2015 has not required any adjustment as its impact is considered insignificant.
The Company assesses at each balance sheet date whether there is any indication that investment property may
be impaired. If such indication exists, the carrying amounts of such assets are reviewed to assess whether they are recorded in excess of their recoverable amount. Where carrying amounts exceed the respective recoverable amount, assets are written down to their recoverable amount and the resulting impairment loss is recognised in profit and loss account. The recoverable amount is the higher of an asset’s fair value less costs to sell and value in use. Where an impairment loss is recognised, the depreciation charge is adjusted in the future periods to allocate the asset’s revised carrying amount over its estimated useful life.
The gain or loss on disposal or retirement of an asset represented by the difference between the sale proceeds
and the carrying amount of the asset is recognised as an income or expense. 4.4 Intangible assets
Expenditure incurred to acquire computer software and SAP Enterprise Resource Planning (ERP) System are capitalised as intangible assets and stated at cost less accumulated amortisation and any identified impairment loss. Intangible assets are amortised using the straight line method over a period of three to five years.
Development costs are recognised as intangible assets when the following criteria are met:
- it is technically feasible to complete the intangible asset so that it will be available for use; - management intends to complete the intangible asset and use or sell it; - there is an ability to use or sell the intangible asset; - it can be demonstrated how the intangible asset will generate probable future economic benefits; - adequate technical, financial and other resources to complete the development and to use or sell the intangible asset are available; and - the expenditure attributable to the intangible asset during its development can be reliably measured. Other development expenditures that do not meet these criteria are recognised as an expense as incurred.
Development costs previously recognised as an expense are not recognised as an asset in a subsequent period.
Amortisation on additions to intangible assets is charged from the month in which an asset is acquired or capitalised while no amortisation is charged for the month in which the asset is disposed off.
The Company assesses at each balance sheet date whether there is any indication that intangible assets may
be impaired. If such indication exists, the carrying amounts of such assets are reviewed to assess whether they are recorded in excess of their recoverable amount. Where carrying amounts exceed the respective recoverable amount, assets are written down to their recoverable amounts and the resulting impairment loss is recognised in profit and loss account. The recoverable amount is the higher of an asset’s fair value less costs to sell and value in use. Where an impairment loss is recognised, the amortisation charge is adjusted in the future periods to allocate the asset’s revised carrying amount over its estimated useful life.

78
78
4.5 Leases
(1) The Company is the lessee:
Finance leases
Leases where the Company has substantially all the risks and rewards of ownership are classified as finance leases.
The related rental obligations, net of finance charges, are included in liabilities against assets subject to finance
lease. The liabilities are classified as current and long term depending upon the timing of the payment. Each lease payment is allocated between the liability and finance charges so as to achieve a constant rate on the
balance outstanding. The interest element of the rental is charged to profit over the lease term. Operating leases
Leases including ijarah financing where a significant portion of the risks and rewards of ownership are retained by the lessor are classified as operating leases. Payments made under operating leases (net of any incentives received from the lessor) are charged to profit on a straight-line basis over the lease / ijarah term unless another systematic basis is representative of the time pattern of the Company’s benefit.
(2) The Company is the lessor:
Operating leases
Assets leased out under operating leases are included in investment property as referred to in note 18. They are depreciated over their expected useful lives on a basis consistent with similar owned property, plant and equipment. Rental income (net of any incentives given to lessees) is recognised on a straight-line basis over the lease term.
4.6 Investments
Investments intended to be held for less than twelve months from the balance sheet date or to be sold to raise operating capital, are included in current assets, all other investments are classified as non-current. Management determines the appropriate classification of its investments at the time of the purchase and re-evaluates such designation on a regular basis.
Investments in equity instruments of subsidiaries, associates and joint ventures
Investments in subsidiaries and associates where the Company has significant influence are measured at cost in the Company’s financial statements. Cost in relation to investments made in foreign currency is determined by translating the consideration paid in foreign currency into Pak rupees at exchange rate prevailing on the date of transaction.
The Company is required to issue consolidated financial statements along with its separate financial statements,
in accordance with the requirements of IAS 27, ‘Separate Financial Statements’. Investments in associates, and joint ventures, in the consolidated financial statements, are being accounted for using the equity method.
At each balance sheet date, the Company reviews the carrying amounts of the investments in subsidiaries
and associates to assess whether there is any indication that such investments have suffered an impairment loss. If any such indication exists, the recoverable amount is estimated in order to determine the extent of the impairment loss, if any. In making an estimate of recoverable amount of these investments, the management considers future stream of cash flows and an estimate of the terminal value of these investments. Impairment losses are recognised as expense in the profit and loss account.
Investments in subsidiaries, associates and joint ventures, that suffered an impairment, are reviewed for possible
reversal of impairment at each reporting date. Impairment losses recognised in the profit and loss account on investments in subsidiaries and associates are reversed through the profit and loss account.

79
79
ANNUAL REPORT OF PACKAGES LIMITED 2015
Other investments
Other investments made by the Company are classified for the purpose of measurement into the following categories:
Held to maturity
Investments with fixed maturity that the management has the intent and ability to hold to maturity are classified as held to maturity and are initially measured at cost and at subsequent reporting dates measured at amortised cost using the effective yield method.
Available for sale
The financial assets including investments in associated undertakings where the Company does not have significant influence that are intended to be held for an indefinite period of time or may be sold in response to the need for liquidity are classified as available for sale.
Investments classified as available for sale are initially measured at cost, being the fair value of consideration
given. At subsequent reporting dates, these investments are remeasured at fair value. Changes in fair value of ‘available for sale’ investments are recognised in other comprehensive income until derecognised or impaired, when the accumulated fair value adjustments, recognised in other comprehensive income are transferred to the profit and loss account.
All purchases and sales of investments are recognised on the trade date which is the date that the Company
commits to purchase or sell the investment. Cost of purchase includes transaction cost. At each balance sheet date, the Company reviews the carrying amounts of the investments to assess whether
there is any indication that such investments have suffered an impairment loss. If any such indication exists, the recoverable amount is estimated in order to determine the extent of the impairment loss, if any. Impairment losses are recognised as expense in the profit and loss account. In respect of ‘available for sale’ financial assets, cumulative impairment loss less any impairment loss on that financial asset previously recognised in profit and loss account, is removed from equity and recognised in the profit and loss account. Impairment losses recognised in the profit and loss account on equity instruments are not reversed through the profit and loss account.
4.7 Employee retirement benefits
The main features of the schemes operated by the Company for its employees are as follows: 4.7.1 Defined benefit plans
(a) Gratuity plan
There is an approved funded defined benefit gratuity plan for all employees. Monthly contributions are made to this fund on the basis of actuarial recommendations at the rate of 4.5 percent per annum of basic salaries. The latest actuarial valuation for the gratuity scheme was carried out as at December 31, 2015. The actual return on plan assets during the year was 29.8 million. The actual return on plan assets represent the difference between the fair value of plan assets at the beginning of the year and end of the year adjustments for contributions made by the Company as reduced by benefits paid during the year.
The future contribution rates of these plans include allowances for deficit and surplus. Projected unit credit
method, using the following significant assumptions, is used for valuation of this scheme: Discount rate 9.0 percent per annum; Expected rate of increase in salary level 8.0 percent per annum; Expected mortality rate SLIC (2001-2005) mortality table with one year setback; and Expected rate of return 9.0 percent per annum.

80
80
Plan assets include long term government bonds, equity instruments of listed companies, units of mutual funds, izafa certificates and term deposit with banks. Return on government bonds and debt is at fixed rates, however, due to increased volatility of share prices in recent months, there is no clear indication of return on equity shares, therefore, it has been assumed that the yield on equity shares would match the return on debt.
The Company is expected to contribute Rs. 16.926 million to the gratuity fund in the next financial year. Actuarial gains and losses arising from experience adjustments and changes in actuarial assumptions are
charged or credited to equity in other comprehensive income in the period in which they arise. Past service costs are recognized immediately in income.
(b) Pension plan
All the management and executive staff participates in the pension plan of the Company. On December 26, 2012, the Board of Trustees of the pension fund, decided to convert the Defined Benefit Plan to Defined Contribution Plan for all its active employees with effect from January 01, 2013 with no impact on the pensioners appearing on the pensioners’ list as of that date. The proposed scheme was approved for implementation by the Commissioner Inland Revenue on February 22, 2013 and employees consent to the proposed scheme was sought and obtained.
Consequently, the pension plan / fund currently operates two different plans for its employees:
- Defined contribution plan for all active employees; and - Defined benefit plan for pensioners who have retired before December 31, 2012. In respect of the defined contribution plan, the Company contributes 20% of members’ monthly salary to the
scheme; whereas, an employee may or may not opt to contribute 6% of his monthly salary to the scheme. The obligation in respect of the defined benefit plan is determined by the Fund’s Actuary at each year end.
Any funding gap identified by the Fund’s Actuary is paid by the Company from time to time. The last actuarial valuation was carried out as at December 31, 2015.
Discount rate 9.0 percent per annum; Expected rate of increase in pension level 4.0 percent per annum; Expected mortality rate SLIC (2001-2005) mortality table with one year setback; and Expected rate of return 9.0 percent per annum. Plan assets include long term government bonds, equity instruments of listed companies, units of mutual funds,
term finance certificates, izafa certificates and term deposit with banks. Return on government bonds and debt is at fixed rates, however, due to increased volatility of share prices in recent months, there is no clear indication of return on equity shares, therefore, it has been assumed that the yield on equity shares would match the return on debt.
Actuarial gains and losses arising from experience adjustments and changes in actuarial assumptions for the
defined benefit plan are charged or credited to equity in other comprehensive income in the period in which they arise. Past service costs are recognized immediately in income.
Pension plan is a multi-employer plan formed by the Company in collaboration with Tri Pack Films Limited. The
Company reports its proportionate share of the plan’s commitments, managed assets and costs, after deducting share of Tri Pack Films Limited, in accordance with guidance provided by IAS 19 - Employee Benefits, regarding defined benefit plans.
(c) Accumulating compensated absences
The Company provides for accumulating compensated absences when the employees render services that increase their entitlement to future compensated absences. The executives and workers are entitled to earned

81
81
ANNUAL REPORT OF PACKAGES LIMITED 2015
annual leaves and medical leaves on the basis of their service with the Company. The annual leaves can be encashed at the time the employee leaves the Company on the basis of gross salary while no encashment is available for medical leaves.
The Company uses the valuation performed by an independent actuary as the present value of its accumulating
compensated absences. Projected unit credit method, using the following significant assumptions, has been used for valuation of
accumulating compensated absences: Discount rate 9.0 percent per annum; Expected rate of increase in salary level 8.0 percent per annum; and Expected mortality rate SLIC (2001-2005) mortality table with one year setback.
4.7.2 Defined contribution plan
There is an approved contributory provident fund for all employees. Equal monthly contributions at the rate of 10.0 percent per annum of basic salaries are made by the Company and the employees to the fund. The nature of contributory pension fund has been explained in note 4.7.1 (b) above.
Retirement benefits are payable to staff on completion of prescribed qualifying period of service under these
schemes. 4.8 Stores and spares
Stores and spares are valued at moving average cost, while items considered obsolete are carried at nil value. Items in transit are valued at cost comprising invoice value plus other charges paid thereon.
Provision is made in the financial statements for obsolete and slow moving stores and spares based on
management estimate. 4.9 Stock-in-trade
Stock of raw materials, except for those in transit, work-in-process and finished goods are valued principally at the lower of cost and net realisable value. Cost of raw materials is determined using the weighted average cost method. Cost of work-in-process and finished goods comprises direct production costs such as raw materials, consumables and labor as well as production overheads such as employee wages, depreciation, maintenance, etc. The production overheads are measured based on a standard cost method, which is reviewed regularly to ensure relevant measures of utilisation, production lead time etc.
Materials in transit are stated at cost comprising invoice value plus other charges paid thereon.
If the expected sales price less completion costs and costs to execute sales (net realisable value) is lower than the carrying amount, a write-down is recognised for the amount by which the carrying amount exceeds its net realisable value. Provision is made in the financial statements for obsolete and slow moving stock in trade based on management estimate.
4.10 Financial instruments
Financial assets and financial liabilities are recognised at the time when the Company becomes a party to the contractual provisions of the instrument and derecognised when the Company loses control of contractual rights that comprise the financial assets and in the case of financial liabilities when the obligation specified in the contract is discharged, cancelled or expired. Any gain or loss on derecognition of financial assets and financial liabilities is included in the profit and loss account for the year.
Financial instruments carried on the balance sheet include loans, investments, trade and other debts, cash and
bank balances, borrowings, trade and other payables, accrued expenses and unclaimed dividends. All financial
82
82
assets and liabilities are initially measured at cost, which is the fair value of consideration given and received respectively. These financial assets and liabilities are subsequently measured at fair value or cost as the case may be. The particular recognition methods adopted are disclosed in the individual policy statements associated with each item.
4.11 Offsetting of financial assets and liabilities
Financial assets and liabilities are offset and the net amount is reported in the financial statements only when there is a legally enforceable right to set off the recognised amount and the Company intends either to settle on a net basis or to realise the assets and to settle the liabilities simultaneously.
4.12 Trade debts
Trade debts are amounts due from customers for merchandise sold or services performed in the ordinary course of business. If collection is expected in one year or less (or in the normal operating cycle of the business, if longer), they are classified as current assets. If not, they are presented as non-current assets.
Trade debts are recognized initially at fair value and subsequently measured at amortised cost using the effective
interest method, less an estimate made for doubtful debts based on a review of all outstanding amounts at the year end. Bad debts are written off when identified.
4.13 Cash and cash equivalents
Cash and cash equivalents are carried in the balance sheet at cost. For the purpose of cash flow statement, cash and cash equivalents comprise cash in hand, demand deposits, other short term highly liquid investments that are readily convertible to known amounts of cash and which are subject to an insignificant risk of change in value and finances under mark up arrangements. In the balance sheet, finances under mark up arrangements are included in current liabilities.
4.14 Non-current assets / disposal group held-for-sale
Non-current assets are classified as assets held-for-sale when their carrying amount is to be recovered principally through a sale transaction and a sale is considered highly probable. They are stated at the lower of carrying amount and fair value less cost to sell.
4.15 Borrowings
Borrowings are recognised initially at fair value (proceeds received), net of transaction costs incurred. Borrowings are subsequently carried at amortised cost; any difference between the proceeds (net of transaction costs) and the redemption value is recognised in the income statement over the period of the borrowings using the effective interest method.
Fees paid on the establishment of loan facilities are recognised as transaction costs of the loan to the extent that
it is probable that some or all of the facility will be drawn down. In this case, the fee is deferred until the draw-down occurs. To the extent there is no evidence that it is probable that some or all of the facility will be drawn down, the fee is capitalised as a pre-payment for liquidity services and amortised over the period of the facility to which it relates.
Finance costs are accounted for on an accrual basis and are shown as accrued finance cost to the extent of the
amount remaining unpaid. 4.16 Trade and other payables
Trade payables are obligations to pay for goods or services that have been acquired in the ordinary course of business from suppliers. Accounts payable are classified as current liabilities if payment is due within one year or less (or in the normal operating cycle of the business, if longer). If not, they are presented as non-current liabilities.

83
83
ANNUAL REPORT OF PACKAGES LIMITED 2015
Liabilities for creditors and other costs payable are initially recognised at cost which is the fair value of the consideration to be paid in future for goods and/ or services, whether or not billed to the Company and subsequently measured at amortised cost using the effective interest method.
4.17 Derivative financial instruments
These are initially recorded at cost on the date a derivative contract is entered into and are remeasured to fair value at subsequent reporting dates. The method of recognising the resulting gain or loss depends on whether the derivative is designated as a hedging instrument, and if so, the nature of the item being hedged. The Company designates certain derivatives as cash flow hedges.
The Company documents at the inception of the transaction the relationship between the hedging instruments
and hedged items, as well as its risk management objective and strategy for undertaking various hedge transactions. The Company also documents its assessment, both at hedge inception and on an on-going basis, of whether the derivatives that are used in hedging transactions are highly effective in offsetting changes in cash flow of hedged items.
The effective portion of changes in the fair value of derivatives that are designated and qualify as cash flow
hedges are recognised in statement of other comprehensive income. The gain or loss relating to the ineffective portion is recognised immediately in the profit and loss account.
Amounts accumulated in equity are recognised in profit and loss account in the periods when the hedged item
shall effect profit or loss. However, when the forecast hedged transaction results in the recognition of a non-financial asset or liability, the gains and losses previously deferred in equity are transferred from equity and included in the initial measurement of the cost of the asset or liability.
4.18 Revenue recognition
Revenue is recognised on dispatch of goods or on the performance of services. Return on deposits is accrued on a time proportion basis by reference to the principal outstanding and the
applicable rate of return. Dividend income and entitlement of bonus shares are recognised when right to receive such dividend and bonus
shares is established. 4.19 Foreign currency transactions and translation
Foreign currency transactions are translated into Pak Rupees using the exchange rates prevailing at the dates of the transactions. All monetary assets and liabilities in foreign currencies are translated into Pak Rupees at the rates of exchange prevailing at the balance sheet date. Foreign exchange gains and losses on translation are recognised in the profit and loss account. All non-monetary items are translated into Pak Rupees at exchange rates prevailing on the date of transaction or on the date when fair values are determined.
The financial statements are presented in Pak Rupees, which is the Company’s functional and presentation
currency. 4.20 Borrowing costs
General and specific borrowing costs directly attributable to the acquisition, construction or production of qualifying assets, which are assets that necessarily take a substantial period of time to get ready for their intended use or sale, are added to the cost of those assets, until such time as the assets are substantially ready for their intended use or sale.

84
84
Investment income earned on the temporary investment of specific borrowings pending their expenditure on qualifying assets is deducted from the borrowing costs eligible for capitalisation.
All other borrowing / finance costs are recognised in profit and loss account in the period in which they are
incurred. 4.21 Dividend
Dividend distribution to the Company’s shareholders is recognised as a liability in the period in which the dividends are approved.
4.22 Compound financial instruments
Compound financial instruments issued by the Company represent preference shares / convertible stock that can be converted into ordinary shares or can be settled in cash.
The liability component of a compound financial instrument is recognised initially at the fair value of a similar
liability that does not have an equity conversion option. The equity component is recognised initially at the difference between the fair value of the compound financial instrument as a whole and the fair value of the liability component. Any directly attributable transaction costs are allocated to the liability and equity components in proportion to their initial carrying amounts.
Subsequent to initial recognition, the liability component of a compound financial instrument is measured at
amortised cost using the effective interest method. The equity component of a compound financial instrument is not remeasured subsequent to initial recognition.
4.23 Provisions
Provisions for environmental restoration, restructuring costs and legal claims are recognised when: (i) the Company has a present legal or constructive obligation as a result of past events; (ii) it is probable that an outflow of resources shall be required to settle the obligation; and (iii) the amount has been reliably estimated Restructuring provisions include lease termination penalties and employee termination payments and such
other costs that are necessarily entailed by the restructuring and not associated with on-going activities of the Company. Provisions are not recognised for future operating losses.
Where there are a number of similar obligations, the likelihood that an outflow shall be required in settlement is
determined by considering the class of obligations as a whole. A provision is recognised even if the likelihood of an outflow with respect to any one item included in the same class of obligations may be small.
Provisions are measured at the present value of the expenditures expected to be required to settle the obligation
using a pre-tax rate that reflects current market assessments of the time value of money and the risks specific to the obligation. The increase in the provision due to passage of time is recognised as interest expense.

85
85
ANNUAL REPORT OF PACKAGES LIMITED 2015
5. Issued, subscribed and paid up capital
2015 2014 2015 2014 (Number of shares) (Rupees in thousand)
Ordinary shares of Rs. 10 each as at the beginning of the year 33,603,295 33,603,295 - fully paid in cash 336,033 336,033 148,780 148,780 - fully paid for consideration other than cash 1,488 1,488 - fully paid against conversion of preference 2,000,000 - shares / convertible stock 20,000 - 50,627,429 50,627,429 - fully paid bonus shares 506,274 506,274
86,379,504 84,379,504 863,795 843,795
Issuance of shares upon conversion of 2,000,000 2,000,000 preference shares / convertible stock - note 5.1 20,000 20,000
Ordinary shares of Rs. 10 each as at the end of the year 33,603,295 33,603,295 - fully paid in cash 336,033 336,033 148,780 148,780 - fully paid for consideration other than cash 1,488 1,488 - fully paid against conversion of preference 4,000,000 2,000,000 shares / convertible stock 40,000 20,000 50,627,429 50,627,429 - fully paid bonus shares 506,274 506,274
88,379,504 86,379,504 883,795 863,795
5.1 Under the terms of redemption / conversion of preference shares / convertible stock mentioned in note 7.2, the Company, during the year converted 2,000,000 (2014: 2,000,000) preference shares / convertible stock of Rs. 190 each held by International Finance Corporation, Washington D.C, USA (‘IFC’) into 2,000,000 (2014: 2,000,000) fully paid ordinary shares of Rs. 10 each.
5.2 21,522,101 (2014: 21,133,101) ordinary shares of the Company are held by IGI Insurance Limited, an associated
undertaking.
(Rupees in thousand) Note 2015 2014
6. Reserves
Movement in and composition of reserves is as follows:
Capital
Share premium
At the beginning of the year 3,232,831 2,876,893 Conversion of preference shares / convertible stock 6.1 355,938 355,938
6.2 3,588,769 3,232,831 Fair value reserve
At the beginning of the year 29,223,250 23,566,916 Fair value (loss) / gain during the year (4,744,022) 5,656,334
6.3 24,479,228 29,223,250
28,067,997 32,456,081 Revenue
General reserve
At the beginning of the year 12,310,333 11,610,333 Transferred from profit and loss account 1,500,000 700,000
13,810,333 12,310,333
41,878,330 44,766,414

86
86
6.1 This represents share premium at the rate of Rs. 177.97 (2014: Rs. 177.97) per share in respect of the transaction referred to in note 5.1 above.
6.2 This reserve can be utilised by the Company only for the purposes specified in section 83(2) of the Companies
Ordinance, 1984. 6.3 As referred to in note 4.6, this represents the unrealised gain on remeasurement of investments at fair value
and is not available for distribution. This shall be transferred to profit and loss account on derecognition of investments.
(Rupees in thousand) Note 2015 2014
7. Long term finances
These are composed of: Local currency loans - secured Term finance loan 7.1.1 100,000 300,000 Long term finance facility 7.1.2 2,000,000 2,000,000
2,100,000 2,300,000 Preference shares / convertible stock - unsecured 7.2 2,014,895 2,128,815
4,114,895 4,428,815 Current portion shown under current liabilities 12 (385,714) (200,000)
3,729,181 4,228,815
7.1 Local currency loans - secured
7.1.1 Term finance loan
During the current year, the Company has made a re-payment of Rs. 200 million towards the term finance loan availed from Bank Al-Habib Limited. This loan is secured by a pari passu charge of Rs. 1,273 million (2014: 1,273 million) over present and future fixed assets of the Company located at Lahore excluding land and buildings. It carries mark up at the rate of six months Karachi Inter Bank Offer Rate (‘KIBOR’) plus 0.2 percent per annum to six months KIBOR plus 0.65 percent per annum (2014: KIBOR plus 0.65 percent per annum). The balance is repayable on May 19, 2016. The effective mark up charged during the year ranges from 7.20 percent to 10.82 percent per annum (2014: 9.81 percent to 10.82 percent per annum).
7.1.2 Long term finance facility
This loan has been obtained from Meezan Bank Limited under the Islamic mode of finance as a Musharika. It is secured by a pari passu charge over all present and future fixed assets of the Company located at Lahore and Kasur excluding land and building located at Lahore amounting to Rs. 2,500 million. It carries mark up at six months KIBOR plus 0.25 percent per annum (2014: six months KIBOR plus 0.65 percent per annum) and is payable in 7 equal semi-annual installments starting on December 28, 2016 and ending on December 28, 2019. The effective mark up charged during the year ranges from 7.26 percent to 9.89 percent per annum (2014: 10.81 percent to 10.82 percent per annum).
7.2 Preference shares / convertible stock - unsecured
During the year 2009, the Company issued 10 percent local currency non-voting cumulative preference shares / convertible stock at the rate of Rs. 190 per share amounting to USD 50 million equivalent to PKR 4,120.5 million under “Subscription Agreement” dated March 25, 2009 with IFC.
Terms of redemption / conversion
Each holder of preference shares / convertible stock shall have a right to settle at any time, at the option of holder, either in the form of fixed number of ordinary shares, one ordinary share for one preference share / convertible stock, or cash. The Company may, in its discretion, refuse to purchase the preference shares /

87
87
ANNUAL REPORT OF PACKAGES LIMITED 2015
convertible stock offered to it for purchase in cash. In case of refusal by the Company, preference shareholders shall have the right to either retain the preference shares / convertible stock or to convert them into ordinary shares. The preference shares / convertible stock can be held till perpetuity if preference shareholders do not opt for the conversion or cash settlement.
Rate of return
The preference share / convertible stock holders have a preferred right of return at the rate of 10 percent per annum on a non-cumulative basis till the date of settlement of preference shares / convertible stock either in cash or ordinary shares.
Preference shares / convertible stock are recognised in the balance sheet as follows: (Rupees in thousand) Note 2015 2014
Face value of preference shares / convertible stock [17,686,842 (2014: 19,686,842) shares of Rs. 190 each] 3,360,500 3,740,500 Transaction costs (35,923) (39,986)
3,324,577 3,700,514 Equity component - classified under capital and reserves 7.2.1 (1,309,682) (1,571,699)
Liability component - classified under long term finances 2,014,895 2,128,815 Accrued return on preference shares / convertible stock classified under accrued finance cost 336,050 355,047
7.2.1 Movement in equity component - classified under capital and reserves
Opening balance 1,571,699 1,605,875 Transfer from long term finances to capital and reserves [1,000,000 shares (2014: 3,000,000 shares)] 113,921 341,762 Conversion into ordinary share capital and share premium [2,000,000 shares (2014: 2,000,000 shares)] (375,938) (375,938)
Closing balance 1,309,682 1,571,699 The fair value of the liability component of the preference shares / convertible stock is calculated by discounting
cash flows at a rate of approximately 16.50 percent till perpetuity which represents the rate of similar instrument with no associated equity component. The residual amount, representing the value of the equity conversion component, is included in shareholders equity as preference shares / convertible stock reserve.
During the year, IFC exercised its right to convert 1,000,000 (2014: 3,000,000) preference shares / convertible
stock of Rs. 190 into 1,000,000 (2014: 3,000,000) ordinary shares of Rs. 10 each. Consequently, the Company converted 2,000,000 (2014: 2,000,000) preference shares / convertible stock during the year of which 1,000,000 (2014: Nil) preference shares / convertible stock pertain to the right exercised by IFC in the previous year. Accordingly, the liability portion pertaining to 1,000,000 (2014: 3,000,000) preference shares / convertible stock converted into ordinary shares has been transferred to capital and reserves.

88
88
(Rupees in thousand) Note 2015 2014 8. Liabilities against assets subject to finance lease
Present value of minimum lease payments 34,224 30,381 Current maturity shown under current liabilities 12 (6,571) (4,696)
27,653 25,685 Interest rate used as discounting factor ranges from 6.96 per cent to 10.72 per cent per annum (2014: 9.99 per cent to 10.72 per cent per annum). Taxes, repairs, replacements and insurance costs are borne by the lessee. The amount of the future payment of the lease as shown in the balance sheet and the period in which these payments will become due are as follows:
Minimum Future Present value of lease lease finance liability(Rupees in thousand) payments charge 2015 2014
Not later than one year 7,966 1,395 6,571 4,696 Later than one year and not later than five years 28,999 1,346 27,653 25,685 36,965 2,741 34,224 30,381
(Rupees in thousand) Note 2015 2014
9. Deferred tax
The liability for deferred tax comprises temporary differences relating to: Accelerated tax depreciation 462,907 558,430 Unused tax losses - (199,491)Minimum tax available for carry forward 9.1 (122,079) - Alternate corporate tax available for carry forward (33,787) - Provision for accumulating compensated absences (60,312) (60,881)Provision for doubtful debts (7,491) (13,239)Preference shares / convertible stock transaction cost - liability portion 6,882 8,022
246,120 292,841
9.1 The Divisional Bench of Sindh High Court in an order dated May 7, 2013 in case of another company has interpreted section 113(2)(c) of the Income Tax Ordinance, 2001 (‘Ordinance’) in the manner that the benefit of carry forward of minimum tax paid is not available if otherwise no tax was payable by the Company due to taxable loss.
Taking a prudent view on the matter the Company has not adjusted the net deferred tax liability against aggregate tax credits of Rs. 436.93 million (2014: Rs. 811.446 million) available under section 113 of the Ordinance. Tax credits under section 113 of the Ordinance amounting to Rs. 203.917 million, Rs. 110.934 million and Rs. 122.079 million are set to lapse by the end of years ending on December 31, 2016, 2017 and 2020 respectively.

89
89
ANNUAL REPORT OF PACKAGES LIMITED 2015
(Rupees in thousand) 2015 2014
10. Retirement benefits
Classified under non-current assets
Pension fund - 58,252 Gratuity fund - 29,629
- 87,881 Classified under non-current liabilities
Pension fund 24,744 - Gratuity fund 15,681 -
40,425 -
Pension Fund Gratuity Fund(Rupees in thousand) 2015 2014 2015 2014
The amounts recognised in the balance sheet are as follows: Fair value of plan assets 627,009 700,115 362,566 339,502 Present value of defined benefit obligation (651,753) (641,863) (378,247) (309,873)
(Liability) / asset as at December 31 (24,744) 58,252 (15,681) 29,629 Net asset / (liability) as at January 1 58,252 (578) 29,629 6,540 Income / (charge) to profit and loss account 6,117 (72) (13,685) (14,282)(Loss) / gain recorded in OCI (89,113) 58,902 (46,954) 23,921 Contribution by the Company - - 15,329 13,450
Net (liability) / asset as at December 31 (24,744) 58,252 (15,681) 29,629 The movement in the present value of defined benefit obligation is as follows: Present value of defined benefit obligation as at January 1 641,863 568,285 309,873 275,115 Service cost - - 18,005 16,152 Interest cost 63,837 66,808 30,860 31,339 Benefits paid (67,785) (67,639) (31,006) (45,424)Benefits due but not paid - - (923) (3,379)Loss from change in demographic assumptions - 3,144 - - Loss from change in financial assumptions 43,903 62,212 - - Experience adjustments (30,065) 9,053 51,438 36,070
Present value of defined benefit obligation as at December 31 651,753 641,863 378,247 309,873

90
90
Pension Fund Gratuity Fund(Rupees in thousand) 2015 2014 2015 2014
The movement in fair value of plan assets is as follows: Fair value as at January 1 700,115 567,707 339,502 281,655 Expected return on plan assets 69,954 66,736 35,180 33,209 Company contributions - - 15,329 13,450 Benefits paid (67,785) (67,639) (31,006) (45,424)Benefits due but not paid - - (923) (3,379)Experience (loss) / gain (75,275) 133,311 4,484 59,991
Fair value as at December 31 627,009 700,115 362,566 339,502
The amounts recognised in the profit and loss account are as follows: Current service cost - - 18,005 16,152 Interest cost for the year 63,837 66,808 30,860 31,339 Expected return on plan assets (69,954) (66,736) (35,180) (33,209)Net (income) / expense included in salaries, wages and amenities (6,117) 72 13,685 14,282 Plan assets are comprised as follows: Debt 291,528 250,081 144,192 14,802 Equity 333,161 393,815 216,271 220,812 Cash 2,320 56,219 2,103 103,888
627,009 700,115 362,566 339,502
The present value of defined benefit obligation, the fair value of plan assets and the deficit or surplus of pension fund is as follows:
(Rupees in thousand) 2015 2014 2013 2012 2011
As at December 31 Present value of defined benefit obligation 651,753 641,863 568,285 582,031 1,092,581 Fair value of plan assets 627,009 700,115 567,707 305,573 685,750
(Deficit) / surplus (24,744) 58,252 (578) (276,458) (406,831) Experience adjustment on obligation -5% 2% 1% 13% 11%Experience adjustment on plan assets -11% 24% 2% 11% -10%

91
91
ANNUAL REPORT OF PACKAGES LIMITED 2015
Fair value of plan assets include ordinary shares of the Company, whose fair value as at December 31, 2015 is Rs. 384.214 million (2014: Rs. 447.696 million).
The present value of defined benefit obligation, the fair value of plan assets and the surplus of gratuity fund is
as follows:
(Rupees in thousand) 2015 2014 2013 2012 2011
As at December 31 Present value of defined benefit obligation 378,247 309,873 275,115 371,372 314,074 Fair value of plan assets 362,566 339,502 281,655 341,022 317,168
(Deficit) / surplus (15,681) 29,629 6,540 (30,350) 3,094
Experience adjustment on obligation 6% 13% 9% 14% -1%Experience adjustment on plan assets 1% 21% 14% 9% -5%
Fair value of plan assets include ordinary shares of the Company, whose fair value as at December 31, 2015 is
Rs. 60.827 million (2014: Rs. 70.877 million).
2015(Rupees in thousand) Pension Gratuity
Year end sensitivity analysis on defined benefit obligation:
Discount rate + 100 bps 608,531 350,030 Discount rate - 100 bps 701,114 410,723 Indexation + 100 bps 708,393 410,963 Indexation - 100 bps 601,768 349,325
(Rupees in thousand) Note 2015 2014
11. Deferred liabilities
This represents provision made to cover the obligation for accumulating compensated absences
Opening balance 174,581 139,576 Provision for the year 50,528 52,084
225,109 191,660 Payments made during the year (23,533) (17,079)
Closing balance 201,576 174,581
12. Current portion of long term liabilities
Current portion of long term finances - secured 7 385,714 200,000 Current portion of liabilities against assets subject to finance lease 8 6,571 4,696
392,285 204,696

92
92
(Rupees in thousand) Note 2015 2014
13. Finances under mark up arrangements - secured
Running finances - secured 13.1 534,481 862,596 Bills discounted - secured 13.2 - - Short term finances - secured 13.3 350,000 400,000
884,481 1,262,596 13.1 Running finances - secured
Short term running finances available from a consortium of commercial banks under mark up arrangements amount to Rs. 7,910 million (2014: Rs. 7,910 million). The rates of mark-up range from Re 0.1780 to Re 0.2980 (2014: Re 0.2638 to Re 0.3134) per Rs. 1,000 per diem or part thereof on the balances outstanding. In the event the Company fails to pay the balances on the expiry of the quarter, year or earlier demand, mark up is to be computed at the rates ranging from Re 0.2136 to Re 0.3636 (2014: Re 0.3165 to Re 0.3823) per Rs. 1,000 per diem or part thereof on the balances unpaid. The aggregate running finances are secured by hypothecation of stores, spares, stock-in-trade and trade debts.
13.2 Bills discounted - secured
Facilities for discounting of export / inland bills of Rs. 531 million (2014: Rs. 531 million) are available to the Company as a sub-limit of the running finance facilities referred to in note 13.1. Markup is fixed as per mutual agreement at the time of transaction. The outstanding balance of bills discounted is secured, in addition to the securities referred to in note 13.1, on the specific bills discounted. The facility has not been availed in the current year.
13.3 Short term finances - secured
Facilities for obtaining short term finances of Rs. 6,635 million (2014: Rs. 6,635 million) are available to the Company as a sub-limit of the running finance facilities referred to in note 13.1. The rates of mark-up range from Re 0.1698 to Re 0.2715 (2014: Re 0.2690 to Re 0.2858) per Rs. 1,000 per diem or part thereof on the balances outstanding.
13.4 Letters of credit and bank guarantees
Of the aggregate facility of Rs. 6,339 million (2014: Rs. 6,589 million) for opening letters of credit and Rs. 794 million (2014: Rs. 994 million) for guarantees, the amount utilised as at December 31, 2015 was Rs. 443.744 million (2014: Rs. 162.553 million) and Rs. 267.208 million (2014: Rs. 199.652 million) respectively. Of the facility for guarantees, Rs. 794 million (2014: Rs. 1,294 million) is secured by second hypothecation charge over stores, spares, stock-in-trade and trade debts.

93
93
ANNUAL REPORT OF PACKAGES LIMITED 2015
(Rupees in thousand) Note 2015 2014
14. Trade and other payables
Trade creditors 14.1 1,231,903 1,118,642 Accrued liabilities 14.2 459,326 379,448 Bills payable 1,022,815 1,245,493 Sales tax payable 22,691 2,467 Advances from customers 49,069 54,691 Payable to employees’ retirement benefit funds 14.3 14,590 13,237 Deposits - interest free repayable on demand 7,446 7,226 TFCs payable 1,387 1,387 Unclaimed dividends 20,975 17,290 Workers’ profit participation fund 14.4 204,216 147,665 Workers’ welfare fund 14.5 174,237 96,635 Others 69,469 60,499
3,278,124 3,144,680
14.1 Trade creditors include amount due to related parties as follows:
Subsidiary
DIC Pakistan Limited 88,640 69,584
Joint venture
Bulleh Shah Packaging (Private) Limited 232,766 163,698
Associates
Tri-Pack Films Limited 54,043 1,285 IGI Insurance Limited 4,267 568
379,716 235,135
14.2 Accrued liabilities include amounts in respect of related parties as follows:
Subsidiary
DIC Pakistan Limited 707 459
Joint venture
Bulleh Shah Packaging (Private) Limited - 764
Associates
IGI Insurance Limited 175 -
882 1,223
14.3 Payable to employees’ retirement benefit funds
Employees’ provident fund 14.3.1 7,347 6,808 Employees’ gratuity fund 1,293 1,149 Management staff pension fund 5,950 5,280
14,590 13,237

94
94
(Rupees in thousand) Note 2015 2014
14.3.1 Employees’ provident fund
(i) Size of the fund 2,152,893 2,311,341(ii) Cost of investments made 776,987 715,803 (iii) Fair value of investments 14.3.2 2,125,249 2,297,324 (iv) Percentage of investments made 98.72% 99.39%
14.3.2 Fair value of investments 2015 2014 Rupees in % age of size Rupees in % age of size thousand of the Fund thousand of the Fund
Break up of investments
Equity shares of listed companies 1,480,216 68.75% 1,719,020 74.37%Mutual funds 206,866 9.61% 159,346 6.89%Izafa certificates 160,217 7.44% 148,011 6.40%Pakistan investment bonds 214,565 9.97% 213,169 9.22%Term finance certificates 20,155 0.94% 28,524 1.23%Term deposit receipts with banks 43,230 2.01% - 0.00%Treasury bills - 0.00% 29,254 1.27%
2,125,249 98.72% 2,297,324 99.39%
14.3.3 The investments of the employee’s provident fund trust have been made in accordance with the provisions of section 227 of the Ordinance and the Rules formulated for this purpose.
(Rupees in thousand) Note 2015 2014
14.4 Workers’ profit participation fund
Opening balance 147,665 106,636 Provision for the year 31 204,216 147,665
351,881 254,301 Payments made during the year (147,665) (106,636)
Closing balance 204,216 147,665
14.5 Workers’ welfare fund
Opening balance 96,635 40,522 Provision for the year 31 77,602 56,113
Closing balance 174,237 96,635
(Rupees in thousand) Note 2015 2014
15. Accrued finance costs
Accrued markup / return on: Long term local currency loans - secured 7,000 148,704 Preference shares / convertible stock - unsecured 336,050 355,047 Finances under mark up arrangements - secured 6,232 13,883
349,282 517,634

95
95
ANNUAL REPORT OF PACKAGES LIMITED 2015
16. Contingencies and commitments
16.1 Contingencies
(i) Claims against the Company not acknowledged as debts Rs. 18.946 million (December 2014: Rs. 18.062 million).
(ii) Post dated cheques not provided in the financial information have been furnished by the Company in favor of the Collector of Customs against custom levies aggregated to Rs. 69.148 million (December 2014: Rs. 86.546 million) in respect of goods imported.
(iii) Standby letter of credit issued by Habib Bank Limited Pakistan in favor of Habib Bank Limited Bahrain on behalf of the Company amounting to USD 11.770 million (equivalent to PKR 1,232.781 million) [December 2014: Nil] as referred to in note 20.1.1.
16.2 Commitments
(i) Letters of credit and contracts for capital expenditure Rs. 295.519 million (December 2014: Rs. 51.002 million).
(ii) Letters of credit and contracts for other than for capital expenditure Rs. 223.465 million (December 2014: Rs. 209.069 million).
(iii) The amount of future payments under operating leases and the period in which these payments will become due are as follows:
(Rupees in thousand) 2015 2014
Not later than one year 10,597 15,494 Later than one year and not later than five years 37,259 42,829
47,856 58,323 There are no commitments with related parties.
(Rupees in thousand) Note 2015 2014
17. Property, plant and equipment
Owned assets 17.1 3,540,012 3,400,833 Assets subject to finance lease 17.2 35,248 30,830 Capital work in progress 17.3 229,217 254,014
3,804,477 3,685,677

96
96
17.1 Owned assets 2015 Transfer Accumulated Depreciation Transfer Accumulated Book value Cost as at in / (out) Cost as at depreciation charge / in / (out) depreciation as at December Addition/ (note 17.2) December as at December (deletions) (note 17.2) as at December December (Rupees in thousand) 31, 2014 (deletions) (note 18) 31, 2015 31, 2014 for the year (note 18) 31, 2015 31, 2015
Freehold land 116,730 26,641 - 137,297 - - - - 137,297 - (6,074) - - Buildings on freehold land 496,082 2,376 - 498,458 140,062 19,972 - 160,034 338,424 - - - - Buildings on leasehold land 221,419 - - 221,419 110,432 9,993 - 120,425 100,994 - - - Plant and machinery 7,331,657 577,516 - 7,453,853 4,931,861 401,246 - 4,878,183 2,575,670 (455,320) - (454,924) - Other equipments (computers, lab equipments and other office equipments) 739,320 38,187 - 774,770 478,408 83,929 - 559,803 214,967 (2,737) - (2,534) - Furniture and fixtures 13,411 1,651 - 14,928 13,085 172 - 13,123 1,805 (134) - (134) - Vehicles 254,785 64,092 2,168 268,126 98,723 25,602 390 97,271 170,855 (52,919) - (27,444) -
9,173,404 710,463 2,168 9,368,851 5,772,571 540,914 390 5,828,839 3,540,012 (511,110) (6,074) (485,036) -
2014 Accumulated Depreciation Accumulated Book value Cost as at Transfer Cost as at depreciation charge / Transfer depreciation as at December Addition / in / (out) December as at December (deletions) in / (out) as at December December (Rupees in thousand) 31, 2013 (deletions) (note 18) 31, 2014 31, 2013 for the year (note 18) 31, 2014 31, 2014
Freehold land 147,571 19,731 - 116,730 - - - - 116,730 - (50,572) - - Buildings on freehold land 475,749 20,485 - 496,082 120,228 19,906 - 140,062 356,020 (152) - (72) - Buildings on leasehold land 221,419 - - 221,419 100,267 10,165 - 110,432 110,987 - - - Plant and machinery 7,289,458 540,565 - 7,331,657 5,047,057 380,002 - 4,931,861 2,399,796 (498,366) - (495,198) - Other equipments (computers, lab equipments and other office equipments) 669,553 78,951 - 739,320 405,302 78,442 - 478,408 260,912 (9,184) - (5,336) - Furniture and fixtures 13,320 91 - 13,411 12,921 164 - 13,085 326 - - - - Vehicles 230,537 61,422 - 254,785 91,269 24,217 - 98,723 156,062 (37,174) - (16,763) -
9,047,607 721,245 - 9,173,404 5,777,044 512,896 - 5,772,571 3,400,833 (544,876) (50,572) (517,369) -
17.1.1 Owned assets include assets amounting to Rs. 15.385 million (2014: Rs. 20.479 million) of the Company which are not in operation.
17.1.2 The cost of fully depreciated assets which are still in use as at December 31, 2015 is Rs. 3,253.862 million (2014: Rs. 2,986.551 million).
17.1.3 The depreciation charge for the year has been allocated as follows: (Rupees in thousand) Note 2015 2014
Cost of sales 28 510,634 485,716 Administrative expenses 29 23,092 20,767 Distribution and marketing costs 30 7,188 6,413
540,914 512,896

97
97
ANNUAL REPORT OF PACKAGES LIMITED 2015
17.1.4 Disposal of owned assets Detail of owned assets disposed off during the year is as follows: (Rupees in thousand) 2015
Particulars Accumulated Sales Mode ofof assets Sold to Cost depreciation Book value proceeds disposal
Plant and machinery Outsider - related party Bulleh Shah Packaging (Private) Limited 912 627 285 109 Negotiation Outsider Muhammad Ameen 5,296 5,186 110 1,295 Negotiation Other Equipments Outsiders - related party IGI Insurance Limited 105 15 90 75 Claim Settlement Bulleh Shah Packaging (Private) Limited 79 20 59 65 Negotiation Vehicles Employees Ahmed Ramzan 1,100 572 528 763 Company Policy Ammad Asif 1,275 536 739 906 - do - Asma Shahzad 750 405 345 471 - do - Athar Riaz 1,498 419 1,079 1,166 - do - Ather Ayub Khan 1,797 1,348 449 481 Negotiation Fahad Ali 490 368 122 218 Company Policy Farhan Munir 700 182 518 511 - do - Ghayyur Abbas 700 203 497 512 - do - Hammad Ahmed Butt 944 349 595 582 - do - Hassan Asif 1,640 1,046 594 1,197 - do - Imran Iqbal 1,548 341 1,207 1,218 - do - Khalid Aziz 493 364 129 221 - do - Rtd. Major Fazal Ahmed 1,778 76 1,702 1,760 Negotiation Maryam Nisar 813 325 488 562 Company Policy Mashkoor Hussain 1,498 390 1,108 1,173 - do - Moiz Ahmed 741 282 459 456 - do - Mudassir Anjum 1,111 455 656 779 - do - Mudassir Shafique 1,232 924 308 717 - do - Muhammad Akram 1,288 869 419 571 - do - Muhammad Amir Baig 1,770 142 1,628 1,771 - do - Muhammad Ashiq 630 449 181 333 - do - Muhammad Awais Jawaid 859 634 225 398 - do - Muhammad Latif 800 600 200 475 - do - Muhammad Siddique 1,232 924 308 709 - do - Muhammad Usman Akram 810 300 510 516 - do - Musa Naseer 878 648 230 414 - do - Musarrat Mumtaz 389 291 98 102 - do - Omar Javed 673 135 538 487 - do - Sagheer Hussain 505 366 139 230 - do - Sahil Zaheer 1,426 1,034 392 859 - do - Saifullah Zaheer 695 56 639 614 - do - Shamim Ahmed Khan 1,000 688 312 511 - do - Tanseer Asghar 511 370 141 235 - do - Tanveer Ahmed Awan 515 380 135 237 - do - Umer Mehmood 650 234 416 420 - do - Usman Anwar 1,250 645 605 884 - do - Usman Munir 750 367 383 462 - do - Zafar Mehmood 1,400 364 1,036 1,149 - do - Zubair Ahmed 467 350 117 178 - do - Outsiders - Related Party Bulleh Shah Packaging (Private) Limited 900 198 702 702 Negotiation Tripack Films Limited 2,512 678 1,834 1,834 - do - Syed Aslam Mehdi 1,969 1,304 665 664 - do -
Outsiders Argosy Enterprises 1,279 959 320 1,102 Negotiation Asim Mumtaz 1,347 1,010 337 830 - do - Muhammad Sajid 678 88 590 562 - do - Qadeer Associates & Motors 1,169 876 293 990 - do - Riaz Motors 673 114 559 513 - do -
Other assets with book value less than Rs. 50,000 455,585 455,530 55 57,034 Negotiation
511,110 485,036 26,074 91,023

98
98
(Rupees in thousand) 2014
Particulars Accumulated Sales Mode ofof assets Sold to Cost depreciation Book value proceeds disposal
Buildings on freehold land Outsider
Muhammad Younis and Company 152 72 80 27 Negotiation Plant and machinery Outsider - related party
Bulleh Shah Packaging (Private) Limited 6,019 5,173 846 1,000 Negotiation Outsider
Muhammad Younis & Company 4,537 2,215 2,322 805 Negotiation Other Equipments Employee
Syed Aslam Mehdi 2,348 240 2,108 - Company Policy Outsider
Malik Muhammad Younis 1,983 529 1,454 84 Negotiation Vehicles Employees
Ali Faraz 741 192 549 537 Company Policy Asad Ur Rehman 950 152 798 755 - do - Athar Rashid Butt 1,687 1,118 569 590 - do - Atif Raza 750 98 652 645 - do - Attia Jamal 1,035 290 745 832 - do - Faisal Mehmood 672 54 618 572 - do - Hamid Jameel 746 560 186 422 - do - Haroon Naseer 1,232 909 323 718 - do - Ishtiaq Ahmad 937 356 581 681 - do - Kamran Bashir 1,232 909 323 717 - do - Mian Abid Nisar Lodhi 783 196 587 498 - do - Mohayyundin Ahmad 700 473 227 399 - do - Muhammad Ahmad 1,110 425 685 870 - do - Muhammad Anwar 516 387 129 233 - do - Muhammad Bilal Tariq 555 183 372 352 - do - Muhammad Naveed 730 547 183 585 Negotiation Muhammad Zubair 960 684 276 496 Company Policy Musab Mukhtar 538 404 134 257 - do - Nasir Mehmood 628 455 173 325 - do - Raza Sanaullah 1,924 250 1,674 1,761 - do - Sajjad Iftikhar 1,690 389 1,301 1,256 - do - Salman Saleem 620 465 155 335 - do - Shafi Karim 822 462 360 528 Negotiation Shakir Zia 1,430 858 572 941 Company Policy Syed Asim Shamim 1,386 762 624 906 - do - Syed Shaukat Hussain 487 359 128 227 - do - Talal Bin Najam 620 186 434 397 - do - Waseem Ahmad 1,017 142 875 899 - do - Outsiders
Amir Saleem 387 290 97 318 Negotiation Aurangzeb 2,500 1,744 756 4,732 - do - Bank Al Habib 4,680 328 4,352 4,584 Sale and lease back Khair Agencies 657 85 572 575 Negotiation Muhammad Rashid Shakoor 874 656 218 720 - do - Nazim Hussain 730 547 183 642 - do - Other assets with book value less than Rs. 50,000 493,511 493,225 286 75,571 Negotiation
544,876 517,369 27,507 106,792

99
99
ANNUAL REPORT OF PACKAGES LIMITED 2015
17.2 Assets subject to finance lease 2015
Accumulated Depreciation Accumulated Book value Cost as at Transfer Cost as at depreciation charge / Transfer depreciation as at December Additions / (out) December as at December (deletions) (out) as at December December (Rupees in thousand) 31, 2014 (deletions) (note 17.1) 31, 2015 31, 2014 for the year (note 17.1) 31, 2015 31, 2015
Vehicles 35,030 10,811 (2,168) 43,673 4,200 4,615 (390) 8,425 35,248
35,030 10,811 (2,168) 43,673 4,200 4,615 (390) 8,425 35,248
2014
Accumulated Depreciation Accumulated Book value Cost as at Transfer Cost as at depreciation charge / Transfer depreciation as at December Additions / (out) December as at December (deletions) (out) as at December December (Rupees in thousand) 31, 2013 (deletions) (note 17.1) 31, 2014 31, 2013 for the year (note 17.1) 31, 2014 31, 2014
Vehicles 28,897 6,133 - 35,030 548 3,652 - 4,200 30,830
28,897 6,133 - 35,030 548 3,652 - 4,200 30,830
17.2.1 Depreciation charge for the year has been allocated as follows:
(Rupees in thousand) Note 2015 2014
Cost of sales 28 1,090 1,039 Administrative expenses 29 3,264 2,548 Distribution and marketing costs 30 261 65
4,615 3,652 17.3 Capital work-in-progress
Civil works 11,229 40,084 Plant and machinery [including in transit Rs. 49.39 million (2014: Nil)] 194,137 207,041 Advance for procurement of land 17,593 1,000 Advances to suppliers 6,258 5,889
229,217 254,014
18. Investment property 2015
Accumulated Depreciation Accumulated Book value Cost as at Cost as at depreciation charge / depreciation as at December Additions / Transfer in December as at December (deletions) Transfer in as at December December (Rupees in thousand) 31, 2014 (deletions) (note 17.1) 31, 2015 31, 2014 for the year (note 17.1) 31, 2015 31, 2015
Land 117,917 - 6,074 123,991 - - - - 123,991 Buildings on freehold land 41,151 - - 41,151 32,955 2,624 - 35,579 5,572 Buildings on leasehold land 23,741 15,834 - 39,575 12,067 1,645 - 13,712 25,863
182,809 15,834 6,074 204,717 45,022 4,269 - 49,291 155,426
2014
Accumulated Depreciation Accumulated Book value Cost as at Cost as at depreciation charge / depreciation as at December Additions / Transfer in December as at December (deletions) Transfer in as at December December (Rupees in thousand) 31, 2013 (deletions) (note 17.1) 31, 2014 31, 2013 for the year (note 17.1) 31, 2014 31, 2014
Land 67,345 - 50,572 117,917 - - - - 117,917 Buildings on freehold land 41,151 - - 41,151 30,259 2,696 - 32,955 8,196 Buildings on leasehold land 23,741 - - 23,741 11,140 927 - 12,067 11,674
132,237 - 50,572 182,809 41,399 3,623 - 45,022 137,787

100
100
18.1 Depreciation charge for the year has been allocated to administrative expenses. 18.2 Land of the Company measuring 119 kanals 15 marlas and 62.25 sq.fts situated at Lahore having book value
of Rs. 6.149 million and all present and future moveable fixed assets and buildings of Packages Construction (Private) Limited (‘PCPL’) in aggregate, have been mortgaged under a first exclusive equitable charge of Rs. 7,333.334 million in favor of MCB Bank Limited against a term finance facility of upto Rs. 4.5 billion and a running finance facility of upto Rs. 1 billion provided to PCPL by MCB Bank Limited under a tri-partite agreement between the Company, MCB Bank Limited and PCPL.
18.3 Fair value of the investment property, based on the valuation carried out by an independent valuer, as at
December 31, 2015 is Rs. 2,954.139 million (2014: Rs. 2,298.274 million). The valuation is considered to be level 2 in the fair value hierarchy due to significant observable inputs used in the valuation. The different levels have been defined in note 44.4.
Valuation techniques used to derive level 2 fair values
Level 2 fair value of investment property has been derived using a sales comparison approach. Sale prices of comparable land and buildings in close proximity are adjusted for differences in key attributes such as location and size of the property. The most significant input into this valuation approach is price per square foot.
(Rupees in thousand) Note 2015 2014
19. Intangible assets
This represents computer software and ERP system.
Cost As at January 1 189,270 169,335 Additions - 20,814 Deletions - (879)
As at December 31 189,270 189,270 Accumulated amortisation As at January 1 (151,618) (137,150) Amortisation for the year 19.1 (16,923) (15,347) Deletions - 879
As at December 31 (168,541) (151,618)
20,729 37,652
19.1 The amortisation charge for the year has been allocated as follows:
Cost of sales 28 9,733 7,329 Administrative expenses 29 7,190 8,018
16,923 15,347
20. Investments
These represent the long term investments in: Related parties 20.1 16,518,358 14,081,183 Others - Available for sale 20.2 28,479,160 33,223,182
44,997,518 47,304,365

101
101
ANNUAL REPORT OF PACKAGES LIMITED 2015
(Rupees in thousand) Note 2015 2014
20.1 Related parties
Subsidiaries - unquoted
DIC Pakistan Limited
3,377,248 (2014: 3,377,248) fully paid ordinary shares of Rs. 10 each Equity held 54.98% (2014: 54.98%) 15,010 15,010
Packages Construction (Private) Limited
302,500,000 (2014: 52,500,000) fully paid ordinary shares of Rs. 10 each Equity held 99.99% (2014: 99.99%) 3,019,090 519,090 Share deposit money - 100,000
Packages Lanka (Private) Limited
44,698,120 (2014: 44,698,120) shares of SL Rupees 10 each Equity held 79.07% (2014: 79.07%) 442,938 442,938
Anemone Holdings Limited 20.1.1
351,088 (2014: Nil) shares of US Dollar 1 each Equity held 100.00% (2014: 0.00%) 36,675 -
CalciPack (Private) Limited 20.1.2
50,000 (2014: Nil) fully paid ordinary shares of Rs. 10 each Equity held 100.00% (2014: 0.00%) 500 -
3,514,213 1,077,038
Joint venture - unquoted
Bulleh Shah Packaging (Private) Limited
709,718,013 (2014: 709,718,013) fully paid ordinary shares of Rs. 10 each Equity held 65.00% (2014: 65% ) 9,973,652 9,973,652
Associates - quoted
IGI Insurance Limited 20.1.3
13,022,093 (2014: 13,022,093) fully paid ordinary shares of Rs. 10 each Equity held 10.61% (2014: 10.61%) 878,378 878,378 Market value - Rs. 3,080.636 million (2014: Rs. 3,523.518 million)
Tri-Pack Films Limited
10,000,000 (2014: 10,000,000) fully paid ordinary shares of Rs. 10 each Equity held 33.33% (2014: 33.33%) 2,141,233 2,141,233 Market value - Rs. 2,466.8 million (2014: Rs. 2,607.3 million) IGI Investment Bank Limited 20.1.3
4,610,915 (2014: 4,610,915) fully paid ordinary shares of Rs. 10 each Equity held 2.17% (2014: 2.17%) 10,882 10,882 Market value - Rs. 7.239 million (2014: Rs. 10.928 million) 3,030,493 3,030,493
16,518,358 14,081,183
20.1.1 On January 5, 2015, the Company incorporated a Special Purpose Vehicle (‘SPV’), Anemone Holdings Limited (‘AHL’), a wholly owned private limited company under the laws of Mauritius, and paid USD 100,000 (Equivalent to PKR 10.134 million) as initial equity contribution on February 4, 2015.

102
102
Subsequently, on June 1, 2015, AHL acquired 55% shareholding of Flexible Packages Converters (Proprietary) Limited (‘FPC’), a limited liability company incorporated under the laws of South Africa. The acquisition amount of USD 8.542 million was funded by AHL through a finance facility from Habib Bank Limited, Offshore Banking Unit, Bahrain (‘HBL Bahrain’). This facility was provided against a guarantee in the form of a Standby Letter of Credit (‘SBLC’) issued by Habib Bank Limited Pakistan (‘HBL Pakistan’) in favor of HBL Bahrain as referred to in note 16.1. SBLC is secured against pledge of Nestle Pakistan Limited shares owned by the Company as referred to in note 20.2.2.
The primary source of debt financing will be dividends from FPC. In the event that there is a shortfall between the dividends and obligations against the finance facility, this shortfall will be funded by Packages Limited. Consequently, on November 23, 2015, the Company further contributed USD 251,088 as equity, which AHL utilized to pay the interest amount due under the finance facility arrangement.
Furthermore, AHL also has the right to exercise a call option for the remaining 45% shares in FPC, subject to fulfilment of certain conditions, after completion of four years from the acquisition of FPC.
20.1.2 The board of directors in its meeting held on April 22, 2015 resolved to enter into 50/50 Joint Venture arrangement (‘JV’) with Omya Group of Switzerland (‘Omya’) subject to approval by regulatory authorities and other customary conditions. Omya is a leading producer of industrial minerals - mainly fillers and pigments derived from calcium carbonate and dolomite - and a worldwide distributor of specialty chemicals. The JV will set up a production facility to supply a range of high quality ground calcium carbonate products specifically tailored to meet local and regional markets. Consequently, a wholly owned subsidiary, “CalciPack (Private) Limited” was incorporated for this purpose on November 13, 2015.
20.1.3 The Company’s investment in IGI Insurance Limited and IGI Investment Bank Limited is less than 20% but they are
considered to be associates as per the requirement of IAS 28 ‘Investments in Associates’ because the Company has significant influence over the financial and operating policies of these companies through representation on the board of directors of these companies.
(Rupees in thousand) Note 2015 2014
20.2 Others - Available for sale
Quoted
Nestle Pakistan Limited 20.2.1 & 20.2.2
3,649,248 (2014: 3,649,248) fully paid ordinary shares of Rs 10 each Equity held 8.05% (2014: 8.05%) 28,464,135 33,208,157 Cost - Rs. 5,778.896 million (2014: Rs. 5,778.896 million)
Unquoted 20.2.3
Tetra Pak Pakistan Limited 20.2.1
1,000,000 (2014: 1,000,000) fully paid non-voting ordinary shares of Rs. 10 each 10,000 10,000
Coca-Cola Beverages Pakistan Limited
500,000 (2014: 500,000) fully paid ordinary shares of Rs. 10 each 5,000 5,000 Equity held 0.14% (2014: 0.14%)
Pakistan Tourism Development Corporation Limited
2,500 (2014: 2,500) fully paid ordinary shares of Rs. 10 each 25 25
Orient Match Company Limited
1,900 (2014: 1,900) fully paid ordinary shares of Rs. 100 each - -
15,025 15,025
28,479,160 33,223,182

103
103
ANNUAL REPORT OF PACKAGES LIMITED 2015
20.2.1 Nestle Pakistan Limited and Tetra Pak Pakistan Limited are associated undertakings as per the Companies Ordinance, 1984, however, for the purpose of measurement, investments in others have been classified as available for sale as referred to in note 4.6.
20.2.2 As of December 31, 2015, an aggregate of 310,000 shares (2014: Nil) of Nestle Pakistan Limited having market
value Rs. 2,418.0 million (2014: Nil) have been pledged in favor of HBL Pakistan against issuance of SBLC in favor of HBL Bahrain as referred to in note 20.1.1.
20.2.3 Unquoted investments, are measured at cost as it is not possible to apply any other valuation methodology. (Rupees in thousand) Note 2015 2014
21. Long term loans and deposits
Considered good
Loans to employees 21.1 4,177 4,350 Loan to SNGPL 21.2 32,800 49,200 Security deposits 20,026 16,782
57,003 70,332 Receivable within one year Loans to employees 25 (1,356) (1,374) Loan to SNGPL 25 (16,400) (16,400)
(17,756) (17,774)
39,247 52,558
21.1 These represent interest free loans to employees for purchase of motor cycles and cycles and are repayable in monthly installments over a period of 60 to 260 months.
Loans to employees aggregating Rs. 3.360 million (2014: Rs. 2.371 million) are secured by joint registration of
motor cycles in the name of employees and the Company. The remaining loans are unsecured. 21.2 This represents an unsecured loan given to Sui Northern Gas Pipelines Limited (SNGPL) for the development
of the infrastructure for the supply of natural gas to Bulleh Shah Packaging (Private) Limited, the Joint Venture entity. Mark up is charged at the rate of 1.5% per annum and is received annually. The remaining amount is receivable in 2 annual installments.
(Rupees in thousand) 2015 2014
22. Stores and spares
Stores [including in transit Rs. 15.037 million (2014: Rs. 12.216 million)] 259,575 270,611 Spares [including in transit Rs. 1.961 million (2014: Rs. 0.952 million)] 228,486 222,356
488,061 492,967
23. Stock-in-trade
Raw materials [including in transit Rs. 205.130 million (2014: Rs. 185.216 million)] 1,030,641 1,340,227 Work-in-process 210,945 211,698 Finished goods 538,591 678,575
1,780,177 2,230,500

104
104
23.1 Finished goods with a cost Rs. 47.455 million (2014: Rs. 26.176 million) are being valued at net realisable value of Rs. 38.995 million (2014: Rs. 23.443 million).
(Rupees in thousand) Note 2015 2014
24. Trade debts
Considered good Related parties - unsecured 24.1 75,795 11,965 Others 24.2 1,705,227 1,515,407
1,781,022 1,527,372 Considered doubtful 25,037 37,964
1,806,059 1,565,336 Provision for doubtful debts 24.3 (25,037) (37,964)
1,781,022 1,527,372 24.1 Related parties - unsecured
Subsidiary
DIC Pakistan Limited 3,976 3,229 Packages Construction (Private) Limited 11,695 –
Joint Venture
Bulleh Shah Packaging (Private) Limited 54,347 7,690
Associate
Tri-Pack Films Limited 5,777 1,046
75,795 11,965
These are in the normal course of business and are interest free. 24.2 Others include debts of Rs. 262.170 million (2014: Rs. 158.112 million) which are secured by way of bank
guarantees and inland letters of credit. (Rupees in thousand) 2015 2014
24.3 The movement in provision during the year is as follows:
Balance as at January 1 37,964 36,922 Provision for the year 8,001 13,850 Bad debts written off (20,928) (12,808)
Balance as at December 31 25,037 37,964

105
105
ANNUAL REPORT OF PACKAGES LIMITED 2015
(Rupees in thousand) Note 2015 2014
25. Loans, advances, deposits, prepayments and other receivables
Current portion of loans to employees 21 1,356 1,374 Current portion of loan receivable from SNGPL 21 16,400 16,400 Advances - considered good To employees 25.1 25,456 8,388 To suppliers 23,592 53,881
49,048 62,269 Due from related parties - unsecured 25.2 1,074,499 1,583,634 Trade deposits 42,713 45,946 Prepayments 29,143 11,357 Balances with statutory authorities Customs duty 9,301 21,966 Sales tax recoverable 92,462 26,409
101,763 48,375 Mark up receivable on Loan to SNGPL 33 46 Term deposits and saving accounts 85 85
118 131 Other receivables 31,048 27,728
1,346,088 1,797,214 25.1 Included in advances to employees are amounts due from executives of Rs. 1.654 million (2014: Rs. 1.129
million).
(Rupees in thousand) 2015 2014
25.2 Due from related parties - unsecured
Subsidiaries
DIC Pakistan Limited 15,373 12,952 Packages Lanka (Private) Limited 5,900 5,845 Packages Construction (Private) Limited 41,448 350,388 Flexible Packages Convertors (Proprietary) Limited 1,902 -
Joint venture
Bulleh Shah Packaging (Private) Limited 1,004,997 1,212,881 Associates
Tri-Pack Films Limited 174 286 IGI Insurance Limited 3,095 999 IGI Finex Securities Limited 11 - IGI Life Insurance Limited 1,599 283
1,074,499 1,583,634 These are in the normal course of business and are interest free.

106
106
(Rupees in thousand) Note 2015 2014
26. Income tax receivable
Income tax refundable 2,385,002 2,211,777 Income tax recoverable 26.1 36,013 36,013
2,421,015 2,247,790 26.1 In 1987, the Income Tax Officer (ITO) re-opened the Company’s assessments for the accounting years ended
December 31, 1983 and 1984 disallowing primarily tax credit given to the Company under section 107 of the Income Tax Ordinance, 1979. The tax credit amounting to Rs. 36.013 million on its capital expenditure for these years was refused on the grounds that such expenditure represented an extension of the Company’s undertaking which did not qualify for tax credit under this section in view of the Company’s location. The assessments for these years were revised by the ITO on these grounds and taxes reassessed were adjusted against certain sales tax refunds and the tax credits previously determined by the ITO and set off against the assessments framed for these years.
The Company had filed an appeal against the revised orders of the ITO before the Commissioner of Income Tax
(Appeals) [CIT(A)], Karachi. CIT(A) in his order issued in 1988, held the assessments reframed by the ITO for the years 1983 and 1984 presently to be void and of no legal effect. The ITO has filed an appeal against the CIT(A)’s order with the Income Tax Appellate Tribunal (ITAT). The ITAT has in its order issued in 1996 maintained the order of CIT(A). The assessing officer after the receipt of the appellate order passed by CIT(A), had issued notices under section 65 of the Income Tax Ordinance, 1979 and the Company had filed a writ petition against the aforesaid notices with the High Court of Sindh, the outcome of which is still pending.
The amount recoverable Rs. 36.013 million represents the additional taxes paid as a result of the disallowance
of the tax credits on reframing of the assessments. (Rupees in thousand) Note 2015 2014
27. Cash and bank balances
At banks:
On saving account 27.1 7,830 13,481 On current accounts [including USD Nil (2014: USD 674)] 27.2 89,484 232,428
97,314 245,909 In hand 4,426 6,583
101,740 252,492
27.1 The balances in saving accounts bear mark up which ranges from 4.0% to 5.0% (2014: 6.0% to 7.0%) per annum.
27.2 Included in these are total restricted funds of Rs. 1.332 million (2014: Rs. 1.332 million) held as payable to TFC holders.

107
107
ANNUAL REPORT OF PACKAGES LIMITED 2015
(Rupees in thousand) Note 2015 2014
28. Cost of sales
Materials consumed 9,005,224 9,130,892 Salaries, wages and amenities 28.1 1,068,262 961,884 Travelling 29,378 26,620 Fuel and power 636,592 1,080,433 Production supplies 358,888 368,763 Excise duty and sales tax 2,607 3,359 Rent, rates and taxes 28.2 5,947 139,367 Insurance 41,443 42,133 Repairs and maintenance 364,910 325,962 Packing expenses 289,454 263,983 Depreciation on owned assets 17.1.3 510,634 485,716 Depreciation on assets subject to finance lease 17.2.1 1,090 1,039 Amortisation of intangible assets 19.1 9,733 7,329 Technical fee and royalty 20,855 20,073 Other expenses 177,815 156,975
12,522,832 13,014,528 Opening work-in-process 211,698 222,374 Closing work-in-process (210,945) (211,698)
Cost of goods produced 12,523,585 13,025,204 Opening stock of finished goods 678,575 526,196
13,202,160 13,551,400 Closing stock of finished goods (538,591) (678,575)
12,663,569 12,872,825 Cost of goods produced includes Rs. 1,599.427 million (2014: Rs. 2,106.354 million) for stores and spares
consumed, Rs. 55.254 million (2014: Rs. 18.827 million) and Rs. 6.226 million (2014: Rs. 16.280 million) for raw material and stores and spares written off respectively.
(Rupees in thousand) 2015 2014
28.1 Salaries, wages and amenities
Salaries, wages and amenities include following in respect of retirement benefits: Gratuity
Current service cost 10,995 10,402 Net interest on net defined benefit liability / asset (2,576) (1,204)
8,419 9,198 In addition to above, salaries, wages and amenities include Rs. 20.663 million (2014: Rs. 17.762 million),
Rs. 33.290 million (2014: Rs. 28.085 million) and Rs. 30.176 million (2014: Rs. 33.628 million) in respect of provident fund contribution, pension fund contribution and accumulating compensated absences respectively.
28.2 Rent, rates and taxes include operating lease / ijarah rentals amounting to Nil (2014: Rs. 136.371 million).

108
108
(Rupees in thousand) Note 2015 2014
29. Administrative expenses
Salaries, wages and amenities 29.1 447,793 381,549 Travelling 29,199 43,686 Rent, rates and taxes 29.2 20,027 66,554 Insurance 16,038 12,540 Printing, stationery and periodicals 17,555 17,195 Postage, telephone and telex 13,430 12,989 Motor vehicles running 7,417 15,530 Computer charges 19,509 21,293 Professional services 29.3 48,931 98,076 Repairs and maintenance 17,343 16,920 Depreciation on owned assets 17.1.3 23,092 20,767 Depreciation on assets subject to finance lease 17.2.1 3,264 2,548 Amortisation of intangible assets 19.1 7,190 8,018 Depreciation on investment property 18.1 4,269 3,623 Other expenses 77,673 65,961
752,730 787,249 Administrative expenses include Rs. 83.545 million (2014: Rs. 65.361 million) for stores and spares
consumed. (Rupees in thousand) 2015 2014
29.1 Salaries, wages and amenities
Salaries, wages and amenities include following in respect of retirement benefits: Pension Net interest on net defined benefit (liability) / asset (6,117) 72 Gratuity Current service cost 4,859 4,153 Net interest on net defined benefit liability / asset (1,239) (481)
3,620 3,672
In addition to above, salaries, wages and amenities include Rs. 9.936 million (2014: Rs. 7.046 million), Rs.
16.008 million (2014: 11.141 million) and Rs. 14.511 million (2014: Rs. 13.339 million) in respect of provident fund contribution, pension fund contribution and accumulating compensated absences respectively.
29.2 Rent, rates and taxes include operating lease rentals amounting to Rs. 10.287 million (2014: Rs. 9.917 million).

109
109
ANNUAL REPORT OF PACKAGES LIMITED 2015
(Rupees in thousand) 2015 2014
29.3 Professional services
The charges for professional services include the following in respect of auditors’ services for: Statutory audit 2,600 2,400 Half yearly review 800 750 Tax services 5,000 3,008 Advisory services - 12,500 Workers’ profit participation fund audit, management staff pension and gratuity fund audit, audit of consolidated financial statements and other certification charges 2,000 1,107 Out of pocket expenses 686 651
11,086 20,416
(Rupees in thousand) Note 2015 2014
30. Distribution and marketing costs
Salaries, wages and amenities 30.1 216,439 177,340 Travelling 19,605 27,027 Rent, rates and taxes 30.2 9,314 7,670 Freight and distribution 122,808 141,234 Insurance 28,512 23,678 Advertising 247,555 177,613 Depreciation on owned assets 17.1.3 7,188 6,413 Depreciation on assets subject to finance lease 17.2.1 261 65 Provision for doubtful debts - net 8,001 2,784 Other expenses 18,261 16,238
677,944 580,062 Distribution and marketing costs include Rs. 19.876 million (2014: Rs. 11.435 million) for stores and spares consumed.
(Rupees in thousand) 2015 2014
30.1 Salaries, wages and amenities
Salaries, wages and amenities include following in respect of retirement benefits:
Gratuity
Current service cost 2,150 1,597 Net interest on net defined benefit liability / asset (504) (185)
1,646 1,412 In addition to above, salaries, wages and amenities include Rs. 4.041 million (2014: Rs. 2.702 million), Rs. 6.510 million (2014: Rs. 4.273 million) and Rs. 5.901 million (2014: Rs. 5.116 million) in respect of provident fund contribution, pension fund contribution and accumulating compensated absences respectively.
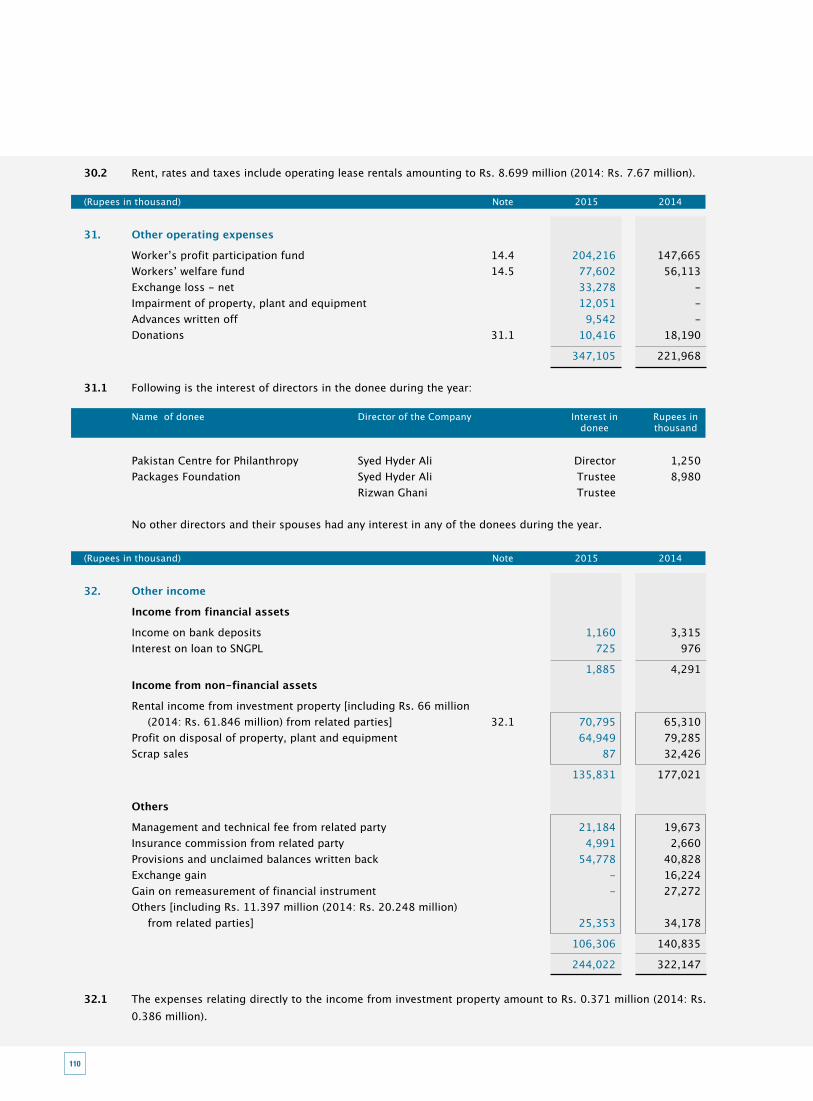
110
110
30.2 Rent, rates and taxes include operating lease rentals amounting to Rs. 8.699 million (2014: Rs. 7.67 million). (Rupees in thousand) Note 2015 2014
31. Other operating expenses
Worker’s profit participation fund 14.4 204,216 147,665 Workers’ welfare fund 14.5 77,602 56,113 Exchange loss - net 33,278 - Impairment of property, plant and equipment 12,051 - Advances written off 9,542 - Donations 31.1 10,416 18,190
347,105 221,968
31.1 Following is the interest of directors in the donee during the year:
Name of donee Director of the Company Interest in Rupees in donee thousand
Pakistan Centre for Philanthropy Syed Hyder Ali Director 1,250Packages Foundation Syed Hyder Ali Trustee 8,980 Rizwan Ghani Trustee No other directors and their spouses had any interest in any of the donees during the year.
(Rupees in thousand) Note 2015 2014
32. Other income
Income from financial assets
Income on bank deposits 1,160 3,315 Interest on loan to SNGPL 725 976
1,885 4,291 Income from non-financial assets
Rental income from investment property [including Rs. 66 million (2014: Rs. 61.846 million) from related parties] 32.1 70,795 65,310 Profit on disposal of property, plant and equipment 64,949 79,285 Scrap sales 87 32,426
135,831 177,021 Others
Management and technical fee from related party 21,184 19,673 Insurance commission from related party 4,991 2,660 Provisions and unclaimed balances written back 54,778 40,828 Exchange gain - 16,224 Gain on remeasurement of financial instrument - 27,272 Others [including Rs. 11.397 million (2014: Rs. 20.248 million) from related parties] 25,353 34,178
106,306 140,835
244,022 322,147
32.1 The expenses relating directly to the income from investment property amount to Rs. 0.371 million (2014: Rs. 0.386 million).

111
111
ANNUAL REPORT OF PACKAGES LIMITED 2015
32.2 The future minimum lease payments receivable under non-cancellable operating leases are as follows:
(Rupees in thousand) 2015 2014 Not later than one year 26,271 38,218 Later than one year and not later than five years 19,135 11,194
45,406 49,412
(Rupees in thousand) 2015 2014
33. Finance costs
Interest and mark up including commitment charges on Long term finances - secured 191,530 302,270 Finances under mark up arrangements - secured 95,500 87,646 Liabilities against assets subject to finance lease 2,041 2,193 Return on preference shares / convertible stock 336,050 355,050 Loan handling charges 232 1,232 Commission on guarantees 14,932 1,206 Bank charges 2,747 1,954
643,032 751,551
(Rupees in thousand) Note 2015 2014
34. Investment income
Dividend income from related parties 34.1 230,532 109,244 Dividend income from others 2,387,359 2,444,434
2,617,891 2,553,678
34.1 Dividend income from related parties
Subsidiaries
DIC Pakistan Limited 96,252 67,545 Packages Lanka (Private) Limited 69,170 23,942
Associate IGI Insurance Limited 65,110 17,757
230,532 109,244
(Rupees in thousand) Note 2015 2014
35. Tax
Current
Current year 35.1 424,393 356,000 Prior years 88,603 106,925
512,996 462,925 Deferred (5,902) (249,709)
507,094 213,216
35.1 The provision for current tax represents tax under ‘Final Tax Regime’ and Alternate corporate taxation under section 113 C of the Income Tax Ordinance, 2001 as per circular no. 2 of 2014.
The investment tax credit amounting to Rs. 57.752 million (2014: Rs. 54 million) available to the Company by virtue of investment in plant and machinery in accordance with Section 65B of the Income Tax Ordinance, 2001 has been netted off against the current tax charge for the year.

112
112
(Percentage) 2015 2014
35.2 Tax charge reconciliation
Numerical reconciliation between the average effective tax rate and the applicable tax rate Applicable tax rate 32.00 33.00 Tax effect of amounts that are: Not deductible for tax purposes 1.19 1.89 Exempt for tax purposes (0.18) (0.56) Chargeable to tax at different rates (14.60) (21.96) Impact of change in tax rate (1.43) 0.13 Effect of change in prior years’ tax 2.33 3.89 Tax credits and losses recognised during the year (4.45) (6.68)Investment tax credit (1.52) (1.96)
(18.66) (25.25)
Average effective tax rate charged to profit and loss account 13.34 7.75
36. Remuneration of Chief Executive, Directors and Executives
36.1 The aggregate amount charged in the financial statements for the year for remuneration, including certain benefits, to the Chief Executive, full time working Directors and Executives of the Company are as follows:
Chief Executive Directors Executives (Rupees in thousand) 2015 2014 2015 2014 2015 2014
Short term employee benefits
Managerial remuneration 16,819 14,583 7,209 14,982 117,106 110,989 Housing 6,786 5,811 2,806 8,495 57,994 61,426 Utilities 1,508 1,291 623 1,419 13,709 13,403 Bonus 16,643 3,767 6,985 3,179 93,639 42,927 Leave passage 4,498 4,545 521 2,089 3,323 4,530 Medical expenses 3,159 2,152 119 228 1,391 1,182 Club expenses 33 28 17 320 - - Others - - - - 28,749 30,209
49,446 32,177 18,280 30,712 315,911 264,666 Post employment benefits
Contribution to provident, gratuity and pension funds 5,271 4,456 2,159 3,021 29,079 28,735 Other long term benefits
Accumulating compensated absences 3,694 2,432 886 502 11,041 13,454
58,411 39,065 21,325 34,235 356,031 306,855
Number of persons 1 1 1 3 82 84 The Company also provides the Chief Executive and some of the Directors and Executives with free transport and
residential telephones.

113
113
ANNUAL REPORT OF PACKAGES LIMITED 2015
36.2 Remuneration to other directors
Aggregate amount charged in the financial statements for the year for fee to 5 non-executive directors (2014: 5 non-executive directors) is Rs. 2,775,000 (2014: Rs. 1,700,000).
37. Transactions with related parties
The related parties comprise subsidiaries, joint venture, associates, directors, key management personnel and post employment benefit plans. The Company in the normal course of business carries out transactions with various related parties. Amounts due from and to related parties are shown under receivables and payables, amounts due from directors and key management personnel are shown under receivables and remuneration of directors and key management personnel is disclosed in note 36. Other significant transactions with related parties are as follows:
Relationship with the Nature of transactions 2015 2014 Company (Rupees in thousand)
i. Subsidiaries Purchase of goods and services 1,020,831 967,061 Sale of goods and services 51,883 40,444 Investments made 2,437,175 600,000 Dividend income 165,423 91,487 Rental and other income 19,311 17,217 Management and technical fee 21,184 19,673 Expenses incurred on behalf of the subsidiaries 328,036 344,369 ii. Joint venture Purchase of goods and services 2,641,871 2,728,525 Sale of goods and services 217,761 405,373 Purchase of property, plant & equipment 437 - Sale of property, plant & equipment 47,719 - Rental and other income 57,242 64,424 iii. Associates Purchase of goods and services 1,028,873 1,179,015 Sale of goods and services 9,604 12,444 Sale of property, plant & equipment 1,834 - Insurance premium 144,221 107,617 Commission earned 4,991 2,659 Insurance claims received 1,177 1,463 Rental and other income 573 458 Dividend income 65,110 17,757 Expenses incurred on behalf of the associate - 283 iv. Post employment benefit Expense charged in respect of plans retirement benefit plans 76,958 85,365
All transactions with related parties have been carried out on mutually agreed terms and conditions.
There are no transactions with key management personnel other than under the term of employment.

114
114
38. Capacity and production - tons Capacity Actual production 2015 2014 2015 2014
Paper and paperboard produced 41,400 41,400 11,131 10,116 Paper and paperboard converted 45,526 45,526 34,510 32,511 Plastics all sorts converted 20,000 20,000 17,463 17,553 The variance of actual production from capacity is primarily on account of the product mix.
2015 2014
39. Number of employees
Total number of employees as at December 31 1,482 1,528 Average number of employees during the year 1,501 1,562
40. Rates of exchange
Liabilities in foreign currencies have been translated into PKR at USD 0.9542 (2014: USD 0.9940), EURO 0.8731 (2014: EURO 0.8172), CHF 0.9437 (2014: CHF 0.9828), SEK 8.0257 (2014: SEK 7.6982), GBP 0.6437 (2014: GBP 0.6384), SGD 1.3490 (2014: SGD 1.3134) and YEN 114.8633 (2014: YEN 118.7366) equal to Rs. 100. Assets in foreign currencies have been translated into PKR at USD 0.9560 (2014: USD 0.9960) equal to Rs. 100.
(Rupees in thousand) Note 2015 2014
41. Cash generated from operations
Profit before tax 3,802,510 2,749,520
Adjustments for:
Depreciation on owned assets 17.1.3 540,914 512,896 Gain on remeasurement of financial instrument 32 - (27,272) Depreciation on assets subject to finance lease 17.2.1 4,615 3,652 Depreciation on investment property 18 4,269 3,623 Amortisation on intangible assets 19 16,923 15,347 Provision for accumulating compensated absences 11 50,528 52,084 Provision for employees’ retirement benefit funds 10 7,568 14,354 Provision for doubtful debts 24.3 8,001 13,850 Net profit on disposal of property, plant and equipment 32 (64,949) (79,285) Impairment of property, plant and equipment 31 12,051 - Advance written off 31 9,542 - Finance costs 33 643,032 751,551 Dividend income 34 (2,617,891) (2,553,678)
Profit before working capital changes 2,417,113 1,456,642 Effect on cash flow due to working capital changes:
Decrease in stores and spares 4,906 75,626 Decrease / (increase) in stock-in-trade 450,323 (165,599) (Increase) / decrease in trade debts (261,651) 82,598 Decrease / (increase) in loans, advances, deposits, prepayments and other receivables 441,584 (328,690) Increase in trade and other payables 129,759 311,829
764,921 (24,236)
3,182,034 1,432,406

115
115
ANNUAL REPORT OF PACKAGES LIMITED 2015
(Rupees in thousand) Note 2015 2014
42. Cash and cash equivalents
Cash and bank balances 27 101,740 252,492 Finances under mark up arrangements - secured 13 (884,481) (1,262,596)
(782,741) (1,010,104)
2015 2014
43. Earnings per share
43.1 Basic earnings per share
Profit for the year Rupees in thousand 3,295,416 2,536,304 Weighted average number of ordinary shares Numbers 88,069,915 84,864,436 Earnings per share Rupees 37.42 29.89
43.2 Diluted earnings per share Profit for the year Rupees in thousand 3,295,416 2,536,304 Return on preference shares / convertible stock - net of tax Rupees in thousand 270,990 284,248
3,566,406 2,820,552 Weighted average number of ordinary shares Numbers 88,069,915 84,864,436 Weighted average number of notionally converted preference shares / convertible stock Numbers 17,996,431 21,201,910
106,066,346 106,066,346 Diluted earnings per share Rupees 33.62 26.59
44. Financial risk management
44.1 Financial risk factors
The Company’s activities expose it to a variety of financial risks: market risk (including currency risk, fair value interest rate risk, cash flow interest rate risk and price risk), credit risk and liquidity risk. The Company’s overall risk management programme focuses on the unpredictability of financial markets and seeks to minimise potential adverse effects on the Company’s financial performance. The Company uses derivative financial instruments to hedge certain risk exposures.
Risk management is carried out by the Company’s finance department under policies approved by the Board of
Directors. The Company’s finance department evaluates and hedges financial risks. The Board provides written principles for overall risk management, as well as written policies covering specific areas, such as foreign exchange risk, interest rate risk, credit risk, use of derivative financial instruments and non-derivative financial instruments, and investment of excess liquidity.
The Company’s overall risk management procedures to minimise the potential adverse effects of financial market on the Company’s performance are as follows:
(a) Market risk
(i) Foreign exchange risk
Foreign exchange risk is the risk that the fair value of future cash flows of a financial instrument shall fluctuate because of changes in foreign exchange rates.

116
116
The Company operates internationally and is exposed to foreign exchange risk arising from various currency exposures, primarily with respect to the US dollar and the Euro. Foreign exchange risk arises from future commercial transactions and recognised assets and liabilities. Foreign exchange risk arises when future commercial transactions or recognised assets or liabilities or net investments in foreign operations that are denominated in a currency that is not the Company’s functional currency.
At December 31, 2015, if the Rupee had strengthened / weakened by 10% against the US dollar with all other
variables held constant, post-tax profit for the year would have been Rs. 18.292 million higher / lower (2014: Rs. 25.831 million higher / lower), mainly as a result of foreign exchange gains / losses on translation of US dollar-denominated financial assets and liabilities.
At December 31, 2015, if the Rupee had strengthened / weakened by 10% against the Euro with all other
variables held constant, post-tax profit for the year would have been Rs. 68.592 million higher / lower (2014: Rs. 82.493 million higher / lower), mainly as a result of foreign exchange gains / losses on translation of Euro-denominated financial assets and liabilities.
(ii) Price risk
Price risk represents the risk that the fair value or future cash flows of a financial instrument will fluctuate because of changes in market prices (other than those arising from interest rate risk or currency risk), whether those changes are caused by factors specific to the individual financial instrument or its issuer, or factors affecting all similar financial instruments traded in the market. The Company is exposed to equity securities price risk because of investments held by the Company and classified as available for sale. The Company is not exposed to commodity price risk. To manage its price risk arising from investments in equity securities, the Company diversifies its portfolio. Diversification of the portfolio is done in accordance with the limits set by the board of directors.
The Company’s quoted investments in equity of other entities are publicly traded on Pakistan Stock Exchange. The table below summarises the impact of increases / decreases of the KSE-100 index on the Company’s
post-tax profit for the year and on equity. The analysis is based on the assumption that the KSE-100 index had increased / decreased by 10% with all other variables held constant and all the Company’s equity instruments moved according to the historical correlation with the index:
Impact on post - tax profit Impact on other components of equity(Rupees in thousand) 2015 2014 2015 2014
Pakistan Stock Exchange - - 1,366,278 (564,539) Post-tax profit for the year would decrease / increase as a result of losses / gains on equity securities classified
as at fair value through profit or loss. Other components of equity would decrease / increase as a result of losses / gains on equity securities classified as available for sale.
(iii) Cash flow and fair value interest rate risk
As the Company has no significant floating interest rate assets, the Company’s income is substantially independent of changes in market interest rates.
The Company’s interest rate risk arises from short term and long term borrowings. These borrowings issued at
variable rates expose the Company to cash flow interest rate risk. The Company analyses its interest rate exposure on a dynamic basis. Various scenarios are simulated taking
into consideration refinancing, renewal of existing positions, alternative financing and hedging. Based on these scenarios, the Company calculates the impact on profit and loss of a defined interest rate shift. The scenarios are run only for liabilities that represent the major interest-bearing positions.

117
117
ANNUAL REPORT OF PACKAGES LIMITED 2015
At December 31, 2015, if interest rates on floating rate borrowings had been 1% higher / lower with all other variables held constant, post-tax profit for the year would have been Rs 19.517 million (2014: Rs. 22.515 million ) lower / higher, mainly as a result of higher / lower interest expense on floating rate borrowings.
(b) Credit risk
Credit risk represents the risk of financial loss being caused if counter party fails to discharge an obligation.
Credit risk of the Company arises from cash and cash equivalents, derivative financial instruments and deposits with banks and financial institutions, as well as credit exposures to distributors and wholesale and retail customers, including outstanding receivables and committed transactions. The management assesses the credit quality of the customers, taking into account their financial position, past experience and other factors. Individual risk limits are set based on internal or external ratings in accordance with limits set by the board. The utilisation of credit limits is regularly monitored and major sales to retail customers are settled in cash. For banks and financial institutions, only independently rated parties with a strong credit rating are accepted.
The Company monitors the credit quality of its financial assets with reference to historical performance of such
assets and available external credit ratings. The carrying values of financial assets exposed to credit risk and which are neither past due nor impaired are as under:
(Rupees in thousand) 2015 2014
Long term loans and deposits 39,247 52,558 Trade debts 1,313,540 1,079,492 Loans, advances, deposits, prepayments and other receivables 1,346,088 1,797,214 Balances with banks 97,314 245,909
2,796,189 3,175,173 As of December 31, 2015, trade receivables of Rs. 467.482 million (2014: Rs. 447.880 million) were past due
but not impaired. These relate to a number of independent customers for whom there is no recent history of default. The aging analysis of these trade receivables is as follows:
(Rupees in thousand) 2015 2014
Up to 90 days 412,960 410,287 90 to 180 days 46,119 27,268 181 to 365 days 8,403 10,325
467,482 447,880 The management estimates the recoverability of trade receivables on the basis of financial position and past
history of its customers based on the objective evidence that it shall not receive the amount due from the particular customer. The provision is written off by the Company when it expects that it cannot recover the balance due. Any subsequent repayments in relation to amount written off, are credited directly to profit and loss account.
The aging analysis of trade receivables from related parties as at balance sheet date is as follows:
(Rupees in thousand) 2015 2014
Up to 90 days 12,164 2,548 90 to 180 days 4,190 845 181 to 365 days 694 349
17,048 3,742

118
118
The credit quality of Company’s bank balances can be assessed with reference to external credit ratings as follows:
Rating Rating (Rupees in thousand) Short term Long term Agency 2015 2014
Bank Alfalah Limited A1+ AA PACRA 1,184 - Citibank N.A. P-1 A2 Moody’s 357 204 Deutsche Bank A.G. P-2 A3 Moody’s 70,970 85,055 Dubai Islamic Bank (Pakistan) Limited A1 A+ JCR-VIS - 712 Faysal Bank Limited A1+ AA PACRA - 351 Habib Bank Limited A1+ AAA JCR-VIS 928 924 Al Baraka Bank (Pakistan) Limited A1 A PACRA 1 - JS Bank Limited A1+ A+ PACRA 282 78 MCB Bank Limited A1+ AAA PACRA 23 3,062 Meezan Bank Limited A1+ AA JCR-VIS 1,971 111,684 National Bank of Pakistan A1+ AAA PACRA 11,941 3 NIB Bank Limited A1+ AA- PACRA 681 329 Samba bank A1 AA JCR-VIS 1,332 1,675 Standard Chartered Bank Pakistan Limited A1+ AAA PACRA 7,492 41,638 The Bank of Punjab A1+ AA- PACRA 152 194
97,314 245,909 (c) Liquidity risk
Liquidity risk represents the risk that the Company shall encounter difficulties in meeting obligations associated with financial liabilities.
Prudent liquidity risk management implies maintaining sufficient cash and marketable securities, the availability
of funding through an adequate amount of committed credit facilities. Due to the dynamic nature of the Company’s businesses, the Company’s finance department maintains flexibility in funding by maintaining availability under committed credit lines.
Management monitors the forecasts of the Company’s cash and cash equivalents (note 42) on the basis of
expected cash flow. This is generally carried out in accordance with practice and limits set by the Company. These limits vary by location to take into account the liquidity of the market in which the entity operates. In addition, the Company’s liquidity management policy involves projecting cash flows in each quarter and considering the level of liquid assets necessary to meet its liabilities, monitoring balance sheet liquidity ratios against internal and external regulatory requirements and maintaining debt financing plans.
The table below analyses the Company’s financial liabilities and net-settled derivative financial liabilities into relevant maturity groupings based on the remaining period at the balance sheet to the contractual maturity date. The amounts disclosed in the table are the contractual undiscounted cash flows as the impact of discounting is not significant.

119
119
ANNUAL REPORT OF PACKAGES LIMITED 2015
At December 31, 2015 Less than 1 Between 1 and Between 2 and Over (Rupees in thousand) year 2 years 5 years 5 years
Long term finances 385,714 571,428 1,142,858 - Liabilities against assets subject to finance lease 6,571 7,411 20,242 - Finances under mark up arrangements - secured 884,481 - - - Trade and other payables 3,278,124 - - - Accrued finance cost 349,282 - - -
4,904,172 578,839 1,163,100 -
At December 31, 2014 Less than 1 Between 1 and Between 2 and Over (Rupees in thousand) year 2 years 5 years 5 years
Long term finances 200,000 385,710 485,710 1,228,580 Liabilities against assets subject to finance lease 4,696 5,231 20,454 - Finances under mark up arrangements - secured 1,262,596 - - - Trade and other payables 3,144,680 - - - Accrued finance cost 517,634 - - -
5,129,606 390,941 506,164 1,228,580
44.2 Financial instruments by categories
The carrying values of following financial assets and liabilities reflected in the financial statements approximate their fair values. Fair value is determined on the basis of objective evidence at reporting date.
Loans and receivables(Rupees in thousand) 2015 2014
Financial assets
Long term loans and deposits 39,247 52,558 Trade debts 1,781,022 1,527,372 Loans, advances, deposits, prepayments and other receivables 1,346,088 1,797,214 Balances with banks 97,314 245,909
3,263,671 3,623,053 At amortised cost(Rupees in thousand) 2015 2014
Financial liabilities
Long term finances - secured 2,100,000 2,300,000 Liabilities against assets subject to finance lease 34,224 30,381 Finances under markup arrangements - secured 884,481 1,262,596 Trade and other payables 3,278,124 3,144,680 Accrued finance cost 349,282 517,634
6,646,111 7,255,291

120
120
44.3 Capital risk management
The Company’s objectives when managing capital are to safeguard the Company’s ability to continue as a going concern in order to provide returns for shareholders and benefits for other stakeholders and to maintain an optimal capital structure to reduce the cost of capital.
The Company manages its capital structure and makes adjustments to it in the light of changes in economic conditions. In order to maintain or adjust the capital structure, the Company may adjust the amount of dividends paid to shareholders or issue new shares. Consistent with the others in industry, the Company monitors capital on the basis of the gearing ratio. This ratio is calculated as net debt divided by total capital. Net debt is calculated as total borrowings including the current and non-current borrowings as disclosed in note 7 less cash and cash equivalents as disclosed in note 42. Total capital is calculated as equity as shown in the balance sheet plus net debt. The gearing ratio as at year end is as follows:
(Rupees in thousand) Note 2015 2014
Long term finances 7 3,729,181 4,228,815 Current portion of long term finances 7 385,714 200,000 Cash and cash equivalents 42 782,741 1,010,104
Net debt 4,897,636 5,438,919 Total equity 47,786,373 50,002,727
Total capital 52,684,009 55,441,646
Gearing ratio 9% 10% 44.4 Fair value of financial instruments
Fair value is the amount for which an asset could be exchanged, or liability settled, between knowledgeable willing parties in an arm’s length transaction. Underlying the definition of fair value is the presumption that the Company is a going concern without any intention or requirement to curtail materially the scale of its operations or to undertake a transaction on adverse terms. The carrying values of all financial assets and liabilities reflected in these financial statements approximate their fair values. Fair value is determined on the basis of objective evidence at each reporting date.
The carrying amount less impairment provision of trade receivables and payables are assumed to approximate
their fair values. The fair value of financial liabilities for disclosure purposes is estimated by discounting the future contractual cash flows at the current market interest rate that is available to the Company for similar financial instruments.
Specific valuation techniques used to value financial instruments include:
- Quoted prices (unadjusted) in active markets for identical assets or liabilities (level 1)
- Inputs other than quoted prices included within level 1 that are observable for the asset or liability, either directly (that is, as prices) or indirectly (that is, derived from prices) (level 2)
- Inputs for the asset or liability that are not based on observable market data (that is, unobservable inputs) (level 3)
The following table presents the Company’s assets that are measured at fair value: At December 31, 2015(Rupees in thousand) Level 1 Level 2 Level 3 Total
Assets Recurring fair value measurement of available-for-sale investments 28,464,135 - - 28,464,135

121
121
ANNUAL REPORT OF PACKAGES LIMITED 2015
At December 31, 2014(Rupees in thousand) Level 1 Level 2 Level 3 Total
Assets Recurring fair value measurement of available-for-sale investments 33,208,157 - - 33,208,157
Valuation techniques used to measure fair values
The fair value of financial instruments traded in active markets is based on quoted market prices at the balance sheet date. A market is regarded as active if quoted prices are readily and regularly available from an exchange, dealer, broker, industry group, pricing service, or regulatory agency, and those prices represent actual and regularly occurring market transactions on an arm’s length basis. The quoted market price used for financial assets held by the Company is the current bid price. These instruments are included in Level 1. The fair value of financial instruments that are not traded in an active market is determined by using valuation techniques. These valuation techniques maximize the use of observable market data where it is available and rely as little as possible on entity specific estimates. If all significant inputs required to fair value an instrument are observable, the instrument is included in Level 2. If one or more of the significant inputs is not based on observable market data, the instrument is included in Level 3.
There were no other material Level 1, 2 or 3 assets or liabilities during current or prior year. There were no transfers between levels 1 and 2 for recurring fair value measurements during the year. 45. Date of authorisation for issue
These financial statements were authorised for issue on February 25, 2016 by the Board of Directors of the Company.
46. Non-adjusting events after the balance sheet date
On February 2, 2016, IFC exercised its right to convert 1,000,000 (2014: 1,000,000) preference share / convertible stock of Rs 190 each into 1,000,000 (2014: 1,000,000) ordinary shares of Rs. 10 each. This conversion is expected to take place prior to book closure date.
The Board of Directors has proposed a final cash dividend for the year ended December 31, 2015 of Rs. 15 per share (2014: Rs. 9.00 per share), at their meeting held on February 25, 2016 for approval of the members at the Annual General Meeting to be held on April 25, 2016. The Board has also recommended to transfer Rs. 1,500 million (2014: Rs. 1,500 million) to general reserve from unappropriated profit.
The Finance Act, 2015 introduced income tax at the rate of 10% on undistributed reserves where such reserves
of the Company are in excess of its paid up capital and the Company derives profits for a tax year but does not distribute requisite cash dividend within six months of the end of the said tax year. Liability in respect of such income tax, if any, is recognised when the prescribed time period for distribution of dividend expires.
47. Corresponding figures
Corresponding figures have been re-arranged and reclassified, wherever necessary, for the purposes of comparison. However, no significant reclassifications have been made.
Towfiq Habib Chinoy Syed Hyder Ali Rizwan Ghani Chairman Chief Executive & Managing Director Director

122
122

123
ANNUAL REPORT OF PACKAGES LIMITED 2015CONSOLIDATED FINANCIAL STATEMENTS 2015
123
Consolidated Financial StatementsFor the year ended December 31, 2015

124
124
DIRECTORS’ REPORTOn The Consolidated Financial StatementsFor The Year Ended December 31, 2015
The Directors of Packages Limited are pleased to present the audited consolidated financial statements of the Group for the year ended December 31, 2015.
Group resultsThe Group has performed well during the current year.
The comparison of annual audited results for the year 2015 as against year 2014 is as follows:
During the year 2015, the Group has achieved net sales of Rs. 22,060 million against net sales of Rs. 18,727 million achieved during last year which is an increase of 18%.
The Group has achieved Profit from operations of Rs. 2,602 million during 2015 as against that of Rs. 1,468 million achieved during 2014 representing an increase of Rs. 1,134 million i.e. 77%.
A brief review of the operational performance of the Group entities is as follows:
DIC Pakistan LimitedDIC Pakistan Limited is a non-listed public limited subsidiary of Packages Limited. It is principally engaged in manufacturing, processing and selling of industrial inks. The Company has achieved net sales of Rs. 3,443 million during the year 2015 as compared to Rs. 3,188 million of last year representing sales growth of 8%. The Company has generated profit before tax of Rs. 486 million during the year 2015 as against Rs. 353 million of 2014 representing growth of 38% resulting from sales growth and operational efficiencies. Moving forward, the Company will continue its focus on improving operating results through volume growth, tighter operating cost control, product diversification, price rationalisation and better working capital management.
Packages Lanka (Private) Limited Packages Lanka (Private) Limited is a Sri Lanka based subsidiary of Packages Limited. It is primarily engaged in production of flexible packaging solutions. The Company has achieved turnover of SLR 1,798 million during the year 2015 as compared to SLR 1,653 million of 2014 representing growth of 9%. The Company has generated profit before tax of SLR 249 million in the year 2015 as compared to SLR 151 million of 2014. This increase in profit is mainly attributable to operational efficiencies that include waste reduction efforts and also due to reduced finance cost on account of repayments of availed financing facilities. Moving forward, the Company will focus on improving operating results through tighter operating cost control, product diversification and price rationalisation.
2015 2014
Invoiced sales – net 22,060 18,727Profit from operations 2,602 1,468Share of profit / (loss) in associates and joint venture 233 (215)Investment income 2,387 2,444Profit after tax 3,397 2,540
(Rupees in million)
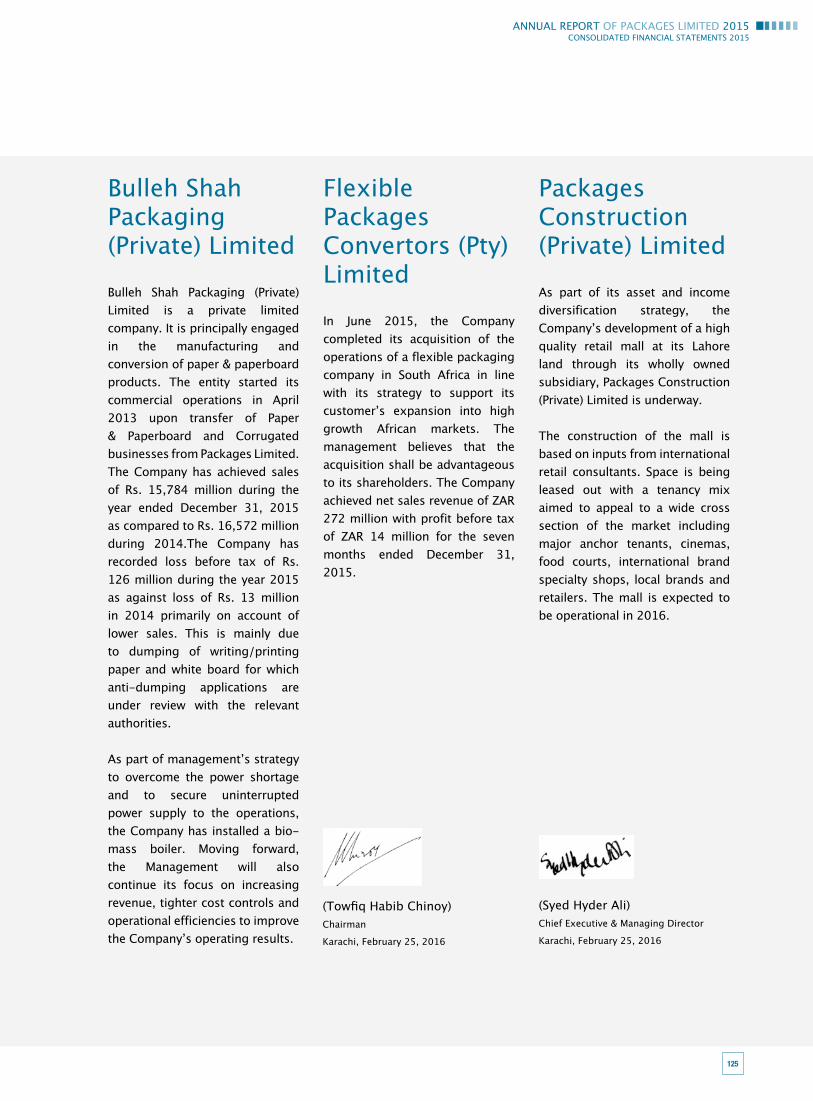
125
125
ANNUAL REPORT OF PACKAGES LIMITED 2015CONSOLIDATED FINANCIAL STATEMENTS 2015
Bulleh Shah Packaging (Private) LimitedBulleh Shah Packaging (Private) Limited is a private limited company. It is principally engaged in the manufacturing and conversion of paper & paperboard products. The entity started its commercial operations in April 2013 upon transfer of Paper & Paperboard and Corrugated businesses from Packages Limited. The Company has achieved sales of Rs. 15,784 million during the year ended December 31, 2015 as compared to Rs. 16,572 million during 2014.The Company has recorded loss before tax of Rs. 126 million during the year 2015 as against loss of Rs. 13 million in 2014 primarily on account of lower sales. This is mainly due to dumping of writing/printing paper and white board for which anti-dumping applications are under review with the relevant authorities.
As part of management’s strategy to overcome the power shortage and to secure uninterrupted power supply to the operations, the Company has installed a bio-mass boiler. Moving forward, the Management will also continue its focus on increasing revenue, tighter cost controls and operational efficiencies to improve the Company’s operating results.
Flexible Packages Convertors (Pty) LimitedIn June 2015, the Company completed its acquisition of the operations of a flexible packaging company in South Africa in line with its strategy to support its customer’s expansion into high growth African markets. The management believes that the acquisition shall be advantageous to its shareholders. The Company achieved net sales revenue of ZAR 272 million with profit before tax of ZAR 14 million for the seven months ended December 31, 2015.
Packages Construction (Private) LimitedAs part of its asset and income diversification strategy, the Company’s development of a high quality retail mall at its Lahore land through its wholly owned subsidiary, Packages Construction (Private) Limited is underway.
The construction of the mall is based on inputs from international retail consultants. Space is being leased out with a tenancy mix aimed to appeal to a wide cross section of the market including major anchor tenants, cinemas, food courts, international brand specialty shops, local brands and retailers. The mall is expected to be operational in 2016.
(Towfiq Habib Chinoy) Chairman
Karachi, February 25, 2016
(Syed Hyder Ali)Chief Executive & Managing Director
Karachi, February 25, 2016

126
126
31دسمبر ڈائریکٹرز کے لمیٹڈ پیکیجز
2015کو ختم ہونے والے سال کے لئے گروپ
کے اڈٹ شدہ مجموعی مالیاتی حسابات
پیش کرتے ہوئے فخر محسوس کررہے ہیں۔
گروپ کے نتائج
گروپ کی کارکردگی سال رواں کے دوران بہترین رہی۔
سال گزشتہ نتائج اڈٹ ساالنہ لئے 2015کے سال
2014کے مقابلے میں مندرجہ ذیل رہے
2014 2015
(روپے ملین میں)
انوائسڈ سیلز- خالص 22,060 18,727
اپریشنز سے منافع 2,602 1,468
منسلکہ اور جوائنٹ
وینچرز میں منافع /
(خسارے) کا شیئر 233 (215)
سرمایہ کار امدنی 2,387 2,444
منافع بعد از ٹیکس 3,397 2,540
سال 2015کے دوران گروپ نے 22,060ملین روپے کی
خالص سیلز حاصل کی برخالف اس کے گزشتہ سال کے
تھی رہی دوران 18,727ملین روپے کی خالص سیلز
جس سے 18فیصد اضافہ ظاہر ہوتا ہے۔
2,602ملین سے اپریشنز دوران 2015کے نے گروپ
کا منافع حاصل کیا جبکہ 2014کے دوران یہ روپے
منافع 1,468ملین روپے تھا اور اس طرح 1,134ملین
روپے یعنی 77فیصد کا اضافہ ہوا۔
گروپ کے اداروں کی اپریشنل کارکردگی کا ایک مختصر
جائزہ درج ذیل کے مطابق ہے:
ڈی ائی سی پاکستان لمیٹڈ
ڈی ائی سی پاکستان لمیٹڈ پیکیجز لمیٹڈ کی ایک نان-
لسٹڈ پبلک لمیٹڈ ذیلی کمپنی ہے۔ یہ بنیادی طور پر
صنعتی انکس کی مینوفیکچرنگ ، پراسیسنگ
اور فروخت میں مصروف عمل ہے۔ کمپنی نے سال
مجموعی کی روپے 3,443ملین دوران 2015کے
سیلز کا ہدف حاصل کیا جبکہ گزشتہ سال یہ سیلز
3,188ملین روپے تھی جس سے 8فیصد بہتری ظاہر
ہوتی ہے۔ کمپنی نے سال 2015کے دوران 486ملین
روپے کا قبل از ٹیکس منافع حاصل کیا۔ برخالف اس
کیا حاصل منافع کا روپے 353ملین 2014میں کے
مجموعی مالیاتی حسابات پر ڈائریکٹرز کی رپورٹ
ہے جو ہوتی ظاہر گروتھ 38فیصد تھا جس سے گیا
کہ سیلز گروتھ اور اپریشنل کارکردگی میں بہتری کی
وجہ سے ہے۔ مستقبل کو دیکھتے ہوئے کمپنی ترقی
پروڈکٹس کنٹرول، موثر پر اپریٹنگ الگت کے حجم،
میں توسیع، نرخوں کی تقسیم اور بہتر ورکنگ کیپٹل
بہتر مزید کو نتائج اپریٹنگ ذریعے کے مینجمنٹ
گی۔ رکھے جاری سلسلہ کا دینے توجہ پر بنانے
پیکیجز لنکا )پرائیویٹ( لمیٹڈ
پیکیجز لنکا (پرائیویٹ) لمیٹڈ سری لنکا میں قائم پیکیجز
لمیٹڈ کا ایک ذیلی ادارہ ہے۔ یہ بنیادی طور پر فلیکس
ایبل پیکیجنگ سولیوشنز میں مصروف عمل ہے۔ کمپنی
نے سال 2015کے دوران 1,798ملین سری لنکن روپے کا
ٹرن اوور حاصل کیا جبکہ 2014میں یہ 1,653ملین سری
لنکن روپے تھا جس سے 9فیصد ترقی ظاہر ہوتی ہے۔
کمپنی نے سال 2015میں 249ملین سری لنکن روپے
کا قبل از ٹیکس منافع حاصل کیا برخالف 2014میں یہ
151ملین سری لنکن روپے تھا۔ منافع میں یہ اضافہ
اپریشنل کارکردگی میں بہتری کی بدولت ممکن ہوا جس
میں ویسٹ میں کمی کی کوششوں کے دخل کے ساتھ
حاصل شدہ فنانسنگ سہولتوں کی ادائیگیوں کے ضمن
میں فنانس الگت میں کمی بھی شامل ہے۔ مستقبل پر
نگاہ رکھتے ہوئے کمپنی اپریٹنگ الگت پر موثر کنٹرول،
پروڈکٹس میں توسیع اور نرخوں کی راشنالئزیشن کے
ذریعے بہترین اپریٹنگ نتائج کے حصول پر توجہ مرکوز
کرے گی۔
بلھے شاہ پیکیجنگ )پرائیویٹ( لمیٹڈ
بلھے شاہ پیکیجنگ (پرائیویٹ) لمیٹڈ ایک پرائیویٹ
لمیٹڈ کمپنی ہے۔ یہ بنیادی طور پر پیپر اور پیپر بورڈ
پروڈکٹس کی تیاری اور ان کی منتقلی میں مصروف
اپریل اپریشنز تجارتی اپنا نے ادارے ہے۔ عمل
اور بورڈ پیپر اور پیپر سے لمیٹڈ پیکیجز 2013میں
کوروگیٹڈ کے کاروباروں کےٹرانسفر کے تحت شروع
کیا تھا۔ کمپنی نے سال مختتمہ 31دسمبر 2015کے
دوران 15,784ملین روپے کی سیلز حاصل کی۔ اس کے
مقابلے میں 2014کے دوران یہ 16,572ملین روپے رہا
تھا۔ کمپنی نے سال 2015کے دوران 126ملین روپے کا
قبل از ٹیکس خسارہ ریکارڈ کیا جبکہ 2014میں سیلز
میں کمی کے ضمن میں ابتدائی طور پر 13ملین روپے
کا خسارہ ہوا تھا۔ یہ بنیادی طور پر رائٹنگ/ پرنٹنگ پیپر
اور وائٹ بورڈ کو ڈمپ کرنے کے باعث ہوا جس کے
لئے متعلقہ حکام کے ساتھ اینٹی ڈمپنگ ایپلی کیشنز
کا جائزہ لیا جارہا ہے۔
بجلی بحران پر قابو پانے اور اپریشنز کے لئے بالتعطل
پاور سپالئی کے تحفظ کے لئے انتظامیہ کی حکمت
عملی کے حصہ کے طور پر کمپنی نے بایو-ماس بوائلر
انتظامیہ ہوئے دیکھتے کو مستقبل ہے۔ کیا نصب
امدنی میں اضافے، الگت پر موثر کنٹرول اور اپریشنل
کارکردگی کو بہتر بنانے پر توجہ مرکوز کرتے ہوئے
کمپنی کے اپریٹنگ نتائج بہتر بنائے گی۔
فلیکس ایبل پیکیجز کنورٹرز )پروپرائٹری(لمیٹڈ
افریقہ میں ایک جون 2015میں کمپنی نے جنوبی
فلیکس ایبل پیکیجنگ کمپنی کے اپریشنز کا حصول
مکمل کیا جو بہترین گروتھ کی حامل افریقی مارکیٹوں
میں اپنے صارفین کی توسیع کے لئے سپورٹ کے ضمن
میں اس کی حکمت عملی کا حصہ تھی۔ انتظامیہ
اس امر پر یقین رکھتی ہے کہ یہ حصول اس کے شیئر
ہولڈرز کے لئے مفید ثابت ہوگا۔ کمپنی نے 31دسمبر
ار 2015کے اخری سات ماہ کی مدت میں زیڈ اے
272ملین کی خالص سیلز امدنی کے ساتھ زیڈ اے ار
14ملین کا قبل از ٹیکس منافع حاصل کیا۔
پیکیجز کنسٹرکشن )پرائیویٹ( لمیٹڈحکمت جہت ہمہ کی امدنی اور جات اثاثہ اپنے
عملی کے حصے کے طور پر کمپنی نے الہور میں اپنی
اراضی پر مکمل طور پر ملکیتی ذیلی ادارے پیکیجز
اعلی کنسٹرکشن (پرائیویٹ) لمیٹڈ کے ذریعے ایک
معیار کے ریٹیل مال کا اغاز کیا جو زیر تکمیل ہے۔
االقوامی ریٹیل کنسلٹینٹس سے بین مال کی تعمیر
کرایہ کو جگہ ہے۔ مبنی پر مشاورت شدہ حاصل
داروں کی امیزش کے ساتھ لیز پر دیا جارہا ہے تاکہ
مارکیٹ کے وسیع تر سیکشن کی توجہ حاصل کی
جاسکے جس میں نمایاں ترین اینکر کرایہ دار، سینماز،
فوڈ کورٹس، بین االقوامی برانڈ کی حامل دکانیں، لوکل
برانڈز اور ریٹیلرز بھی شامل ہیں۔ یہ مال ممکنہ طور
پر 2016میں اپریشنل ہوجائے گا۔
(توفیق حبیب چنائے)چیئرمین
(سید حیدر علی)چیف ایگزیکٹو اور منیجنگ ڈائریکٹر
کراچی، فروری 25، 2016کراچی، فروری 25، 2016
(inks)

127
127
ANNUAL REPORT OF PACKAGES LIMITED 2015CONSOLIDATED FINANCIAL STATEMENTS 2015
AUDITORS’ REPORT TO THE MEMBERS
In our opinion the consolidated financial statements present fairly the financial position of Packages Limited and its subsidiary companies (the Group) as at December 31, 2015 and the results of their operations for the year then ended.
A.F. Ferguson & Co.Chartered AccountantsLahore, March 11, 2016
Name of engagement partner: Asad Aleem Mirza
included for such companies, is based solely on the report of such other auditors. These financial statements are the responsibility of the holding Company’s management. Our responsibility is to express an opinion on these financial statements based on our audit.
Our audit was conducted in accordance with the International Standards on Auditing and accordingly included such tests of accounting records and such other auditing procedures as we considered necessary in the circumstances.
As stated in note 2.2.1 to the annexed consolidated financial statements, the Group has changed its accounting policies on initial application of standards, amendments or interpretations to existing standards, with which we concur.
We have audited the annexed consolidated financial statements comprising consolidated balance sheet of Packages Limited (the holding Company) and its subsidiary companies (the Group) as at December 31, 2015 and the related consolidated profit and loss account, consolidated statement of comprehensive income, consolidated statement of changes in equity and consolidated cash flow statement together with the notes forming part thereof, for the year then ended. We have also expressed separate opinions on the financial statements of Packages Limited and its subsidiary companies except for Packages Lanka (Private) Limited, Anemone Holdings (Private) Limited and Flexible Packages Convertors (Proprietary) Limited which were audited by other firms of auditors, whose report has been furnished to us and our opinion in so far as it relates to the amounts

128
128
CONSOLIDATED BALANCE SHEETas at December 31, 2015
(Rupees in thousand) Note 2015 2014
EQUITY AND LIABILITIES
CAPITAL AND RESERVES Authorised capital 150,000,000 (2014: 150,000,000) ordinary shares of Rs. 10 each 1,500,000 1,500,000 22,000,000 (2014: 22,000,000) 10% non-voting preference shares / convertible stock of Rs. 190 each 4,180,000 4,180,000 Issued, subscribed and paid up capital 88,379,504 (2014: 86,379,504) ordinary shares of Rs. 10 each 5 883,795 863,795 Reserves 6 41,606,293 44,759,323 Preference shares / convertible stock reserve 7 1,309,682 1,571,699 Equity portion of short term loan from shareholder of the Parent Company 8 46,596 - Accumulated profit 4,316,773 3,397,572
48,163,139 50,592,389 NON-CONTROLLING INTEREST 929,138 392,866
49,092,277 50,985,255 NON-CURRENT LIABILITIES
Long term finances 7 5,762,485 4,428,836 Liabilities against assets subject to finance lease 9 192,374 25,685 Deferred tax 10 693,332 437,000 Retirement benefits 11 40,425 - Deferred liabilities 12 248,256 212,911
6,936,872 5,104,432 CURRENT LIABILITIES
Current portion of long term liabilities 13 551,640 271,370 Short term loan from shareholder of the Parent Company - unsecured 14 478,110 - Finances under mark up arrangements - secured 15 1,183,699 1,607,583 Trade and other payables 16 4,784,041 3,561,912 Accrued finance costs 17 367,612 526,943 Provision for tax 27,323 -
7,392,425 5,967,808 CONTINGENCIES AND COMMITMENTS 18 - -
63,421,574 62,057,495

129
129
ANNUAL REPORT OF PACKAGES LIMITED 2015CONSOLIDATED FINANCIAL STATEMENTS 2015
(Rupees in thousand) Note 2015 2014
ASSETS
NON-CURRENT ASSETS
Property, plant and equipment 19 5,538,426 4,186,396 Investment property 20 5,110,248 1,166,414 Intangible assets 21 150,437 43,059 Investments accounted for under equity method 22 13,620,616 13,448,877 Other long term investments 23 28,478,865 33,222,887 Long term loans and deposits 24 40,384 53,361 Retirement benefits 11 - 87,881
52,938,976 52,208,875
CURRENT ASSETS
Stores and spares 25 539,550 549,505 Stock-in-trade 26 2,715,346 2,935,722 Trade debts 27 2,874,022 2,057,352 Loans, advances, deposits, prepayments and other receivables 28 1,369,863 1,504,559 Income tax receivable 29 2,542,123 2,341,185 Cash and bank balances 30 441,694 460,297
10,482,598 9,848,620
63,421,574 62,057,495
The annexed notes 1 to 53 form an integral part of these consolidated financial statements.
Towfiq Habib Chinoy Syed Hyder Ali Rizwan Ghani Chairman Chief Executive & Managing Director Director

130
130
(Rupees in thousand) Note 2015 2014
Local sales Own manufactured 24,384,609 21,009,446 Purchased for resale 169,155 91,052
24,553,764 21,100,498 Export sales 609,968 546,807
25,163,732 21,647,305
Less: Sales tax and excise duty 3,047,509 2,876,714 Commission 55,514 43,590
3,103,023 2,920,304
Net sales 22,060,709 18,727,001 Cost of sales 31 (17,307,773) (15,682,559)
Gross profit 4,752,936 3,044,442
Administrative expenses 32 (1,135,786) (975,619)Distribution and marketing costs 33 (895,060) (676,228)Other operating expenses 34 (391,701) (248,588)Other income 35 271,660 324,211
Profit from operations 2,602,049 1,468,218
Finance costs 36 (757,823) (841,120)Investment income 37 2,387,359 2,444,434 Share of profit / (loss) of investments accounted for under equity method - net of tax 232,923 (214,659)
Profit before tax 4,464,508 2,856,873
Tax 38 (1,067,850) (317,266)
Profit for the year 3,396,658 2,539,607
Attributable to: Equity holders of the Parent Company 3,300,944 2,409,971 Non-controlling interest 95,714 129,636
3,396,658 2,539,607 Earnings per share attributable to equity holders of the Parent Company during the year Basic Rupees 46 37.48 28.40 Diluted Rupees 46 33.68 25.40 The annexed notes 1 to 53 form an integral part of these consolidated financial statements.
Towfiq Habib Chinoy Syed Hyder Ali Rizwan Ghani Chairman Chief Executive & Managing Director Director
CONSOLIDATED PROFIT AND LOSS ACCOUNTfor the year ended December 31, 2015

131
131
ANNUAL REPORT OF PACKAGES LIMITED 2015CONSOLIDATED FINANCIAL STATEMENTS 2015
(Rupees in thousand) 2015 2014
Profit for the year 3,396,658 2,539,607 Other comprehensive income: Items that will not be reclassified to profit or loss Remeasurement of retirement benefits liability / asset (136,067) 82,427 Tax effect 40,496 (28,843)
(95,571) 53,584 Items that may be reclassified subsequently to profit or loss (Deficit) / surplus on remeasurement of available for sale financial assets (4,744,022) 5,656,334 Exchange differences on translating foreign subsidiaries (433,983) (29,299) Share of other comprehensive (loss) / income of investments accounted for under equity method - net of tax (15,131) 2,401
(5,193,136) 5,629,436
Other comprehensive (loss) / income for the year - net of tax (5,288,707) 5,683,020 Total comprehensive (loss) / income for the year (1,892,049) 8,222,627 Attributable to: Equity holders of the Parent Company (1,812,348) 8,099,176 Non-controlling interest (79,701) 123,451
(1,892,049) 8,222,627 The annexed notes 1 to 53 form an integral part of these consolidated financial statements.
Towfiq Habib Chinoy Syed Hyder Ali Rizwan Ghani Chairman Chief Executive & Managing Director Director
CONSOLIDATED STATEMENT OF COMPREHENSIVE INCOMEfor the year ended December 31, 2015

132
132
Towfiq Habib Chinoy Syed Hyder Ali Rizwan Ghani Chairman Chief Executive & Managing Director Director
CONSOLIDATED STATEMENT OF CHANGES IN EQUITYfor the year ended December 31, 2015
Balance as on December 31, 2013 843,795 2,876,893 42,784 23,566,916 11,610,333 1,605,875 (29,109) - 2,309,000 42,826,487 332,354 43,158,841 Appropriation of funds Transferred to general reserve account - - - - 700,000 - - - (700,000) - - -
Total transactions with owners, recognised directly in equity
Final dividend for the year ended December 31, 2013 Rs. 8.00 per share - - - - - - - - (675,036) (675,036) - (675,036)Dividends relating to 2013 paid to non - controlling interests - - - - - - - - - - (62,939) (62,939)Conversion of preference shares / convertible stock into ordinary share capital (2,000,000 ordinary shares of Rs. 10 each) 20,000 355,938 - - - (34,176) - - - 341,762 - 341,762
Total transactions with owners, recognised directly in equity 20,000 355,938 - - - (34,176) - - (675,036) (333,274) (62,939) (396,213)
Total comprehensive income for the year ended December 31, 2014 Profit for the year - - - - - - - - 2,409,971 2,409,971 129,636 2,539,607 Other comprehensive income: Remeasurement of retirement benefit asset / liability - net of tax - - - - - - - - 53,637 53,637 (53) 53,584 Exchange difference on translation of foreign subsidiary - - (23,167) - - - - - - (23,167) (6,132) (29,299) Other comprehensive income of investments accounted for under equity method - - - - - - 2,401 - - 2,401 - 2,401 Surplus on remeasurement of available for sale financial assets - - - 5,656,334 - - - - - 5,656,334 - 5,656,334
Total comprehensive income for the year - - (23,167) 5,656,334 - - 2,401 - 2,463,608 8,099,176 123,451 8,222,627
Balance as on December 31, 2014 863,795 3,232,831 19,617 29,223,250 12,310,333 1,571,699 (26,708) - 3,397,572 50,592,389 392,866 50,985,255
Transferred to general reserve account - - - - 1,500,000 - - - (1,500,000) - - - Share of other reserves of investments accounted for under equity method - - - - - - 8,997 - - 8,997 - 8,997
Total transactions with owners, recognised directly in equity
Final dividend for the year ended December 31, 2014 Rs. 9.00 per share - - - - - - - - (786,416) (786,416) - (786,416)Dividends relating to 2014 paid to non-controlling interests - - - - - - - - - - (95,820) (95,820)Conversion of preference shares / convertible stock into ordinary share capital (2,000,000 ordinary shares of Rs. 10 each) 20,000 355,938 - - - (262,017) - - - 113,921 - 113,921 Non-controlling interests on acquisition of subsidiary - Flexible Packages Convertors (Proprietary) Limited (note - 48) - - - - - - - - - - 711,793 711,793 Equity portion of short term loan from shareholder of the Parent Company (note - 8) - - - - - - - 46,596 - 46,596 - 46,596
Total transactions with owners, recognised directly in equity 20,000 355,938 - - - (262,017) - 46,596 (786,416) (625,899) 615,973 (9,926)
Total comprehensive income for the year ended December 31, 2015 Profit for the year - - - - - - - - 3,300,944 3,300,944 95,714 3,396,658 Other comprehensive income: Remeasurement of retirement benefit asset / liability - net of tax - - - - - - - - (95,327) (95,327) (244) (95,571) Exchange differences on translation of foreign subsidiaries - - (258,812) - - - - - - (258,812) (175,171) (433,983) Other comprehensive income of investments accounted for under equity method - - - - - - (15,131) - - (15,131) - (15,131) Deficit on remeasurement of available for sale financial assets - - - (4,744,022) - - - - - (4,744,022) - (4,744,022)
Total comprehensive (loss) / profit for the year - - (258,812) (4,744,022) - - (15,131) - 3,205,617 (1,812,348) (79,701) (1,892,049)
Balance as on December 31, 2015 883,795 3,588,769 (239,195) 24,479,228 13,810,333 1,309,682 (32,842) 46,596 4,316,773 48,163,139 929,138 49,092,277
The annexed notes 1 to 53 form an integral part of these consolidated financial statements.
Attributable to equity holders of the Parent Company
Exchange Other Equity portion of differences Preference reserves short term loan on translation shares / relating to from shareholder Non - Share Share of foreign Fair value General convertible associates and of the Parent Accumulated controlling Total(Rupees in thousand) capital premium subsidiaries reserve reserve stock reserve joint venture Company profit / (loss) Total interest equity

133
133
ANNUAL REPORT OF PACKAGES LIMITED 2015CONSOLIDATED FINANCIAL STATEMENTS 2015
Towfiq Habib Chinoy Syed Hyder Ali Rizwan Ghani Chairman Chief Executive & Managing Director Director
(Rupees in thousand) Note 2015 2014
Cash flows from operating activities
Cash generated from operations 44 4,101,068 2,411,266 Finance cost paid (930,654) (847,978)Taxes paid (944,637) (681,925)Payments for accumulating compensated absences (23,547) (17,514)Retirement benefits paid (15,329) (13,847)
Net cash generated from operating activities 2,186,901 850,002
Cash flows from investing activities
Fixed capital expenditure (4,294,623) (1,559,739)Investments - net (1,150,164) - Net decrease in long term loans and deposits 12,977 14,323 Proceeds from disposal of property, plant and equipment 102,795 114,294 Dividends received 2,453,208 2,462,191
Net cash (used in) / generated from investing activities (2,875,807) 1,031,069 Cash flows from financing activities
Proceeds from short term loan from shareholder of Parent Company 600,000 (682,809)Repayment of short term loan from shareholder of Parent Company (100,000) - Proceeds from long term finances - secured 1,952,575 - Repayment of long term finances - secured (345,392) - Liabilities against assets subject to finance lease - net (134,445) (3,599)Dividends paid to equity holders of Parent Company (782,731) (671,684)Dividends paid to non-controlling interest (95,820) (62,939)
Net cash generated from / (used in) financing activities 1,094,187 (1,421,031)
Net increase in cash and cash equivalents 405,281 460,040
Cash and cash equivalents at the beginning of the year (1,147,286) (1,607,326)
Cash and cash equivalents at the end of the year 45 (742,005) (1,147,286) The annexed notes 1 to 53 form an integral part of these consolidated financial statements.
CONSOLIDATED CASH FLOW STATEMENTfor the year ended December 31, 2015

134
134
1. Legal status and nature of business
Packages Limited (‘the Parent Company’) and its subsidiaries, DIC Pakistan Limited, Packages Lanka (Private) Limited, Packages Construction (Private) Limited, Anemone Holdings Limited and Flexible Packages Convertors (Proprietary) Limited (together, ‘the Group’) are engaged in the following businesses:
- Packaging: Representing manufacture and sale of packaging materials and tissue products. - Inks: Representing manufacture and sale of finished and semi finished inks. - Construction: Representing all types of construction activities and development of real estate. The Group also holds investment in companies engaged in the manufacture and sale of paper, paperboard and
corrugated boxes, biaxially oriented polypropylene (BOPP) film and cast polypropylene (CPP) film, plastic and companies engaged in insurance business.
The registered office of the Group is situated at 4th Floor, the Forum, Suite No. 416 - 422, G-20, Block 9,
Khayaban-e-Jami, Clifton, Karachi, Pakistan. Head office is located at Shahrah-e-Roomi, P.O. Amer Sidhu, Lahore, Pakistan.
2. Basis of preparation
2.1 The consolidated financial statements have been prepared in accordance with the requirements of the Companies Ordinance, 1984 (‘the Ordinance’) and the approved accounting standards as applicable in Pakistan. Approved accounting standards comprise of such International Financial Reporting Standards (IFRS) issued by the International Accounting Standards Board and Islamic Financial Accounting Standards (IFAS) issued by the Institute of Chartered Accountants of Pakistan as are notified under the Companies Ordinance, 1984, provisions of and directives issued under the Companies Ordinance, 1984. Wherever the requirements of the Companies Ordinance, 1984 or directives issued by Securities and Exchange Commission of Pakistan differ with the requirements of IFRS or IFAS, the requirements of the Companies Ordinance, 1984 or the requirements of the said directives prevail.
2.2 Initial application of standards, amendments or an interpretation to existing standards
The following amendments to existing standards have been published that are applicable to the Group’s financial statements covering annual periods, beginning on or after the following dates:
2.2.1 Amendments to published standards effective in current year
New and amended standards and interpretations mandatory for the first time for the financial year beginning January 01, 2015:
Annual improvements 2012 are applicable for annual periods beginning on or after July 01, 2014. These amendments include changes from the 2010-12 cycle of the annual improvements project, that affect 7 standards: IFRS 2, ‘Share-based payment’, IFRS 3, ‘Business Combinations’, IFRS 8, ‘Operating segments’, IFRS 13, ‘Fair value measurement’, IAS 16, ‘Property, plant and equipment’ and IAS 38, ‘Intangible assets’, Consequential amendments to IFRS 9, ‘Financial instruments’, IAS 37, ‘Provisions, contingent liabilities and contingent assets’, and IAS 39, Financial instruments – Recognition and measurement’. The application of these amendments has no material impact on the Group’s financial statements.
Annual improvements 2013 are applicable for annual periods beginning on or after July 01, 2014. The amendments
include changes from the 2011-13 cycle of the annual improvements project that affect 4 standards: IFRS 1, ‘First time adoption’, IFRS 3, ‘Business combinations’, IFRS 13, ‘Fair value measurement’ and IAS 40, ‘Investment property’. The application of these amendments has no material impact on the Group’s financial statements.
IAS 19 (Amendments), ‘Employee benefits’ is applicable on accounting periods beginning on or after July 01,
2014. These amendments apply to contributions from employees or third parties to defined benefit plans. The objective of the amendments is to simplify the accounting for contributions that are independent of the number
NOTES TO AND FORMING PART OF THE CONSOLIDATED FINANCIAL STATEMENTSfor the year ended December 31, 2015

135
135
ANNUAL REPORT OF PACKAGES LIMITED 2015CONSOLIDATED FINANCIAL STATEMENTS 2015
of years of employee service, for example, employee contributions that are calculated according to a fixed percentage of salary. The application of these amendments has no material impact on the Group’s financial statements.
IFRS 10, ‘Consolidated financial statements’ is applicable on accounting periods beginning on or after January
01, 2015. This standard builds on existing principles by identifying the concept of control as the determining factor in whether an entity should be included within the consolidated financial statements. The standard provides additional guidance to assist in determining control where this is difficult to assess. The application of this standard has no material impact on the Group’s financial statements.
IFRS 11, ‘Joint arrangements’ is applicable on accounting periods beginning on or after January 01, 2015. IFRS
11 is a more realistic reflection of joint arrangements by focusing on the rights and obligations of the parties to the arrangement rather than its legal form. There are two types of joint arrangements: joint operations and joint ventures. Joint operations arise where a joint operator has rights to the assets and obligations relating to the arrangement and therefore accounts for its share of assets, liabilities, revenue and expenses. Joint ventures arise where the joint operator has rights to the net assets of the arrangement and therefore equity accounts for its interest. Proportional consolidation of joint ventures is no longer allowed. The application of this standard has no material impact on the Group’s financial statements.
IFRS 12, ‘Disclosures of interests in other entities’ is applicable on accounting periods beginning on or after
January 01, 2015. This standard includes the disclosure requirements for all forms of interests in other entities, including joint arrangements, associates, special purpose vehicles and other off balance sheet vehicles. The application of this standard has no material impact on the Group’s financial statements.
Amendments to IFRS 10, 11 and 12 on transition guidance are applicable on accounting periods beginning on
or after January 01, 2015. These amendments also provide additional transition relief in IFRS 10, 11 and 12, limiting the requirement to provide adjusted comparative information to only the preceding comparative period. For disclosures related to unconsolidated structured entities, the amendments will remove the requirement to present comparative information for periods before IFRS 12 is first applied. The application of these amendments has no material impact on the Group’s financial statements.
Amendments to IFRS 10, 11 and IAS 27 on consolidation for investment entities. These are applicable on
accounting periods beginning on or after January 01, 2015. These amendments mean that many funds and similar entities will be exempt from consolidating most of their subsidiaries. Instead, they will measure them at fair value through profit or loss. The amendments give an exception to entities that meet an ‘investment entity’ definition and which display particular characteristics. Changes have also been made IFRS 12, ‘Disclosures of interests in other entities’ to introduce disclosures that an investment entity needs to make. The application of these amendments has no material impact on the Group’s financial statements.
IFRS 13, ‘Fair value measurement’ is applicable on accounting periods beginning on or after January 01, 2015.
This standard aims to improve consistency and reduce complexity by providing a precise definition of fair value and a single source of fair value measurement and disclosure requirements for use across IFRS. The requirements, which are largely aligned between IFRS and US GAAP, do not extend the use of fair value accounting but provide guidance on how it should be applied where its use is already required or permitted by other standards within IFRS or US GAAP. The application of this standard has no material impact on the Group’s financial statements expect for certain additional fair value disclosures as provided in note 49.4.
2.2.2 Standards, amendments and interpretations to existing standards that are not yet effective and have not
been early adopted by the Group The following amendments and interpretations to existing standards have been published and are mandatory
for the Group’s accounting periods beginning on or after January 01, 2016 or later periods, but the Group has not early adopted them:

136
136
Annual improvements 2014 are applicable for annual periods beginning on or after January 01, 2016. The amendments include changes from the 2012-14 cycle of the annual improvements project that affect 4 standards: IFRS 5, ‘Non current assets held for sale and discontinued operations’ regarding methods of disposal, IFRS 7, ‘Financial instruments: Disclosures’ with consequential amendments to IFRS 1 regarding servicing contracts, IAS 19, ‘Employee benefits’ regarding discount rates and IAS 34, ‘Interim financial reporting’ regarding disclosure of information. The Group shall apply these amendments from January 01, 2016 and does not expect to have a material impact on its financial statements.
Amendments to IAS 16, ‘Property, plant and equipment’ and IAS 41, ‘Agriculture’, regarding bearer plants
are applicable on accounting periods beginning on or after January 01, 2016. These amendments change the financial reporting for bearer plants, such as grape vines, rubber trees and oil palms. The IASB decided that bearer plants should be accounted for in the same way as property, plant and equipment because their operation is similar to that of manufacturing. Consequently, the amendments include them within the scope of IAS 16 instead of IAS 41. The produce growing on bearer plants will remain within the scope of IAS 41. These amendments do not have a material impact on the Group’s financial statements.
Amendments to IAS 16, ‘Property, plant and equipment’ and IAS 38, ‘Intangible assets’ are applicable on
accounting periods beginning on or after January 01, 2016. IASB has clarified that the use of revenue based methods to calculate the depreciation of an asset is not appropriate because revenue generated by an activity that includes the use of an asset generally reflects factors other than the consumption of the economic benefits embodied in the asset. The IASB has also clarified that revenue is generally presumed to be an inappropriate basis for measuring the consumption of the economic benefits embodied in an intangible asset. The Group shall apply these amendments from January 01, 2016 and does not expect to have a material impact on its financial statements.
IAS 27 (Amendments), ‘Separate financial statements’ are applicable on accounting periods beginning on or
after January 1, 2016. These provide entities the option to use the equity method to account for investments in subsidiaries, joint ventures and associates in their separate financial statements. The Group shall apply these amendments from January 01, 2016 and has not yet evaluated whether it shall change its accounting policy to avail this option.
IFRS 9, ‘Financial instruments’ - classification and measurement is applicable on accounting periods beginning
on or after January 01, 2015. This standard on classification and measurement of financial assets and financial liabilities will replace IAS 39, ‘Financial instruments: Recognition and measurement’. IFRS 9 has two measurement categories: amortised cost and fair value. All equity instruments are measured at fair value. A debt instrument is measured at amortised cost only if the entity is holding it to collect contractual cash flows and the cash flows represent principal and interest. For liabilities, the standard retains most of the requirements of IAS 39 . These include amortised-cost accounting for most financial liabilities, with bifurcation of embedded derivatives. The main change is that, in cases where the fair value option is taken for financial liabilities, the part of a fair value change due to an entity’s own credit risk is recorded in other comprehensive income rather than the income statement, unless this creates an accounting mismatch. This change will mainly affect financial institutions. This IFRS is under consideration of the relevant Committee of the Institute of Chartered Accountants of Pakistan. The Group has yet to assess the impact of these changes on its financial statements.
IFRS 9, ‘Financial instruments’ is applicable on accounting periods beginning on or after January 01, 2018. IASB
has published the complete version of IFRS 9, ‘Financial Instruments’, which replaces the guidance in IAS 39. This final version includes requirements on the classification and measurement of financial assets and liabilities; it also includes an expected credit losses model that replaces the incurred loss impairment model used today. This IFRS is under consideration of the relevant Committee of the Institute of Chartered Accountants of Pakistan. The Group has yet to assess the impact of these changes on its financial statements.
Amendments to IFRS 10, ‘Consolidated financial statements’ and IAS 28, ‘Investments in associates and joint
ventures’ are applicable on accounting periods beginning on or after January 01, 2016. These amendments address an inconsistency between the requirements in IFRS 10 and those in IAS 28 in dealing with the sale

137
137
ANNUAL REPORT OF PACKAGES LIMITED 2015CONSOLIDATED FINANCIAL STATEMENTS 2015
or contribution of assets between an investor and its associate or joint venture. The main consequence of the amendments is that a full gain or loss is recognised when a transaction involves a business, whether it is housed in a subsidiary or not. A partial gain or loss is recognised when a transaction involves assets that do not constitute a business, even if these assets are housed in a subsidiary. The Group shall apply these amendments from January 01, 2016 and does not expect to have a material impact on its financial statements.
Amendments to IFRS 10, ‘Consolidated financial statements’ and IAS 28, ‘Investments in associates and joint
ventures’ are applicable on accounting periods beginning on or after January 01, 2016. These amendments clarify the application of the consolidation exception for investment entities and their subsidiaries. The Group shall apply these amendments from January 01, 2016 and does not expect to have a material impact on its financial statements.
IFRS 11 (Amendment), ‘Joint arrangements’ on acquisition of an interest in a joint operation is applicable on
accounting periods beginning on or after 01 January 2016. This amendment adds new guidance on how to account for the acquisition of an interest in a joint operation that constitutes a business. The amendments specify the appropriate accounting treatment for such acquisitions. The Group shall apply this amendment from January 01, 2016 and does not expect to have a material impact on its financial statements.
IFRS 14, ‘Regulatory deferral accounts’ is applicable on accounting periods beginning on or after January 01,
2016. This standard permits first time adopters to continue to recognise amounts related to rate regulation in accordance with their previous GAAP requirements when they adopt IFRS. However, to enhance comparability with entities that already apply IFRS and do not recognise such amounts, the standard requires that the effect of rate regulation must be presented separately from other items. The Group shall apply this standard from January 01, 2016 and does not expect to have a material impact on its financial statements.
IFRS 15, ‘Revenue from contracts with customers’ is applicable on accounting periods beginning on or after
January 01, 2017. This is a converged standard from the IASB and FASB on revenue recognition. The standard will improve the financial reporting of revenue and improve comparability of the top line in consolidated financial statements globally. The Group shall apply this standard from January 01, 2017 and does not expect to have a material impact on its financial statements.
Amendments to IAS 1, ‘Presentation of consolidated financial statements’ on the disclosure initiative is applicable
on annual periods beginning on or after January 01, 2016, subject to EU endorsement. These amendments are part of the IASB initiative to improve presentation and disclosure in financial reports. The Group has yet to assess the impact of these amendments on its financial statements.
3. Basis of measurement
3.1 These consolidated financial statements have been prepared under the historical cost convention except for revaluation of certain financial instruments at fair value and recognition of certain employee retirement benefits at present value.
3.2 The Group’s significant accounting policies are stated in note 4. Not all of these significant policies require the
management to make difficult, subjective or complex judgments or estimates. The following is intended to provide an understanding of the policies that the management considers critical because of their complexity, judgment and estimation involved in their application and impact on these consolidated financial statements. Judgments and estimates are continually evaluated and are based on historical experience, including expectations of future events that are believed to be reasonable under the circumstances. These judgments involve assumptions or estimates in respect of future events and the actual results may differ from these estimates. The areas involving a higher degree of judgments or complexity or areas where assumptions and estimates are significant to the consolidated financial statements are as follows:
i) Estimated useful life of property, plant and equipment - note 4.3 ii) Provision for employees’ retirement benefits - note 4.10 & 11 iii) Provision for tax - note 38

138
138
4. Significant accounting policies
The significant accounting policies adopted in the preparation of these consolidated financial statements are set out below. These policies have been consistently applied to all the years presented, unless otherwise stated.
4.1 Principles of consolidation and equity accounting
a) Subsidiaries
Subsidiaries are all entities (including structured entities) over which the Group has control. The Group controls an entity when the Group is exposed to, or has rights to, variable returns from its involvement with the entity and has the ability to affect those returns through its power to direct the activities of the entity. Subsidiaries are fully consolidated from the date on which control is transferred to the Group. They are deconsolidated from the date that control ceases.
The acquisition method of accounting is used to account for business combinations by the Group (refer to note
4.7).
Intercompany transactions, balances and unrealised gains on transactions between group companies are eliminated. Unrealised losses are also eliminated unless the transaction provides evidence of an impairment of the transferred asset. Accounting policies of subsidiaries have been changed where necessary to ensure consistency with the policies adopted by the Group.
Non-controlling interests in the results and equity of subsidiaries are shown separately in the consolidated
profit and loss account, consolidated statement of comprehensive income, consolidated statement of changes in equity and consolidated balance sheet respectively.
b) Associates
Associates are all entities over which the Group has significant influence but not control or joint control. This is generally the case where the Group holds between 20% and 50% of the voting rights. Investments in associates are accounted for using the equity method of accounting (refer to note 4.1 (d)), after initially being recognised at cost.
c) Joint arrangements
Under IFRS 11, ‘Joint Arrangements’, investments in joint arrangements are classified as either joint operations or joint ventures. The classification depends on the contractual rights and obligations of each investor, rather than the legal structure of the joint arrangement. The Group has investments in joint ventures.
Joint ventures
Interests in joint ventures are accounted for using the equity method (refer to note 4.1 (d)), after initially being recognised at cost in the consolidated balance sheet.
d) Equity method
Under the equity method of accounting, the investments are initially recognised at cost and adjusted thereafter to recognise the Group’s share of the post-acquisition profits or losses of the investee in the consolidated profit and loss account, and the Group’s share of movements in other comprehensive income of the investee in consolidated other comprehensive income. Dividends received or receivable from associates and joint ventures are recognised as a reduction in the carrying amount of the investment. When the Group’s share of losses in an equity-accounted investment equals or exceeds its interest in the entity, including any other unsecured long term receivables, the Group does not recognise further losses, unless it has incurred obligations or made payments on behalf of the other entity.
Unrealised gains on transactions between the Group and its associates and joint ventures are eliminated to the extent of the Group’s interest in these entities. Unrealised losses are also eliminated unless the transaction provides evidence of an impairment of the asset transferred. Accounting policies of equity accounted investees have been changed where necessary to ensure consistency with the policies adopted by the Group.

139
139
ANNUAL REPORT OF PACKAGES LIMITED 2015CONSOLIDATED FINANCIAL STATEMENTS 2015
The Group determines at each reporting date whether there is any objective evidence that the investment in the associate is impaired. If this is the case, the Group calculates the amount of impairment as the difference between the recoverable amount of the associate and its carrying value and recognises the amount adjacent to share of profit / (loss) of associates in the consolidated profit and loss account.
e) Changes in ownership interests
The Group treats transactions with non-controlling interests that do not result in a loss of control as transactions with equity owners of the Group. A change in ownership interest results in an adjustment between the carrying amounts of the controlling and non-controlling interests to reflect their relative interests in the subsidiary. Any difference between the amount of the adjustment to non-controlling interests and any consideration paid or received is recognised in a separate reserve within equity attributable to owners of the Group.
When the Group ceases to consolidate or equity account for an investment because of a loss of control, joint
control or significant influence, any retained interest in the entity is remeasured to its fair value with the change in carrying amount recognised in the consolidated profit and loss account. This fair value becomes the initial carrying amount for the purposes of subsequently accounting for the retained interest as an associate, joint venture or financial asset. In addition, any amounts previously recognised in other comprehensive income in respect of that entity are accounted for as if the group had directly disposed of the related assets or liabilities. This may mean that amounts previously recognised in other comprehensive income are reclassified to the consolidated profit and loss account.
If the ownership interest in a joint venture or an associate is reduced but joint control or significant influence is
retained, only a proportionate share of the amounts previously recognised in other comprehensive income are reclassified to the consolidated profit and loss account where appropriate.
4.2 Tax
Current
Provision of current tax is based on the taxable income for the year determined in accordance with the prevailing law for taxation of income. The charge for current tax is calculated using prevailing tax rates or tax rates expected to apply to the profit for the year, if enacted. The charge for current tax also includes adjustments, where considered necessary, to provision for tax made in previous years arising from assessments framed during the year for such years.
Deferred
Deferred tax is accounted for using the balance sheet liability method in respect of all temporary differences arising from differences between the carrying amount of assets and liabilities in the consolidated financial statements and the corresponding tax bases used in the computation of the taxable profit. Deferred tax liabilities are generally recognised for all taxable temporary differences and deferred tax assets are recognised to the extent that it is probable that taxable profits shall be available against which the deductible temporary differences, unused tax losses and tax credits can be utilised.
Deferred tax is calculated at the rates that are expected to apply to the period when the differences reverse
based on tax rates that have been enacted or substantively enacted by the balance sheet date. Deferred tax is charged or credited in the consolidated profit and loss account, except in the case of items credited or charged to equity in which case it is included in equity.
4.3 Property, plant and equipment
Property, plant and equipment, except freehold land, are stated at cost less accumulated depreciation and any identified impairment loss. Freehold land is stated at cost less any identified impairment loss. Cost in relation to certain plant and machinery signifies historical cost, gains and losses transferred from equity on qualifying cash flow hedges as referred to in note 4.17 and borrowing costs as referred to in note 4.18.

140
140
Asset subject to finance lease are initially recognised at the lower of present value of minimum lease payments under the lease agreements and the fair value of the assets. Subsequently these assets are stated at cost less accumulated depreciation and any identified impairment loss.
Depreciation on all property, plant and equipment is charged to profit on the straight-line method so as to write
off the depreciable amount of an asset over its estimated useful life at the following annual rates: - Buildings 2.5% to 20% - Plant and machinery 6.25% to 33.33% - Other equipments 10% to 33.33% - Furniture and fixtures 10% to 20% - Vehicles 20% The assets’ residual values and useful lives are reviewed, at each financial year end, and adjusted if impact on
depreciation is significant. The Group’s estimate of the residual value of its property, plant and equipment as at December 31, 2015 has not required any adjustment as its impact is considered insignificant.
Depreciation on additions to property, plant and equipment is charged from the month in which an asset is
acquired or capitalised while no depreciation is charged for the month in which the asset is disposed off. The Group assesses at each balance sheet date whether there is any indication that property, plant and
equipment may be impaired. If such indication exists, the carrying amounts of such assets are reviewed to assess whether they are recorded in excess of their recoverable amount. Where carrying amounts exceed the respective recoverable amount, assets are written down to their recoverable amounts and the resulting impairment loss is recognised in consolidated profit and loss account. The recoverable amount is the higher of an asset’s fair value less costs to sell and value in use. Where an impairment loss is recognised, the depreciation charge is adjusted in the future periods to allocate the asset’s revised carrying amount over its estimated useful life.
Subsequent costs are included in the asset’s carrying amount or recognised as a separate asset, as appropriate,
only when it is probable that future economic benefits associated with the item shall flow to the Group and the cost of the item can be measured reliably. All other repair and maintenance costs are charged to consolidated profit and loss account during the period in which they are incurred.
The gain or loss on disposal or retirement of an asset represented by the difference between the sale proceeds
and the carrying amount of the asset is recognised as an income or expense. Capital work-in-progress is stated at cost less any identified impairment loss. 4.4 Investment property
Property not held for own use or for sale in the ordinary course of business is classified as investment property. The investment property of the Group comprises land and buildings and is valued using the cost method i.e. at cost less any accumulated depreciation and any identified impairment loss. Land and building under construction is classified as investment property under development and carried at cost less any identified impairment losses.
Depreciation on buildings is charged to profit on the straight line method so as to write off the depreciable amount
of building over its estimated useful life at the rates ranging from 3.33% to 6.67% per annum. Depreciation on additions to investment property is charged from the month in which a property is acquired or capitalised while no depreciation is charged for the month in which the property is disposed off.
The assets’ residual values and useful lives are reviewed, at each financial year end, and adjusted if impact on
depreciation is significant. The Group’s estimate of the residual value of its investment property as at December 31, 2015 has not required any adjustment as its impact is considered insignificant.

141
141
ANNUAL REPORT OF PACKAGES LIMITED 2015CONSOLIDATED FINANCIAL STATEMENTS 2015
The Group assesses at each balance sheet date whether there is any indication that investment property may be impaired. If such indication exists, the carrying amounts of such assets are reviewed to assess whether they are recorded in excess of their recoverable amount. Where carrying amounts exceed the respective recoverable amount, assets are written down to their recoverable amount and the resulting impairment loss is recognised in consolidated profit and loss account. The recoverable amount is the higher of an asset’s fair value less costs to sell and value in use. Where an impairment loss is recognised, the depreciation charge is adjusted in the future periods to allocate the asset’s revised carrying amount over its estimated useful life.
The gain or loss on disposal or retirement of an asset represented by the difference between the sale proceeds
and the carrying amount of the asset is recognised as an income or expense. 4.5 Intangible assets
Expenditure incurred to acquire computer software and SAP Enterprise Resource Planning (ERP) system are capitalised as intangible assets and stated at cost less accumulated amortisation and any identified impairment loss. Intangible assets are amortised using the straight line method over a period of three to five years.
Development costs are recognised as intangible assets when the following criteria are met: - it is technically feasible to complete the intangible asset so that it will be available for use; - management intends to complete the intangible asset and use or sell it; - there is an ability to use or sell the intangible asset; - it can be demonstrated how the intangible asset will generate probable future economic benefits; - adequate technical, financial and other resources to complete the development and to use or sell the intangible asset are available; and - the expenditure attributable to the intangible asset during its development can be reliably measured. Other development expenditures that do not meet these criteria are recognised as an expense as incurred.
Development costs previously recognised as an expense are not recognised as an asset in a subsequent period. Amortisation on additions to intangible assets is charged from the month in which an asset is acquired or
capitalised while no amortisation is charged for the month in which the asset is disposed off. The Group assesses at each balance sheet date whether there is any indication that intangible assets may be
impaired. If such indication exists, the carrying amounts of such assets are reviewed to assess whether they are recorded in excess of their recoverable amount. Where carrying amounts exceed the respective recoverable amount, assets are written down to their recoverable amounts and the resulting impairment loss is recognised in consolidated profit and loss account. The recoverable amount is the higher of an asset’s fair value less costs to sell and value in use. Where an impairment loss is recognised, the amortisation charge is adjusted in the future periods to allocate the asset’s revised carrying amount over its estimated useful life.
4.6 Leases
(1) The Group is the lessee:
Finance leases
Leases where the Group has substantially all the risks and rewards of ownership are classified as finance leases.
The related rental obligations, net of finance charges, are included in liabilities against assets subject to finance lease. The liabilities are classified as current and long term depending upon the timing of the payment.
Each lease payment is allocated between the liability and finance charges so as to achieve a constant rate on the
balance outstanding. The interest element of the rental is charged to profit over the lease term.

142
142
Operating leases
Leases where a significant portion of the risks and rewards of ownership are retained by the lessor are classified as operating leases. Payments made under operating leases (net of any incentives received from the lessor) are charged to profit on a straight-line basis over the lease / Ijarah term unless another systematic basis is representative of the time pattern of the Group’s benefit.
(2) The Group is the lessor:
Operating leases
Assets leased out under operating leases are included in investment property as referred to in note 18. They are depreciated over their expected useful lives on a basis consistent with similar owned property, plant and equipment. Rental income (net of any incentives given to lessees) is recognised on a straight-line basis over the lease term.
4.7 Business combinations
The acquisition method of accounting is used to account for all business combinations, regardless of whether equity instruments or other assets are acquired. The consideration transferred for the acquisition of a subsidiary comprises the following:
- fair values of the assets transferred; - liabilities incurred to the former owners of the acquired business; - equity interests issued by the Group; - fair value of any asset or liability resulting from a contingent consideration arrangement; and - fair value of any pre-existing equity interest in the subsidiary. Identifiable assets acquired and liabilities and contingent liabilities assumed in a business combination are,
with limited exceptions, measured initially at their fair values at the acquisition date. The Group recognises any non-controlling interest in the acquired entity on an acquisition-by-acquisition basis either at fair value or at the non-controlling interest’s proportionate share of the acquired entity’s net identifiable assets.
Acquisition-related costs are expensed as incurred.
The excess of the:
- consideration transferred, - amount of any non-controlling interest in the acquired entity, and - acquisition-date fair value of any previous equity interest in the acquired entity over the fair value of the net identifiable assets acquired is recorded as goodwill. If those amounts are less than
the fair value of the net identifiable assets of the subsidiary acquired, the difference is recognised directly in the consolidated profit and loss account as a bargain purchase.
Where settlement of any part of cash consideration is deferred, the amounts payable in the future are discounted
to their present value as at the date of exchange. The discount rate used is the entity’s incremental borrowing rate, being the rate at which a similar borrowing could be obtained from an independent financier under comparable terms and conditions.
Contingent consideration is classified either as equity or a financial liability. Amounts classified as a financial
liability are subsequently remeasured to fair value with changes in fair value recognised in the consolidated profit and loss account .
If the business combination is achieved in stages, the acquisition date carrying value of the acquirer’s previously
held equity interest in the acquire is remeasured to fair value at the acquisition date. Any gains or losses arising from such remeasurement are recognised in the consolidated profit and loss account .

143
143
ANNUAL REPORT OF PACKAGES LIMITED 2015CONSOLIDATED FINANCIAL STATEMENTS 2015
4.8 Goodwill
Goodwill on acquisitions of subsidiaries is included in ‘intangible assets’. Goodwill on acquisitions of associates and joint ventures is included in ‘investments in associates’ and ‘investments in joint ventures’ respectively and is tested for impairment as part of the overall balance. Separately recognised goodwill is tested annually for impairment and carried at cost less accumulated impairment losses. Impairment losses on goodwill are not reversed. Gains and losses on the disposal of an entity include the carrying amount of goodwill relating to the entity sold.
4.9 Investments
Investments intended to be held for less than twelve months from the balance sheet date or to be sold to raise operating capital, are included in current assets, all other investments are classified as non-current. Management determines the appropriate classification of its investments at the time of the purchase and re-evaluates such designation on a regular basis.
Investments in equity instruments of associates and joint ventures
Investments in equity instruments of associates and joint ventures are accounted for using the equity method of accounting as referred to in note 4.1 (d).
Other investments
Other investments made by the Group are classified for the purpose of measurement into the following categories:
Held to maturity
Investments with fixed maturity that the management has the intent and ability to hold to maturity are classified as held to maturity and are initially measured at cost and at subsequent reporting dates measured at amortised cost using the effective yield method.
Available for sale
The financial assets including investments in associated undertakings where the Group does not have significant influence that are intended to be held for an indefinite period of time or may be sold in response to the need for liquidity are classified as available for sale.
Investments classified as available for sale are initially measured at cost, being the fair value of consideration
given. At subsequent reporting dates, these investments are remeasured at fair value. Changes in fair value of ‘available for sale’ investments are recognised in other comprehensive income until derecognised or impaired, when the accumulated fair value adjustments, recognised in other comprehensive income are transferred to the consolidated profit and loss account.
All purchases and sales of investments are recognised on the trade date which is the date that the Group
commits to purchase or sell the investment. Cost of purchase includes transaction cost. At each balance sheet date, the Group reviews the carrying amounts of the investments to assess whether there
is any indication that such investments have suffered an impairment loss. If any such indication exists, the recoverable amount is estimated in order to determine the extent of the impairment loss, if any. Impairment losses are recognised as expense in the consolidated profit and loss account. In respect of ‘available for sale’ financial assets, cumulative impairment loss less any impairment loss on that financial asset previously recognised in consolidated profit and loss account, is removed from equity and recognised in the consolidated profit and loss account. Impairment losses recognised in the consolidated profit and loss account on equity instruments are not reversed through the consolidated profit and loss account.

144
144
4.10 Employee retirement benefits
The main features of the schemes operated by the Group for its employees are as follows: 4.10.1 Defined benefit plans
(a) Gratuity plan
There is an approved funded defined benefit gratuity plan for employees of the Parent Company. Monthly contributions are made to this fund on the basis of actuarial recommendations at the rate of 4.5 percent per annum of basic salaries. The latest actuarial valuation for the gratuity scheme was carried out as at December 31, 2015. The actual return on plan assets during the year was Rs. 29.8 million. The actual return on plan assets represent the difference between the fair value of plan assets at the beginning of the year and end of the year adjustments for contributions made by the Group as reduced by benefits paid during the year.
The future contribution rates of these plans include allowances for deficit and surplus. Projected unit credit
method, using the following significant assumptions, is used for valuation of this scheme: Discount rate 9.0 percent per annum; Expected rate of increase in salary level 8.0 percent per annum; Expected mortality rate SLIC (2001-2005) mortality table with one year setback; and Expected rate of return 9.0 percent per annum
Plan assets include long term government bonds, equity instruments of listed companies, units of mutual funds, izafa certificates and term deposit with banks. Return on government bonds and debt is at fixed rates, however, due to increased volatility of share prices in recent months, there is no clear indication of return on equity shares, therefore, it has been assumed that the yield on equity shares would match the return on debt.
The Parent Company is expected to contribute Rs. 16.926 million to the gratuity fund in the next financial
year.
Actuarial gains and losses arising from experience adjustments and changes in actuarial assumptions are charged or credited to equity in other comprehensive income in the period in which they arise. Past service costs are recognized immediately in income.
(b) Pension plan
All the management and executive staff participates in the pension plan of the Parent Company. On December 26, 2012, the Board of Trustees of the pension plan of the Parent Company decided to convert the Defined Benefit Plan to Defined Contribution Plan for all its active employees with effect from January 01, 2013 with no impact on the pensioners appearing on the pensioners’ list as of that date. The proposed scheme was approved for implementation by the Commissioner Inland Revenue on February 22, 2013 and employees consent to the proposed scheme was sought and obtained.
Consequently, the pension plan / fund currently operates two different plans for its employees:
- Defined contribution plan for all active employees; and - Defined benefit plan for pensioners who have retired before December 31, 2012
In respect of the defined contribution plan, the Parent Company contributes 20% of members’ monthly salary to the scheme; whereas, an employee may or may not opt to contribute 6% of his monthly salary to the scheme.
The obligation in respect of the defined benefit plan is determined by the Fund’s Actuary at each year end. Any
funding gap identified by the Fund’s Actuary is paid by the Group from time to time. The last actuarial valuation was carried out as at December 31, 2015.
Discount rate 9.0 percent per annum; Expected rate of increase in pension level 4.0 percent per annum; Expected mortality rate SLIC (2001-2005) mortality table with one year setback; and Expected rate of return 9.0 percent per annum

145
145
ANNUAL REPORT OF PACKAGES LIMITED 2015CONSOLIDATED FINANCIAL STATEMENTS 2015
Plan assets include long term government bonds, equity instruments of listed companies, units of mutual funds, term finance certificates, izafa certificates and term deposit with banks. Return on government bonds and debt is at fixed rates, however, due to increased volatility of share prices in recent months, there is no clear indication of return on equity shares, therefore, it has been assumed that the yield on equity shares would match the return on debt.
Actuarial gains and losses arising from experience adjustments and changes in actuarial assumptions for the
defined benefit plan are charged or credited to equity in other comprehensive income in the period in which they arise. Past service costs are recognized immediately in income.
Pension plan is a multi-employer plan formed by the Group in collaboration with Tri Pack Films Limited. The
Parent Company reports its proportionate share of the plan’s commitments, managed assets and costs, after deducting share of Tri Pack Films Limited, in accordance with guidance provided by IAS 19 - Employee Benefits, regarding defined benefit plans
(c) Accumulating compensated absences
The Group provides for accumulating compensated absences when the employees render services that increase their entitlement to future compensated absences. The executives and workers are entitled to earned annual leaves and medical leaves on the basis of their service with the Group. The annual leaves can be encashed at the time the employee leaves the Group on the basis of gross salary while no encashment is available for medical leaves.
The Group uses the valuation performed by an independent actuary as the present value of its accumulating
compensated absences. Projected unit credit method, using the following significant assumptions, has been used for valuation of
accumulating compensated absences:
Discount rate 9.0 percent per annum; Expected rate of increase in salary level 8.0 percent per annum; and Expected mortality rate SLIC (2001-2005) mortality table with one year setback
4.10.2 Defined contribution plan
There is an approved contributory provident fund for all employees. Equal monthly contributions at the rate of 10.0 percent per annum of basic salaries are made by the Group and the employees to the fund. The nature of contributory pension fund has been explained in note 4.10.1 (b) above.
Retirement benefits are payable to staff on completion of prescribed qualifying period of service under these
schemes. 4.11 Stores and spares
Stores and spares are valued at moving average cost, while items considered obsolete are carried at nil value. Items in transit are valued at cost comprising invoice value plus other charges paid thereon.
Provision is made in the consolidated financial statements for obsolete and slow moving stores and spares based
on management estimate. 4.12 Stock-in-trade
Stock of raw materials, except for those in transit, work-in-process and finished goods are valued principally at the lower of cost and net realisable value. Cost of raw materials is determined using the weighted average cost method. Cost of work-in-process and finished goods comprises direct production costs such as raw materials, consumables and labor as well as production overheads such as employee wages, depreciation, maintenance, etc. The production overheads are measured based on a standard cost method, which is reviewed regularly to ensure relevant measures of utilisation, production lead time etc.

146
146
Materials in transit are stated at cost comprising invoice value plus other charges paid thereon.
Stock held for resale is stated at the lower of cost comprising invoice value plus other charges paid thereon and net realisable value.
If the expected sales price less completion costs and costs to execute sales (net realisable value) is lower than
the carrying amount, a write-down is recognised for the amount by which the carrying amount exceeds its net realisable value. Provision is made in the consolidated financial statements for obsolete and slow moving stock in trade based on management estimate.
4.13 Financial instruments
Financial assets and financial liabilities are recognised at the time when the Group becomes a party to the contractual provisions of the instrument and derecognised when the Group loses control of contractual rights that comprise the financial assets and in the case of financial liabilities when the obligation specified in the contract is discharged, cancelled or expired. Any gain or loss on derecognition of financial assets and financial liabilities is included in the consolidated profit and loss account for the year.
Financial instruments carried on the balance sheet include loans, investments, trade and other debts, cash and
bank balances, borrowings, trade and other payables, accrued expenses and unclaimed dividends. All financial assets and liabilities are initially measured at cost, which is the fair value of consideration given and received respectively. These financial assets and liabilities are subsequently measured at fair value or cost as the case may be. The particular recognition methods adopted are disclosed in the individual policy statements associated with each item.
4.14 Offsetting of financial assets and liabilities
Financial assets and liabilities are offset and the net amount is reported in the consolidated financial statements only when there is a legally enforceable right to set off the recognised amount and the Group intends either to settle on a net basis or to realise the assets and to settle the liabilities simultaneously.
4.15 Trade debts
Trade debts are amounts due from customers for merchandise sold or services performed in the ordinary course of business. If collection is expected in one year or less (or in the normal operating cycle of the business, if longer), they are classified as current assets. If not, they are presented as non-current assets.
Trade debts are recognized initially at fair value and subsequently measured at amortised cost using the effective
interest method, less an estimate made for doubtful debts based on a review of all outstanding amounts at the year end. Bad debts are written off when identified.
4.16 Cash and cash equivalents
Cash and cash equivalents are carried in the balance sheet at cost. For the purpose of cash flow statement, cash and cash equivalents comprise cash in hand, demand deposits, other short term highly liquid investments that are readily convertible to known amounts of cash and which are subject to an insignificant risk of change in value and finances under mark up arrangements. In the balance sheet, finances under mark up arrangements are included in current liabilities.
4.17 Non-current assets / disposal group held-for-sale
Non-current assets are classified as assets held-for-sale when their carrying amount is to be recovered principally through a sale transaction and a sale is considered highly probable. They are stated at the lower of carrying amount and fair value less cost to sell.
4.18 Borrowings
Borrowings are recognised initially at fair value (proceeds received), net of transaction costs incurred. Borrowings are subsequently carried at amortised cost; any difference between the proceeds (net of transaction costs) and the redemption value is recognised in the income statement over the period of the borrowings using the effective interest method.

147
147
ANNUAL REPORT OF PACKAGES LIMITED 2015CONSOLIDATED FINANCIAL STATEMENTS 2015
Fees paid on the establishment of loan facilities are recognised as transaction costs of the loan to the extent that it is probable that some or all of the facility will be drawn down. In this case, the fee is deferred until the draw-down occurs. To the extent there is no evidence that it is probable that some or all of the facility will be drawn down, the fee is capitalised as a prepayment for liquidity services and amortised over the period of the facility to which it relates.
Finance costs are accounted for on an accrual basis and are shown as accrued finance cost to the extent of the
amount remaining unpaid. 4.19 Trade and other payables
Trade payables are obligations to pay for goods or services that have been acquired in the ordinary course of business from suppliers. Accounts payable are classified as current liabilities if payment is due within one year or less (or in the normal operating cycle of the business, if longer). If not, they are presented as non-current liabilities.
Liabilities for creditors and other costs payable are initially recognised at cost which is the fair value of the
consideration to be paid in future for goods and/ or services, whether or not billed to the Group and subsequently measured at amortised cost using the effective interest method.
4.20 Derivative financial instruments
These are initially recorded at cost on the date a derivative contract is entered into and are remeasured to fair value at subsequent reporting dates. The method of recognising the resulting gain or loss depends on whether the derivative is designated as a hedging instrument, and if so, the nature of the item being hedged. The Group designates certain derivatives as cash flow hedges.
The Group documents at the inception of the transaction the relationship between the hedging instruments and
hedged items, as well as its risk management objective and strategy for undertaking various hedge transactions. The Group also documents its assessment, both at hedge inception and on an on-going basis, of whether the derivatives that are used in hedging transactions are highly effective in offsetting changes in cash flow of hedged items.
The effective portion of changes in the fair value of derivatives that are designated and qualify as cash flow
hedges are recognised in statement of other comprehensive income. The gain or loss relating to the ineffective portion is recognised immediately in the consolidated profit and loss account.
Amounts accumulated in equity are recognised in consolidated profit and loss account in the periods when the
hedged item shall effect profit or loss. However, when the forecast hedged transaction results in the recognition of a non-financial asset or liability, the gains and losses previously deferred in equity are transferred from equity and included in the initial measurement of the cost of the asset or liability.
4.21 Revenue recognition
Revenue is recognised on dispatch of goods or on the performance of services. Return on deposits is accrued on a time proportion basis by reference to the principal outstanding and the
applicable rate of return. Dividend income and entitlement of bonus shares are recognised when right to receive such dividend and bonus
shares is established. 4.22 Foreign currency transactions and translation
Foreign currency transactions are translated into Pak Rupees using the exchange rates prevailing at the dates of the transactions. All monetary assets and liabilities in foreign currencies are translated into Pak Rupees at the rates of exchange prevailing at the balance sheet date. Foreign exchange gains and losses on translation are recognised in the consolidated profit and loss account. All non-monetary items are translated into Pak Rupees
148
148
at exchange rates prevailing on the date of transaction or on the date when fair values are determined. Foreign exchange gains and losses are recognised in the consolidated profit and loss account except in case of items recognised in other comprehensive income or equity in which case it is included in other comprehensive income or equity respectively.
The results and financial position of all the group entities (none of which has the currency of a hyper-inflationary
economy) that have a functional currency different from the presentation currency are translated into the presentation currency as follows:
(a) assets and liabilities for each balance sheet item presented are translated at the closing rate at the date of
that balance sheet; (b) income and expenses for each item of consolidated profit and loss account are translated at average
exchange rates (unless this average is not a reasonable approximation of the cumulative effect of the rates prevailing on the transaction dates, in which case income and expenses are translated at the rate on the dates of the transactions); and
(c) all resulting exchange differences are recognised in other comprehensive income.
Goodwill and fair value adjustments arising on the acquisition of a foreign entity are treated as assets and liabilities of the foreign entity and translated at the closing rate. Exchange differences arising are recognised in other comprehensive income.
The consolidated financial statements are presented in Pak Rupees, which is the Group’s functional and
presentation currency. 4.23 Borrowing costs
General and specific borrowing costs directly attributable to the acquisition, construction or production of qualifying assets, which are assets that necessarily take a substantial period of time to get ready for their intended use or sale, are added to the cost of those assets, until such time as the assets are substantially ready for their intended use or sale.
Investment income earned on the temporary investment of specific borrowings pending their expenditure on
qualifying assets is deducted from the borrowing costs eligible for capitalisation. All other borrowing / finance costs are recognised in consolidated profit and loss account in the period in which
they are incurred. 4.24 Dividend
Dividend distribution to the Group’s shareholders is recognised as a liability in the period in which the dividends are approved.
4.25 Compound financial instruments
Compound financial instruments issued by the Group represent preference shares / convertible stock that can be converted into ordinary shares or can be settled in cash.
The liability component of a compound financial instrument is recognised initially at the fair value of a similar
liability that does not have an equity conversion option. The equity component is recognised initially at the difference between the fair value of the compound financial instrument as a whole and the fair value of the liability component. Any directly attributable transaction costs are allocated to the liability and equity components in proportion to their initial carrying amounts.
Subsequent to initial recognition, the liability component of a compound financial instrument is measured at
amortised cost using the effective interest method. The equity component of a compound financial instrument is not remeasured subsequent to initial recognition.

149
149
ANNUAL REPORT OF PACKAGES LIMITED 2015CONSOLIDATED FINANCIAL STATEMENTS 2015
4.26 Segment reporting
Operating segments are reported in a manner consistent with the internal reporting provided to the chief operating decision-maker. The chief operating decision-maker, who is responsible for allocating resources and assessing performance of the operating segments, has been identified as the Board of Directors of the Parent Company.
4.27 Provisions
Provisions for environmental restoration, restructuring costs and legal claims are recognised when: (i) the Group has a present legal or constructive obligation as a result of past events;
(ii) it is probable that an outflow of resources shall be required to settle the obligation; and
(iii) the amount has been reliably estimated
Restructuring provisions include lease termination penalties and employee termination payments and such
other costs that are necessarily entailed by the restructuring and not associated with on-going activities of the Group. Provisions are not recognised for future operating losses.
Where there are a number of similar obligations, the likelihood that an outflow shall be required in settlement is
determined by considering the class of obligations as a whole. A provision is recognised even if the likelihood of an outflow with respect to any one item included in the same class of obligations may be small.
Provisions are measured at the present value of the expenditures expected to be required to settle the obligation
using a pre-tax rate that reflects current market assessments of the time value of money and the risks specific to the obligation. The increase in the provision due to passage of time is recognised as interest expense.
5. Issued, subscribed and paid up capital
2015 2014 2015 2014 (Number of shares) (Rupees in thousand)
Ordinary shares of Rs. 10 each as at the beginning of the year 33,603,295 33,603,295 - fully paid in cash 336,033 336,033 148,780 148,780 - fully paid for consideration other than cash 1,488 1,488 - fully paid against conversion of preference 2,000,000 - shares / convertible stock 20,000 - 50,627,429 50,627,429 - fully paid bonus shares 506,274 506,274
86,379,504 84,379,504 863,795 843,795
Issuance of shares upon conversion of 2,000,000 2,000,000 preference shares / convertible stock - note 5.1 20,000 20,000
Ordinary shares of Rs. 10 each as at the end of the year 33,603,295 33,603,295 - fully paid in cash 336,033 336,033 148,780 148,780 - fully paid for consideration other than cash 1,488 1,488 - fully paid against conversion of preference 4,000,000 2,000,000 shares / convertible stock 40,000 20,000 50,627,429 50,627,429 - fully paid bonus shares 506,274 506,274
88,379,504 86,379,504 883,795 863,795
5.1 Under the terms of redemption / conversion of preference shares / convertible stock mentioned in note 7.2, the Parent Company, during the year converted 2,000,000 (2014: 2,000,000) preference shares / convertible stock of Rs. 190 each held by International Finance Corporation, Washington D.C, USA (‘IFC’) into 2,000,000 (2014: 2,000,000) fully paid ordinary shares of Rs. 10 each.

150
150
5.2 21,522,101 (2014: 21,133,101) ordinary shares of the Parent Company are held by IGI Insurance Limited, an associate.
(Rupees in thousand) Note 2015 2014
6. Reserves
Movement in and composition of consolidated reserves is as follows:
Capital Share premium
At the beginning of the year 3,232,831 2,876,893 Conversion of preference shares / convertible stock 6.1 355,938 355,938
6.2 3,588,769 3,232,831
Exchange difference on translation of foreign subsidiaries
At the beginning of the year 19,617 42,784 Exchange difference for the year (258,812) (23,167)
(239,195) 19,617 Fair value reserve
At the beginning of the year 29,223,250 23,566,916 Fair value (loss) / gain during the year (4,744,022) 5,656,334
6.3 24,479,228 29,223,250
27,828,802 32,475,698 Revenue General reserve
At the beginning of the year 12,310,333 11,610,333 Transferred from consolidated profit and loss account 1,500,000 700,000
13,810,333 12,310,333 Other reserves relating to associates and joint ventures
At the beginning of the year (26,708) (29,109) Share of other reserves of investments accounted for under equity method 8,997 - Other comprehensive (loss) / income during the year (15,131) 2,401
(32,842) (26,708)
13,777,491 12,283,625
41,606,293 44,759,323
6.1 This represents share premium at the rate of Rs. 177.97 (2014: Rs. 177.97) per share in respect of the transaction referred to in note 5.1 above.
6.2 This reserve can be utilised by the Group only for the purposes specified in section 83(2) of the Companies
Ordinance, 1984. 6.3 As referred to in note 4.9, this represents the unrealised gain on remeasurement of investments at fair value and
is not available for distribution. This shall be transferred to consolidated profit and loss account on derecognition of investments.

151
151
ANNUAL REPORT OF PACKAGES LIMITED 2015CONSOLIDATED FINANCIAL STATEMENTS 2015
(Rupees in thousand) Note 2015 2014
7. Long term finances
These are composed of: Local currency loans - secured Term finance loan 7.1.1 100,000 300,000 Long term finance facility 7.1.2 2,000,000 2,000,000 Term loan 7.1.3 188,991 266,695 Term finance facility 7.1.4 985,950 -
3,274,941 2,566,695 Foreign currency loan - secured 7.2 921,360 -
4,196,301 2,566,695 Preference shares / convertible stock - unsecured 7.3 2,014,895 2,128,815
6,211,196 4,695,510 Current portion shown under current liabilities 13 Term finance loan (100,000) (200,000) Long term finance facility (285,714) - Term loan (62,997) (66,674)
(448,711) (266,674)
5,762,485 4,428,836 7.1 Local currency loans - secured
7.1.1 Term finance loan
During the current year, the Group has made a repayment of Rs. 200 million towards the term finance loan availed from Bank Al-Habib Limited. This loan is secured by a pari passu charge of Rs. 1,273 million (2014: Rs. 1,273 million) over present and future fixed assets of the Group located at Lahore excluding land and buildings. It carries mark up at the rate of six months Karachi Inter Bank Offer Rate (‘KIBOR’) plus 0.2 percent per annum to six months KIBOR plus 0.65 percent per annum (2014: KIBOR plus 0.65 percent per annum). The balance is repayable on May 19, 2016. The effective mark up charged during the year ranges from 7.20 percent to 10.82 percent per annum (2014: 9.81 percent to 10.82 percent per annum).
7.1.2 Long term finance facility
This loan has been obtained from Meezan Bank Limited under the Islamic mode of finance as a Musharika. It is secured by a pari passu charge over all present and future fixed assets of the Group located at Lahore and Kasur excluding land and building located at Lahore amounting to Rs. 2,500 million. It carries mark up at six months KIBOR plus 0.25 percent per annum (2014: six months KIBOR plus 0.65 percent per annum) and is payable in 7 equal semi-annual installments starting on December 28, 2016 and ending on December 28, 2019. The effective mark up charged during the year ranges from 7.26 percent to 9.89 percent per annum (2014: 10.81 percent to 10.82 percent per annum).
7.1.3 Term loan
Term loan has been obtained from MCB Bank Limited Sri Lanka and is repayable over seven years including two years grace period.
7.1.4 Term finance facility
During the year, the Group availed term finance facility of Rs. 4,500 million inclusive of Rs. 1,861 million for letter of credit from MCB Bank Limited. It carries markup at annual rate of 6 months KIBOR plus 0.14% and 0.40% during first and last three and half years respectively during the tenure of the term finance facility.

152
152
The tenure is seven years and is repayable after a grace period of three and half years in seven semi-annual installments commencing from September 30, 2019. It is secured against first exclusive equitable mortgage charge of Rs. 7,333.334 million on land of the Parent Company, measuring 119 kanals 15 marlas and 62.25 square feets in aggregate, situated at Lahore having book value of Rs. 6.149 million together with all present and future buildings constructed thereon, and movable fixed assets including but not limited to plant, machinery, equipment, fixtures and other installations.
7.2 Foreign currency loan - secured
During the current year, the Group obtained a loan from Habib Bank Limited, Offshore Banking Unit, Bahrain (‘HBL Bahrain’) of USD 9.5 million to finance the acquisition of business as referred to in note 48. This facility is provided against a guarantee in the form of a Standby Letter of Credit (‘SBLC’) issued by Habib Bank Limited Pakistan (‘HBL Pakistan’) in favor of HBL Bahrain as referred to in note 18.1. SBLC is secured against pledge of Nestle Pakistan Limited shares owned by the Group as referred to in note 23.2. It carries markup at the rate of LIBOR plus 5.25 percent per annum and the balance USD 8.8 million is payable in 10 equal semi-annual installments starting from November 2017 and ending on May 2022. The effective markup charged during the year ranges from 5.90 percent per annum to 5.95 percent per annum.
7.3 Preference shares / convertible stock - unsecured
During the year 2009, the Group issued 10 percent local currency non-voting cumulative preference shares / convertible stock at the rate of Rs. 190 per share amounting to USD 50 million equivalent to PKR 4,120.5 million under “Subscription Agreement” dated March 25, 2009 with IFC.
Terms of redemption / conversion
Each holder of preference shares / convertible stock shall have a right to settle at any time, at the option of holder, either in the form of fixed number of ordinary shares, one ordinary share for one preference share / convertible stock, or cash. The Group may, in its discretion, refuse to purchase the preference shares / convertible stock offered to it for purchase in cash. In case of refusal by the Group, preference shareholders shall have the right to either retain the preference shares / convertible stock or to convert them into ordinary shares. The preference shares / convertible stock can be held till perpetuity if preference shareholders do not opt for the conversion or cash settlement.
Rate of return
The preference share / convertible stock holders have a preferred right of return at the rate of 10 percent per annum on a non-cumulative basis till the date of settlement of preference shares / convertible stock either in cash or ordinary shares.
Preference shares / convertible stock are recognised in the balance sheet as follows: (Rupees in thousand) Note 2015 2014
Face value of preference shares / convertible stock [17,686,842 (2014: 19,686,842) shares of Rs. 190 each] 3,360,500 3,740,500 Transaction costs (35,923) (39,986)
3,324,577 3,700,514 Equity component - classified under capital and reserves 7.3.1 (1,309,682) (1,571,699)
Liability component - classified under long term finances 2,014,895 2,128,815 Accrued return on preference shares / convertible stock classified under accrued finance cost 336,050 355,047

153
153
ANNUAL REPORT OF PACKAGES LIMITED 2015CONSOLIDATED FINANCIAL STATEMENTS 2015
(Rupees in thousand) 2015 2014
7.3.1 Movement in equity component - classified under capital and reserves Opening balance 1,571,699 1,605,875 Transfer from long term finances to capital and reserves [1,000,000 shares (2014: 3,000,000 shares)] 113,921 341,762 Conversion into ordinary share capital and share premium [2,000,000 shares (2014: 2,000,000 shares)] (375,938) (375,938)
Closing balance 1,309,682 1,571,699 The fair value of the liability component of the preference shares / convertible stock is calculated by discounting
cash flows at a rate of approximately 16.50 percent till perpetuity which represents the rate of similar instrument with no associated equity component. The residual amount, representing the value of the equity conversion component, is included in shareholders equity as preference shares / convertible stock reserve.
During the year, IFC exercised its right to convert 1,000,000 (2014: 3,000,000) preference shares / convertible
stock of Rs. 190 into 1,000,000 (2014: 3,000,000) ordinary shares of Rs. 10 each. Consequently, the Group converted 2,000,000 (2014: 2,000,000) preference shares / convertible stock during the year of which 1,000,000 (2014: Nil) preference shares / convertible stock pertain to the right exercised by IFC in the previous year. Accordingly, the liability portion pertaining to 1,000,000 (2014: 3,000,000) preference shares / convertible stock converted into ordinary shares has been transferred to capital and reserves.
8. Equity portion of short term loan from shareholder
Interest free loan aggregating to Rs. 600 million (2014: Nil) from the shareholder of the Parent Company, as referred to in note 14 has been discounted at a rate of 10.46% (2014: Nil), considered to be the rate for a similar instrument, to determine the fair value of the loan. The resulting gain on initial recognition has been classified directly in equity as a capital contribution of the shareholder of the Parent Company accompanying a loan at market terms as referred to in note 14.
(Rupees in thousand) Note 2015 2014 9. Liabilities against assets subject to finance lease
Present value of minimum lease payments 295,303 30,381 Current maturity shown under current liabilities 13 (102,929) (4,696)
192,374 25,685
Interest rate used as discounting factor ranges from 6.96 per cent to 10.72 per cent per annum (2014: 9.99 per cent to 10.72 per cent per annum). Taxes, repairs, replacements and insurance costs are borne by the lessee.
Liabilities against finance lease include amounts secured against the following: (Rupees in thousand)
Plant and machinery 642,324 Motor vehicles 29,523

154
154
The amount of the future payment of the lease as shown in the balance sheet and the period in which these payments will become due are as follows:
Minimum Future Present value of lease lease finance liability(Rupees in thousand) payments charge 2015 2014
Not later than one year 135,089 32,160 102,929 4,696 Later than one year and not later than five years 223,342 30,968 192,374 25,685
358,431 63,128 295,303 30,381
(Rupees in thousand) Note 2015 2014
10. Deferred tax
The liability for deferred tax comprises temporary differences relating to: Accelerated tax depreciation 550,540 589,169 Asset acquisition 187,354 - Investments in associates and joint ventures 201,000 136,000 Preference shares / convertible stock transaction cost - liability portion 6,882 8,022 Unused tax losses - (199,491)Effect of qualifying payment (1,239) (10,044)Income received in advance (1,878) - Alternate corporate tax available for carry forward (33,787) - Minimum tax available for carry forward 10.1 (122,079) - Provision for accumulating compensated absences (70,337) (70,138)Provision for doubtful receivables (7,768) (13,343)Provision for slow moving items (3,244) (1,749)Provision for unfunded defined benefit plan (1,990) (1,426)Straight lining of operating leases (10,122) -
693,332 437,000 10.1 The Group has not adjusted the net deferred tax liability against aggregate tax credits of Rs. 436.93 million
(2014: Rs. 811.446 million) available to the Group under section 113 of the Income Tax Ordinance, 2001 (‘Ordinance’) in view of the decision by the Divisional Bench of Sindh High Court dated May 7, 2013 in case of another Group, in respect of carry forward of minimum tax by the Group. Through the aforesaid decision, the Sindh High Court has interpreted section 113(2)(c) of the Ordinance that the benefit of carry forward of minimum tax paid by a Group is not available if otherwise no tax was payable by the Group due to taxable loss. Tax credits under section 113 of the Ordinance amounting to Rs. 203.917 million, Rs. 110.934 million and Rs. 122.079 million are set to lapse by the end of years ending on December 31, 2016, 2017 and 2020 respectively.

155
155
ANNUAL REPORT OF PACKAGES LIMITED 2015CONSOLIDATED FINANCIAL STATEMENTS 2015
(Rupees in thousand) 2015 2014
11. Retirement benefits
Classified under non-current assets Pension fund - 58,252 Gratuity fund - 29,629
- 87,881 Classified under non-current liabilities Pension fund 24,744 - Gratuity fund 15,681 -
40,425 -
Pension Fund Gratuity Fund(Rupees in thousand) 2015 2014 2015 2014
The amounts recognised in the consolidated balance sheet are as follows: Fair value of plan assets 627,009 700,115 362,566 339,502 Present value of defined benefit obligation (651,753) (641,863) (378,247) (309,873)
(Liability) / asset as at December 31 (24,744) 58,252 (15,681) 29,629 Net asset / (liability) as at January 1 58,252 (578) 29,629 6,540 Income / (charge) to consolidated profit and loss account 6,117 (72) (13,685) (14,282)(Loss) / gain recorded in consolidated OCI (89,113) 58,902 (46,954) 23,921 Contribution by the Group - - 15,329 13,450
Net (liability) / asset as at December 31 (24,744) 58,252 (15,681) 29,629
The movement in the present value of defined benefit obligation is as follows:
Present value of defined benefit obligation as at January 1 641,863 568,285 309,873 275,115
Service cost - - 18,005 16,153 Interest cost 63,837 66,808 30,860 31,339 Benefits paid (67,785) (67,639) (31,006) (45,424)Benefits due but not paid - - (923) (3,379)Loss from change in demographic assumptions - 3,144 - - Loss from change in financial assumptions 43,903 62,212 - - Experience adjustments (30,065) 9,053 51,438 36,069
Present value of defined benefit obligation as at December 31 651,753 641,863 378,247 309,873

156
156
Pension Fund Gratuity Fund(Rupees in thousand) 2015 2014 2015 2014
The movement in fair value of plan assets is as follows: Fair value as at January 1 700,115 567,707 339,502 281,655 Expected return on plan assets 69,954 66,736 35,180 33,209 Group contributions - - 15,329 13,450 Benefits paid (67,785) (67,639) (31,006) (45,424)Benefits due but not paid - - (923) (3,379)Experience (loss) / gain (75,275) 133,311 4,484 59,991
Fair value as at December 31 627,009 700,115 362,566 339,502 The amounts recognised in the consolidated profit and loss account are as follows: Current service cost - - 18,005 16,153 Interest cost for the year 63,837 66,808 30,860 31,339 Expected return on plan assets (69,954) (66,736) (35,180) (33,209)
Net (income) / expense included in salaries, wages and amenities (6,117) 72 13,685 14,283 Plan assets are comprised as follows: Debt 291,528 250,081 144,192 14,802 Equity 333,161 393,815 216,271 220,812 Cash 2,320 56,219 2,103 103,888
627,009 700,115 362,566 339,502 The present value of defined benefit obligation, the fair value of plan assets and the deficit or surplus of pension fund is as follows:
(Rupees in thousand) 2015 2014 2013 2012 2011
As at December 31 Present value of defined benefit obligation 651,753 641,863 568,285 582,031 1,092,581 Fair value of plan assets 627,009 700,115 567,707 305,573 685,750
(Deficit) / surplus (24,744) 58,252 (578) (276,458) (406,831) Experience adjustment on obligation -5% 2% 1% 13% 11%Experience adjustment on plan assets -11% 24% 2% 11% -10%

157
157
ANNUAL REPORT OF PACKAGES LIMITED 2015CONSOLIDATED FINANCIAL STATEMENTS 2015
Fair value of plan assets include ordinary shares of the Parent Company, whose fair value as at December 31, 2015 is Rs. 384.214 million (2014: Rs. 447.696 million).
The present value of defined benefit obligation, the fair value of plan assets and the surplus of gratuity fund is as follows:
(Rupees in thousand) 2015 2014 2013 2012 2011
As at December 31 Present value of defined benefit obligation 378,247 309,873 275,115 371,372 314,074 Fair value of plan assets 362,566 339,502 281,655 341,022 317,168
(Deficit) / surplus (15,681) 29,629 6,540 (30,350) 3,094
Experience adjustment on obligation 6% 13% 9% 14% -1%Experience adjustment on plan assets 1% 21% 14% 9% -5% Fair value of plan assets include ordinary shares of the Parent Company, whose fair value as at December 31, 2015 is Rs. 60.827 million (2014: Rs. 70.877 million).
2015(Rupees in thousand) Pension Gratuity
Year end sensitivity analysis on defined benefit obligation:
Discount rate + 100 bps 608,531 350,030 Discount rate - 100 bps 701,114 410,723 Indexation + 100 bps 708,393 410,963 Indexation - 100 bps 601,768 349,325
(Rupees in thousand) Note 2015 2014
12. Deferred liabilities
Accumulating compensated absences 12.1 234,990 201,030 Staff gratuity 12.2 13,266 11,881
248,256 212,911 12.1 Accumulating compensated absences
This represents provision made to cover the obligation for accumulating compensated absences.
Opening balance 201,030 156,415
Provision for the year 57,599 62,129
258,629 218,544 Payments made during the year (23,639) (17,514)
Closing balance 234,990 201,030
12.2 Staff gratuity
This represents staff gratuity of employees of Packages Lanka (Private) Limited and is unfunded.
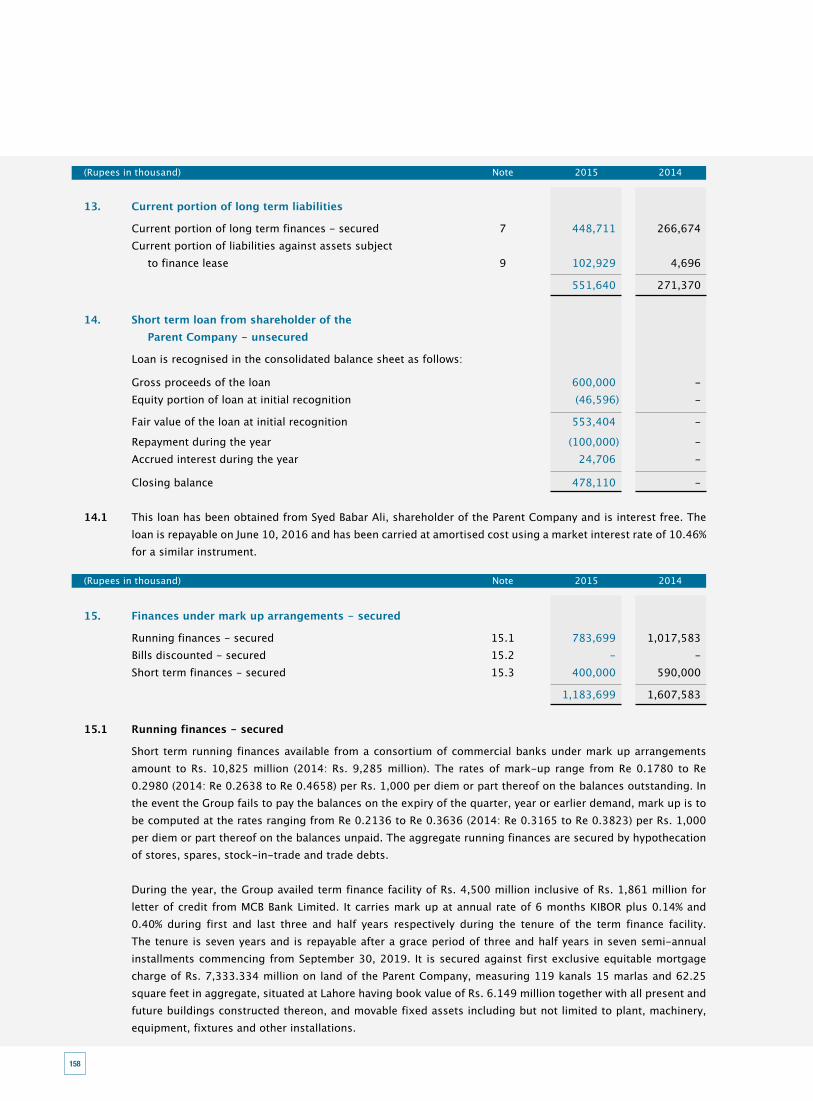
158
158
(Rupees in thousand) Note 2015 2014
13. Current portion of long term liabilities
Current portion of long term finances - secured 7 448,711 266,674 Current portion of liabilities against assets subject to finance lease 9 102,929 4,696
551,640 271,370
14. Short term loan from shareholder of the Parent Company - unsecured
Loan is recognised in the consolidated balance sheet as follows:
Gross proceeds of the loan 600,000 - Equity portion of loan at initial recognition (46,596) -
Fair value of the loan at initial recognition 553,404 -
Repayment during the year (100,000) - Accrued interest during the year 24,706 -
Closing balance 478,110 - 14.1 This loan has been obtained from Syed Babar Ali, shareholder of the Parent Company and is interest free. The
loan is repayable on June 10, 2016 and has been carried at amortised cost using a market interest rate of 10.46% for a similar instrument.
(Rupees in thousand) Note 2015 2014
15. Finances under mark up arrangements - secured
Running finances - secured 15.1 783,699 1,017,583 Bills discounted - secured 15.2 - - Short term finances - secured 15.3 400,000 590,000
1,183,699 1,607,583 15.1 Running finances - secured
Short term running finances available from a consortium of commercial banks under mark up arrangements amount to Rs. 10,825 million (2014: Rs. 9,285 million). The rates of mark-up range from Re 0.1780 to Re 0.2980 (2014: Re 0.2638 to Re 0.4658) per Rs. 1,000 per diem or part thereof on the balances outstanding. In the event the Group fails to pay the balances on the expiry of the quarter, year or earlier demand, mark up is to be computed at the rates ranging from Re 0.2136 to Re 0.3636 (2014: Re 0.3165 to Re 0.3823) per Rs. 1,000 per diem or part thereof on the balances unpaid. The aggregate running finances are secured by hypothecation of stores, spares, stock-in-trade and trade debts.
During the year, the Group availed term finance facility of Rs. 4,500 million inclusive of Rs. 1,861 million for
letter of credit from MCB Bank Limited. It carries mark up at annual rate of 6 months KIBOR plus 0.14% and 0.40% during first and last three and half years respectively during the tenure of the term finance facility. The tenure is seven years and is repayable after a grace period of three and half years in seven semi-annual installments commencing from September 30, 2019. It is secured against first exclusive equitable mortgage charge of Rs. 7,333.334 million on land of the Parent Company, measuring 119 kanals 15 marlas and 62.25 square feet in aggregate, situated at Lahore having book value of Rs. 6.149 million together with all present and future buildings constructed thereon, and movable fixed assets including but not limited to plant, machinery, equipment, fixtures and other installations.

159
159
ANNUAL REPORT OF PACKAGES LIMITED 2015CONSOLIDATED FINANCIAL STATEMENTS 2015
15.2 Bills discounted - secured
Facilities for discounting of export / inland bills of Rs. 531 million (2014: Rs. 531 million) are available to the Group as a sub-limit of the running finance facilities referred to in note 15.1. Mark up is fixed as per mutual agreement at the time of transaction. The outstanding balance of bills discounted is secured, in addition to the securities referred to in note 15.1, on the specific bills discounted. The facility has not been availed in the current year.
15.3 Short term finances - secured
Facilities for obtaining short term finances of Rs. 8,065 million (2014: Rs. 7,235 million) are available to the Group as a sub-limit of the running finance facilities referred to in note 15.1. The rates of mark up range from Re 0.1698 to Re 0.2715 (2014: Re 0.2690 to Re 0.2858) per Rs. 1,000 per diem or part thereof on the balances outstanding.
15.4 Letters of credit and bank guarantees
Of the aggregate facility of Rs. 7,389 million (2014: Rs. 7,438 million) for opening letters of credit and Rs. 849 million (2014: Rs. 1,049 million) for guarantees, the amount utilised at December 31, 2015 was Rs. 508.171 million (2014: Rs. 208.337 million) and Rs. 268 million (2014: Rs. 154.840 million) respectively. Of the facility for guarantees, Rs. 794 million (2014: Rs. 1,294 million) is secured by second hypothecation charge over stores, spares, stock-in-trade and trade debts.
(Rupees in thousand) Note 2015 2014
16. Trade and other payables
Trade creditors 16.1 2,132,321 1,222,640 Accrued liabilities 16.2 688,234 580,803 Bills payable 1,022,815 1,245,493 Retention money payable 105,265 2,489 Sales tax payable 49,965 11,071 Advances from customers 201,695 136,794 Payable to employees’ retirement benefit funds 16.3 14,590 13,237 Deposits - interest free repayable on demand 7,446 7,226 TFCs payable 1,387 1,387 Unclaimed dividends 20,975 17,290 Workers’ profit participation fund 16.4 202,337 148,122 Workers’ welfare fund 16.5 186,485 103,799 Operating lease rentals 36,149 - Others 16.6 114,377 71,561
4,784,041 3,561,912

160
160
(Rupees in thousand) Note 2015 2014
16.1 Trade creditors include amount due to related parties as follows:
Joint venture
Bulleh Shah Packaging (Private) Limited 233,529 164,059
Associates
IGI Insurance Limited 4,648 1,147 IGI Life Insurance Limited 1,940 - Tri-Pack Films Limited 54,043 1,285
Other related parties
DIC Asia Pacific Pte Limited 19,703 9,399 DIC China Company Limited 1,450 - DIC Corporation Japan 365 370 DIC Fine Chemicals Pvt Limited 186 186 DIC Graphics (Thailand) Co. Limited 274 - DIC India Limited 3,366 - DIC Malaysia SDN. BHD - 659
319,504 177,105 16.2 Accrued liabilities include amounts in respect of related parties as follows:
Joint venture
Bulleh Shah Packaging (Private) Limited - 764 Associate
IGI Insurance Limited 175 - Other related parties
DIC Asia Pacific Pte Limited 36,748 33,253
36,923 34,017 16.3 Payabletoemployees’retirementbenefitfunds
Employees’ provident fund 16.3.1 7,347 6,808 Employees’ gratuity fund 1,293 1,149 Management staff pension fund 5,950 5,280
14,590 13,237

161
161
ANNUAL REPORT OF PACKAGES LIMITED 2015CONSOLIDATED FINANCIAL STATEMENTS 2015
(Rupees in thousand) Note 2015 2014
16.3.1 Employees’providentfund
(i) Size of the fund 2,152,893 2,311,341 (ii) Cost of investments made 776,987 715,803 (iii) Fair value of investments 16.3.2 2,125,249 2,297,324 (iv) Percentage of investments made 98.72% 99.39%
2015 2014 Rupees in % age of size Rupees in % age of size thousand of the Fund thousand of the Fund
16.3.2 Fair value of investments
Break up of investments
Equity shares of listed companies 1,480,216 68.75% 1,719,020 74.37%Mutual funds 206,866 9.61% 159,346 6.89%Izafa certificates 160,217 7.44% 148,011 6.40%Pakistan investment bonds 214,565 9.97% 213,169 9.22%Term finance certificates 20,155 0.94% 28,524 1.23%Term deposit receipts with banks 43,230 2.01% - 0.00%Treasury bills - 0.00% 29,254 1.27%
2,125,249 98.72% 2,297,324 99.39% 16.3.3 The investments of the employee’s provident fund trust have been made in accordance with the provisions of
section 227 of the Ordinance and the Rules formulated for this purpose. (Rupees in thousand) Note 2015 2014
16.4 Workers’profitparticipationfund
Opening balance 148,122 105,995 Refund claimed - 641 Provision for the year 34 230,337 166,622 378,459 273,258 Payments made during the year (176,122) (125,136)
Closing balance 202,337 148,122
16.5 Workers’welfarefund
Opening balance 103,799 45,598 Prior year adjustment 390 - Provision for the year 34 87,326 63,176
191,515 108,774 Payments made during the year (5,030) (4,975)
Closing balance 186,485 103,799
16.6 Others include amount due to related parties Rs. 3.268 million (2014: Rs. 1.233 million).

162
162
(Rupees in thousand) 2015 2014
17. Accrued finance cost
Accrued mark up / return on: Long term local currency loans - secured 20,500 148,704 Long term foreign currency loans - secured - - Preference shares / convertible stock - unsecured 336,050 355,047 Finances under mark up arrangements - secured 11,062 23,192
367,612 526,943
18. Contingencies and commitments
18.1 Contingencies
(i) Claims against the Group not acknowledged as debts Rs. 20.077 million (2014: Rs. 18.062 million).
(ii) Guarantee issued in favor of Excise and Taxation Officer amounting to Rs. 0.792 million (2014: Rs. 1.485 million).
(iii) Post dated cheques not provided in the consolidated financial statements furnished by the Group in favor of the Collector of Customs against custom levies aggregated to Rs. 72.248 million (2014: Rs. 100.337 million) in respect of goods imported.
(iv) Standby letter of credit issued by HBL Pakistan in favor of HBL Bahrain on behalf of the Group amounting to USD 11.770 million (equivalent to PKR 1,232.781 million) [2014: Nil] as referred to in note 23.2.
18.2 Commitments
(i) Letters of credit and contracts for capital expenditure Rs. 2,875.358 million (2014: Rs. 962.267 million).
(ii) Letters of credit and contracts for other than for capital expenditure Rs. 237.869 million (2014: Rs. 227.594 million).
(iii) The amount of future payments under operating leases and the period in which these payments will become due are as follows:
(Rupees in thousand) 2015 2014
Not later than one year 75,987 28,923 Later than one year and not later than five years 288,672 49,404 Later than five years 212,751 -
577,410 78,327 There are no commitments with related parties.
(Rupees in thousand) Note 2015 2014
19. Property, plant and equipment
Owned assets 19.1 4,643,490 3,901,357 Assets subject to finance lease 19.2 657,575 30,830 Capital work in progress 19.3 237,361 254,209
5,538,426 4,186,396
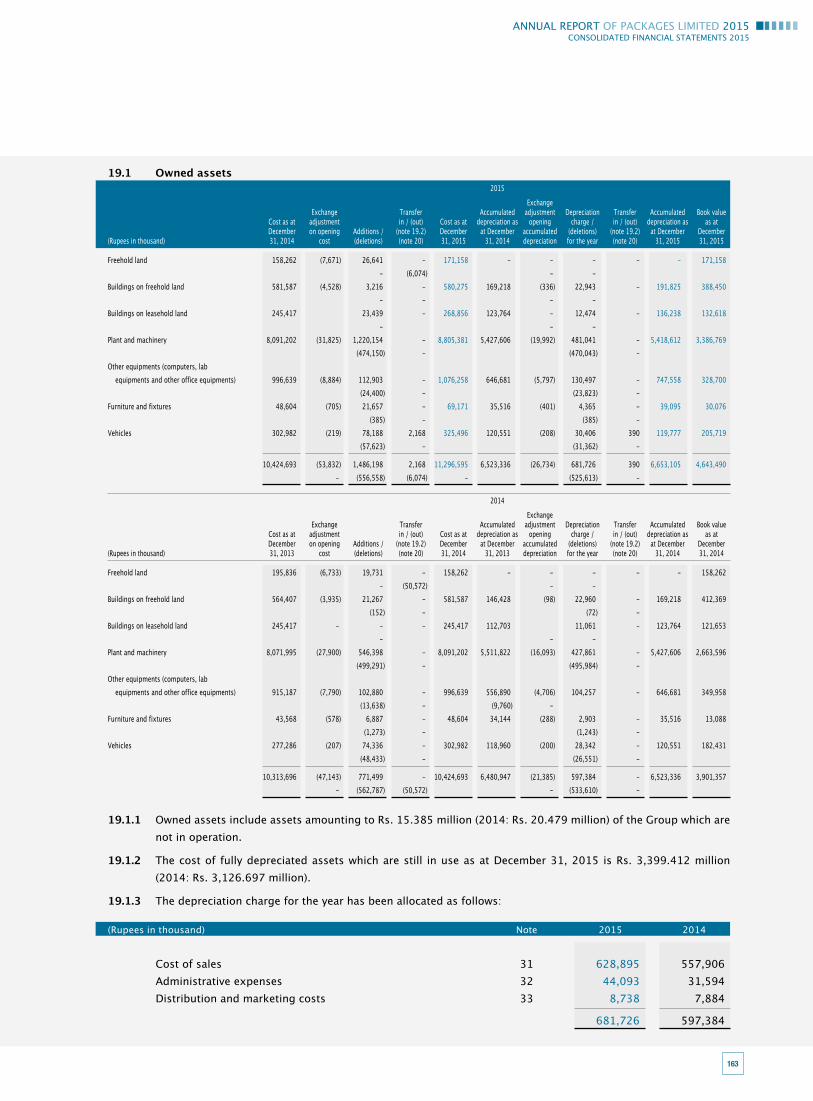
163
163
ANNUAL REPORT OF PACKAGES LIMITED 2015CONSOLIDATED FINANCIAL STATEMENTS 2015
19.1 Owned assets 2015 Exchange Exchange Transfer Accumulated adjustment Depreciation Transfer Accumulated Book value Cost as at adjustment in / (out) Cost as at depreciation as opening charge / in / (out) depreciation as as at December on opening Additions / (note 19.2) December at December accumulated (deletions) (note 19.2) at December December(Rupees in thousand) 31, 2014 cost (deletions) (note 20) 31, 2015 31, 2014 depreciation for the year (note 20) 31, 2015 31, 2015
Freehold land 158,262 (7,671) 26,641 - 171,158 - - - - - 171,158 - (6,074) - - Buildings on freehold land 581,587 (4,528) 3,216 - 580,275 169,218 (336) 22,943 - 191,825 388,450 - - - - Buildings on leasehold land 245,417 23,439 - 268,856 123,764 - 12,474 - 136,238 132,618 - - - Plant and machinery 8,091,202 (31,825) 1,220,154 - 8,805,381 5,427,606 (19,992) 481,041 - 5,418,612 3,386,769 (474,150) - (470,043) - Other equipments (computers, lab equipments and other office equipments) 996,639 (8,884) 112,903 - 1,076,258 646,681 (5,797) 130,497 - 747,558 328,700 (24,400) - (23,823) - Furniture and fixtures 48,604 (705) 21,657 - 69,171 35,516 (401) 4,365 - 39,095 30,076 (385) - (385) - Vehicles 302,982 (219) 78,188 2,168 325,496 120,551 (208) 30,406 390 119,777 205,719 (57,623) - (31,362) -
10,424,693 (53,832) 1,486,198 2,168 11,296,595 6,523,336 (26,734) 681,726 390 6,653,105 4,643,490 - (556,558) (6,074) - (525,613) -
2014 Exchange Exchange Transfer Accumulated adjustment Depreciation Transfer Accumulated Book value Cost as at adjustment in / (out) Cost as at depreciation as opening charge / in / (out) depreciation as as at December on opening Additions / (note 19.2) December at December accumulated (deletions) (note 19.2) at December December(Rupees in thousand) 31, 2013 cost (deletions) (note 20) 31, 2014 31, 2013 depreciation for the year (note 20) 31, 2014 31, 2014
Freehold land 195,836 (6,733) 19,731 - 158,262 - - - - - 158,262 - (50,572) - - Buildings on freehold land 564,407 (3,935) 21,267 - 581,587 146,428 (98) 22,960 - 169,218 412,369 (152) - (72) - Buildings on leasehold land 245,417 - - - 245,417 112,703 11,061 - 123,764 121,653 - - - Plant and machinery 8,071,995 (27,900) 546,398 - 8,091,202 5,511,822 (16,093) 427,861 - 5,427,606 2,663,596 (499,291) - (495,984) - Other equipments (computers, lab equipments and other office equipments) 915,187 (7,790) 102,880 - 996,639 556,890 (4,706) 104,257 - 646,681 349,958 (13,638) - (9,760) - Furniture and fixtures 43,568 (578) 6,887 - 48,604 34,144 (288) 2,903 - 35,516 13,088 (1,273) - (1,243) - Vehicles 277,286 (207) 74,336 - 302,982 118,960 (200) 28,342 - 120,551 182,431 (48,433) - (26,551) -
10,313,696 (47,143) 771,499 - 10,424,693 6,480,947 (21,385) 597,384 - 6,523,336 3,901,357 - (562,787) (50,572) - (533,610) -
19.1.1 Owned assets include assets amounting to Rs. 15.385 million (2014: Rs. 20.479 million) of the Group which are not in operation.
19.1.2 The cost of fully depreciated assets which are still in use as at December 31, 2015 is Rs. 3,399.412 million (2014: Rs. 3,126.697 million).
19.1.3 The depreciation charge for the year has been allocated as follows:
(Rupees in thousand) Note 2015 2014
Cost of sales 31 628,895 557,906 Administrative expenses 32 44,093 31,594 Distribution and marketing costs 33 8,738 7,884
681,726 597,384

164
164
19.1.4 Disposal of owned assets Detail of owned assets disposed off during the year is as follows: (Rupees in thousand) 2015
Particulars Accumulated Sales Mode ofof assets Sold to Cost depreciation Book value proceeds disposal
Plant and machinery Outsider - related party
Bulleh Shah Packaging (Private) Limited 912 627 285 109 Negotiation
Outsiders
Boss Links 14,492 11,231 3,261 2,222 Negotiation M/s Fazal Brothers 27 18 9 5 - do - Muhammad Ameen 5,296 5,186 110 1,295 - do -
Other Equipments Outsiders - related party
Bulleh Shah Packaging (Private) Limited 79 20 59 65 Negotiation IGI Insurance Limited 105 15 90 75 Claim Settlement
Outsider
Bismillah Traders 2,490 2,257 233 98 Negotiation
Vehicles Employees
Ahmed Ramzan 1,100 572 528 763 Group Policy Ammad Asif 1,275 536 739 906 - do - Asma Shahzad 750 405 345 471 - do - Athar Riaz 1,498 419 1,079 1,166 - do - Ather Ayub Khan 1,797 1,348 449 481 Negotiation Fahad Ali 490 368 122 218 Group Policy Farhan Munir 700 182 518 511 - do - Ghayyur Abbas 700 203 497 512 - do - Hammad Ahmed Butt 944 349 595 582 - do - Hassan Asif 1,640 1,046 594 1,197 - do - Imran Iqbal 1,548 341 1,207 1,218 - do - Khalid Aziz 493 364 129 221 - do - Major Fazal Ahmed 1,778 76 1,702 1,760 Negotiation Maryam Nisar 813 325 488 562 Group Policy Mashkoor Hussain 1,498 390 1,108 1,173 - do - Moiz Ahmed 741 282 459 456 - do - Mudassir Anjum 1,111 455 656 779 - do - Mudassir Shafique 1,232 924 308 717 - do - Muhammad Akram 1,288 869 419 571 - do - Muhammad Amir Baig 1,770 142 1,628 1,771 - do - Muhammad Ashiq 630 449 181 333 - do - Muhammad Awais Jawaid 859 634 225 398 - do - Muhammad Latif 800 600 200 475 - do - Muhammad Siddique 1,232 924 308 709 - do - Muhammad Usman Akram 810 300 510 516 - do - Musa Naseer 878 648 230 414 - do - Musarrat Mumtaz 389 291 98 102 - do - Omar Javed 673 135 538 487 - do - Rehan Yacob 1,354 1,016 338 890 - do - Sagheer Hussain 505 366 139 230 - do - Sahil Zaheer 1,426 1,034 392 859 - do - Saifullah Zaheer 695 56 639 614 - do - Shahid Latif 460 345 115 174 - do - Shamim Ahmed Khan 1,000 688 312 511 Negotiation Tanseer Asghar 511 370 141 235 - do - Tanveer Ahmed Awan 515 380 135 237 - do - Umer Mehmood 650 234 416 420 - do - Usman Anwar 1,250 645 605 884 - do - Usman Munir 750 367 383 462 - do - Zafar Mehmood 1,400 364 1,036 1,149 - do - Zubair Ahmed 467 350 117 178 - do -
Outsiders - related party
Bulleh Shah Packaging (Private) Limited 900 198 702 702 Negotiation Tripack Films Limited 2,512 678 1,834 1,834 - do - Syed Aslam Mehdi 1,969 1,304 665 664 - do -
Carried forward 69,202 41,326 27,876 33,381

165
165
ANNUAL REPORT OF PACKAGES LIMITED 2015CONSOLIDATED FINANCIAL STATEMENTS 2015
(Rupees in thousand) 2015
Particulars Accumulated Sales Mode ofof assets Sold to Cost depreciation Book value proceeds disposal
(Rupees in thousand) 2014
Particulars Accumulated Sales Mode ofof assets Sold to Cost depreciation Book value proceeds disposal
Brought forward 69,202 41,326 27,876 33,381
Outsiders
Argosy Enterprises 1,279 959 320 1,102 Negotiation Asim Mumtaz 1,347 1,010 337 830 - do - Bismillah Traders 525 395 130 252 - do - Israel Khan 803 602 201 645 - do - Muhammad Sajid 678 88 590 562 - do - Qadeer Associates & Motors 1,169 876 293 990 - do - Riaz Motors 673 114 559 513 - do -
Other assets with book value less than Rs. 50,000 476,911 476,272 639 64,520 Negotiation Written off 3,971 3,971 - - Group Policy
556,558 525,613 30,945 102,795
Buildings on freehold land Outsider
Muhammad Younis and Company 152 72 80 27 Negotiation Plant and machinery Outsider - related party
Bulleh Shah Packaging (Private) Limited 6,019 5,173 846 1,000 Negotiation Outsiders
Muhammad Younis & Company 4,537 2,215 2,322 805 Negotiation Bismillah Traders 469 331 138 98 -do- 456 456 - - Written off Other Equipments Employee Syed Aslam Mehdi 2,348 240 2,108 - Group Policy
Outsiders Malik Muhammad Younis 1,983 529 1,454 84 Negotiation Computer Mall 798 798 - 11 - do - Mughal Electronics 16 15 1 2 - do - Bismillah Traders 1,274 1,270 4 13 - do - 2,281 2,270 11 - Written off Furniture and fixture Outsiders
Bismillah Traders 401 401 - 65 Negotiation Mughal Electronics 165 147 18 20 - do - Israel Khan 17 17 - 4 - do - 691 678 13 - Written off Vehicles Employees
Ali Faraz 741 192 549 537 Group Policy Asad Ur Rehman 950 152 798 755 - do - Athar Rashid Butt 1,687 1,118 569 590 - do - Atif Raza 750 98 652 645 - do - Attia Jamal 1,035 290 745 832 - do - Faisal Mehmood 672 54 618 572 - do - Hamid Jameel 746 560 186 422 - do -
Carried forward 28,188 17,076 11,112 6,482

166
166
(Rupees in thousand) 2014
Particulars Accumulated Sales Mode ofof assets Sold to Cost depreciation Book value proceeds disposal
Brought forward 28,188 17,076 11,112 6,482
Haroon Naseer 1,232 909 323 718 - do - Ishtiaq Ahmad 937 356 581 681 - do - Kamran Bashir 1,232 909 323 717 - do - Mian Abid Nisar Lodhi 783 196 587 498 - do - Mohayyundin Ahmad 700 473 227 399 - do - Muhammad Ahmad 1,110 425 685 870 - do - Muhammad Naveed 730 547 183 585 Negotiation Muhammad Anwar 516 387 129 233 Group Policy Muhammad Bilal Tariq 555 183 372 352 - do - Muhammad Zubair 960 684 276 496 - do - Musab Mukhtar 538 404 134 257 - do - Nasir Mehmood 628 455 173 325 - do - Raza Sanaullah 1,924 250 1,674 1,761 - do - Sajjad Iftikhar 1,690 389 1,301 1,256 - do - Salman Saleem 620 465 155 335 - do - Shakir Zia 1,430 858 572 941 - do - Syed Asim Shamim 1,386 762 624 906 Group Policy Syed Shaukat Hussain 487 359 128 227 - do - Talal Bin Najam 620 186 434 397 - do - Waseem Ahmad 1,017 142 875 899 - do - Muhammad Salman 697 340 357 426 - do - Muhammad Naeem Chohan 510 383 127 229 - do - Sohail Afzal 501 376 125 222 - do - Muhammad Abbas 459 344 115 173 - do - Outsiders
Amir Saleem 387 290 97 318 Negotiation Aurangzeb 2,500 1,744 756 4,732 - do - Bank Al Habib 4,680 328 4,352 4,584 Sale and lease back Khair Agencies 657 85 572 575 Negotiation Bilal Ahmed 1,657 1,243 414 1,070 - do - Masood Ahmed 800 540 260 825 - do - Muhammad Rashid Shakoor 874 656 218 720 - do - Nazim Hussain 730 547 183 642 - do - Sarwar & Company (Pvt) Limited 5,795 5,723 72 4,274 - do - Shafi Karim 822 462 360 528 - do - Other assets with book value less than Rs 50,000 494,435 494,134 301 75,641 Negotiation
562,787 533,610 29,177 114,294

167
167
ANNUAL REPORT OF PACKAGES LIMITED 2015CONSOLIDATED FINANCIAL STATEMENTS 2015
19.2 Assets subject to finance lease 2015
Accumulated Deprecation Accumulated Book value Cost as at Transfer Cost as at depreciation charge / Transfer depreciation as at December Additions / (out) December as at December (deletions) (out) as at December December (Rupees in thousand) 31, 2014 (deletions) (note 19.1) 31, 2015 31, 2014 for the year (note 19.1) 31, 2015 31, 2015
Vehicles 35,030 43,430 (2,168) 74,717 4,200 8,214 (390) 12,024 62,693 (1,575) Plant and equipment - 624,548 - 624,548 - 29,666 - 29,666 594,882
35,030 666,403 (2,168) 699,265 4,200 37,880 (390) 41,690 657,575 (1,575) -
2014
Accumulated Deprecation Accumulated Book value Cost as at Transfer Cost as at depreciation charge / Transfer depreciation as at December Additions / (out) December as at December (deletions) (out) as at December December (Rupees in thousand) 31, 2013 (deletions) (note 19.1) 31, 2014 31, 2013 for the year (note 19.1) 31, 2014 31, 2014
Vehicles 28,897 6,133 - 35,030 548 3,652 - 4,200 30,830
28,897 6,133 - 35,030 548 3,652 - 4,200 30,830
19.2.1 Depreciation charge for the year has been allocated as follows:
(Rupees in thousand) Note 2015 2014
Cost of sales 31 34,355 1,039 Administrative expenses 32 3,264 2,548 Distribution and marketing costs 33 261 65
37,880 3,652
19.3 Capital work-in-progress
Civil works 11,229 41,084 Plant and machinery [including in transit Rs. 49.39 million (2014: Nil)] 202,281 207,041 Advance for procurement of land 17,593 195 Advances to suppliers 6,258 5,889
237,361 254,209
(Rupees in thousand) Note 2015 2014
20. Investment property
Developed 20.1 136,012 117,056 Under development 20.2 4,974,236 1,049,358
5,110,248 1,166,414

168
168
20.1 Investment property - developed 2015
Accumulated Depreciation Accumulated Book value Cost as at Cost as at depreciation charge / depreciation as at December Additions / Transfer in December as at December (deletions) Transfer in as at December December (Rupees in thousand) 31, 2014 (deletions) (note 19.1) 31, 2015 31, 2014 for the year (note 19.1) 31, 2015 31, 2015
Land 109,323 - 6,074 115,397 - - - - 115,397 Buildings on freehold land 34,855 - - 34,855 27,711 2,204 - 29,915 4,940 Buildings on leasehold land 909 15,834 - 16,743 320 748 - 1,068 15,675
145,087 15,834 6,074 166,995 28,031 2,952 - 30,983 136,012
2014
Accumulated Depreciation Accumulated Book value Cost as at Cost as at depreciation charge / depreciation as at December Additions / Transfer in December as at December (deletions) Transfer in as at December December (Rupees in thousand) 31, 2013 (deletions) (note 19.1) 31, 2014 31, 2013 for the year (note 19.1) 31, 2014 31, 2014
Land 58,751 - 50,572 109,323 - - - - 109,323 Buildings on freehold land 34,855 - - 34,855 25,435 2,276 - 27,711 7,144 Buildings on leasehold land 909 - - 909 290 30 - 320 589
94,515 - 50,572 145,087 25,725 2,306 - 28,031 117,056
20.1.1 Depreciation charge for the year has been allocated to administrative expenses. 20.1.2 Fair value of the investment property, based on the valuation carried out by an independent valuer, as at
December 31, 2015 is Rs. 849.277 million (2014: Rs. 694.700 million). The valuation is considered to be level 2 in the fair value hierarchy due to significant observable inputs used in the valuation. The different levels have been defined in note 49.4.
Valuation techniques used to derive level 2 fair values
Level 2 fair value of investment property has been derived using a sales comparison approach. Sale prices of comparable land and buildings in close proximity are adjusted for differences in key attributes such as location and size of the property. The most significant input into this valuation approach is price per square foot.
(Rupees in thousand) Note 2015 2014
20.2 Investment property - under development
This represents the under-construction “Packages Mall” Real Estate project: Civil works 3,163,003 532,191 Equipments 612,746 -Unallocated expenditure 20.2.1 811,045 330,046 Advance to suppliers 36,745 21,606 Advances against services 350,697 165,515
4,974,236 1,049,358

169
169
ANNUAL REPORT OF PACKAGES LIMITED 2015CONSOLIDATED FINANCIAL STATEMENTS 2015
(Rupees in thousand) Note 2015 2014
20.2.1 This includes following expenses capitalised to date:
Salaries, wages and benefits 20.2.1.1 145,606 33,513 Consultancy fee 465,888 186,023 Legal and professional charges 98,498 94,541 Travelling 44,209 11,167 Insurance 13,014 2,239 Communications 1,930 460 Borrowing costs 20.2.1.2 35,330 - Miscellaneous expenses 6,570 2,103
811,045 330,046 20.2.1.1 Salaries, wages and benefits include Rs. 1.374 million (2014: Rs. 0.558 million), Rs. 0.612 million (2014: Rs.
0.106 million) and Rs. 5.454 million (2014: Rs. 0.471 million) respectively, in respect of contribution by the Group towards provident fund, gratuity fund and pension fund and Nil (2014: Rs. 0.388 million) in respect of accumulating compensated absences.
20.2.1.2 This represents borrowing costs in respect of long term finance as referred to in note 7.1.4 and that on interest
from loan from shareholder of the Parent Company as referred to in note 8 net off related temporary investment income.
20.2.2 In the absence of current prices in an active market, the fair value is determined by considering the aggregate
of the estimated cash flows expected to be received from renting out the property less the estimated costs to complete and the estimated operating expenses.
The Group has determined the fair value as on December 31, 2015 by internally generated valuation model
instead of involving independent professionally qualified valuer. The valuation is considered to be level 3 in the fair value hierarchy due to unobservable inputs used in the valuation. The major assumptions used in valuation model and valuation result at balance sheet date are as follows:
2015 2014
Gross buildable area (sq ft) 1,185,369 1,185,369 Estimated costs to complete (Rs. in million) 11,653 9,687 Gross rentable area (sq ft) 555,370 555,370 Rent rates assumed per sq ft (Rs.) 75-450 350-425 Inflation in rent and operating costs 7.50% 7.50% Discount rate (%) 14% 14% Fair value (Rs. in million) 9,392 3,611

170
170
Computer software and (Rupees in thousand) Note Goodwill ERP system Total
21. Intangible assets
Year ended December 31, 2015Cost As at January 1, 2015 - 207,558 207,558 Additions 21.2 169,745 992 170,737 Deletions - (210) (210) Exchange differences (44,109) - (44,109)
As at December 31, 2015 125,636 208,340 333,976 Accumulated amortisation As at January 1, 2015 - (164,499) (164,499) Amortisation for the year 21.1 - (19,250) (19,250) Deletions - 210 210
As at December 31, 2015 - (183,539) (183,539)
125,636 24,801 150,437 Year ended December 31, 2014 Cost As at January 1, 2014 - 187,346 187,346 Additions - 21,091 21,091 Deletions - (879) (879)
As at December 31, 2014 - 207,558 207,558 Accumulated amortisation As at January 1, 2014 - (148,263) (148,263) Amortisation for the year 21.1 - (17,115) (17,115) Deletions - 879 879
As at December 31, 2014 - 164,499 164,499
- 43,059 43,059
(Rupees in thousand) Note 2015 2014
21.1 The amortisation charge for the year has been allocated as follows:
Cost of sales 31 9,733 7,329 Administrative expenses 32 9,517 9,786
19,250 17,115
21.2 Impairment test for Goodwill
For the purpose of annual impairment testing, goodwill is allocated to the operating segments expected to benefit from the synergies of the business combination in which the goodwill arises, as follow:
Flexible Packages Convertors (Proprietary) Limited, South African project The recoverable amount of the South African project is determined on the discounted cash-flow basis.
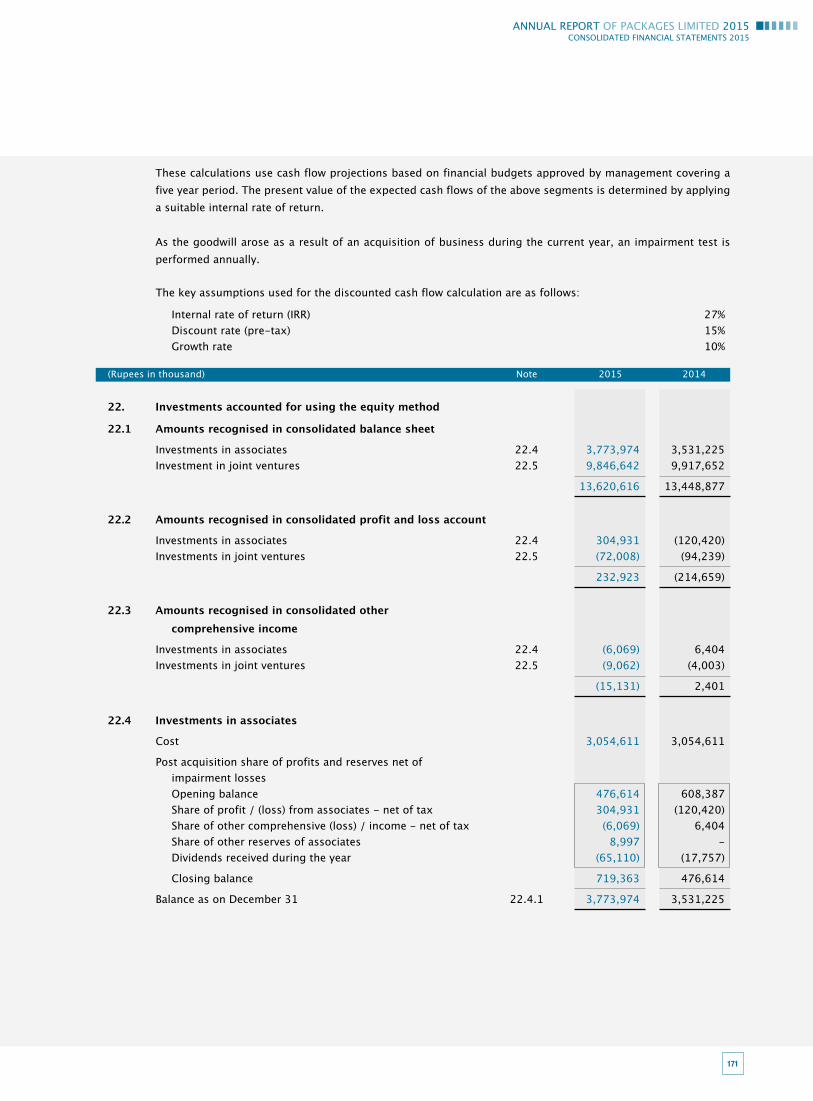
171
171
ANNUAL REPORT OF PACKAGES LIMITED 2015CONSOLIDATED FINANCIAL STATEMENTS 2015
These calculations use cash flow projections based on financial budgets approved by management covering a five year period. The present value of the expected cash flows of the above segments is determined by applying a suitable internal rate of return.
As the goodwill arose as a result of an acquisition of business during the current year, an impairment test is
performed annually.
The key assumptions used for the discounted cash flow calculation are as follows:
Internal rate of return (IRR) 27% Discount rate (pre-tax) 15% Growth rate 10%
(Rupees in thousand) Note 2015 2014
22. Investments accounted for using the equity method
22.1 Amounts recognised in consolidated balance sheet
Investments in associates 22.4 3,773,974 3,531,225 Investment in joint ventures 22.5 9,846,642 9,917,652
13,620,616 13,448,877
22.2 Amounts recognised in consolidated profit and loss account
Investments in associates 22.4 304,931 (120,420)Investments in joint ventures 22.5 (72,008) (94,239)
232,923 (214,659)
22.3 Amounts recognised in consolidated other comprehensive income
Investments in associates 22.4 (6,069) 6,404 Investments in joint ventures 22.5 (9,062) (4,003)
(15,131) 2,401
22.4 Investments in associates Cost 3,054,611 3,054,611
Post acquisition share of profits and reserves net of impairment losses Opening balance 476,614 608,387 Share of profit / (loss) from associates - net of tax 304,931 (120,420) Share of other comprehensive (loss) / income - net of tax (6,069) 6,404 Share of other reserves of associates 8,997 - Dividends received during the year (65,110) (17,757)
Closing balance 719,363 476,614
Balance as on December 31 22.4.1 3,773,974 3,531,225

172
172
(Rupees in thousand) Note 2015 2014
22.4.1 Investments in equity instruments of associates - Quoted
IGI Insurance Limited 22.4.1.1
13,022,093 (2014: 13,022,093) fully paid ordinary shares of Rs. 10 each
Equity held 10.61% (2014: 10.61%) 1,313,389 1,211,651
Market value - Rs. 3,080.636 million (2014: Rs. 3,523.518 million)
Tri-Pack Films Limited
10,000,000 (2014: 10,000,000) fully paid ordinary shares of Rs. 10 each
Equity held 33.33% (2014: 33.33%) 2,460,585 2,319,574
Market value - Rs. 2,466.8 million (2014: Rs. 2,607.3 million)
IGI Investment Bank Limited 22.4.1.1
4,610,915 (2014: 4,610,915) fully paid ordinary shares of Rs. 10 each
Equity held 2.17% (2014: 2.17%) - -
Market value - Rs. 7.239 million (2014: Rs. 10.928 million)
3,773,974 3,531,225 22.4.1.1 The Group’s investment in IGI Insurance Limited and IGI Investment Bank Limited is less than 20% but they are
considered to be associates as per the requirement of IAS 28 ‘Investments in Associates’ because the Group has significant influence over the financial and operating policies of these companies through representation on the board of directors of these companies.
22.4.2 The summarised financial information of the associates of the Group, all of which are incorporated in Pakistan,
are as follows:
(Rupees in thousand) Assets Liabilities Revenues Profit / (loss)
December 31, 2015
IGI Insurance Limited 28,314,502 14,839,144 4,948,530 1,975,294
Tri-Pack Films Limited 11,314,925 9,201,123 11,954,171 498,191
IGI Investment Bank Limited 1,070,427 861,271 166,288 (180,016)
40,699,854 24,901,538 17,068,989 2,293,469
December 31, 2014
IGI Insurance Limited 25,957,637 13,633,357 2,697,207 1,427,633
Tri-Pack Films Limited 13,076,574 11,442,121 13,597,081 (199,646)
IGI Investment Bank Limited 1,218,775 829,603 164,025 14,725
40,252,986 25,905,081 16,458,313 1,242,712

173
173
ANNUAL REPORT OF PACKAGES LIMITED 2015CONSOLIDATED FINANCIAL STATEMENTS 2015
(Rupees in thousand) Note 2015 2014
22.5 Investment in joint ventures
Cost
Opening balance 10,011,843 10,011,843
Interest acquired in joint venture - Plastic Extrusions
(Proprietary) Limited:
Cost of investment 10,799 -
Reserves on date of transfer - -
10,799 -
Closing balance 10,022,642 10,011,843
Post acquisition share of profit/(loss) and reserves
Opening balance (94,191) 4,051
Share of loss from joint venture - net of tax (72,008) (94,239)
Share of other comprehensive loss from joint
venture - net of tax (9,062) (4,003)
Dividends received during the year (739) -
Closing balance (176,000) (94,191)
Balance as on December 31 22.5.1 9,846,642 9,917,652 22.5.1 Investments in equity instruments of joint ventures - Unquoted
Bulleh Shah Packaging (Private) Limited
709,718,013 (2014: 709,718,013) fully paid ordinary shares of Rs. 10 each
Equity held 65.00% (2014: 65.00%) 9,836,339 9,917,652
Plastic Extrusions (Proprietary) Limited
500 (2014: Nil) fully paid ordinary shares of ZAR 1 each
Equity held 50.00% (2014: 0.00%) 10,303 -
9,846,642 9,917,652

174
174
22.5.2 Interest in joint ventures
The following amounts represent the Group’s share of the assets and liabilities, income, expenses, profits and other results of the joint ventures:
At December 31, 2015 Bulleh Shah Plastic Packaging Extrusions (Private) (Proprietary)(Rupees in thousand) Limited Limited
Interest in joint venture 65.00% 50.00%Assets Non - current assets 11,557,802 5,396 Current assets 5,689,299 50,097 17,247,101 55,493 Liabilities Non - current liabilities 4,530,916 3,481 Current liabilities 3,899,540 31,332 8,430,456 34,813 Net Assets 8,816,645 20,680 Income 10,351,988 193,663 Expenses 10,427,538 187,695 (Loss)/profit for the year - net of tax (75,550) 5,968
Other comprehensive (loss) / income (6,256) 952 Total comprehensive (loss) / income (81,806) 6,920 Proportionateinterestinjointventure’scommitments 1,427,261 -
At December 31, 2014 Bulleh Shah Plastic Packaging Extrusions (Private) (Proprietary)(Rupees in thousand) Limited Limited
Interest in joint venture 65.00% 0.00%Assets Non - current assets 9,928,959 - Current assets 6,392,177 - 16,321,136 - Liabilities Non - current liabilities 3,303,950 - Current liabilities 4,118,734 - 7,422,684 - Net Assets 8,898,452 - Income 11,031,269 - Expenses 11,124,575 - Loss for the year - net of tax (93,306) -
Other comprehensive loss (4,003) - Total comprehensive loss (97,309) - Proportionateinterestinjointventure’scommitments 1,247,680 - There are no contingent liabilities relating to the Group’s interest in the joint ventures, and no contingent liabilities of the ventures themselves.

175
175
ANNUAL REPORT OF PACKAGES LIMITED 2015CONSOLIDATED FINANCIAL STATEMENTS 2015
(Rupees in thousand) Note 2015 2014
23. Other long term investments
Quoted
Nestle Pakistan Limited 23.1 & 23.2
3,649,248 (2014: 3,649,248) fully paid ordinary shares of Rs. 10 each Equity held 8.05% (2014: 8.05%) 28,464,134 33,208,156 Cost - Rs. 5,778.896 million (2014: Rs. 5,778.896 million) Unquoted 23.3
Tetra Pak Pakistan Limited 23.1
1,000,000 (2014: 1,000,000) fully paid non-voting ordinary shares of Rs. 10 each 10,000 10,000 Coca-Cola Beverages Pakistan Limited
500,000 (2014: 500,000) fully paid ordinary shares of Rs. 10 each Equity held 0.14% (2014: 0.14%) 4,706 4,706 Pakistan Tourism Development Corporation Limited
2,500 (2014: 2,500) fully paid ordinary shares of Rs. 10 each 25 25 Orient Match Company Limited
1,900 (2014: 1,900) fully paid ordinary shares of Rs. 100 each - -
14,731 14,731
28,478,865 33,222,887
23.1 Nestle Pakistan Limited and Tetra Pak Pakistan Limited are associated undertakings as per the Companies Ordinance, 1984, however, for the purpose of measurement, investments in others have been classified as available for sale as referred to in note 4.9.
23.2 As of December 31, 2015, an aggregate of 310,000 shares (2014: Nil) of Nestle Pakistan Limited having market
value Rs. 2,418 million (2014: Nil) have been pledged in favor of HBL Pakistan against issuance of SBLC in favor of HBL Bahrain as referred to in note 18.1.
23.3 Unquoted investments are measured at cost as it is not possible to apply any other valuation methodology.
(Rupees in thousand) Note 2015 2014
24. Long term loans and deposits
Considered good Loans to employees 24.1 4,803 4,755 Loan to SNGPL 24.2 32,800 49,200 Security deposits 20,732 17,313
58,335 71,268 Receivable within one year Loans to employees 28 (1,551) (1,507) Loan to SNGPL 28 (16,400) (16,400)
(17,951) (17,907)
40,384 53,361

176
176
24.1 These represent interest free loans to employees for purchase of motor cycles and cycles and are repayable in monthly installments over a period of 60 to 260 months.
Loans to employees aggregating Rs. 4.181 million (2014: Rs. 2.909 million) are secured by joint registration of
motor cycles in the name of employees and the Group. The remaining loans are unsecured. 24.2 This represents an unsecured loan given to Sui Northern Gas Pipelines Limited (SNGPL) for the development of
the infrastructure for the supply of natural gas to Bulleh Shah Packaging (Private) Limited, a joint venture entity. Mark up is charged at the rate of 1.5% per annum and is received annually. The remaining amount is receivable in 2 annual installments.
(Rupees in thousand) Note 2015 2014
25. Stores and spares
Stores [including in transit Rs. 15.037 million (2014: Rs. 12.216 million)] 262,997 274,996 Spares [including in transit Rs. 1.961 million
(2014: Rs. 0.952 million)] 276,553 274,509
539,550 549,505 26. Stock-in-trade Raw materials [including in transit Rs. 238.352 million
(2014: Rs. 247.900 million)] 1,666,601 1,843,408 Work-in-process 324,838 327,674 Finished goods 26.1 696,792 741,457 Goods purchased for resale 28,695 28,181
2,716,926 2,940,720 Provision for slow moving items 26.2 (1,580) (4,998)
2,715,346 2,935,722
26.1 Finished goods with a cost Rs. 47.455 million (2014: Rs. 26.176 million) are being valued at net realisable value of Rs. 38.995 million (2014: Rs. 23.443 million).
(Rupees in thousand) 2015 2014
26.2 Provision for slow moving items
Opening balance 4,998 1,116 Provision for the year - 5,325 Stocks written off against provision (3,418) (1,443)
Closing balance 1,580 4,998
(Rupees in thousand) Note 2015 2014
27. Trade debts
Considered good Related parties - unsecured 27.1 93,095 15,151 Others 27.2 2,780,927 2,042,201
2,874,022 2,057,352 Considered doubtful 27,622 40,554
2,901,644 2,097,906 Provision for doubtful debts 27.3 (27,622) (40,554)
2,874,022 2,057,352

177
177
ANNUAL REPORT OF PACKAGES LIMITED 2015CONSOLIDATED FINANCIAL STATEMENTS 2015
(Rupees in thousand) 2015 2014
27.1 Related parties - unsecured
Joint ventures Bulleh Shah Packaging (Private) Limited 59,935 14,105 Plastic Extrusions (Proprietary) Limited 27,383 -
Associate Tri-Pack Films Limited 5,777 1,046
93,095 15,151 These are in the normal course of business and are interest free.
27.2 Others include debts of Rs. 262.170 million (2014: Rs. 158.112 million) which are secured by way of bank guarantees and inland letters of credit.
(Rupees in thousand) 2015 2014
27.3 The movement in provision during the year is as follows:
Balance as at January 1 40,554 40,735 Provision for the year 8,246 13,863 Bad debts written off (21,178) (14,044)
Balance as at December 31 27,622 40,554
(Rupees in thousand) Note 2015 2014
28. Loans, advances, deposits, prepayments and other receivables
Current portion of loans to employees 24 1,551 1,507 Current portion of loan receivable from SNGPL 24 16,400 16,400 Advances - considered good To employees 28.1 25,572 8,427 To suppliers 33,914 56,271
59,486 64,698 Due from related parties - unsecured 28.2 1,019,428 1,215,261 Trade deposits 51,334 53,557 Security deposits 1,590 92 Letters of credit - margins, deposits, opening charges etc. - 8,971 Prepayments 35,221 18,719 Balances with statutory authorities Customs duty 9,301 21,966 Sales tax recoverable 92,462 26,409
101,763 48,375 Mark up receivable on: Loan to SNGPL 33 46 Term deposits and saving accounts 85 85
118 131
Other receivables - considered good 82,972 76,848
1,369,863 1,504,559

178
178
28.1 Included in advances to employees are amounts due from executives of Rs. 1.654 million (2014: Rs. 1.129 million).
(Rupees in thousand) 2015 2014
28.2 Due from related parties - unsecured
Joint venture
Bulleh Shah Packaging (Private) Limited 1,004,997 1,212,881
Associates
IGI Finex Securities Limited 11 - IGI Insurance Limited 11,970 999 IGI Life Insurance Limited 1,599 283 Tri-Pack Films Limited 174 286
Others
DIC Asia Pacific Pte Limited 677 812
1,019,428 1,215,261 These are in the normal course of business and are interest free.
(Rupees in thousand) Note 2015 2014
29. Income tax receivable
Income tax refundable 2,506,110 2,305,172 Income tax recoverable 29.1 36,013 36,013 2,542,123 2,341,185
29.1 In 1987, the then Income Tax Officer (ITO) re-opened the Parent Company’s assessments for the accounting
years ended December 31, 1983 and 1984 disallowing primarily tax credit given to the Parent Company under section 107 of the Income Tax Ordinance, 1979. The tax credit amounting to Rs. 36.013 million on its capital expenditure for these years was refused on the grounds that such expenditure represented an extension of the Parent Company’s undertaking which did not qualify for tax credit under this section in view of the the Parent Company’s location. The assessments for these years were revised by the ITO on these grounds and taxes reassessed were adjusted against certain sales tax refunds and the tax credits previously determined by the ITO and set off against the assessments framed for these years.
The Parent Company had filed an appeal against the revised orders of the ITO before the then Commissioner of
Income Tax (Appeals) [CIT(A)], Karachi. CIT(A) in his order issued in 1988, held the assessments reframed by the ITO for the years 1983 and 1984 presently to be void and of no legal effect. The ITO has filed an appeal against the CIT(A)’s order with the then Income Tax Appellate Tribunal (ITAT). The ITAT has in its order issued in 1996 maintained the order of CIT(A). The assessing officer after the receipt of the appellate order passed by CIT(A), had issued notices under section 65 of the Income Tax Ordinance, 1979 and the Parent Company had filed a writ petition against the aforesaid notices with the High Court of Sindh, the outcome of which is still pending.
The amount recoverable Rs. 36.013 million represents the additional taxes paid as a result of the disallowance
of the tax credits on reframing of the assessments.

179
179
ANNUAL REPORT OF PACKAGES LIMITED 2015CONSOLIDATED FINANCIAL STATEMENTS 2015
(Rupees in thousand) Note 2015 2014
30. Cash and bank balances
At banks:
On deposit accounts [including ZAR 972,360 (2014: ZAR Nil)] 30.1 158,217 80,924 On saving accounts 20,010 13,481 On current accounts [including USD 277,652 and ZAR 193,759 30.2 (2014: USD 17,284 and ZAR Nil)] 258,310 359,144
436,537 453,549 In hand 5,157 6,748
441,694 460,297 30.1 The balances in saving accounts bear mark-up which ranges from 4.0% to 5.15% (2014: 6.0% to 7.0%) per
annum.
30.2 Included in these are total restricted funds of Rs. 1.332 million (2014: Rs. 1.332 million) held as payable to TFC holders.
(Rupees in thousand) Note 2015 2014 31. Cost of sales
Cost of sales - own manufactured 31.1 17,162,641 15,604,149 Cost of sales - purchased for resale 31.2 145,132 78,410
17,307,773 15,682,559 31.1 Cost of sales - own manufactured
Materials consumed 12,594,280 11,250,414 Salaries, wages and amenities 31.1.1 1,380,407 1,115,466 Travelling 41,880 35,766 Fuel and power 756,370 1,164,062 Production supplies 370,347 370,342 Excise duty and sales tax 2,607 3,359 Rent, rates and taxes 31.1.2 7,357 132,519 Insurance 53,043 45,335 Repairs and maintenance 451,197 386,666 Packing expenses 383,580 334,398 Depreciation on owned assets 19.1.3 628,895 557,906 Depreciation on assets subject to finance lease 19.2.1 34,355 1,039 Amortisation of intangible assets 21.1 9,733 7,329 Technical fee and royalty 31.1.3 98,174 89,738 Other expenses 302,915 235,628
17,115,140 15,729,967 Opening work-in-process 327,674 342,748 Closing work-in-process (324,838) (327,674)
Cost of goods produced 17,117,976 15,745,041 Opening stock of finished goods 741,457 600,565
17,859,433 16,345,606 Closing stock of finished goods (696,792) (741,457)
17,162,641 15,604,149

180
180
Cost of goods produced includes Rs. 1,599.427 million (2014: Rs. 2,106.354 million) for stores and spares consumed, Rs. 55.254 million (2014: Rs. 18.827 million) and Rs. 6.226 million (2014: Rs. 16.280 million) for raw material and stores and spares written off respectively.
(Rupees in thousand) 2015 2014
31.1.1 Salaries, wages and amenities
Salaries, wages and amenities include following in respect of retirement benefits: Gratuity Current service cost 10,995 10,402 Net interest on net defined benefit liability / asset (2,576) (1,204)
8,419 9,198 In addition to above, salaries, wages and amenities include Rs. 23.121 million (2014: Rs. 19.525 million),
Rs. 37.497 million (2014: Rs. 31.079 million) and Rs. 34.143 million (2014: Rs. 35.571 million) in respect of provident fund contribution, pension fund contribution and accumulating compensated absences respectively.
31.1.2 Rent, rates and taxes include operating lease / ijarah rentals amounting to Nil (2014: Rs. 145.921 million). 31.1.3 Technical fee and royalty includes fee for services received from related party amounting to Rs. 71.552 million
(2014: Rs. 63.241 million). (Rupees in thousand) 2015 2014
31.2 Cost of sales - purchased for resale
Purchases 145,646 105,694 Opening stock of goods purchased for resale 28,181 897 Closing stock of goods purchased for resale (28,695) (28,181)
145,132 78,410
(Rupees in thousand) Note 2015 2014
32. Administrative expenses Salaries, wages and amenities 32.1 617,393 474,591 Travelling 47,582 52,376 Rent, rates and taxes 32.2 75,369 73,286 Insurance 20,809 13,275 Printing, stationery and periodicals 26,569 21,549 Postage, telephone and telex 19,370 16,576 Motor vehicles running 8,917 16,594 Computer charges 19,975 21,293 Professional services 32.3 127,843 128,798 Repairs and maintenance 20,540 30,966 Depreciation on owned assets 19.1.3 44,093 31,594 Depreciation on assets subject to finance lease 19.2.1 3,264 2,548 Amortisation of intangible assets 21.1 9,517 9,786 Depreciation on investment property 20.1 2,952 2,306 Security services 3,433 3,634 Other expenses 32.4 88,160 76,447
1,135,786 975,619
Administrative expenses include Rs. 83.545 million (2014: Rs. 65.361 million) for stores and spares consumed.

181
181
ANNUAL REPORT OF PACKAGES LIMITED 2015CONSOLIDATED FINANCIAL STATEMENTS 2015
(Rupees in thousand) 2015 2014
32.1 Salaries, wages and amenities
Salaries, wages and amenities include following in respect of retirement benefits:
Pension
Net interest on net defined benefit liability / asset (6,117) 72
Gratuity
Current service cost 4,859 4,153 Net interest on net defined benefit liability / asset (1,239) (481)
3,620 3,672
In addition to above, salaries, wages and amenities include Rs. 11.289 million (2014: Rs. 8.245 million), Rs. 18.323 million (2014: Rs. 13.177 million) and Rs. 16.695 million (2014: Rs. 19.032 million) in respect of provident fund contribution, pension fund contribution and accumulating compensated absences respectively.
32.2 Rent, rates and taxes include operating lease rentals amounting to Rs. 10.287 million (2014: Rs. 9.917
million). (Rupees in thousand) 2015 2014
32.3 Professional services
The charges for professional services include the following in respect of auditors’ services for:
Statutory audit 6,427 4,002 Half yearly review 1,850 1,245 Tax services 14,752 4,855 Advisory services - 12,500 Workers’ profit participation fund audit, management staff pension and gratuity fund audit, audit of consolidated financial statements and other certification charges 2,154 1,245 Out of pocket expenses 1,100 961
26,283 24,808 32.4 Others include penalty paid to the Collector of Customs aggregating to Rs. 0.125 million (2014: Rs. 0.760
million).
(Rupees in thousand) Note 2015 2014
33. Distribution and marketing costs
Salaries, wages and amenities 33.1 303,334 177,448 Travelling 56,171 44,022 Rent, rates and taxes 33.2 9,314 8,523 Freight and distribution 176,777 166,419 Insurance 35,216 24,019 Advertising 262,624 183,269 Depreciation on owned assets 19.1.3 8,738 7,884 Depreciation on assets subject to finance lease 19.2.1 261 65 Provision for doubtful debts - net 9,634 3,385 Bad debts written off 1,438 2,442 Other expenses 31,553 58,752
895,060 676,228

182
182
Distribution and marketing costs include Rs. 19.876 million (2014: Rs. 11.435 million) for stores and spares consumed.
(Rupees in thousand) 2015 2014
33.1 Salaries, wages and amenities
Salaries, wages and amenities include following in respect of retirement benefits:
Gratuity
Current service cost 2,150 1,597 Net interest on net defined benefit liability / asset (504) (185)
1,646 1,412 In addition to above, salaries, wages and amenities include Rs. 4.611 million (2014: Rs. 3.271 million), Rs. 7.486 million (2014: Rs. 5.231 million) and Rs. 6.821 million (2014: Rs. 7.523 million) in respect of provident fund contribution, pension fund contribution and accumulating compensated absences respectively.
33.2 Rent, rates and taxes include operating lease rentals amounting to Rs. 8.699 million (2014: Rs. 7.67 million).
(Rupees in thousand) Note 2015 2014
34. Other operating expenses
Worker’s profit participation fund 16.4 230,337 166,622 Workers’ welfare fund 16.5 87,716 63,176 Exchange loss - net 41,279 - Impairment of property, plant and equipment 12,051 - Assets written off 93 -Advances written off 9,809 - Donations 34.1 10,416 18,790
391,701 248,588
34.1 Following is the interest of directors in the donee during the year:
Name of donee Director of the Group Interest in Rupees in donee thousand
Pakistan Centre for Philanthropy Syed Hyder Ali Director 1,250Packages Foundation Syed Hyder Ali Trustee 8,980 Rizwan Ghani Trustee No other directors and their spouses had any interest in any of the donees during the year.

183
183
ANNUAL REPORT OF PACKAGES LIMITED 2015CONSOLIDATED FINANCIAL STATEMENTS 2015
(Rupees in thousand) Note 2015 2014
35. Other income
Income from financial assets Income on bank deposits 6,804 5,013 Interest charged on trade and other receivables 2,257 - Interest on loan to SNGPL 725 976
9,786 5,989 Income from non-financial assets
Rental income from investment property 35.1 51,484 48,093 Profit on disposal of property, plant and equipment 71,850 85,117 Scrap sales 12,130 44,847
135,464 178,057 Others
Insurance commission from related party 5,528 3,197 Provisions and unclaimed balances written back 56,252 46,706 Net gain on insurance claim 21,075 - Exchange gain - 15,060 Gain on remeasurement of financial instrument - 27,272 Rebate income [including Nil (2014: Rs. 0.974 million) from related party] 13,997 12,846 Others 29,558 35,084
126,410 140,165
271,660 324,211 35.1 The expenses relating directly to the income from investment property amount to Rs. 0.371 million (2014: Rs.
0.386 million). 35.2 The future minimum lease payments receivable under non-cancellable operating leases are as follows: (Rupees in thousand) 2015 2014
Not later than one year 7,881 25,752 Later than one year and not later than five years 1,440 6,271
9,321 32,023
(Rupees in thousand) 2015 2014 36. Finance costs
Interest and mark up including commitment charges on: Long term finances - secured Local currency loans 191,537 302,293 Foreign currency loans 45,995 - Finances under mark up arrangements - secured 138,603 174,550 Liabilities against assets subject to finance lease 22,522 2,193 Return on preference shares / convertible stock 336,050 355,050 Loan handling charges 232 1,232 Commission on guarantees 14,932 1,206 Bank charges 7,952 4,596
757,823 841,120

184
184
37. Investment Income
This represents dividend income from other long term investments as referred in note 23.
(Rupees in thousand) Note 2015 2014
38. Tax
Current
Current year 38.1 614,582 466,155 Prior years 97,763 109,723
712,345 575,878 Deferred 355,505 (258,612)
1,067,850 317,266 38.1 The investment tax credit amounting to Rs. 57.752 million (2014: Rs. 54 million) available to the Group by virtue
of investment in plant and machinery in accordance with Section 65B of the Income Tax Ordinance, 2001 has been netted off against the current tax charge for the year.
For the purposes of current taxation, the tax losses available for carry forward as at December 31, 2015 are
estimated approximately at Rs. 127.400 million (2014: Rs. 611.048 million). Percentage 2015 2014
38.2 Tax charge reconciliation
Numerical reconciliation between the average effective tax rate and the applicable tax rate Applicable tax rate 32.00 33.00 Tax effect of amounts that are: Associates and joint ventures results reported net of tax 1.40 2.69 Differences in overseas taxation rates (0.59) (0.86) Asset for share transaction of foreign subsidiary 6.16 - Not deductible for tax purposes 2.21 2.17 Deductible for tax purposes (0.63) (0.88) Exempt for tax purposes (1.14) (0.54) Chargeable to tax at different rates (13.21) (20.24)Effect of change in prior years’ tax 2.19 3.72 Tax credits and losses in respect of which no deferred tax asset has been recognised 0.19 (5.96)Tax credits and losses recognised during the year (3.24) - Investment tax credit (1.42) (1.99)
(8.08) (21.89)
Average effective tax rate charged to consolidated profit and loss account 23.92 11.11

185
185
ANNUAL REPORT OF PACKAGES LIMITED 2015CONSOLIDATED FINANCIAL STATEMENTS 2015
39. Remuneration of Chief Executive, Directors and Executives
39.1 The aggregate amount charged in the consolidated financial statements for the year for remuneration, including certain benefits, to the Chief Executive, full time working Directors and Executives of the Group are as follows:
Chief Executive Directors Executives (Rupees in thousand) 2015 2014 2015 2014 2015 2014
Short term employee benefits
Managerial remuneration 16,819 14,583 7,209 14,982 207,517 155,617 Housing 6,786 5,811 2,806 8,495 83,755 76,804 Utilities 1,508 1,291 623 1,419 19,852 17,198 Bonus 16,643 3,767 6,985 3,179 101,332 45,158 Leave passage 4,498 4,545 521 2,089 6,453 6,328 Medical expenses 3,159 2,152 119 228 2,498 1,772 Club expenses 33 28 17 320 4,459 2,374 Others - - - - 48,860 37,829
49,446 32,177 18,280 30,712 474,726 343,080 Post employment benefits
Contribution to provident, gratuity and pension funds 5,271 4,456 2,159 3,021 43,548 36,703
Other long term benefits
Accumulating compensated absences 3,694 2,432 886 502 13,401 16,762
58,411 39,065 21,325 34,235 531,675 396,545
Number of persons 1 1 1 3 111 107
The Group also provides the Chief Executive and some of the Directors and Executives with free transport and residential telephones.
39.2 Remuneration to other directors Aggregate amount charged in the consolidated financial statements for the year for fee to 5 non-executive directors (2014: 5 non-executive directors) is Rs. 2,775,000 (2014: Rs. 1,700,000).

186
186
40. Transactions with related parties
The related parties comprise joint ventures, associates, directors, key management personnel and post employment benefit plans. The Group in the normal course of business carries out transactions with various related parties. Amounts due from and to related parties are shown under receivables and payables, amounts due from directors and key management personnel are shown under receivables and remuneration of directors and key management personnel is disclosed in note 39. Other significant transactions with related parties are as follows:
Relationship with the Nature of transactions 2015 2014 Group (Rupees in thousand)
i. Joint ventures Purchase of goods and services 2,649,621 2,736,923 Sale of goods and services 293,715 477,276 Purchase of property, plant & equipment 437 - Sale of property, plant & equipment 47,719 - Rental and other income 57,242 64,424
ii. Associates Purchase of goods and services 1,051,131 1,200,771 Sale of goods and services 9,604 12,444 Sale of property, plant & equipment 1,834 - Insurance premium 164,007 139,200 Commission earned 5,528 3,197 Insurance claims received 1,177 1,463 Rental and other income 573 458 Dividend income 65,110 17,757 Expenses incurred on behalf of the associate - 283
iii. Other related parties Purchase of goods and services 301,892 239,654 Sale of goods and services - 703 Royalty and technical fee 71,552 63,241 Rebate received - 974 Disbursement of loan from shareholder of Parent Company 600,000 - Repayment of loan to shareholder of Parent Company 100,000 -
iv. Post employment benefit Expense charged in respect of plans retirement benefit plans 98,445 98,102 All transactions with related parties have been carried out on mutually agreed terms and conditions.
There are no transactions with key management personnel other than under the terms of employment.
41. Capacity and production - tons Capacity Actual production 2015 2014 2015 2014
Paper and paperboard produced 41,400 41,400 11,131 10,116 Paper and paperboard converted 45,526 45,526 34,510 32,511 Plastics all sorts converted 29,758 20,000 26,815 17,553 Inks produced 11,048 11,060 8,748 8,210 Flexible packaging material - meters ‘000’ 90,000 90,000 53,800 48,493
The variance of actual production from capacity is primarily on account of the product mix.

187
187
ANNUAL REPORT OF PACKAGES LIMITED 2015CONSOLIDATED FINANCIAL STATEMENTS 2015
2015 2014 42. Number of employees
Total number of employees as at December 31 2,049 1,881 Average number of employees during the year 1,965 1,886
43. Rates of exchange
Liabilities in foreign currencies have been translated into PAK Rupees at USD 0.9542 (2014: USD 0.9940), EURO 0.8731 (2014: EURO 0.8172), CHF 0.9437 (2014: CHF 0.9828), SEK 8.0257 (2014: SEK 7.6982), GBP 0.6437 (2014: GBP 0.6384), SGD 1.3490 (2014: SGD 1.3134), YEN 114.8633 (2014: YEN 118.7366), SLR 129.7522 (2014: SLR 129.7522) and ZAR 6.783 (2014: Nil) equal to Rs. 100. Assets in foreign currencies have been translated into PKR at USD 0.9560 (2014: USD 0.9960), SLR 129.7522 (2014: SLR 129.7522) and ZAR 6.783 (2014: Nil) equal to Rs. 100.
(Rupees in thousand) Note 2015 2014
44. Cash generated from operations
Profit before tax 4,464,508 2,856,873
Adjustments for: Depreciation on owned assets 19.1.3 681,726 597,384 Gain on remeasurement of financial instrument 35 - (27,272) Depreciation on assets subject to finance lease 19.2.1 37,880 3,652 Depreciation on investment property 20.1 2,952 2,306 Amortisation on intangible assets 21.1 19,250 17,115 Provision for accumulating compensated absences 58,892 64,300 Provision for retirement benefits 11 7,568 14,355 Provision for doubtful debts 27.3 8,246 13,863 Exchange adjustments (340,351) (29,299) Net profit on disposal of property, plant and equipment 35 (71,850) (85,117) Impairment of property, plant and equipment 34 12,144 - Advances written off 34 9,809 - Finance costs 36 757,823 841,120 Dividend income 37 (2,387,359) (2,444,434) Share of profit of investments accounted for under equity method - net of tax (232,923) 214,659
Profit before working capital changes 3,028,315 2,039,505
Effect on cash flow due to working capital changes: Decrease in stores and spares 9,955 76,759 Decrease / (increase) in stock-in-trade 537,505 (114,429) (Increase) / decrease in trade debts (233,044) 29,784 Decrease in loans, advances, deposits, prepayments and other receivables 124,887 20,226 Increase in trade and other payables 633,450 359,421
1,072,753 371,761
4,101,068 2,411,266

188
188
(Rupees in thousand) Note 2015 2014
45. Cash and cash equivalents
Cash and bank balances 30 441,694 460,297 Finances under mark up arrangements - secured 15 (1,183,699) (1,607,583)
(742,005) (1,147,286)
2015 2014
46. Earnings per share
46.1 Basic earnings per share
Profit for the year Rupees in thousand 3,300,944 2,409,971 Weighted average number of ordinary shares Numbers 88,069,915 84,864,436 Earnings per share Rupees 37.48 28.40
46.2 Diluted earnings per share
Profit for the year Rupees in thousand 3,300,944 2,409,971 Return on preference shares / convertible stock - net of tax Rupees in thousand 270,990 284,248
3,571,934 2,694,219 Weighted average number of ordinary shares Numbers 88,069,915 84,864,436 Weighted average number of notionally converted preference shares / convertible stock Numbers 17,996,431 21,201,910
106,066,346 106,066,346 Diluted earnings per share Rupees 33.68 25.40
47. Segment Information
A business segment is a group of assets and operations engaged in providing products that are subject to risk and returns that are different from those of other business segments. Types of Segments Nature of business Packaging Manufacture and market packing products Consumer Products Manufacture and market consumer and tissue products Ink Manufacture and market industrial and commercial ink products Real Estate Construction and development of real estate General & Others Workshop and other general business

189
189
ANNUAL REPORT OF PACKAGES LIMITED 2015CONSOLIDATED FINANCIAL STATEMENTS 2015
Cons
umer
Pro
duct
s
Pa
ckag
ing
Div
isio
n D
ivis
ion
Ink
Div
isio
n Re
al E
stat
e G
ener
al &
Oth
ers
Tota
l(R
upee
s in
thou
sand
) 20
15
2014
20
15
2014
20
15
2014
20
15
2014
20
15
2014
20
15
2014
Tota
l rev
enue
1
6,56
9,17
4
13,9
95,7
13
3,2
53,4
30
2,7
21,0
28
3,4
42,7
90
3,1
87,5
54
-
-
284
,298
2
16,7
74
23,5
49,6
92
20,1
21,0
69
Inte
rseg
men
t rev
enue
4
43,8
63
402
,643
8
,576
1
1,53
1
904
,828
8
52,6
23
-
-
1
31,7
16
127
,271
1
,488
,983
1
,394
,067
Reve
nue
from
ext
erna
l cus
tom
ers
16,
125,
311
13
,593
,070
3
,244
,854
2
,709
,497
2
,537
,962
2
,334
,931
-
-
1
52,5
82
89,
503
22,
060,
709
18,
727,
002
Inte
rest
reve
nue
4,6
88
1,2
78
-
-
-
-
3,2
12
420
1
,886
4
,291
9
,786
5
,989
Inte
rest
exp
ense
16
1,10
2 1
03,1
84
17,
591
15,
709
30,
529
59,
306
-
-
548
,601
6
62,9
21
757
,823
8
41,1
20
Depr
eciat
ion
and
amor
tisat
ion
538
,851
4
84,8
10
97,
687
8
1,35
5
22,
617
2
4,00
8
2,6
68
2,1
94
79,
985
2
8,09
0
741
,808
6
20,4
57
Segm
ent p
rofit
/ (lo
ss) b
efor
e ta
x 1
,674
,627
9
87,0
20
464
,715
3
4,48
9
486
,178
3
53,1
28
(70,
196)
(4
0,08
2)
1,9
05,8
23
1,8
44,4
53
4,4
61,1
47
3,1
79,0
08
Segm
ent t
ax
469
,128
1
42,9
03
32,
989
2
5,20
4
153
,830
1
07,5
39
2,0
83
4
346
,030
7
0,97
8
1,0
04,0
60
346
,628
Segm
ent p
rofit
/ (lo
ss) a
fter t
ax
1,2
05,4
99
844
,117
4
31,7
26
9,2
85
332
,348
2
45,5
89
(72,
279)
(4
0,08
6)
1,5
59,7
93
1,7
73,4
75
3,4
57,0
87
2,8
32,3
80
Segm
ent a
sset
s 8
,449
,722
6
,568
,797
1
,427
,980
1
,385
,332
1
,310
,250
1
,265
,593
5
,107
,501
1
,076
,708
1
,145
,445
9
34,2
13
17,4
40,8
98
11,2
30,6
43

190
190
(Rupees in thousand) 2015 2014
47.1 Reconciliation of segment profit
Total profit for reportable segments 4,461,147 3,179,008 Net income / (loss) from associates and joint ventures 167,074 (232,416)Intercompany adjustment (163,713) (89,719)
Profit before tax 4,464,508 2,856,873
47.2 Reconciliation of segment assets
Total assets for reportable segments 17,440,898 11,230,643 Intersegment assets (3,101,229) (1,111,613)Other corporate assets 49,081,905 51,938,465
Total assets 63,421,574 62,057,495
47.3 Reconciliation of segment tax
Total tax expense for reportable segments 1,004,060 346,628 Intercompany adjustment 63,790 (29,362)
Tax as per consolidated profit and loss account 1,067,850 317,266
47.4 Reconciliation of segment profit after tax
Total profit after tax for reportable segments 3,457,087 2,832,380 Intercompany adjustment for profit / (loss) before tax 3,361 (322,135)Intercompany adjustment for taxation (63,790) 29,362
Profit as per consolidated profit and loss account 3,396,658 2,539,607
47.5 Information by geographical area
Revenue Non - current assets(Rupees in thousand) 2015 2014 2015 2014
Afghanistan 21,780 40,731 - - Bahrain 14,302 158,632 - - Bangladesh 195,999 13,145 - - Indonesia 72 - - -Kenya 36,644 - - - Mauritius - - 135,939 - Oman - 5,671 - -Pakistan 18,315,501 17,193,824 9,120,280 5,051,675 South Africa 2,160,709 - 1,271,586 - Sri Lanka 1,309,811 1,307,194 341,407 397,555 UAE 5,891 7,804 - -
22,060,709 18,727,001 10,869,212 5,449,230
Sales are allocated to geographical areas according to the country of receiving the goods or providing services.

191
191
ANNUAL REPORT OF PACKAGES LIMITED 2015CONSOLIDATED FINANCIAL STATEMENTS 2015
47.6 Information about major customers
Included in the total revenue is revenue from four (2014: four) customers of the Group from the packaging (2014: packaging) segment which represents approximately Rs. 8,198.683 million (2014: Rs. 7,827.156 million) of the Group’s total revenue.
48. Business combinations
On June 01, 2015, the Group acquired all the assets and liabilities, of Flexco Investments Proprietary Limited, South Africa (‘Flexco’) in accordance with the ‘Sale of Business Agreement’ executed between the Group, Flexco, Michael Hoffman and Wayne Hoffman through Flexible Packages Convertors (Proprietary) Limited, (FPCPL) for an aggregate cash consideration of ZAR 122.409 million (equivalent to Rs. 1,038.947 million) and issuance of 83,863,636 shares by FPCPL of ZAR 1 per share. Pursuant to the acquisition, the Group effectively holds 55% shares in FPCPL. Further, the Group also has the right to exercise a call option for the remaining 45% shares in FPCPL, subject to fulfillment of certain conditions, after completion of four years from the acquisition of FPCPL.
(Rupees in thousand) Note
Acquisition date fair value of consideration paid Paid in cash (ZAR 122.409 million) 1,038,947 Fair value of ordinary shares issued (ZAR 83.863 million) 48.1 711,793
1,750,740 48.1 The fair value of the 83,863,636 shares issued on June 01, 2015, as part of the purchase consideration was
based on the par value of ZAR 1.00 per share (equivalent to Rs. 8.488 per share). (Rupees in thousand)
The assets and liabilities recognised as a result of the acquisition are as follows:
Property, plant and equipment 1,744,551 Intangible assets 1,341 Investments in joint ventures 10,799 Stock in trade 317,129 Trade debts 591,872 Cash and bank balances 10,023 Trade and other payables (584,994)Liabilities against assets subject to finance lease (388,486)Finances under mark up arrangements - secured (121,240)
Net identifiable assets acquired 1,580,995 Goodwill 169,745
Net assets acquired 1,750,740 Goodwill of Rs. 169.745 million arising from the acquisition consists largely of the synergies and economies of
scale expected from combining the operations of the entities, as well as from intangible assets which did not qualify for separate recognition. Goodwill is not deductible for income tax purposes.

192
192
(Rupees in thousand)
Purchase consideration – cash outflow
Outflow of cash to acquire subsidiary, net of cash acquired Cash consideration 1,038,947 Balances acquired Cash and bank balances (10,023) Finances under mark up arrangements - secured 121,240
111,217
Net outflow of cash – investing activities 1,150,164
Revenue and profit contribution
The acquired business contributed revenues of Rs. 2,161 million and net loss of Rs. 193 million to the Group for the period from 1 June to 31 December 2015.
49. Financial risk management
49.1 Financial risk factors
The Group’s activities expose it to a variety of financial risks: market risk (including currency risk, fair value interest rate risk, cash flow interest rate risk and price risk), credit risk and liquidity risk. The Group’s overall risk management programme focuses on the unpredictably of financial markets and seeks to minimise potential adverse effects on the Group’s financial performance. The Group uses derivative financial instruments to hedge certain risk exposures.
Risk management is carried out by the Group’s finance department under policies approved by the Board of
Directors. The Group’s finance department evaluates and hedges financial risks. The Board provides written principles for overall risk management, as well as written policies covering specific areas, such as foreign exchange risk, interest rate risk, credit risk, use of derivative financial instruments and non-derivative financial instruments, and investment of excess liquidity.
The Group’s overall risk management procedures to minimise the potential adverse effects of financial market
on the Group’s performance are as follows: (a) Market risk
(i) Foreign exchange risk
Foreign exchange risk is the risk that the fair value of future cash flows of a financial instrument shall fluctuate because of changes in foreign exchange rates.
The Group operates internationally and is exposed to foreign exchange risk arising from various currency
exposures, primarily with respect to the US dollar, the Euro and the Sri Lankan rupee. Foreign exchange risk arises from future commercial transactions and recognised assets and liabilities. Foreign exchange risk arises when future commercial transactions or recognised assets or liabilities or net investments in foreign operations that are denominated in a currency that is not the Group’s functional currency.
At December 31, 2015, if the Rupee had strengthened / weakened by 10% against the US dollar with all other
variables held constant, post-tax profit for the year would have been Rs. 21.617 million higher / lower (2014: Rs. 22.991 million higher / lower) mainly as a result of foreign exchange gains / losses on translation of US dollar-denominated financial assets and liabilities.

193
193
ANNUAL REPORT OF PACKAGES LIMITED 2015CONSOLIDATED FINANCIAL STATEMENTS 2015
At December 31, 2015, if the Rupee had strengthened / weakened by 10% against the Euro with all other variables held constant, post-tax profit for the year would have been Rs. 71.438 million higher / lower (2014: Rs. 82.493 million) higher / lower, mainly as a result of foreign exchange gains / losses on translation of Euro-denominated financial assets and liabilities.
At December 31, 2015, if the Rupee had strengthened / weakened by 10% against the Sri Lankan rupee with all other variables held constant, other component of equity would have been Rs. 71.268 million (2014: Rs. 68.749 million) lower / higher, mainly as a result of foreign exchange losses / gains on translation of net assets of Packages Lanka (Private) Limited, denominated in Sri Lankan Rupee.
At December 31, 2015, if the Rupee had strengthened / weakened by 10% against the South African Rand with
all other variables held constant, post-tax profit for the year would have been Rs. 6.432 million higher / lower (2014: Nil) mainly as a result of foreign exchange gains / losses on translation of Rand-denominated financial assets and liabilities.
(ii) Price risk
Price risk represents the risk that the fair value or future cash flows of a financial instrument will fluctuate because of changes in market prices (other than those arising from interest rate risk or currency risk), whether those changes are caused by factors specific to the individual financial instrument or its issuer, or factors affecting all similar financial instruments traded in the market. The Group is exposed to equity securities price risk because of investments held by the Group and classified as available for sale. The Group is not exposed to commodity price risk. To manage its price risk arising from investments in equity securities, the Group diversifies its portfolio. Diversification of the portfolio is done in accordance with the limits set by the board of directors.
The Group’s quoted investments in equity of other entities are publicly traded on Pakistan Stock Exchange. The table below summarises the impact of increases / decreases of the KSE-100 index on the Group’s post-tax
profit for the year and on equity. The analysis is based on the assumption that the KSE had increased / decreased by 10% with all other variables held constant and all the Group’s equity instruments moved according to the historical correlation with the index:
Impact on Impact on other post-tax profit components of equity(Rupees in thousand) 2015 2014 2015 2014
Pakistan Stock Exchange - - 1,366,278 (564,539)
Post-tax profit for the year would decrease / increase as a result of losses / gains on equity securities classified
as at fair value through profit or loss. Other components of equity would decrease / increase as a result of losses / gains on equity securities classified as available for sale.
(iii) Cash flow and fair value interest rate risk
As the Group has no significant floating interest rate assets, the Group’s income is substantially independent of changes in market interest rates.
The Group’s interest rate risk arises from short term and long term borrowings. These borrowings issued at
variable rates expose the Group to cash flow interest rate risk.

194
194
The Group analyses its interest rate exposure on a dynamic basis. Various scenarios are simulated taking into consideration refinancing, renewal of existing positions, alternative financing and hedging. Based on these scenarios, the Group calculates the impact on profit and loss of a defined interest rate shift. The scenarios are run only for liabilities that represent the major interest-bearing positions.
At December 31, 2015, if interest rates on floating rate borrowings had been 1% higher / lower with all other
variables held constant, post-tax profit for the year would have been Rs. 37.390 million (2014: Rs. 26.989 million ) lower / higher, mainly as a result of higher / lower interest expense on floating rate borrowings.
(b) Credit risk
Credit risk represents the risk of financial loss being caused if counter party fails to discharge an obligation.
Credit risk of the Group arises from cash and cash equivalents, derivative financial instruments and deposits with banks and financial institutions, as well as credit exposures to distributors and wholesale and retail customers, including outstanding receivables and committed transactions. The management assesses the credit quality of the customers, taking into account their financial position, past experience and other factors. Individual risk limits are set based on internal or external ratings in accordance with limits set by the board. The utilisation of credit limits is regularly monitored and major sales to retail customers are settled in cash. For banks and financial institutions, only independently rated parties with a strong credit rating are accepted.
The Group monitors the credit quality of its financial assets with reference to historical performance of such
assets and available external credit ratings. The carrying values of financial assets exposed to credit risk and which are neither past due nor impaired are as under:
(Rupees in thousand) 2015 2014
Long term loans and deposits 40,384 53,361 Trade debts 2,061,244 1,382,105 Loans, advances, deposits, prepayments and other receivables 1,173,393 1,372,767 Balances with banks 436,537 453,549
3,711,558 3,261,782 As of December 31, 2015, trade receivables of Rs. 812.778 million (2014: Rs. 675.247 million) were past due
but not impaired. These relate to a number of independent customers for whom there is no recent history of default. The aging analysis of these trade receivables is as follows:
(Rupees in thousand) 2015 2014
Up to 90 days 714,098 630,851 90 to 180 days 89,352 32,212 181 to 365 days 9,328 12,184
812,778 675,247 The management estimates the recoverability of trade receivables on the basis of financial position and past
history of its customers based on the objective evidence that it shall not receive the amount due from the particular customer. The provision is written off by the Group when it expects that it cannot recover the balance due. Any subsequent repayments in relation to amount written off, are credited directly to consolidated profit and loss account.

195
195
ANNUAL REPORT OF PACKAGES LIMITED 2015CONSOLIDATED FINANCIAL STATEMENTS 2015
The aging analysis of trade receivables from related parties as at balance sheet date is as follows:
(Rupees in thousand) 2015 2014 Up to 90 days 17,752 8,963 90 to 180 days 4,190 845 181 to 365 days 694 349
22,636 10,157
The credit quality of Group’s bank balances can be assessed with reference to external credit ratings as follows: Rating Rating Rating (Rupees in thousand) Short term Long term Agency 2015 2014
Bank Al-Habib Limited A1+ AA+ PACRA - 1,066 Bank Alfalah Limited A1+ AA PACRA 1,184 - Barclay’s Bank PLC Pakistan P-1 A2 Moody’s - 64 Citibank N.A. P-1 A2 Moody’s 357 204 Commercial Bank of Ceylon Limited Sri Lanka AA- Fitch 7 8 Deutsche Bank A.G. P-2 A3 Moody’s 70,981 85,065 Dubai Islamic Bank (Pakistan) Limited A1 A+ JCR-VIS - 712 Faysal Bank Limited A1+ AA PACRA 42,542 42,591 Habib Bank Limited A1+ AAA JCR-VIS 928 860 Al Baraka Bank (Pakistan) Limited A1 A PACRA 1 - Habib Bank Limited Sri Lanka A-1+ AAA JCR-VIS 171 759 Habib Bank Limited Mauritius A-1+ AAA JCR-VIS 10,963 - First National Bank South Africa A JCR-VIS 7,326 - Hatton Bank Limited Sri Lanka AA- Fitch 6,443 3,799 HSBC Bank Middle P-1 A2 Moody’s - JS Bank Limited A1+ A+ PACRA 282 78 MCB Bank Limited A1+ AAA PACRA 26,120 3,128 MCB Bank Limited Sri Lanka A+ AAA PACRA 120,934 105,869 Meezan Bank Limited A1+ AA JCR-VIS 1,971 111,684 National Bank of Pakistan A1+ AAA PACRA 26,079 3,758 NDB Bank AA- Fitch 28,837 9,336 NIB Bank Limited A1+ AA- PACRA 82,435 41,061 Samba bank A1 AA JCR-VIS 1,332 1,675 Standard Chartered Bank Pakistan Limited A1+ AAA PACRA 7,492 41,638 The Bank of Punjab A1+ AA- PACRA 152 194
436,537 453,549

196
196
(c) Liquidity risk
Liquidity risk represents the risk that the Group shall encounter difficulties in meeting obligations associated with financial liabilities.
Prudent liquidity risk management implies maintaining sufficient cash and marketable securities, the availability of funding through an adequate amount of committed credit facilities. Due to the dynamic nature of the Group’s businesses, the Group’s finance department maintains flexibility in funding by maintaining availability under committed credit lines.
Management monitors the forecasts of the Group’s cash and cash equivalents (note 45) on the basis of expected
cash flow. This is generally carried out in accordance with practice and limits set by the Group. These limits vary by location to take into account the liquidity of the market in which the entity operates. In addition, the Group’s liquidity management policy involves projecting cash flows in each quarter and considering the level of liquid assets necessary to meet its liabilities, monitoring balance sheet liquidity ratios against internal and external regulatory requirements and maintaining debt financing plans.
The table below analyses the Group’s financial liabilities and net-settled derivative financial liabilities into
relevant maturity groupings based on the remaining period at the balance sheet to the contractual maturity date. The amounts disclosed in the table are the contractual undiscounted cash flows as the impact of discounting is not significant.
At December 31, 2015 Less than 1 Between 1 Between 2 Over (Rupees in thousand) year and 2 years and 5 years 5 years
Long term finances 448,711 634,425 2,127,215 64,590 Liabilities against assets subject to finance lease 102,929 172,132 20,242 - Finances under mark up arrangements - secured 1,183,699 - - - Trade and other payables 4,784,041 - - - Accrued finance costs 367,612 - - -
6,886,992 806,557 2,147,457 64,590 At December 31, 2014 Less than 1 Between 1 Between 2 Over (Rupees in thousand) year and 2 years and 5 years 5 years
Long term finances 266,674 385,710 485,710 1,228,580 Liabilities against assets subject to finance lease 4,696 5,231 20,454 - Finances under mark up arrangements - secured 1,607,583 - - - Trade and other payables 3,561,912 - - - Accrued finance costs 526,943 - - -
5,967,808 390,941 506,164 1,228,580

197
197
ANNUAL REPORT OF PACKAGES LIMITED 2015CONSOLIDATED FINANCIAL STATEMENTS 2015
49.2 Financial instruments by categories
The carrying values of following financial assets and liabilities reflected in the consolidated financial statements approximate their fair values. Fair value is determined on the basis of objective evidence at reporting date.
Loans and receivables(Rupees in thousand) 2015 2014
Financial assets Long term loans and deposits 40,384 53,361 Trade debts 2,874,022 2,057,352 Loans, advances, deposits, prepayments and other receivables 1,173,393 1,372,767 Balances with banks 436,537 453,549
4,524,336 3,937,029
At amortised cost(Rupees in thousand) 2015 2014
Financial liabilities Long term finances - secured 3,274,941 2,566,695 Liabilities against assets subject to finance lease 295,303 30,381 Finances under mark up arrangements - secured 1,183,699 1,607,583 Trade and other payables 4,784,041 3,561,912 Accrued finance cost 367,612 526,943
9,905,596 8,293,514 49.3 Capital risk management
The Group’s objectives when managing capital are to safeguard the Group’s ability to continue as a going concern in order to provide returns for shareholders and benefits for other stakeholders and to maintain an optimal capital structure to reduce the cost of capital
The Group manages its capital structure and makes adjustments to it in the light of changes in economic
conditions. In order to maintain or adjust the capital structure, the Group may adjust the amount of dividends paid to shareholders or issue new shares. Consistent with the others in industry, the Group monitors capital on the basis of the gearing ratio. This ratio is calculated as net debt divided by total capital. Net debt is calculated as total borrowings including the current and non-current borrowings as disclosed in note 7 less cash and cash equivalents as disclosed in note 45. Total capital is calculated as equity as shown in the balance sheet plus net debt. The gearing ratio as at year end is as follows:
(Rupees in thousand) Note 2015 2014
Long term finances 7 5,762,485 4,428,836 Current portion of long term finances 7 448,711 266,674 Cash and cash equivalents 45 742,005 1,147,286
Net debt 6,953,201 5,842,796 Total equity 48,163,139 50,592,389
Total capital 55,116,340 56,435,185
Gearing ratio 13% 10%

198
198
49.4 Fair value of financial instruments
Fair value is the amount for which an asset could be exchanged, or liability settled, between knowledgeable willing parties in an arm’s length transaction. Underlying the definition of fair value is the presumption that the Group is a going concern without any intention or requirement to curtail materially the scale of its operations or to undertake a transaction on adverse terms. The carrying values of all financial assets and liabilities reflected in these consolidated financial statements approximate their fair values. Fair value is determined on the basis of objective evidence at each reporting date.
The carrying amount less impairment provision of trade receivables and payables are assumed to approximate their fair values. The fair value of financial liabilities for disclosure purposes is estimated by discounting the future contractual cash flows at the current market interest rate that is available to the Group for similar financial instruments.
Specific valuation techniques used to value financial instruments include:
- Quoted prices (unadjusted) in active markets for identical assets or liabilities (level 1)
- Inputs other than quoted prices included within level 1 that are observable for the asset or liability, either directly (that is, as prices) or indirectly (that is, derived from prices) (level 2)
- Inputs for the asset or liability that are not based on observable market data (that is, unobservable inputs) (level 3)
The following table presents the Group’s assets that are measured at fair value: At December 31, 2015(Rupees in thousand) Level 1 Level 2 Level 3 Total
Assets Recurring fair value measurement of available-for-sale investments 28,464,134 - - 28,464,134
At December 31, 2014(Rupees in thousand) Level 1 Level 2 Level 3 Total
Assets Recurring fair value measurement of available-for-sale investments 33,208,156 - - 33,208,156
Valuation techniques used to measure fair values
The fair value of financial instruments traded in active markets is based on quoted market prices at the balance sheet date. A market is regarded as active if quoted prices are readily and regularly available from an exchange, dealer, broker, industry group, pricing service, or regulatory agency, and those prices represent actual and regularly occurring market transactions on an arm’s length basis. The quoted market price used for financial assets held by the Group is the current bid price. These instruments are included in Level 1.The fair value of financial instruments that are not traded in an active market is determined by using valuation techniques. These valuation techniques maximise the use of observable market data where it is available and rely as little as possible on entity specific estimates. If all significant inputs required to fair value an instrument are observable, the instrument is included in Level 2. If one or more of the significant inputs is not based on observable market data, the instrument is included in Level 3.

199
199
ANNUAL REPORT OF PACKAGES LIMITED 2015CONSOLIDATED FINANCIAL STATEMENTS 2015
There were no other material Level 1, 2 or 3 assets or liabilities during current or prior year. There were no transfers between levels 1 and 2 for recurring fair value measurements during the year.
50. Detail of subsidiaries
Accounting Percentage Country of Name of the subsidiaries year end of holding incorporation
Anemone Holdings Limited December 31, 2015 100% Mauritius Calcipack (Private) Limited December 31, 2015 100% PakistanDIC Pakistan Limited December 31, 2015 54.98% Pakistan Packages Construction (Private) Limited December 31, 2015 99.99% PakistanPackages Lanka (Private) Limited December 31, 2015 79.07% Sri Lanka Flexible Packages Convertors (Proprietary) Limited February 29, 2016 55.00% South Africa
51. Date of authorisation for issue
These financial statements were authorised for issue on February 25, 2016 by the Board of Directors of the Parent Company.
52. Non-adjusting events after the balance sheet date On February 2, 2016, IFC exercised its right to convert 1,000,000 (2014: 1,000,000) preference share
/ convertible stock of Rs 190 each into 1,000,000 (2014: 1,000,000) ordinary shares of Rs. 10 each. This conversion is expected to take place prior to book closure date.
The Board of Directors has proposed a final cash dividend for the year ended December 31, 2015 of Rs. 15 per share (2014: Rs. 9.00 per share), at their meeting held on February 25, 2016 for approval of the members at the Annual General Meeting to be held on April 25, 2016. The Board has also recommended to transfer Rs. 1,500 million (2014: Rs. 1,500 million) to general reserve from unappropriated profit.
The Finance Act, 2015 introduced income tax at the rate of 10% on undistributed reserves where such reserves
of the Group are in excess of its paid up capital and the Group derives profits for a tax year but does not distribute requisite cash dividend within six months of the end of the said tax year. Liability in respect of such income tax, if any, is recognised when the prescribed time period for distribution of dividend expires.
53. Corresponding figures
Corresponding figures have been re-arranged and reclassified, wherever necessary, for the purposes of comparison. However, no significant reclassifications have been made.
Towfiq Habib Chinoy Syed Hyder Ali Rizwan Ghani Chairman Chief Executive & Managing Director Director

200
200
NOTES

201
201
ANNUAL REPORT OF PACKAGES LIMITED 2015CONSOLIDATED FINANCIAL STATEMENTS 2015
VIDEO CONFERENCE FACILITY
VIDEO CONFERENCE CONSENT FORM
In this regard, please fill the following form and submit to registered address of the Company 10 days before holding of the Annual General Meeting.
If the Company receives consent from members holding in aggregate 10% or more shareholding residing at a geographical location, to participate in the meeting through video conference at least 10 days prior to date of meeting, the Companywill arrange video conference facility in the city subject to availability of such facility in that city.
The Company will intimate members regarding venue of video conference facility at least 5 days before the date of the Annual General Meeting along with complete information necessary to enable them to access the facility.
I/We, ___________________________________________ of _________________________________________ being a member of
Packages Limited, holder of ____________________ Ordinary shares as per Register Folio No._________________ hereby
opt for video conference facility at ____________________.
_____________________Signature of member
202
202
AFFIX
CORRECT
POSTAGE
The Company Secretary
PACKAGES LIMITED4th Floor, The ForumSuite # 416 - 422G-20, Block 9, Khayaban-e-JamiClifton, Karachi - 75600
203
203
ANNUAL REPORT OF PACKAGES LIMITED 2015CONSOLIDATED FINANCIAL STATEMENTS 2015
اس سلسلےمیں برائے مہربانی مندرجہ ذیل فارم بھر کر اسے کمپنی کے رجسٹرڈ افس میں ساالنہ اجالس عام کے انعقاد سے 10دن قبل جمع کرا دیں۔اگر
کمپنی کو اجالس سے 10دن قبل کسی جغرافیائی جگہ پر رہائش پزیر ممبران جو 10فیصد یا اس سے زائد حصص کے حامل ہوں کی جانب سے رضامندی
موصول ہوتی ہے کہ وہ اجالس میں بذریعہ وڈیو کانفرنس شرکت کریں گے تو اس شہر میں وڈیو کانفرنس کا انتظام کر دیا جائے گاجس کا انحصار اس شہر
میں مذکورہ سہولت کی دستیابی پر ہو گا۔
کمپنی ساالنہ اجالس عام کے انعقاد سے 5دن قبل ممبران کو وڈیو کانفرنس سہولت کے مقام سے مطلع کر دے گی بمعہ ان تمام مکمل معلومات کے جو
انہیں مذ کورہ سہولت تک رسائی کے قابل کر سکیں۔
وڈیو کانفرنس کی سہولت
وڈیو کانفرنس رضامندی کا فارم
میں / ہم رہائشی
عام شئیر کا / کی حامل ، بحوالہ رجسٹرڈ فولیو نمبر پکیجز لمیٹڈ کا /کی ایک ممبر
بذریعہ وڈیو کانفرنس کی سہولت بمقام لینے کا انتخاب کرتا / کرتی ہوں۔
ممبر کے دستخط:

204
204
AFFIX
CORRECT
POSTAGE
The Company Secretary
PACKAGES LIMITED4th Floor, The ForumSuite # 416 - 422G-20, Block 9, Khayaban-e-JamiClifton, Karachi - 75600

205
205
ANNUAL REPORT OF PACKAGES LIMITED 2015CONSOLIDATED FINANCIAL STATEMENTS 2015
Pursuant to the allowance granted through SRO 787(I)/2014 of September 8, 2014, by the Securities Exchange Commission of Pakistan, the Company can circulate its annual balance sheet and profit and loss accounts, auditor’s report and directors’ report etc. (“Audited Financial Statements”) along with the Company’s Notice of Annual General Meeting through email to its shareholders. Those shareholders who wish to receive the Company’s Annual Report via email are requested to provide a completed consent form to the Company’s Share Registrar, FAMCO Associates (Pvt) Limited.
PLEASE NOTE THAT RECEIPT OF THE ANNUAL REPORT VIA EMAIL IS OPTIONAL AND NOT COMPULSORY.
ELECTRONIC TRANSMISSION CONSENT FORM
The Share Registrar Date:__________________FAMCO Associates (Pvt) Limited8F, Block 6, PECHS, Nursery,Next to Hotel Faran, Shahrah-e-Faisal,Karachi.
Pursuant to the directions given by the Securities Exchange Commission of Pakistan through its SRO 787(I)/2014 of September 8, 2014, I, Mr./Ms.____________________________S/o, D/o, W/o _______________________________ hereby consent to have Packages Limited’s Audited Financial Statements and Notice of Annual General Meeting delivered to me viaemail on my email address provided below:
Name of Member/ Shareholder _________________________________________________________________________________
Folio/ CDC Account Number ___________________________________________________________________________________
Email Address: _________________________________________________________________________________________________
It is stated that the above mentioned information is true and correct and that I shall notify the Company and its Share Registrar in writing of any change in my email address or withdrawal of my consent to email delivery of the Company’s Audited Financial Statements and Notice of Annual General Meeting.
_______________________________Signature of the Member/ Shareholder
ELECTRONIC TRANSMISSION CONSENT

206
206
AFFIX
CORRECT
POSTAGE
The Company Secretary
PACKAGES LIMITED4th Floor, The ForumSuite # 416 - 422G-20, Block 9, Khayaban-e-JamiClifton, Karachi - 75600

207
207
ANNUAL REPORT OF PACKAGES LIMITED 2015CONSOLIDATED FINANCIAL STATEMENTS 2015
اظہار رضا مندی بابت ترسیل برق روی
سیکیورٹیزایکسپینج اف پاکستان کے الیس ار او مورخہ 8 ستمبر 2014 کےبموجب سہولت مہیا کی گئی ہے کہ کمپنی اپنی ساالنہ بیلنس
شیٹ اور نفع ونقصان کے گوشوارے محاسب و نظمہ کی مرتب کردہ اطالعائی معلومات( پڑ تال شدہ مالیاتی حسابات) بشمول ساالنہ اجالس عام کی
اطالع اپنے حصص یا فتگا ن کو بذریعہ ای میل ارسال کرسکتی ہے ۔وہ تمام حصص داران جو کمپنی کی ساالنہ رپورٹ بذریعہ ای میل حاصل کرنے کے
خواہشمند ہیں ان سے التماس ہے کہ تکمیل شدہ رضامندی کے فارم کمپنی کے شیئر رجسڑار فیمکو ایسوسی ایٹس (پرائیویٹ)لمیٹڈ کو مہیاکریں۔
یاد دہانی رہے کہ ساال نہ پورٹ کی بذریعہ ای میل وصولی اختیا ری ہے الزمی نہیں ہے۔
اظہار رضا مندی بابت ترسیل برق روی
شیئر رجسڑار
فیمکو ایسوسی ایٹس(پرائیویٹ)لمیٹڈ
بالک پی ای سی ایچ ایس نر سری
نزد فاران ہوٹل شاہراہ فیصل
کراچی۔
سیکیورٹیز اینڈ ایکسچینج اف پاکستان کے ایس ار او مورخہ 8 ستمبر2014کی تعمیل کرتے ہو ئے میں مسمی/مسماة
پیکیجز لمیٹڈ کے پڑتال شدہ مالیاتی گوشوارے اور ساالنہ اجالس عام کی اطالع بذریعہ ای میل مندرجہ ذیل ای میل پتے پر حاصل کرنا چاہتا/چاہتی ہوں
ممبر/حصص دار کانام :
فو لیو سی ڈی سی اکا ونٹ نمبر
ای میل ایڈریس:
ہرگاہ اقرار کیا جاتا ہے کہ مندرجہ باال معلومات صحیح اور درست ہیں اور یہ کہ میںکمپنی اور اس کے شیئر رجسڑار کو تحریری طور پر ای میل ایڈریس
میں تبدیلی یا بذریعہ ای میل کمپنی کے پڑتال شدہ حسابات اورساالنہ اجالس عام کی اطالع کی وصولی یا منسوخی کے بارے میں مطلع کروں گا۔
ممبرحصص دارکے دستخط:
787(1)/2014
787(1)/2014
بتار یح:_____________________
8-F
ولد یت / زوجیت

208
208
AFFIX
CORRECT
POSTAGE
The Company Secretary
PACKAGES LIMITED4th Floor, The ForumSuite # 416 - 422G-20, Block 9, Khayaban-e-JamiClifton, Karachi - 75600
209
209
ANNUAL REPORT OF PACKAGES LIMITED 2015CONSOLIDATED FINANCIAL STATEMENTS 2015
FORM OF PROXY61st Annual General Meeting
I/We
of being a member of Packages Limited and
holder of Ordinary shares as per Shares Register Folio No. (Number of Shares)
and / or CDC Participant I.D. No. and Sub Account No.
hereby appoint of or failing him / her
of or failing him / her of as my proxy to vote for me and
on my behalf at the Annual General Meeting of the Company to be held on Monday, April 25, 2016 at 10:30
a.m. at Beach Luxury Hotel, Moulvi Tamizuddin Khan Road, Karachi and at any adjournment thereof.
Signed this day of 2016.
WITNESSES:
1. Signature : Name : Address :
CNIC or Passport No. :
2. Signature : Name : Address :
CNIC or Passport No.:
Note : Proxies, in order to be effective, must be received by the Company not less than 48 hours before the meeting. A proxy need not to be a member of the Company.
CDC Shareholders and their Proxies are requested to attach an attested photocopy of their Computerised National Identity Card or Passport with this proxy form before submission to the Company.
Signature
(Signature should agree with
the specimen signature
registered with the Company)
Please af f ix
Rupees five
revenue stamp

210
210
AFFIX
CORRECT
POSTAGE
The Company Secretary
PACKAGES LIMITED4th Floor, The ForumSuite # 416 - 422G-20, Block 9, Khayaban-e-JamiClifton, Karachi - 75600

211
211
ANNUAL REPORT OF PACKAGES LIMITED 2015CONSOLIDATED FINANCIAL STATEMENTS 2015
میں / ہم ۔۔۔۔۔۔۔۔۔۔۔۔۔۔۔۔۔۔۔۔۔۔۔۔۔۔۔۔۔۔۔۔۔۔۔۔۔۔۔۔۔۔۔۔۔۔۔۔۔۔۔۔۔۔۔۔۔۔۔۔۔۔۔۔۔۔۔۔۔۔۔۔۔۔۔۔۔۔۔۔۔۔۔۔۔۔۔۔۔۔۔۔۔۔۔۔۔۔۔۔۔۔۔۔۔۔۔۔۔۔
ساکن ۔۔۔۔۔۔۔۔۔۔۔۔۔۔۔۔۔۔۔۔۔۔۔۔۔۔۔۔۔۔۔۔۔۔۔۔۔۔۔۔۔۔۔۔۔۔۔۔۔۔۔۔۔۔۔۔۔۔۔۔۔۔۔۔۔۔۔۔۔۔۔۔۔۔۔۔۔۔۔۔۔۔۔۔۔۔۔۔۔۔۔۔۔۔۔۔۔۔۔بطور پیکیجز لمیٹڈ
رکن و حامل ۔۔۔۔۔۔۔۔۔۔۔۔۔۔۔۔۔۔۔۔۔۔۔۔۔۔۔۔۔۔۔۔۔۔۔۔۔۔۔۔۔۔۔عام حصص بمطا بق شیئر رجسٹرڈ فولیو نمبر۔۔۔۔۔۔۔۔۔۔۔۔۔۔۔۔۔۔۔۔۔۔۔۔۔۔۔۔۔۔۔۔
اور یا سی ڈی سی کے شراکتی ائی ڈی نمبر ۔۔۔۔۔۔۔۔۔۔۔۔۔۔۔۔۔۔۔۔۔۔۔۔۔۔۔۔۔۔۔۔۔۔۔۔۔۔اور ذیلی کھاتہ نمبر۔۔۔۔۔۔۔۔۔۔۔۔۔۔۔۔۔۔۔۔۔۔۔۔۔۔۔۔۔۔۔۔
ساکن ۔۔۔۔۔۔۔۔۔۔۔۔۔۔۔۔۔۔۔۔۔۔۔۔۔۔۔۔۔۔۔۔۔۔۔ یا بصورت دیگر ۔۔۔۔۔۔۔۔۔۔۔۔۔۔۔۔۔۔۔۔۔۔۔۔ ساکن ۔۔۔۔۔۔۔۔۔۔۔۔۔۔۔۔۔۔۔۔۔۔۔۔۔۔۔۔۔۔۔۔۔۔۔۔
کو اپنی جگہ بروز پیر مورخہ 25اپریل 2016بوقت 10:30بجے صبح ، بمقام بیچ لگثری ہوٹل مولوی تمیز الدین خان روڈ کراچی میں منعقد یا ملتوی ہونے والے
ساالنہ اجالس عام میں رائے دہندگی کے لئے اپنا نمائندہ مقرر کرتا ہوں۔
دستخط کئے گئے مورخہ ۔۔۔۔۔۔۔۔۔۔۔۔۔۔۔۔۔۔۔۔۔ 2016
براہ کرم پانچ روپے مالیت کے
ریونیو ٹکٹ چسپاں کریں۔
(دستخط کمپنی میں درج نمونہ کےدستخط کے مطابق ہونےچاہئیے)
دستخط
دستخط:
نام:
پتہ:
سی این ائی سی یا پاسپورٹ نمبر:
پراکسیز کے موثر ہونے کے لیے الزم ہے کہ وہ اجالس سے 48گھنٹے قبل کمپنی کو موصول ہوں۔ نیابت دار کا کمپنی کا رکن ہونا ضروری نہیں ہے۔ سی ڈی
سی کے حصص یا فتگان اور ان کے نمائندوں سے التماس ہے کہ وہ اپنے کمپیوٹرائزڈ قومی شناختی کارڈ یا پاسپورٹ کی تصدیق شدہ کاپی پراکسی فارم
کے ساتھ کمپنی میں جمع کرائیں۔
دستخط:
نام:
پتہ:
سی این ائی سی یا پاسپورٹ نمبر:
تشکیل نیابت داری61واں ساالنہ اجالس عام
گواہان:
نوٹ:
1
2

212
212
AFFIX
CORRECT
POSTAGE
The Company Secretary
PACKAGES LIMITED4th Floor, The ForumSuite # 416 - 422G-20, Block 9, Khayaban-e-JamiClifton, Karachi - 75600

INVESTORS’ EDUCATIONIn pursuance of SRO 924(1)/2015 dated September 9th, 2015 issued by the Securities and Exchange Commission of
Pakistan (SECP), the following informational message has been reproduced to educate investors:


![Packages Limited [Final]](https://img.dokumen.tips/doc/110x75/577cc8cd1a28aba711a33d70/packages-limited-final.jpg)