Embed Size (px)
Citation preview
E.28
Report of the
AABBOORRTTIIOONN SSUUPPEERRVVIISSOORRYY CCOOMMMMIITTTTEEEE
2015
Presented to the House of Representatives pursuant to Section 39 of the
Contraception, Sterilisation, and Abortion Act 1977
E.28
2
TABLE OF CONTENTS Current Membership of the Committee .............................................................................3 Introduction ......................................................................................................................3 Contraception at the time of an abortion ...........................................................................3 Long Acting Subcutaneous Contraception ..........................................................................4 Professional Education and Research .................................................................................4 Outcome of High Court Litigation .......................................................................................5 Statistical Analysis and Trends ...........................................................................................6
Induced abortions, rates and ratios 6 Hospital and residence 9 Age of woman 11 Previous live births 14 Previous induced abortions 15 Ethnic Group 16 Duration of pregnancy 18 Grounds for abortion 20 Procedure 21 Complication 21 Contraception 22
Appendix One..................................................................................................................27 Appendix Two..................................................................................................................28
E.28
3
CURRENT MEMBERSHIP OF THE COMMITTEE Prof Dame Linda Holloway (Chair) Dr Tangimoana Habib Rev Patricia Allan (until 25 September 2015) Carolyn McIlraith (from 28 September 2015) INTRODUCTION
As required by section 39 of the Contraception, Sterilisation, and Abortion Act 1977 (the Act) this
Report summarises our work during the past year. We also include a wide range of graphs and charts
that analyse abortion data recently made available for the 2014 calendar year.
Appendix One lists the functions and powers of the Committee as per section 14 of the Act while
Appendix Two contains further detail of our activity during the 1 July 2014 to 30 June 2015 reporting
year.
CONTRACEPTION AT THE TIME OF AN ABORTION
In 2014, the Committee made changes to the form operating doctors are required to complete when
an abortion is being performed. A section was added to the form to capture whether contraceptives
are being provided at the time an abortion is carried out and a breakdown of what types of
contraception are provided.
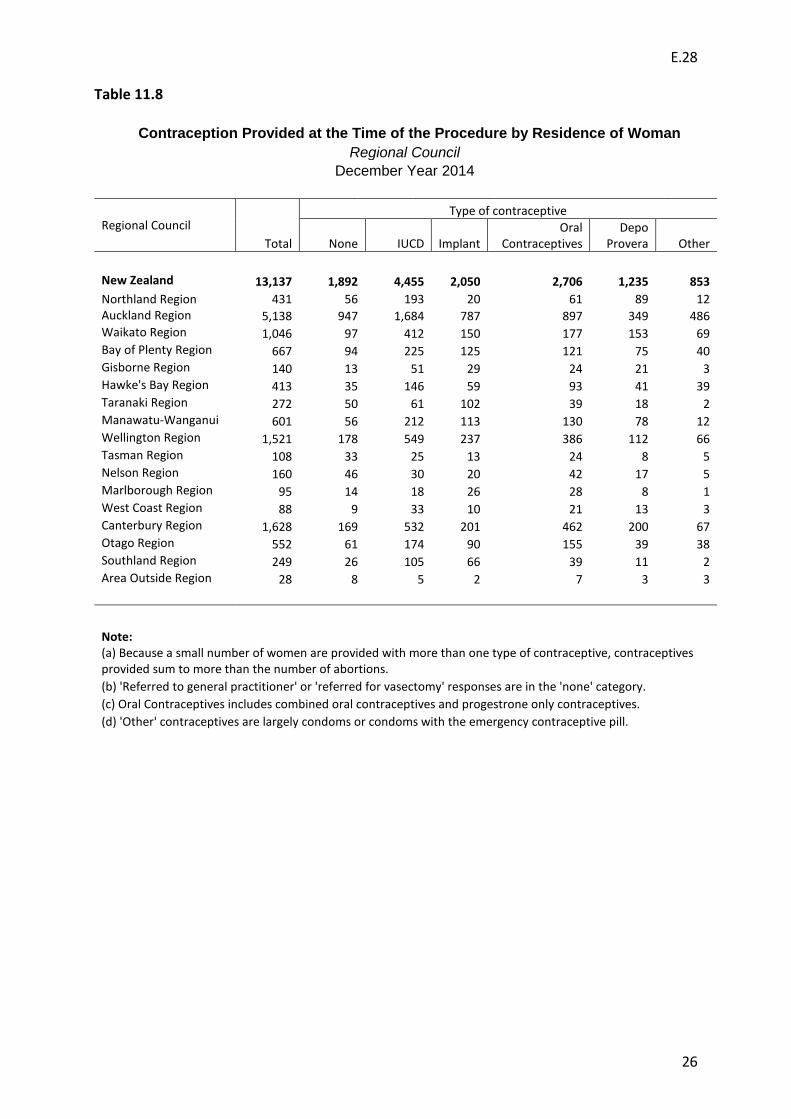
Statistics show that a large percentage of women are being provided long acting contraception at
the time of an abortion in Northland, Southland and Taranaki. We are particularly pleased to see
that newer services, such as Southland Hospital, are providing contraception at the time of the
procedure; helping to prevent future unintended pregnancies.
Unfortunately, we also identified regions where contraception is not regularly provided at the time
an abortion is carried out. It was disappointing to discover that in the Tasman/Nelson region 33% of
women were not provided with any contraception compared with, for example, 8.3% in the Hawke’s
Bay. The national trend shows on average only 14% of women are not provided with contraception.
Further statistical data on this topic has been included in this report and can be located on page 26.

E.28
4
LONG ACTING SUBCUTANEOUS CONTRACEPTION The ease of access to women in New Zealand to long acting contraceptive devices has been an
important development in sexual health services. More recently, the inclusion of long acting
subcutaneous contraception to the already available intra-uterine devices (IUDs) may be one factor
contributing to the steady decline of abortion numbers each year.
However, during discussions with various medical practitioners we have become aware of issues
relating to the Jadelle rod implant; namely difficulty with insertion and removal of the device as well
as reports that the rod migrates from its original insertion point.
The Committee is disappointed that the Jadelle rod is the only long acting implant presently
subsidised by PHARMAC. Currently, where medical practitioners wish to prescribe an alternative
subcutaneous device, the woman has to fund privately the cost of the device (approximately $270)
plus, in some instances, a fee for insertion.
The Committee met with PHARMAC in February 2015 to discuss these concerns and was advised
that PHARMAC had not received many complaints from medical professionals about complications
with Jadelle use. Given the feedback we have received, we believe it is likely medical professionals
may have under-reported their concerns. We encourage all medical practitioners to make a report of
any issues they identify through the usual CARM (Centre for Adverse Reaction Monitoring)
procedures.
The Committee would like to see PHARMAC consider additional or alternative devices for funding at
their next contract review.
PROFESSIONAL EDUCATION AND RESEARCH The Abortion Supervisory Committee is a governance body that has a responsibility to ensure those
we licence are undergoing appropriate ongoing professional education.
During a certifying consultant’s annual reappointment process, we request information about the
ongoing professional education they have completed. We continue to be impressed with the detail
we are provided with and the range of reading, peer group participation and, in some instances,
research being carried out by the medical practitioners involved. We are convinced our population
of certifying consultants are active in pursuing education in relevant fields.
E.28
5
It is important for professionals to undertake research in various specialised fields and for the
knowledge gained from such studies to be shared within the medical field. The Committee is
interested in receiving reports or published papers on research carried out in the contraception,
sexual health and abortion areas. We will be contacting certifying consultants and others with an
interest in these fields to find out about any research projects they have undertaken or been
involved in during the coming year.
OUTCOME OF HIGH COURT LITIGATION The judgment of Justice Williams on Right to Life New Zealand Inc’s application to the High Court
under the Declaratory Judgments Act was delivered on 1 October 2015.
Right to Life had challenged the basis on which the Committee granted and renewed a licence
authorising the performance of early medical abortions at the Tauranga Family Planning Clinic. It
sought declarations which would have required an applicant for a licence to perform medical
abortions only to have the same facilities and equipment as for surgical abortions.
The Court substantially held in favour of the Committee, upholding its authority to grant licences in
respect of medical abortions only. The Court recognised the statutory purpose of the Contraception,
Sterilisation, and Abortion Act 1977 was the provision of safe and accessible abortion services, and
agreed with the Committee’s submission that the Act must be interpreted in light of scientific
advances in modern medicine.
E.28
6
STATISTICAL ANALYSIS AND TRENDS
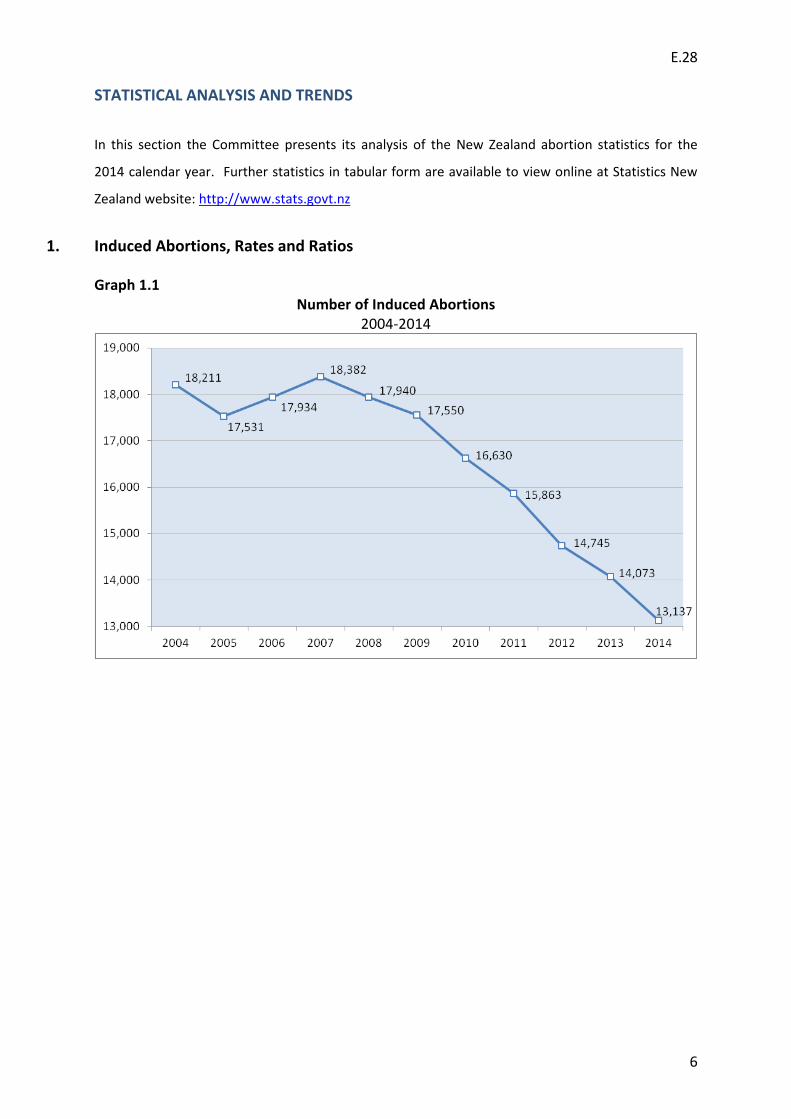
In this section the Committee presents its analysis of the New Zealand abortion statistics for the
2014 calendar year. Further statistics in tabular form are available to view online at Statistics New
Zealand website: http://www.stats.govt.nz
1. Induced Abortions, Rates and Ratios
Graph 1.1
Number of Induced Abortions 2004-2014

E.28
7
Graph 1.2 Abortion Ratio
2004-2014
The abortion ratio is the number of abortions per 1,000 known pregnancies. Known pregnancies include live births, stillbirths and induced abortions combined, but does not include miscarriages. Graph 1.3
General Abortion Rate 2004-2014
The general abortion rate is the number of abortions per 1,000 of the mean estimated population of women aged 15-44 years.
E.28
8
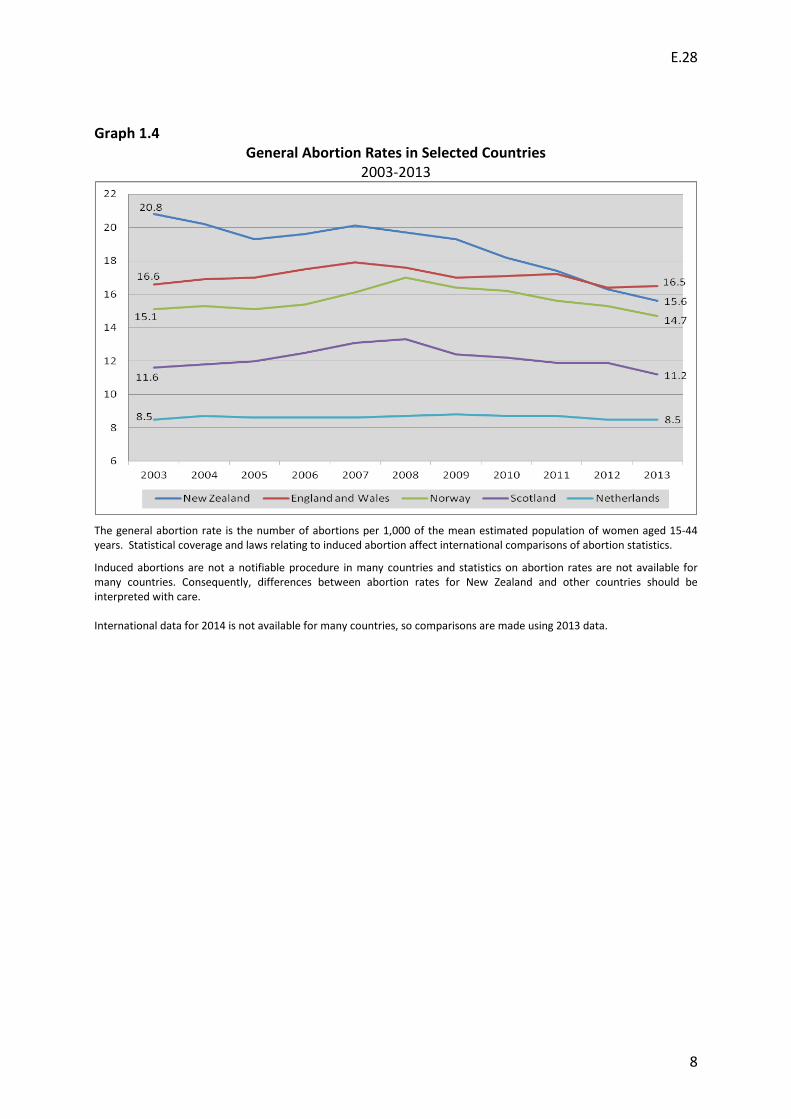
Graph 1.4
General Abortion Rates in Selected Countries 2003-2013
The general abortion rate is the number of abortions per 1,000 of the mean estimated population of women aged 15-44 years. Statistical coverage and laws relating to induced abortion affect international comparisons of abortion statistics.
Induced abortions are not a notifiable procedure in many countries and statistics on abortion rates are not available for many countries. Consequently, differences between abortion rates for New Zealand and other countries should be interpreted with care. International data for 2014 is not available for many countries, so comparisons are made using 2013 data.

E.28
9
2. Hospital and Residence Graph 2.1
Number of Abortions by Hospital December Year 2014
Three other hospitals performed a total of 10 abortions: Palmerston North Hutt Hospital Sugery on Shakespeare

E.28
10
Graph 2.2
Number of Abortions by Residence of Woman Regional Council
December Year 2014
Table 2.3
Induced Abortions by Residential Status of Woman December Year 2014
Residential Status(1) Number
New Zealand Resident 11,971 Non-Resident 955 Not Stated 211
Total 13,137
(1) Residential status is not the same as place of residence
E.28
11
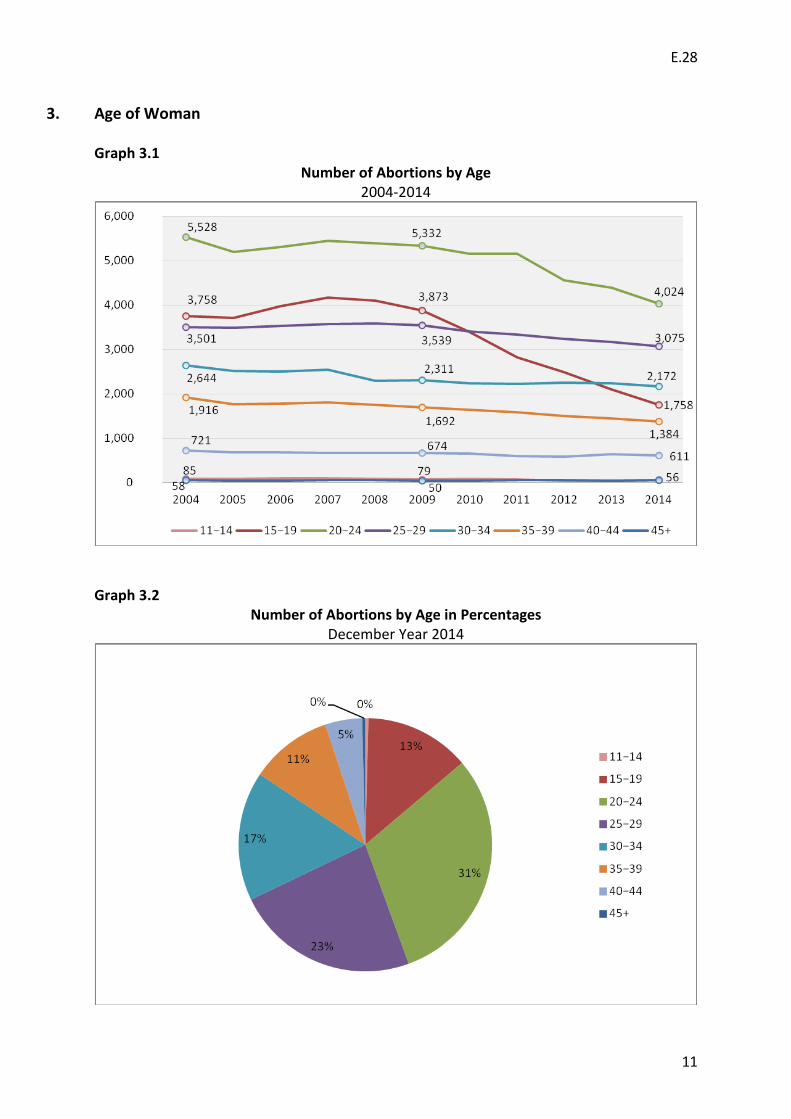
3. Age of Woman
Graph 3.1
Number of Abortions by Age 2004-2014
Graph 3.2
Number of Abortions by Age in Percentages December Year 2014
E.28
12
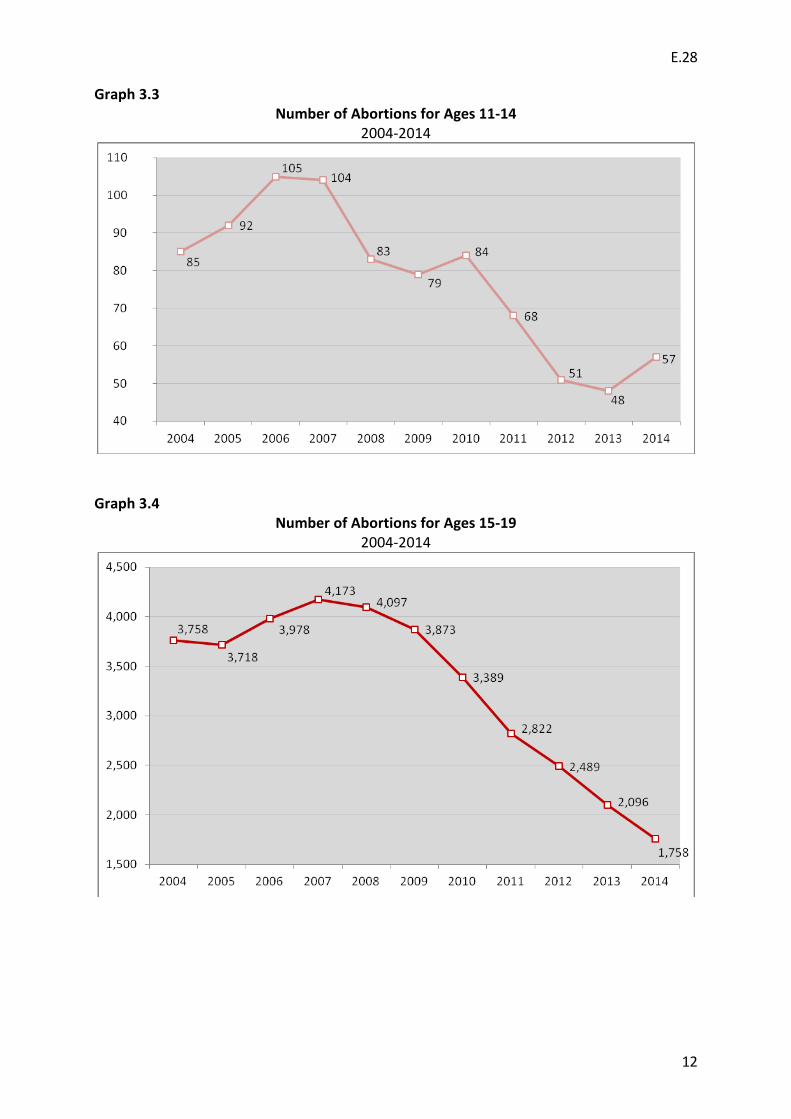
Graph 3.3 Number of Abortions for Ages 11-14
2004-2014
Graph 3.4
Number of Abortions for Ages 15-19 2004-2014

E.28
13
Graph 3.5
Number of Abortions for Age 45+ 2004-2014

E.28
14
4. Previous Live Births Table 4.1
Induced Abortions by Age and Previous Live Births December Year 2014
Age (years) Previous Live Births
Total 0 1 2 3 4 5 6 7 or More
6 or More
Number All Ages 13,137 5,763 2,728 2,681 1,181 485 165 81 53 134
Under 15 57 57 - - - - - - - - 15-19 1,758 1,501 215 37 5 - - - - - 20-24 4,024 2,319 980 547 136 40 1 3 - 1 25-29 3,075 1,155 693 693 351 128 35 23 15 5 30-34 2,172 479 471 637 331 162 51 39 25 16 35-39 1,384 181 248 521 234 98 50 35 31 21 40-44 611 64 109 225 119 51 25 11 10 8
45 and over 56 7 12 21 5 6 3 1 - 2 Graph 4.2
Number of Abortions by Previous Live Births
2004-2014
E.28
15
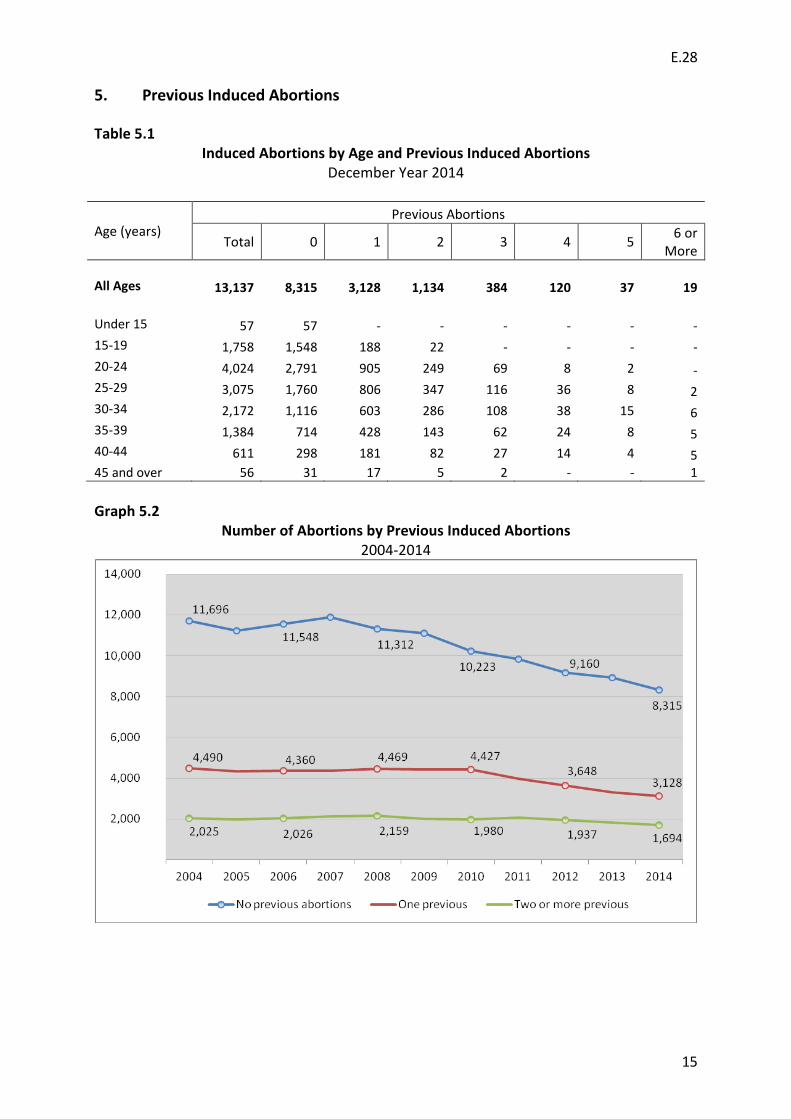
5. Previous Induced Abortions Table 5.1
Induced Abortions by Age and Previous Induced Abortions December Year 2014
Age (years) Previous Abortions
Total 0 1 2 3 4 5 6 or More
All Ages 13,137 8,315 3,128 1,134 384 120 37 19
Under 15 57 57 - - - - - - 15-19 1,758 1,548 188 22 - - - - 20-24 4,024 2,791 905 249 69 8 2 - 25-29 3,075 1,760 806 347 116 36 8 2 30-34 2,172 1,116 603 286 108 38 15 6 35-39 1,384 714 428 143 62 24 8 5 40-44 611 298 181 82 27 14 4 5 45 and over 56 31 17 5 2 - - 1 Graph 5.2
Number of Abortions by Previous Induced Abortions 2004-2014

E.28
16
6. Ethnic Group Graph 6.1
Number of Abortions by Ethnic Group December Year 2014
Each abortion has been included in every ethnic group specified. For this reason, some abortions are counted more than once. Note: (a) MELAA = Middle Eastern, Latin American and African (b) Other includes New Zealanders.

E.28
17
Graph 6.2 Number of Abortions by Ethnic Group (Trend)
2004-2014
Graph 6.3
Induced Abortions by Ethnicity Ratio 2007-2014
Ratio: Induced abortions per 1,000 known pregnancies including live births, stillbirths and abortions combined, but does not include miscarriages.
E.28
18
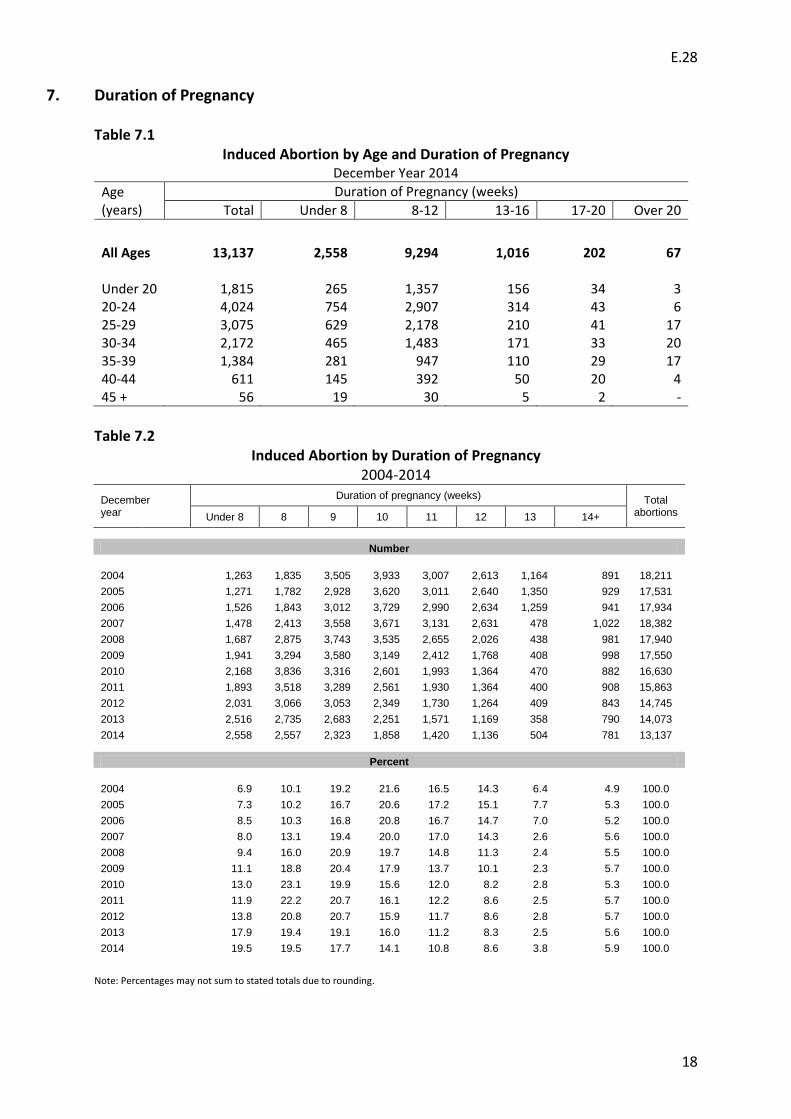
7. Duration of Pregnancy Table 7.1
Induced Abortion by Age and Duration of Pregnancy December Year 2014
Age (years)
Duration of Pregnancy (weeks) Total Under 8 8-12 13-16 17-20 Over 20
All Ages 13,137 2,558 9,294 1,016 202 67
Under 20 1,815 265 1,357 156 34 3
20-24 4,024 754 2,907 314 43 6 25-29 3,075 629 2,178 210 41 17 30-34 2,172 465 1,483 171 33 20 35-39 1,384 281 947 110 29 17 40-44 611 145 392 50 20 4 45 + 56 19 30 5 2 -
Table 7.2
Induced Abortion by Duration of Pregnancy 2004-2014
December year
Duration of pregnancy (weeks) Total abortions Under 8 8 9 10 11 12 13 14+
Number
2004 1,263 1,835 3,505 3,933 3,007 2,613 1,164 891 18,211 2005 1,271 1,782 2,928 3,620 3,011 2,640 1,350 929 17,531 2006 1,526 1,843 3,012 3,729 2,990 2,634 1,259 941 17,934 2007 1,478 2,413 3,558 3,671 3,131 2,631 478 1,022 18,382 2008 1,687 2,875 3,743 3,535 2,655 2,026 438 981 17,940 2009 1,941 3,294 3,580 3,149 2,412 1,768 408 998 17,550 2010 2,168 3,836 3,316 2,601 1,993 1,364 470 882 16,630 2011 1,893 3,518 3,289 2,561 1,930 1,364 400 908 15,863 2012 2,031 3,066 3,053 2,349 1,730 1,264 409 843 14,745 2013 2,516 2,735 2,683 2,251 1,571 1,169 358 790 14,073 2014 2,558 2,557 2,323 1,858 1,420 1,136 504 781 13,137
Percent
2004 6.9 10.1 19.2 21.6 16.5 14.3 6.4 4.9 100.0 2005 7.3 10.2 16.7 20.6 17.2 15.1 7.7 5.3 100.0 2006 8.5 10.3 16.8 20.8 16.7 14.7 7.0 5.2 100.0 2007 8.0 13.1 19.4 20.0 17.0 14.3 2.6 5.6 100.0 2008 9.4 16.0 20.9 19.7 14.8 11.3 2.4 5.5 100.0 2009 11.1 18.8 20.4 17.9 13.7 10.1 2.3 5.7 100.0 2010 13.0 23.1 19.9 15.6 12.0 8.2 2.8 5.3 100.0 2011 11.9 22.2 20.7 16.1 12.2 8.6 2.5 5.7 100.0 2012 13.8 20.8 20.7 15.9 11.7 8.6 2.8 5.7 100.0 2013 17.9 19.4 19.1 16.0 11.2 8.3 2.5 5.6 100.0 2014 19.5 19.5 17.7 14.1 10.8 8.6 3.8 5.9 100.0
Note: Percentages may not sum to stated totals due to rounding.
E.28
19
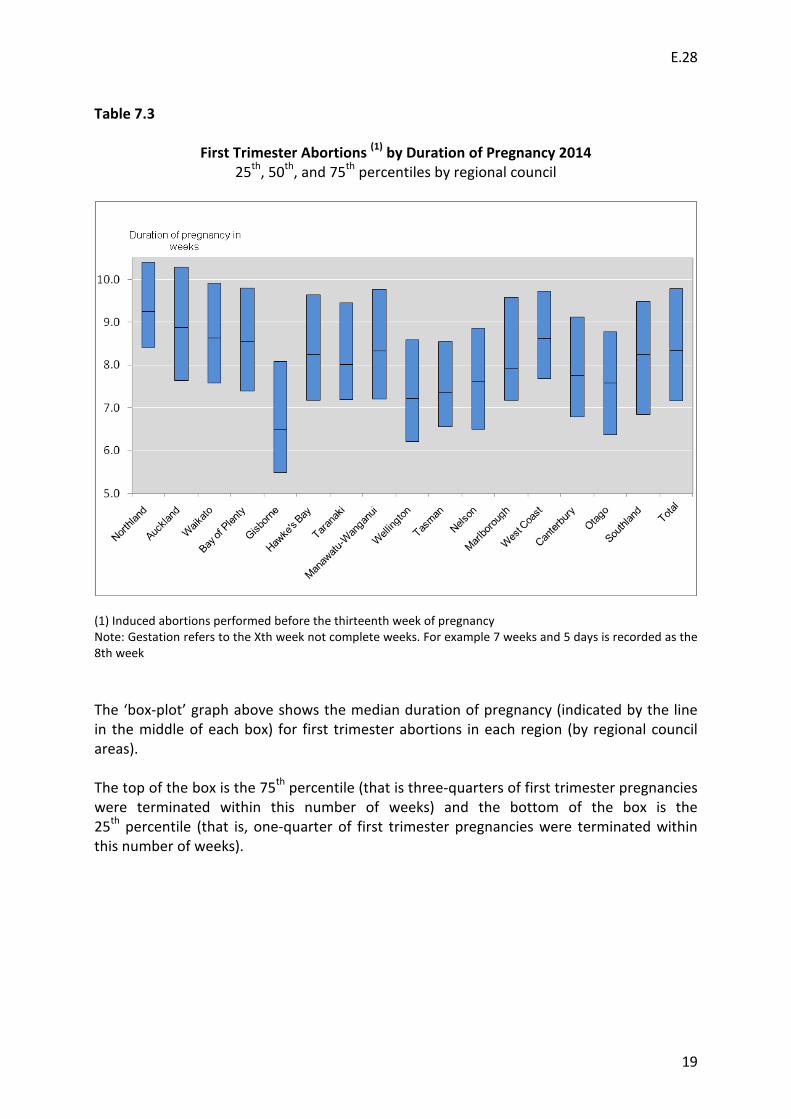
Table 7.3
First Trimester Abortions (1) by Duration of Pregnancy 2014 25th, 50th, and 75th percentiles by regional council
(1) Induced abortions performed before the thirteenth week of pregnancy Note: Gestation refers to the Xth week not complete weeks. For example 7 weeks and 5 days is recorded as the 8th week The ‘box-plot’ graph above shows the median duration of pregnancy (indicated by the line in the middle of each box) for first trimester abortions in each region (by regional council areas). The top of the box is the 75th percentile (that is three-quarters of first trimester pregnancies were terminated within this number of weeks) and the bottom of the box is the 25th percentile (that is, one-quarter of first trimester pregnancies were terminated within this number of weeks).
E.28
20
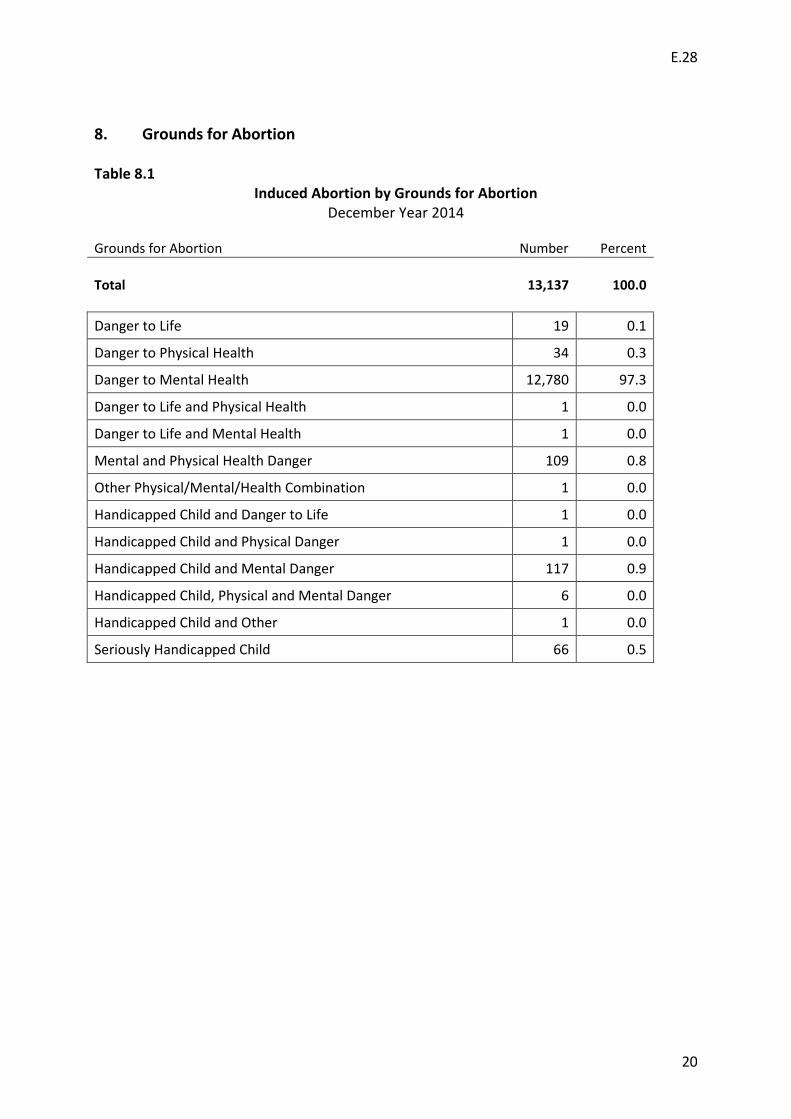
8. Grounds for Abortion Table 8.1
Induced Abortion by Grounds for Abortion December Year 2014
Grounds for Abortion Number Percent Total 13,137 100.0 Danger to Life 19 0.1
Danger to Physical Health 34 0.3
Danger to Mental Health 12,780 97.3
Danger to Life and Physical Health 1 0.0
Danger to Life and Mental Health 1 0.0
Mental and Physical Health Danger 109 0.8
Other Physical/Mental/Health Combination 1 0.0
Handicapped Child and Danger to Life 1 0.0
Handicapped Child and Physical Danger 1 0.0
Handicapped Child and Mental Danger 117 0.9
Handicapped Child, Physical and Mental Danger 6 0.0
Handicapped Child and Other 1 0.0
Seriously Handicapped Child 66 0.5
E.28
21
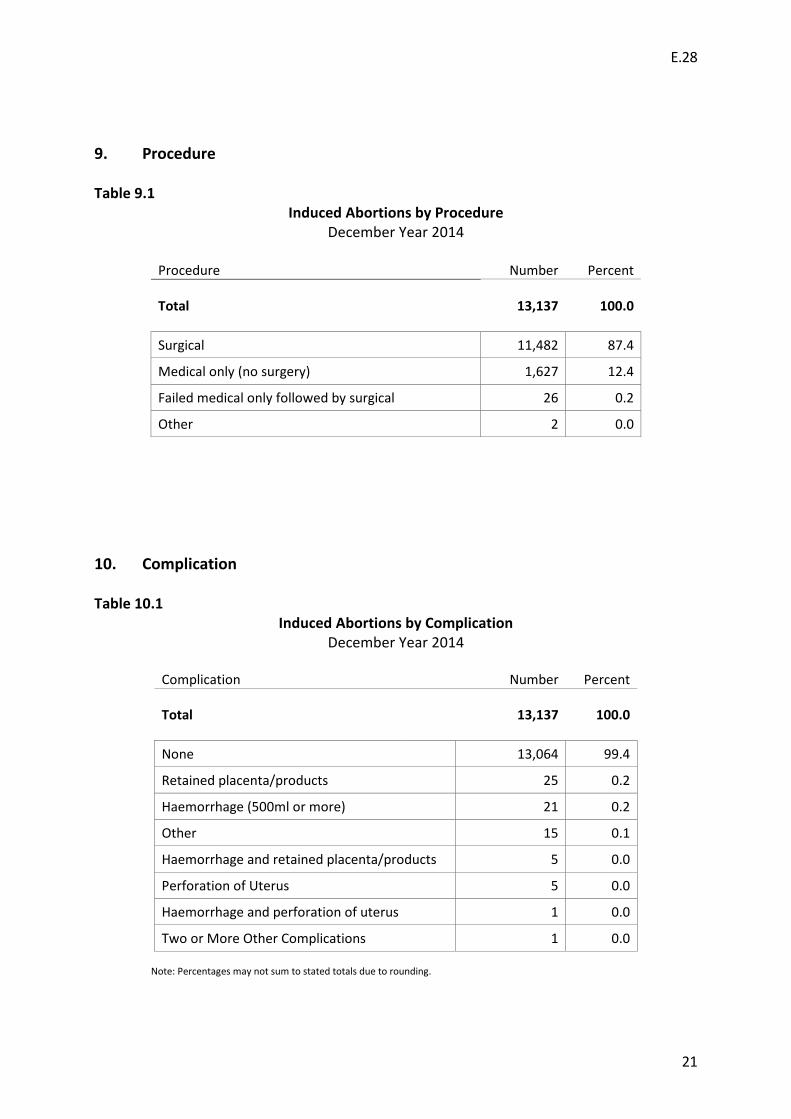
9. Procedure Table 9.1
Induced Abortions by Procedure December Year 2014
Procedure Number Percent
Total 13,137 100.0
Surgical 11,482 87.4
Medical only (no surgery) 1,627 12.4
Failed medical only followed by surgical 26 0.2
Other 2 0.0
10. Complication Table 10.1
Induced Abortions by Complication December Year 2014
Complication Number Percent
Total 13,137 100.0 None 13,064 99.4
Retained placenta/products 25 0.2
Haemorrhage (500ml or more) 21 0.2
Other 15 0.1
Haemorrhage and retained placenta/products 5 0.0
Perforation of Uterus 5 0.0
Haemorrhage and perforation of uterus 1 0.0
Two or More Other Complications 1 0.0
Note: Percentages may not sum to stated totals due to rounding.

E.28
22
11. Contraception Table 11.1
Induced Abortions by Contraception Used December Year 2014
Contraception Used Number Percent
Total 13,137 100.0 None 7,189 54.7
Condoms 3,267 24.9
Combined oral contraceptives 1,427 10.9
Progesterone only contraceptives 468 3.6
Natural family planning 225 1.7
Emergency contraception 191 1.5
Intra-Uterine contraceptive device without hormones 159 1.2
Depo provera injections 102 0.8
Intra-Uterine contraceptive device with hormones 64 0.5
Other 25 0.2
Long-acting implant 17 0.1
Diaphragm 3 0.0
Graph 11.2
Percentage of Abortions by Contraception Used December Year 2014

E.28
23
Table 11.3
Induced Abortions by Age and Contraception Use December Year 2014
Age Group (years)
Total No Contraception Used
Contraception Used
All Ages 13,137 7,189 5,948
Under 20 1,815 1,077 738 20-24 4,024 2,138 1,886 25-29 3,075 1,671 1,404 30-34 2,172 1,156 1,016 35-39 1,384 748 636 40 + 667 399 268
Graph 11.4 No Contraception Used by Age Group
December Year 2014
E.28
24
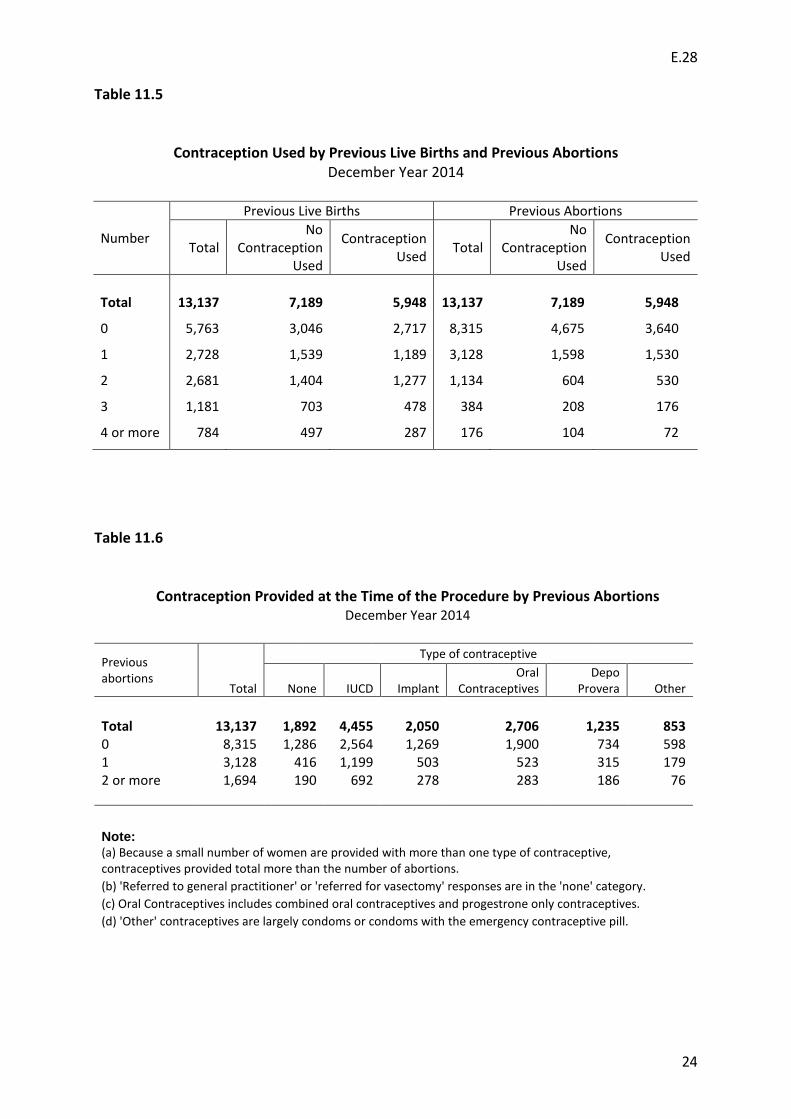
Table 11.5
Contraception Used by Previous Live Births and Previous Abortions December Year 2014
Number
Previous Live Births Previous Abortions
Total No
Contraception Used
Contraception Used Total
No Contraception
Used
Contraception Used
Total 13,137 7,189 5,948 13,137 7,189 5,948
0 5,763 3,046 2,717 8,315 4,675 3,640
1 2,728 1,539 1,189 3,128 1,598 1,530
2 2,681 1,404 1,277 1,134 604 530
3 1,181 703 478 384 208 176
4 or more 784 497 287 176 104 72
Table 11.6
Contraception Provided at the Time of the Procedure by Previous Abortions December Year 2014
Previous abortions
Total
Type of contraceptive
None IUCD Implant Oral
Contraceptives Depo
Provera Other
Total 13,137 1,892 4,455 2,050 2,706 1,235 853 0 8,315 1,286 2,564 1,269 1,900 734 598 1 3,128 416 1,199 503 523 315 179 2 or more 1,694 190 692 278 283 186 76
Note:
(a) Because a small number of women are provided with more than one type of contraceptive, contraceptives provided total more than the number of abortions. (b) 'Referred to general practitioner' or 'referred for vasectomy' responses are in the 'none' category. (c) Oral Contraceptives includes combined oral contraceptives and progestrone only contraceptives. (d) 'Other' contraceptives are largely condoms or condoms with the emergency contraceptive pill.

E.28
25
Table 11.7
Induced Abortions by Contraception Provided at the Time of the Procedure December Year 2014
Contraception Used Number Percent
Total 13,137 100.0
IUCD insertion 4,432 33.7 Combined oral contraceptives 2,210 16.8 Implant insertion 2,045 15.6 None 1,892 14.4 Depo provera injections 1,223 9.3 Other 823 6.3 Progesterone only contraceptives 457 3.5 Progesterone only contraceptives and other 12 0.1 IUCD insertion and combined oral contraceptives 11 0.1 Combined oral contraceptives and other 10 0.1 IUCD insertion and depo provera injections 7 0.1 Depo provera injections and other 4 0.0 IUCD insertion and other 2 0.0 IUCD insertion and progesterone only contraceptives 2 0.0 Implant insertion and combined oral contraceptives 2 0.0 Depo provera injections and combined oral contraceptives 1 0.0 Diaphragm 1 0.0 IUCD and implant insertion 1 0.0 Implant insertion and other 1 0.0 Implant insertion and progesterone only contraceptives 1 0.0
Notes: (a) 'Referred to general practitioner' or 'referred for vasectomy' responses are in the 'none' category.
(b) 'Other' contraceptives are largely condoms or condoms with the emergency contraceptive pill.
E.28
26
Table 11.8
Contraception Provided at the Time of the Procedure by Residence of Woman Regional Council
December Year 2014
Regional Council
Total
Type of contraceptive
None IUCD Implant Oral
Contraceptives Depo
Provera Other
New Zealand 13,137 1,892 4,455 2,050 2,706 1,235 853
Northland Region 431 56 193 20 61 89 12 Auckland Region 5,138 947 1,684 787 897 349 486 Waikato Region 1,046 97 412 150 177 153 69 Bay of Plenty Region 667 94 225 125 121 75 40 Gisborne Region 140 13 51 29 24 21 3 Hawke's Bay Region 413 35 146 59 93 41 39 Taranaki Region 272 50 61 102 39 18 2 Manawatu-Wanganui 601 56 212 113 130 78 12 Wellington Region 1,521 178 549 237 386 112 66 Tasman Region 108 33 25 13 24 8 5 Nelson Region 160 46 30 20 42 17 5 Marlborough Region 95 14 18 26 28 8 1 West Coast Region 88 9 33 10 21 13 3 Canterbury Region 1,628 169 532 201 462 200 67 Otago Region 552 61 174 90 155 39 38 Southland Region 249 26 105 66 39 11 2 Area Outside Region 28 8 5 2 7 3 3
Note:
(a) Because a small number of women are provided with more than one type of contraceptive, contraceptives provided sum to more than the number of abortions. (b) 'Referred to general practitioner' or 'referred for vasectomy' responses are in the 'none' category. (c) Oral Contraceptives includes combined oral contraceptives and progestrone only contraceptives. (d) 'Other' contraceptives are largely condoms or condoms with the emergency contraceptive pill.
E.28
27
APPENDIX ONE Functions and powers of the Supervisory Committee The functions and powers of the ASC are set out in section 14 of the Contraception, Sterilisation, and Abortion Act 1977. s14(1) (a) Keep under review all the provisions of the abortion law, and the operation and effect of those provisions in practice. (b) Receive, consider, grant, and refuse applications for licences or for the renewal of licences under this Act, and to revoke any such licence (c) Prescribe standards in respect of facilities to be provided in licensed institutions for the performance of abortions (d) Take all reasonable and practicable steps to ensure that:
i. licensed institutions maintain adequate facilities for the performance of abortions; and ii. all staff employed in licensed institutions in connection with the performance of
abortions are competent (e) Take all reasonable and practicable steps to ensure that sufficient and adequate facilities are available throughout New Zealand for counselling women who may seek advice in relation to abortion (f) Recommend maximum fees that may be charged by any person in respect of the performance of an abortion in any licensed institution or class of licensed institutions, and maximum fees that may be charged by any licensed institution or class of licensed institutions for the performance of any services or the provision of any facilities in relation to any abortion (g) Obtain, monitor, analyse, collate, and disseminate information relating to the performance of abortions in New Zealand (h) Keep under review the procedure, prescribed by sections 32 and 33 of this Act, whereby it is determined in any case whether the performance of an abortion would be justified (i) Take all reasonable and practicable steps to ensure that the administration of the abortion law is consistent throughout New Zealand, and to ensure the effective operation of this Act and the procedures thereunder (j) From time to time report to and advise the Minister of Health and any district health board on the establishment of clinics and centres, and the provision of related facilities and services, in respect of contraception and sterilisation (k) Report annually to Parliament on the operation of the abortion law.

E.28
28
APPENDIX TWO In the year from 1 July 2014 to 30 June 2015 the Supervisory Committee held 11 meetings. Visits Te Mahoe Unit – Wellington Hospital Southland Hospital Meetings The Supervisory Committee met with: Ministry of Justice Staff Statistics New Zealand Te Mahoe Unit Staff PHARMAC Southland hospital staff Various certifying consultants
Certifying Consultants As at 30 June 2015 there were 152 certifying consultants (of whom 102 met the Act’s specialist category requirements) on the Supervisory Committee’s list. Fees payable to certifying consultants for consultations with women considering termination of pregnancy totalled $ 4,030,165 in the year ended 30 June 2015.