Embed Size (px)
Citation preview

1
27 February 2018
PRELIMINARY RESULTS FOR THE 52 WEEKS ENDED 30 DECEMBER 2017
Greggs is the leading bakery food-on-the-go retailer in the UK,
with over 1,850 retail outlets throughout the country
GOOD GROWTH AND FURTHER STRATEGIC PROGRESS
2017 Financial highlights
• Total sales up 7.4% to £960.0m (2016: £894.2m)
• Company-managed shop like-for-like sales* up 3.7% (2016: 4.2%)
• Operating profit excluding property profits** and exceptional items*** up 4.6% to £81.7m (2016: £78.1m)
• Pre-tax profit excluding exceptional items*** £81.8m (2016: £80.3m)
• Pre-tax profit £71.9m (2016: £75.1m)
• Strong cash generation supporting investment programme for further growth
• Total ordinary dividend per share up 4.2% to 32.3p (2016: 31.0p)
* like-for-like sales in company-managed shops (excluding franchises) with a calendar year’s trading history
** freehold property disposal gains of £0.5m in 2017 (2016: £2.2m)
*** exceptional pre-tax charge of £9.9m in 2017 (2016: £5.2m charge)
Strategic progress
• Further improvements to product range, with specific focus on hot drinks and hot
food
• Healthier options growing strongly, ‘Balanced Choice’ range accounts for more
than £100m of sales
• 131 new shops opened, 41 closures (90 net openings); 1,854 shops trading at 30
December 2017
• Continued investment to consolidate manufacturing operations and expand
logistics capacity
• New shop replenishment system successfully rolled out and supply chain solution
piloted
Current trading
• Encouraged by the start to the year
• Company-managed shop like-for-like sales up by 3.2% in eight weeks to 24
February 2018

2
“In 2017 we delivered another strong performance in challenging economic circumstances as rising inflation impacted both our own costs and customers’ disposable income. At the same time we continued to make good progress with our business transformation programme. “Whilst the UK consumer outlook remains challenging, we are encouraged by the start to the year. 2018 will be the peak year for investment in our supply chain as we create the platforms for further growth. We also plan to open a record number of new shops as we implement our plan to grow Greggs as a leading food-on-the-go brand.”
- Roger Whiteside, Chief Executive
ENQUIRIES: Greggs plc Roger Whiteside, Chief Executive Richard Hutton, Finance Director Tel: 0191 281 7721
Hudson Sandler Wendy Baker / Hattie O’Reilly Tel: 020 7796 4133
An audio webcast of the analysts’ presentation will be available to download later today at http://corporate.greggs.co.uk/
3
Chairman’s statement
Greggs performed well in 2017, delivering further like-for-like sales growth as well as expanding its estate of shops. This was achieved despite significant inflationary headwinds and alongside continued major investment in line with our strategic plan. These investments are creating the platform for us to deliver sustainable long-term growth for the benefit of all stakeholders. Overview Greggs once again demonstrated the resilience of its people and business model, delivering a solid trading and financial performance in the face of increased cost inflation and a strategic change programme. The development of our products and shop formats has opened up additional opportunities for growth in shop numbers and we expect this expansion to continue in the year ahead. We are investing significantly in our supply chain to enable this growth, whilst continuing to make improvements to our processes and systems that will deliver enhanced capability and efficiency to compete in the fast-moving food-on-the-go market. Our people and values In 2017 we began the investment in our supply chain that will enable us to deliver growth whilst remaining competitive in terms of the quality and price of our products. As I reported last year this involved taking some difficult decisions, particularly regarding the organisation of our manufacturing and logistics operations. We have worked hard over the last year to carry out the necessary changes in line with our values. There has been much challenge and dialogue but the whole team has worked together with the best interests of the business in mind, and I would like to extend my thanks to all involved. Greggs has a long history of conducting its business in a responsible manner. We have made great strides in environmental management in recent years and are working with others in our industry to make further improvements. This includes finding solutions to increase the proportion of packaging that can be recycled and ensuring that more of our surplus food is channelled to those who need it most. We have a strong reputation for sharing our success with the communities where we operate and direct much of this support through the Greggs Foundation, which celebrated its 30th anniversary in 2017. Representatives of the Foundation attended a Board meeting in the year to explain how they work with the Company and other partners. The Foundation makes a real difference to the lives of people in our communities and is given tremendous assistance by staff throughout Greggs. It is a great charity and one that we are very proud to support. I would like to thank everyone who has worked for Greggs during the past year and contributed to the positive impact that it has had on all of its stakeholders. The Board As we announced last year, our Retail Director Raymond Reynolds stepped down from the Board at the AGM in May 2017 but remains a key member of the Company’s Operating Board in his new role as Property and Business Development Director. Raymond was a member of the Board for ten years and I would like to thank him for his important contribution throughout that time. Otherwise the composition of the Board was unchanged in 2017. We continued to spend a significant amount of time overseeing the major programmes of change that support the Company’s strategic plan, particularly the investments under way in our internal supply chain.

4
Other reviews included emerging risk areas, including the uncertainties around exiting the European Union, and examination of customer preferences and behaviours and our resulting plans. The Board also visited Northern Ireland in the year to see for itself the progress that Greggs has made establishing a presence there. It was pleasing to see the same levels of enthusiasm and commitment to doing business the right way that we experience in more established trading areas. Directors continue to be encouraged to visit different areas of the business and experience it through the eyes of our colleagues and customers. This helps to ensure that Non-Executive Directors’ contributions to Board discussions are well informed, supporting open and constructive dialogue with the management team. This year I also spent time with an employee panel, a particularly helpful experience given the significant changes that we are making in our supply chain. Further details of the Board’s work are included in the Governance and Committee sections of the Annual Report. Dividend Our progressive dividend policy targets an ordinary dividend that is two times covered by earnings, with any further surplus capital being returned to shareholders. Our Finance Director, Richard Hutton, outlines the expected application of the distribution policy in more detail in the financial review. In line with its progressive dividend policy, the Board intends to recommend at the Annual General Meeting a final dividend of 22.0 pence per share (2016: 21.5 pence), giving a total ordinary dividend for the year of 32.3 pence (2016: 31.0 pence), an increase of 4.2 per cent. Looking ahead Greggs continues to demonstrate its resilience in the face of economic uncertainty. This environment seems unlikely to change in the short term as the UK negotiates its exit from the European Union, with the associated risks to consumer confidence and further cost inflation. We are alive to these risks and working hard to mitigate the possible impacts where we can. Looking beyond this we remain optimistic about the growth potential for Greggs and are currently investing to support this. The benefits of our major change programmes are beginning to show and will give us much greater capability and capacity for further growth in the years ahead. Greggs continues to be a strong business with a great team. I am confident that we will make further progress in the year ahead. Ian Durant Chairman 27 February 2018

5
Chief Executive’s report In 2017 we delivered another strong performance in challenging economic circumstances as rising inflation impacted both our own costs and customers’ disposable income. At the same time, we continued to make good progress with our business transformation programme, investing in new systems and processes as well as increased capacity and efficiency in our supply chain. We are successfully developing our product offer to meet customer needs and investing in improved customer service, in addition to accelerating growth in shop numbers. Financial performance Total sales grew to £960.0 million in 2017, up 7.4 per cent. Within this company-managed shop like-for-like sales (defined in Note 10) grew by 3.7 per cent. Underlying operating profit, excluding property profits and exceptional items, grew by 4.6 per cent to £81.7 million (2016: £78.1 million). Pre-tax profit (including exceptional items) fell by 4.3 per cent to £71.9 million. Market background Economic conditions became more challenging in 2017, with business cost inflation rising significantly due to food ingredient and labour cost increases affecting the entire sector. We were able to leverage our scale and deliver productivity improvements to mitigate some of these pressures but, as expected, saw some year-on-year margin slippage. The market generally saw price inflation returning to the food sector, which resulted in a slowdown in disposable income growth for our customers. Whilst the food-on-the-go sector remains highly competitive, a further year of unbroken growth in like-for-like sales demonstrates the continued relevance and strength of the Greggs brand. Delivering our strategy Greggs is a strong and trusted brand and we draw on our heritage in fresh bakery to compete successfully in the food-on-the-go market. Our purpose is to make good, freshly prepared food accessible to everyone with the aim of becoming the customers’ favourite for food-on-the-go. We are committed to conducting our business in a responsible manner and, in doing so, to have a positive impact on people’s lives. Our strategy has four pillars: 1. Great-tasting freshly prepared food Greggs products are differentiated by the way we freshly prepare food each day in our shops and by offering outstanding value for good quality, great tasting food-on-the-go. Making good, freshly prepared food accessible to all income levels is embedded in our core purpose as a brand with outstanding value meal deals setting us apart from the competition. Our product strategy has been to nurture and protect our market-leading reputation in long-established traditional bakery categories adapted to food-on-the-go whilst developing new reasons to visit Greggs by offering quality and value in new growth areas.

6
Our traditional categories, including fresh baked savoury snacks, freshly prepared sandwiches and delicious sweet bakery treats, remain our best-selling products and are being supported by strong growth in new categories. Breakfast Breakfast-on-the-go continues to grow strongly and Greggs has established a leading position by focusing on offering outstanding value with our breakfast meal deal starting at just £2. This remains our fastest-growing part of our trading day and we continue to build increased spend and visit frequency through menu development. Strategically it plays an important role in diversifying demand patterns, making us less reliant on general shopping missions and less sensitive to weather. Hot Drinks Led by coffee at breakfast, our reputation for quality, value and service in this growth category continues to build, enabling us to extend our drinks menu choice. Hot drinks feature in all of our meal deal offers and it is this outstanding value that differentiates us from our competitors. Balanced Choice Growing public concern over obesity is driving increased demand for healthier choices in food-on-the-go. Greggs has a key role to play in encouraging healthier food choices, making good quality freshly prepared food accessible nationwide at outstanding value. Sales of healthier options, including our Balanced Choice range offering fewer than 400 calories and good nutritionals, continue to grow as we extend menu choice and take steps to encourage healthier food choices through disproportionate space allocation and promotion in our shops. Alongside development of our Balanced Choice range we have adopted a proactive approach to supporting the Government’s Childhood Obesity Plan and making significant efforts to reduce salt, fat and sugar in our products and to encourage greater consumption of vegetables in the diet. Hot food Hot food is another area of growing customer demand, providing food-on-the-go solutions for all times of the day. Sales of hot sandwiches and hot soup are growing well and provide a platform for further menu development, which we intend will create the opportunity to extend trading in Greggs for longer in the day as our reputation grows. Good Food Customers increasingly care where their food comes from and, because we make the majority of our food ourselves, we are well placed to deliver food they can trust. Unlike the majority of our competitors, who resell bought-in finished products, we are a large-scale food manufacturer in our own right dealing at source with base ingredients. We have invested significantly in recent years, gaining independent accreditation for our sourcing and manufacturing credentials and have set out to lead the food-on-the-go sector in eliminating or reducing unnecessary ingredients at the same time as providing full information to allow customers to make informed choices.

7
Looking ahead Once again we have a strong pipeline of new product developments planned for the year ahead, strengthening traditional product areas and continuing to build our reputation in new growth categories. 2. Best customer experience As well as offering great tasting great value food, Greggs is loved by customers because of our fast and friendly service. Working in a Greggs shop is very demanding so we rely on our amazing teams to deliver fast, friendly service under pressure. We continue to invest to simplify our processes and increase productivity to release time for service, with significant gains last year from our new shop ordering process in addition to a best practice programme that we call “The Greggs Way”. Our most loyal customers are signing up in rapidly increasing numbers to our award-winning Greggs Rewards scheme. The insight that this provides now includes satisfaction ratings and is helping to inform decision making throughout the business, helping us to better meet customer needs every day. Our shops The key consideration when customers choose where to shop for food-on-the-go is convenience. Being within easy reach for customers when they need us is a prerequisite and we are working hard to increase shop numbers in order to provide easy access everywhere. In 2017 we opened 131 new shops (including 45 franchise units) and closed 41, growing the estate to 1,854 shops trading as at 30 December 2017. We opened our 202nd franchise shop and extended our company-managed shop reach to new territory in Devon, in addition to opening further shops in Northern Ireland. Refurbishment of our shops slowed down last year as we reached the end of our programme to transform our legacy bakery shops to our food-on-the-go format. We completed 132 refurbishments and franchise partners refurbished a further ten units. We also successfully developed a new Drive Thru format that will allow us to compete effectively in this type of location as we seek new sites. We have a strong pipeline of new shop openings for 2018 and are planning to further accelerate our shop growth, aiming to add in the range of 110-130 net new shops in the year. In keeping with recent years, the majority of these new shops will increase our presence in travel, leisure and work-centred catchments. At the end of 2017 34 per cent of our shop estate was located in these catchment types. 3. Competitive supply chain In January 2017 we communicated details of the next phase of our major investment programme focused on increasing logistics capacity and consolidating our manufacturing operations into centres of excellence in order to support shop growth. Once implemented this new supply chain platform will deliver improvements to product quality, our competitiveness and, alongside systems investment, will complete our transformation from traditional bakery to food-on-the-go. Overall our expansion plans will create thousands of new roles in retail and distribution operations but will result in fewer jobs in manufacturing. Decisions such as these, which impact our people, are always difficult but our teams have shown commitment and

8
professionalism throughout these changes and we have been able to agree a way forward on a basis of voluntary redundancy in the majority of cases. This investment phase is a complicated programme of work which will take until 2020 to complete. We have made a good start in 2017, completing the transfer of our Edinburgh operations to our Glasgow bakery, which has been extended to become a centre of excellence for ‘Yum Yum’ production, and extending our Leeds bakery to create a centre of excellence for cake and muffin manufacturing. The year ahead will be the peak year for investment in the programme including the creation of our centre of excellence for doughnuts in our Gosforth Park bakery. Strategic change of this magnitude is always challenging and I am grateful for the commitment of our teams who have been making these changes whilst maintaining service standards to our shops. 4. First class support teams We have made further significant progress in the fourth year of our major process and systems investment programme. In 2017 we successfully deployed our largest ever systems roll out, replacing our traditional shop ordering with a new central forecasting and replenishment process. We have already seen benefits in improved product availability for customers and expect to see savings start to come through in lower wastage figures as we become more experienced with the system’s capabilities. In the second half of the year we successfully deployed pilots in both logistics and manufacturing which will be rolled out alongside our supply chain investment programme. Scoping work has also begun for the remaining SAP support modules, with human resources, payroll and property management to be implemented in 2018. Having a positive impact on people’s lives Greggs has a long-standing tradition and reputation as a socially responsible business and as such we want our actions to have a positive impact on people’s lives. This ambition covers a broad range of stakeholders and in 2017 we made further improvements in all areas and were pleased to achieve an increase to a ‘4.5 star’ rating in the Business in the Community CR index in early 2018. We encourage healthier food-on-the-go choices As a leading bakery food-on-the-go retailer we recognise that many of the products we sell are traditional favourites best eaten in moderation. As such we aim to capture as much of the demand for these products as possible in a highly-competitive market but at the same time we are taking steps to encourage customers to see Greggs as a food-on-the-go retailer selling a variety of products, including healthier options. Our range of Balanced Choice products offers that choice at below 400 calories with good nutritional values and now represents over £100 million of sales. We are committed to encouraging customers to make healthier food-on-the-go choices and are taking active steps by offering this range in all of our shops nationwide, providing access to all and allocating prominent and disproportionate space to bring these products to customers’ attention.

9
Alongside Balanced Choice we are working on sugar reduction, in addition to the salt and fat reductions seen in recent years. Other initiatives include working with New Cross Hospital in Wolverhampton to redesign the retail format of our shop there and the product range to meet the requirements of NHS guidance. In addition, in 2017 we made the ‘Pledge for Veg’ in partnership with the Food Foundation, through which we will help customers to increase their vegetable intake through design of our salads, soups and cold sandwiches. We care where our products come from All the tea, coffee, hot chocolate, orange juice, apple juice and bananas we sell are certified Fairtrade. We source our prawns and tuna from sustainable sources and have recently maintained our ‘Tier 2’ status, despite increased requirements, in the Business Benchmark on Farm Animal Welfare. In our internal supply chain the majority of our manufacturing sites have achieved AA standard on version seven of the BRC Global standard for food safety. We share our success with the community around us We continue to share our success with the local communities in which we operate. In 2017 this included increasing the amount of end-of-day food that we donated to good causes by 45 per cent and continuing to support the work of the Greggs Foundation, which celebrated its 30th anniversary in 2017. Through the generous support of Greggs and other donors and fundraisers, including our staff and customers, the Greggs Foundation was able to distribute £3.1 million to support a wide range of initiatives that improve the quality of life in our local communities. These included the award-winning Greggs Breakfast Club programme which, with support from 80 partners, now provides six million free wholesome breakfasts each year to children in over 465 primary schools. We aim to use energy efficiently and minimise waste We hold the Carbon Trust Standard in recognition of our work on carbon efficiencies and our Environmental Management System is certificated to ISO 14001. We continue to trial technologies that could help to reduce our carbon footprint even further in the years ahead. We know that coffee cup recycling is a significant issue and, as a responsible business, we are working hard to reduce our impact on the environment and do our bit to help find a solution. We are currently conducting a trial in 20 shops across Manchester and Liverpool city centres to establish feasibility for in-store recycling of hot drinks cups. This will give us the opportunity to ensure we have a robust and effective process in place before potentially rolling out further. In addition, we sell reusable hot drinks cups in all of our shops and offer customers a 20 pence discount when using a reusable cup. Greggs is also part of the Paper Cup Recycling and Recovery Group and is working with others in the industry towards delivering a long-term, nationwide paper cup recycling solution. We continue to work hard with our suppliers to further improve our hot drink cups to ensure that they are as sustainable as possible. Reducing the use of plastic in society is another issue where we are trying to play our part. As a vertically-integrated business we have a natural advantage in making most of our products ourselves and controlling the way in which they are distributed. For example, we distribute food to our shops using reusable trays and have separation processes behind the scenes to support recycling. Going forward we aim to reduce further the amount of plastic involved in our processes.

10
We are committed to creating a great place to work We pay all of our people more than the National Living Wage, including those under the age of 25. We share ten per cent of our profits with employees and will be sharing a record £9.2 million with our people as a result of our strong performance in 2017. Our Employee Opinion Survey engagement score has increased by five percentage points over the last two years; 81 per cent of our people say they feel committed to Greggs and to helping us achieve our goals. However, we are not complacent and in the year ahead will be working towards achieving the National Equality Standard as part of our commitment to make Greggs an even better place to work. We are committed to supporting the development of all our colleagues, in particular our talented female colleagues, as we work towards reducing our gender pay gap, which currently stands at 22 per cent. We have made good progress with this in recent years and at Board level have exceeded government guidelines with 43 per cent of our Board being women. Further details of all of our actions in these areas are described in the annual report. Outlook for 2018 Whilst the UK consumer outlook remains challenging, with industry-wide cost pressures expected to moderate but continue in the year ahead, we are encouraged by the start to the year. Company-managed shop like-for-like sales in the eight weeks to 24 February 2018 have grown by 3.2 per cent, and total sales are up 6.2 per cent. 2018 will be the peak year for investment in our supply chain as we create the platforms for further growth. We also plan to open a record number of new shops as we implement our plan to grow Greggs as a leading food-on-the-go brand.
Roger Whiteside Chief Executive
27 February 2018

11
Financial review In 2017 we delivered another good financial performance, mitigating the impact of increased cost inflation whilst managing a significant investment programme. The costs of this programme, along with continued growth in our estate, were all self-funded from our strong cash flow, whilst we also increased dividends to shareholders. 2017
£m 2016
£m Revenue 960.0 894.2 Operating profit (excluding exceptional items and property profits)
81.7 78.1
Property profits 0.5 2.2
Operating profit (excluding exceptional items) 82.2 80.3 Operating margin (excluding exceptional items) 8.6% 9.0%
Finance expense (0.4) (0.0)
Profit before taxation (excluding exceptional items) 81.8 80.3 Exceptional items (9.9) (5.2)
Profit before taxation 71.9 75.1
Sales Total Group sales for the 52 weeks ended 30 December 2017 were £960.0 million (2016: £894.2 million), an increase of 7.4 per cent. Sales in company-managed shops with more than one calendar year’s trading history (’like-for-like’) grew by 3.7 per cent to £817.5 million (2016: £788.5 million). We also saw like-for-like and total sales growth in our franchised shop estate. Profit Operating profit before exceptional items was £82.2 million (2016: £80.3 million). This included a £0.5 million contribution from property disposals (2016: £2.2 million). Excluding the impact of property profits from both years, the underlying growth in operating profit was 4.6 per cent. The result reflects strong sales growth in a year when, as expected, we experienced higher than historical cost inflation. Pre-tax profit before exceptional items was £81.8 million (2016: £80.3 million). Including exceptional items, pre-tax profit was £71.9 million (2016: £75.1 million). Exceptional items In 2016 we commenced the first phase of our major investment programme to reshape our internal supply chain, and this has continued throughout 2017. Activity in 2017 included the relocation of Yum Yum manufacturing to our Glasgow site, and expansion of that site to consolidate our distribution activity in Scotland following the closure in May of our Edinburgh bakery. In addition, we consolidated manufacturing of small cakes and muffins at our Leeds bakery and relocated our pizza manufacturing to our Manchester site. Including related exceptional property gains, the total exceptional charge in relation to this programme was £10.1 million in 2017 (2016: £6.4 million). After adjustments made for the

12
reversal of prior year exceptional costs the total exceptional charge for the year was £9.9 million (2016: £5.2 million), comprised as follows: 2017 2016 £m £m Supply chain restructuring:
- redundancy costs 7.4 4.1 - transfer of operations 1.3 0.4 - property-related 0.5 -
Cash costs of supply chain restructuring 9.2 4.5
- depreciation and asset write-offs 1.3 1.9 - property disposal gains (0.4) -
Net supply chain restructuring charge 10.1 6.4 Restructuring of support functions - 0.4
Release of prior years’ exceptional items: - dilapidations - (0.5) - other property provisions (0.2) (0.9) - restructuring of support functions - (0.2)
Total exceptional items 9.9 5.2
We continue to expect the total exceptional cash costs of our supply chain investment programme, excluding any associated property disposal gains, to be in the region of £25.0 million. Our expectation of non-cash costs (accelerated depreciation and asset write-offs) associated with the programme has reduced to £5.0 million (previously £7.0 million). Total charges so far have totalled £16.5 million and we expect a further £6.0 million in 2018. A property gain of £0.4 million resulting from the disposal of our Edinburgh site was treated as exceptional in the year because the site closure came as a result of the overall supply chain restructuring programme. We have now exchanged contracts for the conditional disposal of our vacant Twickenham site. Should this progress to completion then any resultant profit will also be treated as an exceptional gain. We continue to expect the total proceeds arising from supply chain site disposals to be in line with those anticipated in our investment plan. In 2017 the total cash impact of exceptional items was a net outflow of £1.9 million (2016: £3.8 million cash outflow). We expect the 2018 cash outflow in respect of exceptional items to be c.£12.5 million. Operating margin Operating margin before finance expenses and exceptional items was 8.6 per cent (2016: 9.0 per cent). Including exceptional items, the operating margin was 7.5 per cent (2016: 8.4 per cent). Gross margin before exceptional items was stable year-on-year at 63.7 per cent (2016: 63.7 per cent). We experienced high levels of food input cost inflation for most of the year but the impact of this on gross margin was partly mitigated by lower costs in our supply chain as a result of site closures. Including exceptional items gross margin was 62.7 per cent (2016: 63.2 per cent).

13
In an inflationary environment savings from our actions to make the business simpler and more efficient have become even more important. In 2017 we delivered savings of £9.7 million (2016: £7.1 million). Benefits were achieved through procurement initiatives and as a result of improvements across our retail and supply chain operations. Cost inflation will continue to be a headwind in 2018 and we will redouble our efforts to mitigate this impact through our efforts to make the business more efficient. As noted above, in 2017 we recognised gains on the disposal of freehold properties totalling £0.5 million (2016: £2.2 million). These were in addition to the property gain on disposal of our Edinburgh site, which was treated as exceptional. Financing charges There was a net financing expense of £0.4 million in the year (2016: £0.0 million) reflecting the funding position of the defined benefit pension scheme, partially offset by interest received and exchange gains. In the year ahead we expect to incur a financing expense of around £0.2 million relating to the net liability of the pension scheme at the start of the year. Taxation The Company has a simple corporate structure, carries out its business entirely in the UK and all taxes are paid there. We aim to act with integrity and transparency in respect of our taxation obligations. Excluding the effect of exceptional items the Group’s underlying effective tax rate was 20.7 per cent (2016: 22.5 per cent). The overall tax rate for the year including exceptional items was 20.9 per cent (2016: 22.8 per cent). The year-on-year reduction in the effective rate primarily reflected reductions in the headline rate of corporation tax and settlement of prior year tax computations. We expect the effective rate for 2018 to be around 21.25 per cent and that the effective rate going forward will continue to be around two per cent above the headline corporation tax rate. This is principally due to disallowed expenditure such as depreciation on non-tax-deductible qualifying properties and costs of acquisition of new shops. Earnings per share Diluted earnings per share before exceptional items were 63.5 pence (2016: 60.8 pence), an increase of 4.4 per cent. Basic earnings per share before exceptional items were 64.5 pence (2016: 62.0 pence). Including exceptional items diluted earnings per share were 55.7 pence (2016: 56.7 pence) and basic earnings per share were 56.6 pence (2016: 57.8 pence). Dividend The Board recommends a final ordinary dividend of 22.0 pence per share (2016: 21.5 pence). Together with the interim dividend of 10.3 pence (2016: 9.5 pence) paid in October 2017, this makes a total ordinary dividend for the year of 32.3 pence (2016: 31.0 pence). This is covered two times by diluted earnings per share before exceptional items in line with our progressive dividend policy. Our policy on special distributions is outlined below under ’Cash flow and capital structure’. Subject to the approval of shareholders at the Annual General Meeting, the final dividend will be paid on 18 May 2018 to shareholders on the register on 20 April 2018.
14
Balance sheet Capital expenditure We invested a total of £70.4 million (2016: £80.4 million) on capital expenditure in the business during 2017, less than we had originally expected due to later phasing of a number of new shop openings and supply chain projects. The total included £40.8 million for development and maintenance of our retail estate and £4.4 million in respect of IT infrastructure. Investment in our supply chain of £23.4 million included works at our Glasgow and Leeds bakeries to consolidate production of Yum Yums, small cakes and muffins, and preparations for further such projects in Manchester and Newcastle in the year ahead. Depreciation and amortisation in the year was £53.5 million (2016: £45.6 million). 2018 will be a year of record investment in the business as we reach the peak of our capital expenditure on consolidation of our manufacturing activities. This aspect of our investment programme is expected to require around £45m of capital expenditure in 2018. We will also continue to grow and diversify our shop estate through the opening of c.90 new company-managed shops, with further openings funded by franchise partners. Overall we plan capital expenditure of around £95 million in 2018. There will be further investment to complete our supply chain programme across 2019 and 2020 and the bulk of the work to modernise our IT systems should also complete in this timeframe. Assuming that we invest to support continued growth of c.100 net shops per year then we expect capital expenditure of c.£95 million in 2019 reducing to c.£80 million in 2020. Working capital Group net current liabilities decreased to £21.4 million at the end of 2017 (2016: £28.8 million). We held higher cash balances at the end of 2017 as a result of delays in the phasing of capital expenditure, as noted above. Inventory levels rose by £2.8 million and receivables rose by £2.7 million in the year. The £6.5 million increase in current liabilities largely reflected a higher level of restructuring provisions resulting from the changes made to our supply chain in the year. Pension scheme liability The net liability shown on the balance sheet for the Company’s closed defined benefit pension scheme reduced to £7.5 million (2016: £22.9 million). The assets of the scheme performed strongly in 2017, reducing the liability by £8.8m. In addition, in order to reflect scheme experience, an allowance has now been included in the valuation for expected commutation of pensions. This reduced the liability by £7.0m. The scheme underwent a full actuarial revaluation in 2017, which showed no current requirement for Company contributions. Return on capital We manage return on capital against predetermined targets and monitor performance through our Investment Board, where all capital expenditure is subject to rigorous appraisal before and after it is made. For investments in new shops we target an average cash return on invested capital of 25 per cent, with a hurdle rate of 22.5 per cent, over an average investment cycle of seven years. Other investments are appraised using discounted cash flow analysis.

15
The performance of new shops opened in 2017 was encouraging, with sales above the level expected at the time of investment. New shops opened in 2016 are maturing well and are now above our target for return on investment. We continue to see particularly strong returns on the relocation of shops within their existing catchments. We delivered an overall return on capital employed (ROCE, defined in Note 10) for 2017 of 26.9 per cent excluding exceptional items (2016: 28.1 per cent). The reduction in ROCE was expected given the level of supply chain investment in the year. Cash flow and capital structure The net cash inflow from operating activities in the year was £116.9 million (2016: £117.6 million). At the end of the year the Group had net cash and cash equivalents of £54.5 million (2016: £46.0 million). Having taken into account the views of shareholders the Board continues to believe that it is appropriate to maintain a target year-end net cash position of around £40 million to allow for seasonality in our working capital cycle and to protect the interests of all creditors. Looking forward we intend to maintain our progressive dividend policy and, to the extent that we have material surplus capital within the Group, the Board would expect to return capital to shareholders, likely by way of special dividends. In 2018 we expect that cash generated will be required to meet the Group’s investment plans whilst paying ordinary dividends in line with our policy.
Richard Hutton Finance Director
27 February 2018

16
Greggs plc
Consolidated income statement for the 52 weeks ended 30 December 2017 (2016: 52 weeks ended 31 December 2016)
Note 2017 2017 2017 2016 2016 2016 Excluding
exceptional items
Exceptional items
(see Note 3)
Total
Excluding exceptional
items
Exceptional items
(see Note 3)
Total
£’000 £’000 £’000 £’000 £’000 £’000 Revenue 2 960,005 - 960,005 894,195 - 894,195 Cost of sales (348,098) (10,060) (358,158) (324,289) (4,367) (328,656) ________ ________ ________ ________ ________ ________ Gross profit 611,907 (10,060) 601,847 569,906 (4,367) 565,539 Distribution and selling costs
(476,215) 198 (476,017) (441,246) (594) (441,840)
Administrative expenses
(53,517) - (53,517) (48,315) (216) (48,531)
________ ________ ________ ________ ________ ________ Operating profit 82,175 (9,862) 72,313 80,345 (5,177) 75,168 Finance expense (368) - (368) (26) - (26) ________ ________ ________ ________ ________ ________ Profit before tax 81,807 (9,862) 71,945 80,319 (5,177) 75,142 Income tax 4 (16,923) 1,884 (15,039) (18,064) 915 (17,149) ________ ________ ________ ________ ________ ________ Profit for the financial year attributable to equity holders of the Parent
64,884
(7,978)
56,906
62,255
(4,262)
57,993
======= ======= ======= ======= ======= ======= Basic earnings per share
5 64.5p (7.9p) 56.6p 62.0p (4.2p) 57.8p
Diluted earnings per share
5 63.5p (7.8p) 55.7p 60.8p (4.1p) 56.7p
17
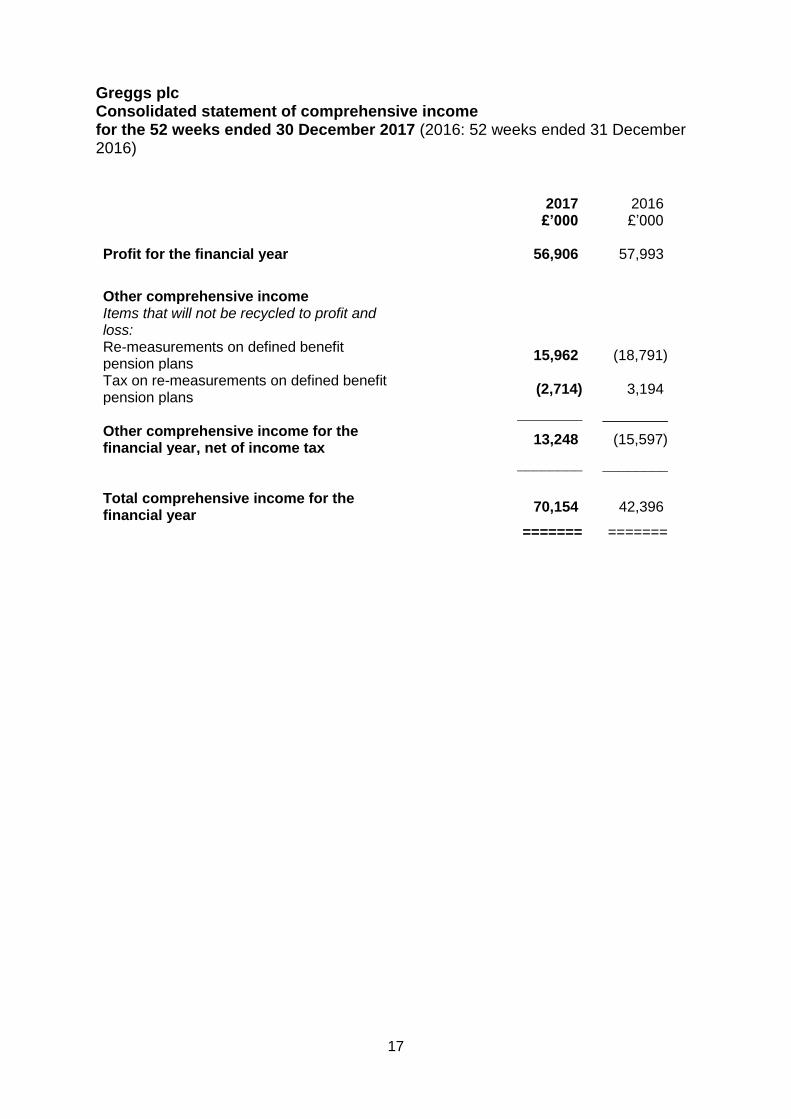
Greggs plc Consolidated statement of comprehensive income for the 52 weeks ended 30 December 2017 (2016: 52 weeks ended 31 December 2016)
2017 2016 £’000 £’000 Profit for the financial year 56,906 57,993
Other comprehensive income Items that will not be recycled to profit and loss:
Re-measurements on defined benefit pension plans
15,962 (18,791)
Tax on re-measurements on defined benefit pension plans
(2,714) 3,194
________ ________ Other comprehensive income for the financial year, net of income tax
13,248 (15,597)
________ ________ Total comprehensive income for the financial year
70,154 42,396
======= =======

18
Greggs plc Consolidated Balance Sheet at 30 December 2017 (2016: 31 December 2016)
2017 2016 ASSETS £’000 £’000 Non-current assets Intangible assets 14,737 14,254 Property, plant and equipment 319,195 307,363 Deferred tax asset 782 1,750 ________ ________ 334,714 323,367 Current assets Inventories 18,688 15,934 Trade and other receivables 33,365 30,713 Cash and cash equivalents 54,503 45,960 ________ ________ 106,556 92,607 ________ ________ Total assets 441,270 415,974 ________ ________ LIABILITIES Current liabilities Trade and other payables (107,126) (104,924) Current tax liability (8,714) (10,426) Provisions (12,090) (6,088) ________ ________ (127,930) (121,438) Non-current liabilities Other payables (5,127) (5,599) Defined benefit pension liability (7,506) (22,851) Long-term provisions (1,344) (1,426) ________ ________ (13,977) (29,876) ________ ________ Total liabilities (141,907) (151,314) ________ ________ Net assets 299,363 264,660 ======= =======
EQUITY Capital and reserves Issued capital 2,023 2,023 Share premium account 13,533 13,533 Capital redemption reserve 416 416 Retained earnings 283,391 248,688 ________ ________ Total equity attributable to equity holders of the Parent
299,363 264,660
======= =======
19
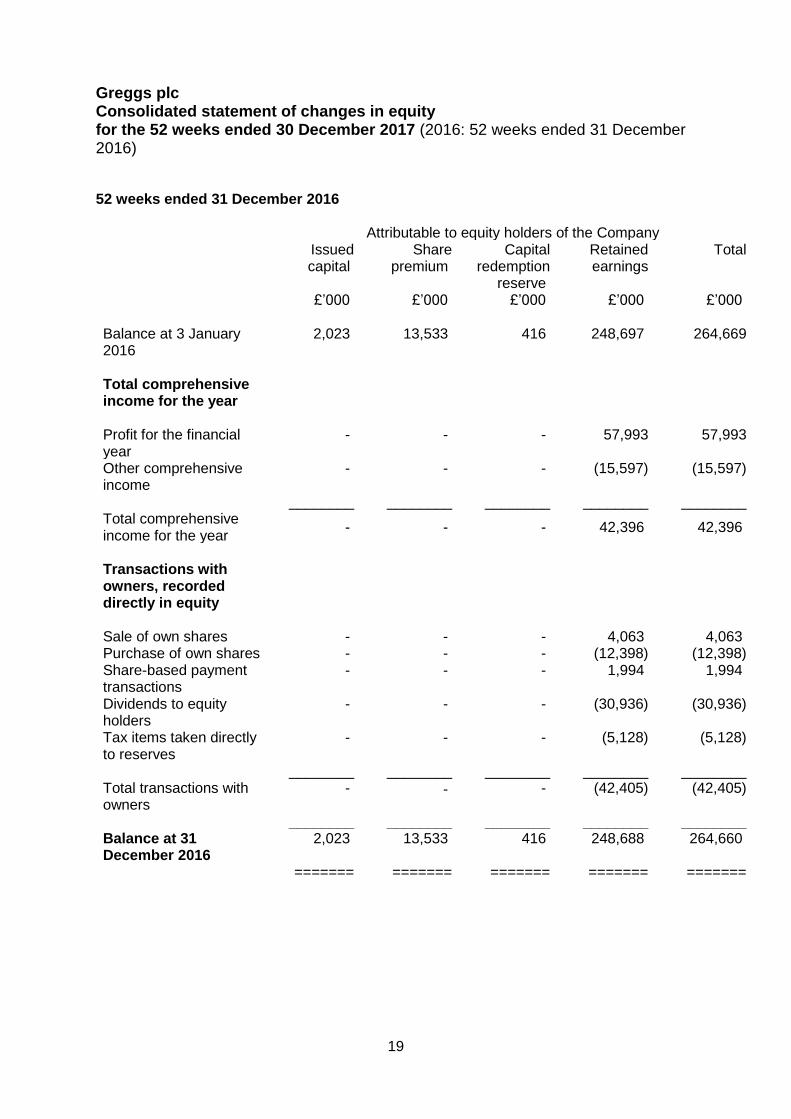
Greggs plc Consolidated statement of changes in equity for the 52 weeks ended 30 December 2017 (2016: 52 weeks ended 31 December 2016) 52 weeks ended 31 December 2016 Attributable to equity holders of the Company Issued
capital Share
premium Capital
redemption reserve
Retained earnings
Total
£’000 £’000 £’000 £’000 £’000 Balance at 3 January 2016
2,023 13,533 416 248,697 264,669
Total comprehensive income for the year
Profit for the financial year
- - - 57,993 57,993
Other comprehensive income
- - - (15,597) (15,597)
________ ________ ________ ________ ________ Total comprehensive income for the year
- - - 42,396 42,396
Transactions with owners, recorded directly in equity
Sale of own shares - - - 4,063 4,063 Purchase of own shares - - - (12,398) (12,398) Share-based payment transactions
- - - 1,994 1,994
Dividends to equity holders
- - - (30,936) (30,936)
Tax items taken directly to reserves
- - - (5,128) (5,128)
________ ________ ________ ________ ________ Total transactions with owners
- - - (42,405) (42,405)
________ ________ ________ ________ ________ Balance at 31 December 2016
2,023 13,533 416 248,688 264,660
======= ======= ======= ======= =======
20
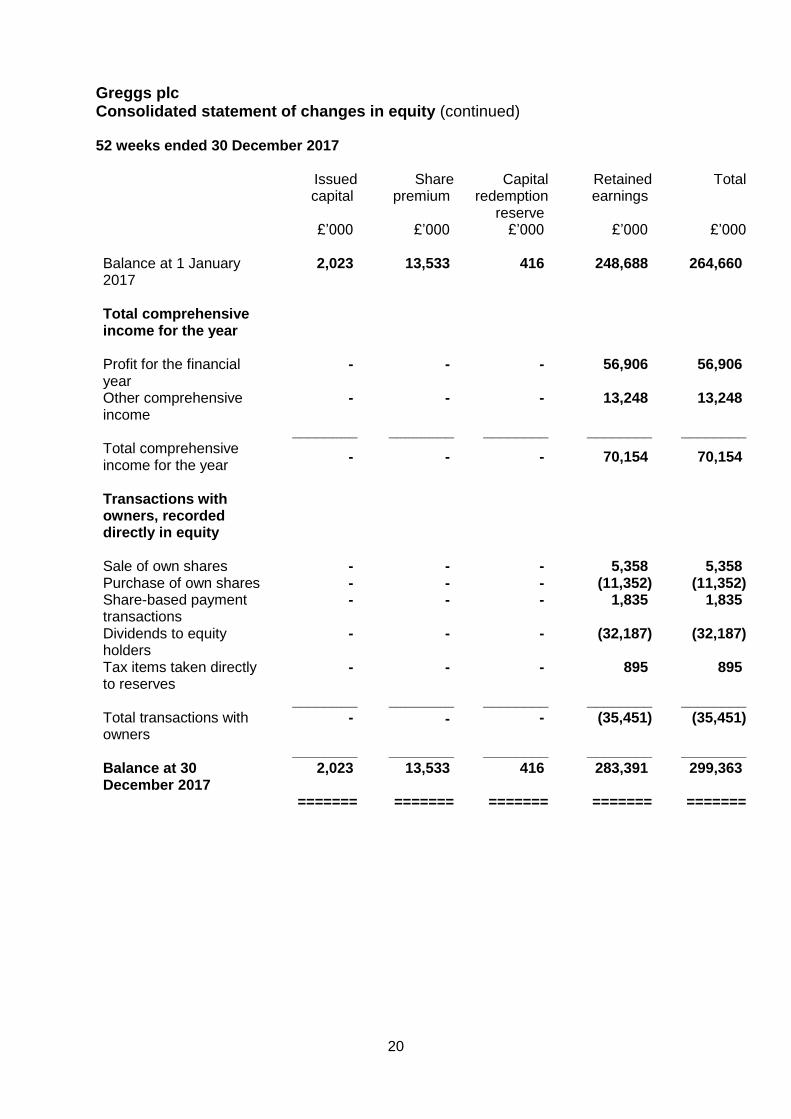
Greggs plc Consolidated statement of changes in equity (continued) 52 weeks ended 30 December 2017 Issued
capital Share
premium Capital
redemption reserve
Retained earnings
Total
£’000 £’000 £’000 £’000 £’000 Balance at 1 January 2017
2,023 13,533 416 248,688 264,660
Total comprehensive income for the year
Profit for the financial year
- - - 56,906 56,906
Other comprehensive income
- - - 13,248 13,248
________ ________ ________ ________ ________ Total comprehensive income for the year
- - - 70,154 70,154
Transactions with owners, recorded directly in equity
Sale of own shares - - - 5,358 5,358 Purchase of own shares - - - (11,352) (11,352) Share-based payment transactions
- - - 1,835 1,835
Dividends to equity holders
- - - (32,187) (32,187)
Tax items taken directly to reserves
- - - 895 895
________ ________ ________ ________ ________ Total transactions with owners
- - - (35,451) (35,451)
________ ________ ________ ________ ________ Balance at 30 December 2017
2,023 13,533 416 283,391 299,363
======= ======= ======= ======= =======

21
Greggs plc Consolidated statement of cashflows for the 52 weeks ended 30 December 2017 (2016: 52 weeks ended 31 December 2016) 2017 2016 £’000 £’000 Operating activities Cash generated from operations (see below) 134,470 133,773 Income tax paid (17,602) (16,157) ________ ________ Net cash inflow from operating activities 116,868 117,616 ________ ________ Investing activities Acquisition of property, plant and equipment (68,646) (74,016) Acquisition of intangible assets (3,918) (6,106) Proceeds from sale of property, plant and equipment 2,171 4,698 Interest received 249 124 ________ ________ Net cash outflow from investing activities (70,144) (75,300) ________ ________ Financing activities Sale of own shares 5,358 4,063 Purchase of own shares (11,352) (12,398) Dividends paid (32,187) (30,936) ________ ________ Net cash outflow from financing activities (38,181) (39,271) ________ ________ Net increase in cash and cash equivalents 8,543 3,045 Cash and cash equivalents at the start of the year 45,960 42,915 ________ ________ Cash and cash equivalents at the end of the year 54,503 45,960 ======= =======
Cash flow statement – cash generated from operations 2017 2016 £’000 £’000 Profit for the financial year 56,906 57,993 Amortisation 3,435 2,100 Depreciation 50,044 43,453 (Reversal of impairment) / impairment (415) 488 Loss on sale of property, plant and equipment 2,719 2,476 Release of government grants (472) (472) Share-based payment expenses 1,835 1,994 Finance expense 368 26 Income tax expense 15,039 17,149 Increase in inventories (2,754) (490) Increase in receivables (2,652) (3,066) Increase in payables 4,497 11,845 Increase in provisions 5,920 277 ________ ________ Cash from operating activities 134,470 133,773 ======= =======

22
Greggs plc Notes 1. Basis of preparation and accounting policies The preliminary announcement has been prepared in accordance with the recognition and measurement principles of International Financial Reporting Standards as adopted by the EU ("adopted IFRSs"), IFRIC interpretations and the Companies Act 2006 applicable to companies reporting under IFRS. It does not include all the information required for full annual accounts.
The financial information set out above does not constitute the Company's statutory accounts for the years ended 30 December 2017 or 31 December 2016 but is derived from these accounts. Statutory accounts for the 52 weeks ended 31 December 2016 have been delivered to the registrar of companies, and those for the 52 weeks ended 30 December 2017 will be delivered in due course. The auditor has reported on those accounts; the audit reports were (i) unqualified, (ii) did not include a reference to any matters to which the auditor drew attention by way of emphasis without qualifying their report and (iii) did not contain a statement under section 498 (2) or (3) of the Companies Act 2006.
The preliminary announcement has been prepared using the accounting policies published in the Group’s accounts for the 52 weeks ended 31 December 2016, which are available on the Company’s website www.greggs.co.uk. There are no accounting standards, amendments or interpretations that have been adopted by the Group since 1 January 2017.
2. Segmental analysis The Board is considered to be the “chief operating decision maker” of the Group in the context of the IFRS 8 definition. In addition to its retail activities, the Group generates revenues from franchise and wholesale. However, these elements of the business are not sufficiently significant to be “Reportable Segments” in the context of IFRS 8.
Products and services - the Group sells a consistent range of fresh bakery goods, sandwiches and drinks in its shops. The Group also provides frozen bakery products to its wholesale customers.
Major customers - the majority of sales are made to the general public on a cash basis. A small proportion of sales are made on credit to certain organisations, including wholesale customers, but these are immaterial in a Group context.
Geographical areas - all results arise in the UK.
The Board regularly reviews the revenues of each segment separately but receives information on profits, assets and liabilities on an aggregated basis consistent with the Group accounts. Of the Group’s revenue, £891,778,000 (2016: £835,786,000) was attributable to the retail segment.
23
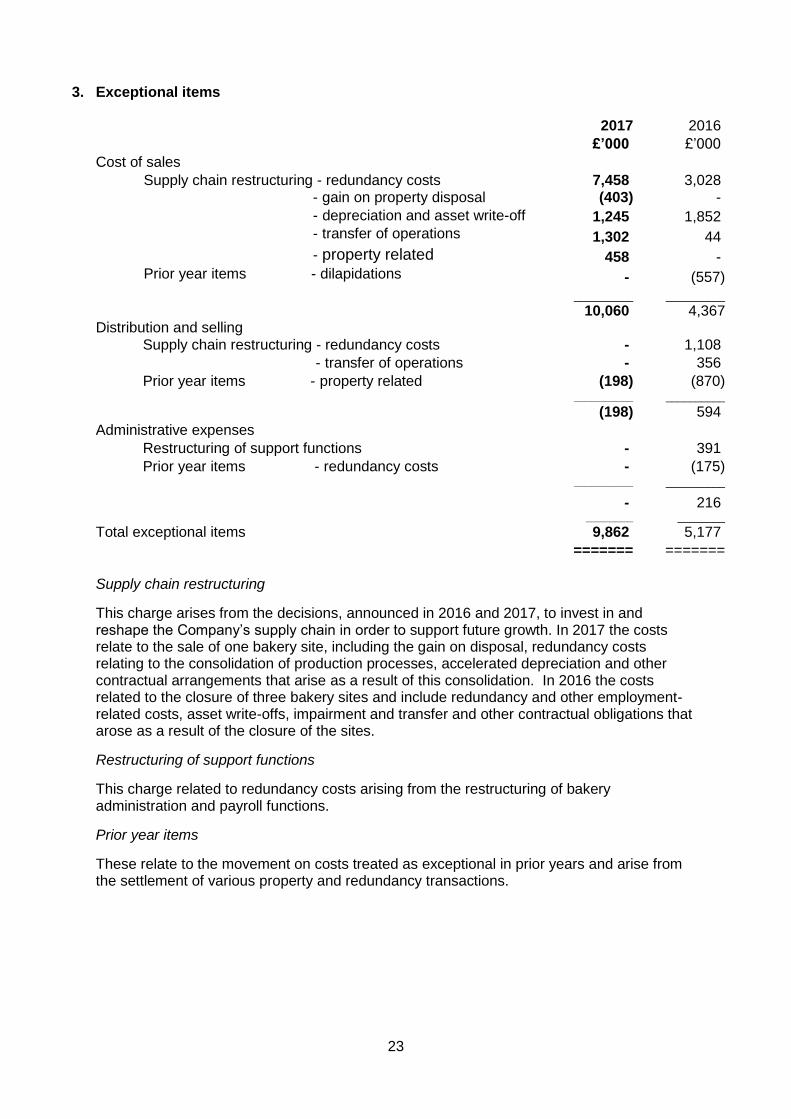
3. Exceptional items 2017 2016
£’000 £’000
Cost of sales
Supply chain restructuring - redundancy costs 7,458 3,028 - gain on property disposal (403) -
- depreciation and asset write-off 1,245 1,852 - transfer of operations 1,302 44
- property related 458 - Prior year items - dilapidations - (557) __________ __________
10,060 4,367 Distribution and selling
Supply chain restructuring - redundancy costs - 1,108
- transfer of operations - 356
Prior year items - property related (198) (870) __________ __________
(198) 594
Administrative expenses
Restructuring of support functions - 391
Prior year items - redundancy costs - (175)
__________ __________
- 216 ________ ________
Total exceptional items 9,862 5,177
======= ======= Supply chain restructuring
This charge arises from the decisions, announced in 2016 and 2017, to invest in and reshape the Company’s supply chain in order to support future growth. In 2017 the costs relate to the sale of one bakery site, including the gain on disposal, redundancy costs relating to the consolidation of production processes, accelerated depreciation and other contractual arrangements that arise as a result of this consolidation. In 2016 the costs related to the closure of three bakery sites and include redundancy and other employment-related costs, asset write-offs, impairment and transfer and other contractual obligations that arose as a result of the closure of the sites.
Restructuring of support functions
This charge related to redundancy costs arising from the restructuring of bakery administration and payroll functions.
Prior year items
These relate to the movement on costs treated as exceptional in prior years and arise from the settlement of various property and redundancy transactions.
24
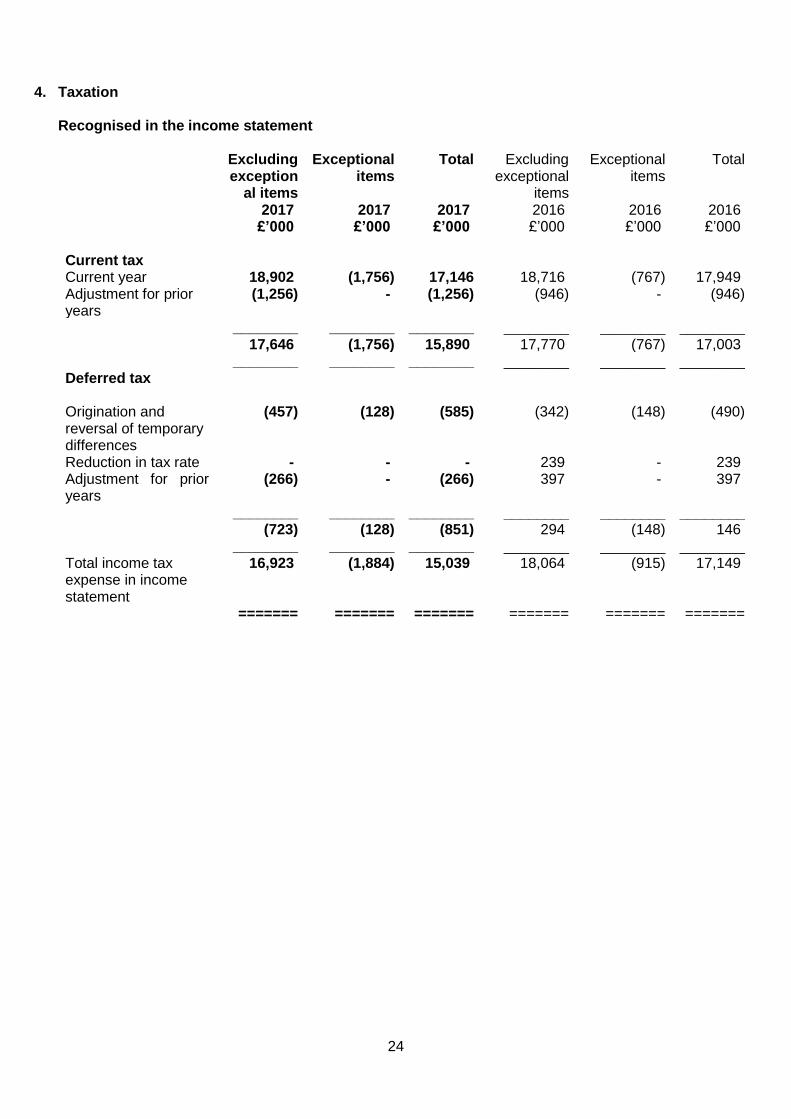
4. Taxation Recognised in the income statement
Excluding
exceptional items
Exceptional items
Total Excluding exceptional
items
Exceptional items
Total
2017 2017 2017 2016 2016 2016 £’000 £’000 £’000 £’000 £’000 £’000 Current tax Current year 18,902 (1,756) 17,146 18,716 (767) 17,949 Adjustment for prior years
(1,256) - (1,256) (946) - (946)
________ ________ ________ ________ ________ ________ 17,646 (1,756) 15,890 17,770 (767) 17,003 ________ ________ ________ ________ ________ ________ Deferred tax Origination and reversal of temporary differences
(457) (128) (585) (342) (148) (490)
Reduction in tax rate - - - 239 - 239 Adjustment for prior years
(266) - (266) 397 - 397
________ ________ ________ ________ ________ ________ (723) (128) (851) 294 (148) 146 ________ ________ ________ ________ ________ ________ Total income tax expense in income statement
16,923 (1,884) 15,039 18,064 (915) 17,149
======= ======= ======= ======= ======= =======
25
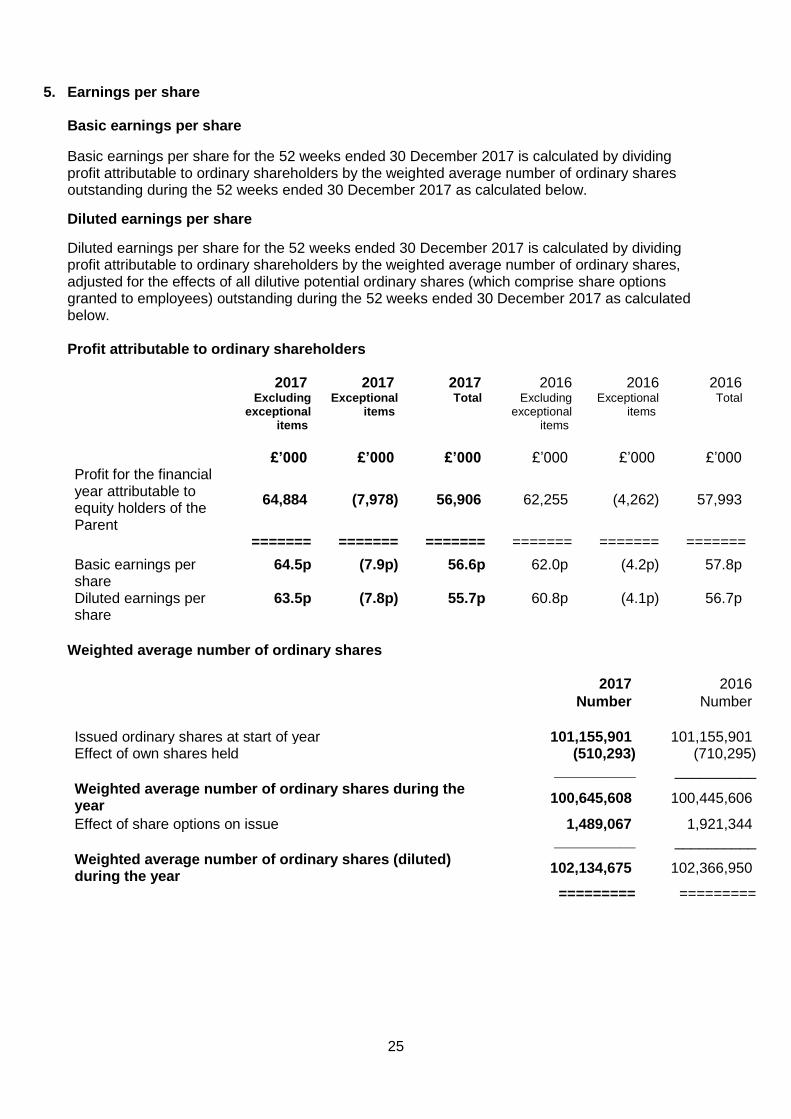
5. Earnings per share Basic earnings per share
Basic earnings per share for the 52 weeks ended 30 December 2017 is calculated by dividing profit attributable to ordinary shareholders by the weighted average number of ordinary shares outstanding during the 52 weeks ended 30 December 2017 as calculated below.
Diluted earnings per share
Diluted earnings per share for the 52 weeks ended 30 December 2017 is calculated by dividing profit attributable to ordinary shareholders by the weighted average number of ordinary shares, adjusted for the effects of all dilutive potential ordinary shares (which comprise share options granted to employees) outstanding during the 52 weeks ended 30 December 2017 as calculated below. Profit attributable to ordinary shareholders
2017 2017 2017 2016 2016 2016 Excluding
exceptional items
Exceptional items
Total Excluding exceptional
items
Exceptional items
Total
£’000 £’000 £’000 £’000 £’000 £’000
Profit for the financial year attributable to equity holders of the Parent
64,884 (7,978) 56,906 62,255 (4,262) 57,993
======= ======= ======= ======= ======= =======
Basic earnings per share
64.5p (7.9p) 56.6p 62.0p (4.2p) 57.8p
Diluted earnings per share
63.5p (7.8p) 55.7p 60.8p (4.1p) 56.7p
Weighted average number of ordinary shares
2017 2016
Number Number
Issued ordinary shares at start of year 101,155,901 101,155,901 Effect of own shares held (510,293) (710,295)
__________ __________
Weighted average number of ordinary shares during the year
100,645,608 100,445,606
Effect of share options on issue 1,489,067 1,921,344
__________ __________
Weighted average number of ordinary shares (diluted) during the year
102,134,675 102,366,950
========= =========
26
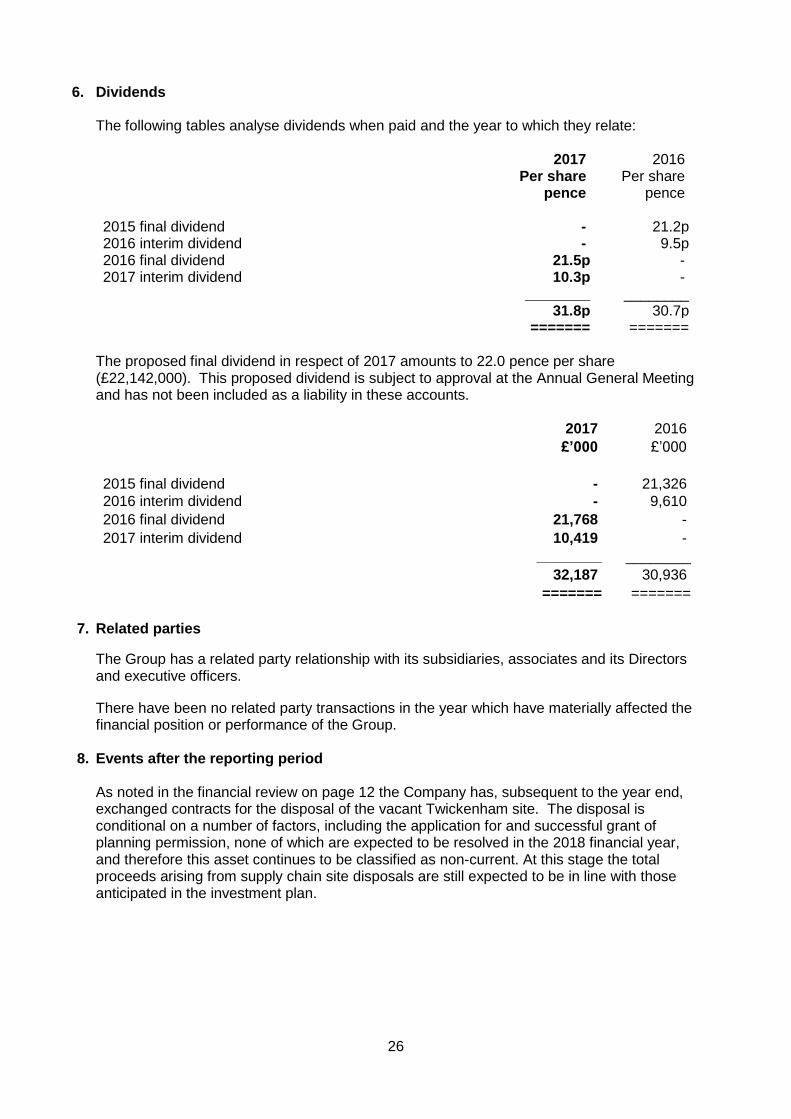
6. Dividends The following tables analyse dividends when paid and the year to which they relate: 2017 2016 Per share Per share pence pence 2015 final dividend - 21.2p 2016 interim dividend - 9.5p 2016 final dividend 21.5p - 2017 interim dividend 10.3p - ________ ________ 31.8p 30.7p ======= =======
The proposed final dividend in respect of 2017 amounts to 22.0 pence per share (£22,142,000). This proposed dividend is subject to approval at the Annual General Meeting and has not been included as a liability in these accounts. 2017 2016
£’000 £’000
2015 final dividend - 21,326
2016 interim dividend - 9,610
2016 final dividend 21,768 -
2017 interim dividend 10,419 -
________ ________
32,187 30,936
======= =======
7. Related parties
The Group has a related party relationship with its subsidiaries, associates and its Directors and executive officers.
There have been no related party transactions in the year which have materially affected the financial position or performance of the Group.
8. Events after the reporting period As noted in the financial review on page 12 the Company has, subsequent to the year end, exchanged contracts for the disposal of the vacant Twickenham site. The disposal is conditional on a number of factors, including the application for and successful grant of planning permission, none of which are expected to be resolved in the 2018 financial year, and therefore this asset continues to be classified as non-current. At this stage the total proceeds arising from supply chain site disposals are still expected to be in line with those anticipated in the investment plan.
27
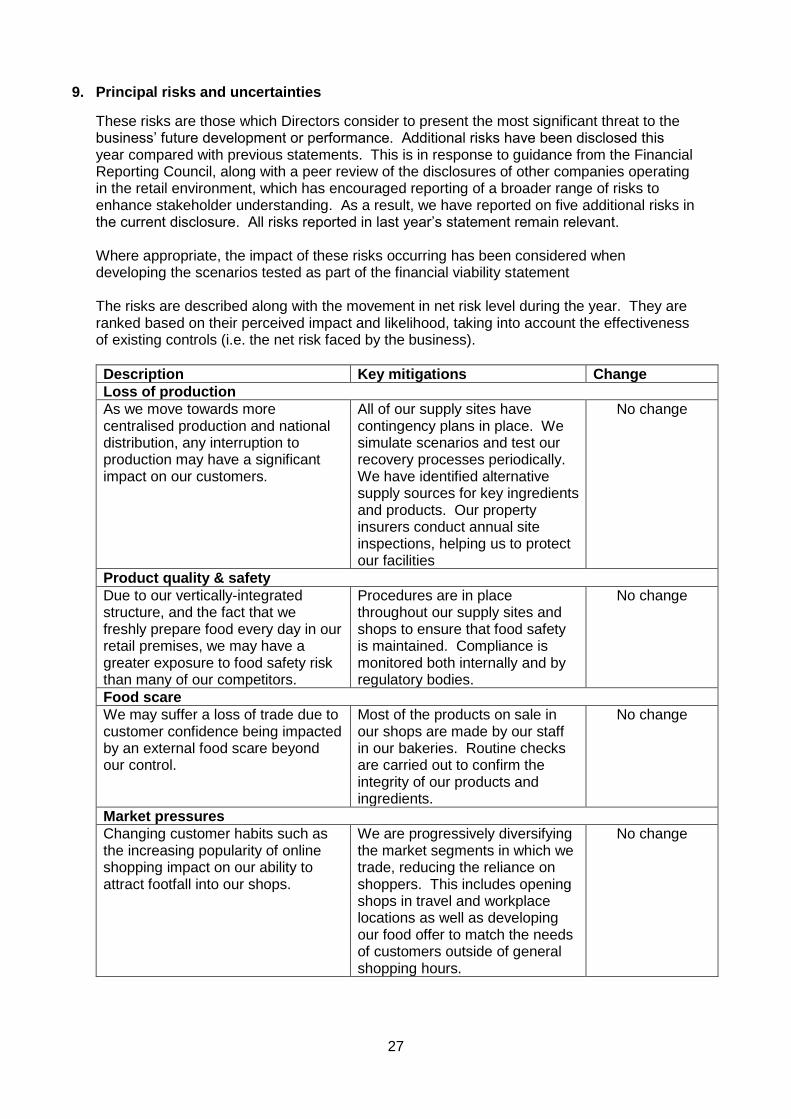
9. Principal risks and uncertainties
These risks are those which Directors consider to present the most significant threat to the business’ future development or performance. Additional risks have been disclosed this year compared with previous statements. This is in response to guidance from the Financial Reporting Council, along with a peer review of the disclosures of other companies operating in the retail environment, which has encouraged reporting of a broader range of risks to enhance stakeholder understanding. As a result, we have reported on five additional risks in the current disclosure. All risks reported in last year’s statement remain relevant. Where appropriate, the impact of these risks occurring has been considered when developing the scenarios tested as part of the financial viability statement The risks are described along with the movement in net risk level during the year. They are ranked based on their perceived impact and likelihood, taking into account the effectiveness of existing controls (i.e. the net risk faced by the business).
Description Key mitigations Change
Loss of production
As we move towards more centralised production and national distribution, any interruption to production may have a significant impact on our customers.
All of our supply sites have contingency plans in place. We simulate scenarios and test our recovery processes periodically. We have identified alternative supply sources for key ingredients and products. Our property insurers conduct annual site inspections, helping us to protect our facilities
No change
Product quality & safety
Due to our vertically-integrated structure, and the fact that we freshly prepare food every day in our retail premises, we may have a greater exposure to food safety risk than many of our competitors.
Procedures are in place throughout our supply sites and shops to ensure that food safety is maintained. Compliance is monitored both internally and by regulatory bodies.
No change
Food scare
We may suffer a loss of trade due to customer confidence being impacted by an external food scare beyond our control.
Most of the products on sale in our shops are made by our staff in our bakeries. Routine checks are carried out to confirm the integrity of our products and ingredients.
No change
Market pressures
Changing customer habits such as the increasing popularity of online shopping impact on our ability to attract footfall into our shops.
We are progressively diversifying the market segments in which we trade, reducing the reliance on shoppers. This includes opening shops in travel and workplace locations as well as developing our food offer to match the needs of customers outside of general shopping hours.
No change

28
Business change
We continue to implement our strategy of transformation into a food-on-the-go retailer, requiring restructuring, capital investment and new systems implementation. Expected timelines or savings may not be met, and there may be disruption to our customers.
We phase our change activity to avoid affecting the Company as a whole wherever possible. Timelines and forecasts are clearly defined and agreed. Progress against these is reported on a regular basis to our Operating Board.
No change
Cyber & data security
As with all businesses, our data and systems are exposed to external threats such as hackers or viruses. These could lead to data breaches, or disruption to our operation. The new General Data Protection Regulation (GDPR) provides a rigorous control framework, with severe penalties for non-compliance.
We actively monitor our networks and systems, including conducting regular penetration testing. Our approach to information security is closely monitored by the Board. We are working to ensure compliance with the GDPR requirements, including data mapping, policy development and staff training.
No change
Consumer trends
As customers become more concerned about nutrition, health and the provenance of food, our traditional products may be perceived as less attractive. The publication of the Government’s 25 year Environmental Strategy and growing concern over the environment may give rise to the introduction of additional levies and taxes.
We continue to work on improving the nutrition of our traditional products, including a commitment to reduce sugar in line with the Government’s Childhood Obesity Strategy. Our “Balanced Choice” range provides healthier options and is growing well. We are working hard to reduce our impact on the environment, including reviewing our packaging designs, introducing a reusable hot drinks cup and continuing to reduce our carbon intensity.
No change
Regulatory and compliance
Following the implementation of new Sentencing Council guidelines, large financial penalties could be imposed on the business for breaches of Food Safety or Health & Safety legislation. Due to the number of stores we operate, and the volume of customer transactions we handle on a daily basis, we may be exposed to isolated incidents which fall below our expected standards and may expose us to prosecution.
We have a system of controls and monitoring in place, and our teams are provided with extensive training on safe processes and procedures. Our audit processes confirm whether proper procedures are being followed.
New

29
Economic climate
Increased uncertainty about the economy and the outcome of Brexit impacts on consumer confidence. Wider economic uncertainty and job insecurity may cause consumers to be more cautious with their discretionary spending.
As a leading value brand, we take steps to control our costs whilst maintaining the quality of our customer offer. We closely monitor our competitiveness and are focused on remaining great value for money.
New
Management of third party relationships
As our reliance on third parties for services, ingredients or business support increases, we become more exposed to their business interruption risks. This could impact on our ability to produce, distribute or sell our products.
Our own contingency arrangements consider the implications of key systems or ingredients being unavailable. All third parties are vetted prior to us engaging with them. Key supplier relationships are managed by our central procurement team.
New
Ability to attract / retain / motivate people
Market forces and particularly the impact of Brexit may result in a shortage of available workforce. This may be compounded by the relative complexity of our shop operations compared with other retailers.
We offer attractive remuneration and benefit packages to reward our teams, along with training and development opportunities. We carry out an annual opinion survey to ensure high levels of employee engagement. We are working to streamline our shop processes and simplify operations for our teams. As part of our business change programme, we are investing in improved recruitment processes.
New
Impact of Brexit
In addition to the risks relating to the economy and resources highlighted above, there is uncertainty regarding the possibility of changes to trading arrangements, customs agreement, tariffs etc. This may give rise to increased costs.
Developments continue to be monitored, with regular review by our Operating Board. Contingency arrangements are being considered.
New
10. Alternative Performance Measures The Group uses alternative performance measures ('APM's) which, although financial measures of either historical or future performance, financial position or cash flows, are not defined or specified by IFRSs. The Directors use a combination of these APMs and IFRS measures when reviewing the performance, position and cash of the Group. The APMs in respect of pre-exceptional results are reconciled in the Income Statement and Notes 3 and 5.

30
Calculations for LFL and ROCE are shown below: Like-for-like (LFL) sales growth – compares year-on-year cash sales in our company-managed shops, excluding any shops which opened, relocated or closed in the current or prior year and is calculated as follows:
2017 2016 £’000 £’000 Current year LFL sales 817,533 777,204 Prior year LFL sales 788,510 745,609 ________ ________ Growth 29,023 31,595 ======== ======== Like-for like sales growth percentage
3.7% 4.2%
Return on capital employed - calculated by dividing profit before tax by the average total assets less current liabilities for the year.
2017 2017 2016 2016 Underlying Including
exceptional items
Underlying Including exceptional
items £’000 £’000 £’000 £’000 Profit before tax 81,807 71,945 80,319 75,142
======= ======= ======= ======= Capital employed:
Opening 294,536 294,536 277,622 277,622 Closing 313,340 313,340 294,536 294,536 ------------- ------------- ------------- ------------- Average 303,938 303,938 286,079 286,079 ======= ======= ======= ======= Return on capital employed
26.9% 23.7% 28.1% 26.3%