Embed Size (px)
Citation preview
Experimental Gas Phase 1H NMR Spectra and Basis Set Dependence ofab initio GIAO MO Calculations of 1H and 13C NMR Absolute Shieldingsand Chemical Shifts of Small Hydrocarbons
Thomas Zuschneid, Holger Fischer, Thomas Handel, Klaus Albert, and Gunter Hafelinger
Institut fur Organische Chemie, Universitat Tubingen, Auf der Morgenstelle 18, D-72076 Tubingen
Reprint requests to Prof. Dr. G. Hafelinger. E-Mail: [email protected]
Z. Naturforsch. 59b, 1153 – 1176 (2004); received February 6, 2003
High-resolution gas phase measurements of 1H NMR spectra at 400 MHz and atmospheric pres-sure of seven small hydrocarbons are presented. The developed new method and the experimentalset-up are described. Ab initio GIAO MO calculations of 1H and 13C NMR absolute shieldings onthe HF, MP2 and B3LYP levels using 25 standard gaussian basis sets are reported for these hydro-carbons, based on experimental re distances. The measured gas phase 1H chemical shifts have beenconverted to an absolute σ0 shielding scale by use of the literature shielding of methane. These andgas phase 13C literature values have been transferred with literature ZPV data to estimated σexp
eshieldings which are used to evaluate the basis set dependence of the calculated σe shieldings uti-lizing linear least squares regressions. Exponential extrapolations of Dunning basis set calculationsallow the determination of basis set limits for 1H and 13C shieldings.
1H and 13C chemical shifts have been derived from the HF calculated shieldings with shieldingsof TMS which has been geometry optimized and GIAO calculated in each basis. Standard deviations(esd) as low as 0.09 ppm for 1H and 0.76 ppm for 13C calculations have been obtained.
The statistically best basis set for simultaneous calculation of 1H and 13C absolute shieldingsor relative shifts is 6-311G∗ within the HF and B3LYP methods. Aiming for highest accuracy andprecision, 1H and 13C have to be treated separately. In this case, best results are obtained usingMP2/6-311G∗∗ or higher for 1H shieldings and MP2/cc-pVTZ for 13C shieldings.
Key words: Experimental Gas Phase 1H NMR Measurements, GIAO MO Calculations, Basis SetDependence, 1H and 13C Absolute Shieldings and Chemical Shifts, Extrapolations withDunning Basis Sets
Introduction
NMR spectroscopy is the most important analyti-cal tool for determinations of molecular structures oforganic molecules developed during the last 40 years[1 – 3].
Ab initio MO calculations of absolute chemicalshieldings (σ ) or chemical shifts (δ , based on referenceto TMS) evolved during the last decades with large im-provements of algorithms, programs and computer ca-pacities as reviewed lately [4 – 6].
A basic problem is the selection of a gauge origin forthe vector potential in the molecular electronic Hamil-tonian which represents not uniquely the applied ex-ternal magnetic field [7]. A first solution to the gaugeproblem was the use of individual gauges for localizedmolecular orbitals (IGLO) by the group of Kutzel-
0932–0776 / 04 / 1000–1153 $ 06.00 c© 2004 Verlag der Zeitschrift fur Naturforschung, Tubingen · http://znaturforsch.com
nigg [8, 9] and other approaches like LORG [10] orCSGT [11]. But the most widely used approach istermed GIAO from gauge including atomic orbitals.Such orbitals had been already suggested in 1937 byLondon for simple HMO calculations of magnetic sus-ceptibilities [12, 13]. Later, Ditchfield introduced theminto ab initio Hartree-Fock theory [14, 15] and sincePulay et al. [16] developed an efficient computer im-plementation in 1990, the GIAO method has becomea standard for calculating NMR chemical shifts, in-stalled in most quantum chemical ab initio programslike GAUSSIAN 98 [17], which we use here.
GIAO NMR calculations usually refer to isolatedrigid molecules with fixed conformations at 0 K andare affected by the following aspects:
1. Selection of molecular geometries [18 – 20].2. Extend and flexibility of basis sets [21 – 24].
1154 T. Zuschneid et al. · Experimental Gas Phase 1H NMR Spectra
3. Calculational procedures (a comparison of HF,DFT and MP2 methods is presented in ref. [23]),with the following aspects:
a) The single-determinantal self-consistentfield Hartree-Fock (HF) method [25] servesas the traditional standard type approach[19, 22, 23].
b) This standard seems to be replaced lately bydensity functional theory (DFT) [26] whichincorporates in formulations for the exchange-correlation functional some effects of electroncorrelation [22, 27 – 31].
c) Post-Hartree-Fock methods: For very accuratecalculations, post-HF methods for treatmentof electron correlation are necessary as devel-oped and reviewed lately by Gauss et al. [5].
d) One approach for this is the many-body per-turbation theory by Møller and Plesset [32]with perturbative treatment of higher excita-tions of second order as MP2 [33], third orderas MP3 [34] and fourth order as MP4 [34].
e) As most advanced treatment of electron cor-relation the coupled cluster (CC) theory hasbeen introduced for single and double exci-tations (CCSD) [35, 36] and perturbative cor-rected triple excitations (CCSD(T)) [37].
f) In multi-correlation SCF theory (MC-SCF) [38] a linear combination of severalSlater determinants is used.
4. Rovibrational and thermal effects [39 – 42] takecare about the thermal occupation of rotationaland vibrational levels from 0 K to the experimen-tal measuring conditions around 300 K. These arenot routinely calculated and available only lately,but necessary for accurate predictions of absoluteshieldings.
5. Relativistic effects [43] are important for heavyatoms but not for hydrocarbons studied here.
6. Environmental effects [44] have to be considered ifsolution NMR spectra are used for comparison aswell as pressure dependence [45, 46] for gas phasedata.
7. For calculations of chemical shifts the standardTMS has to be calculated in a selected geometry(an experimental ED rg structure is reported re-cently in ref. [47]) and with the same basis set asthe considered molecule.
Most papers on GIAO NMR calculations concen-trate on 13C and heteroatom nuclei like 15N, 17O, 19F,
29Si and 31P [22, 23, 27, 29, 31, 48, 49] but less so on1H spectra [21, 24, 28, 30, 50].
Benchmark type calculations for non-hydrogenNMR shieldings of small molecules using the ad-vanced CI methods CCSD(T) [37] and CCSDT [51]with large basis sets lead to agreements in the range ofexperimental accuracy. This level cannot be extendedto larger systems and with less advanced proceduresdeviations in the range of ±5 ppm are obtained for 13Cand ±1 ppm for 1H.
Our aim in this paper is to evaluate the depen-dence of GIAO calculated 1H and 13C NMR shieldingsand chemical shifts of seven hydrocarbons on differentstandard basis sets, independent on variations of theunderlying molecular geometry, for which we selectedexperimental re distances. We used 25 basis sets onthe HF level of theory, 16 for the hybrid DFT B3LYPmethod, and 12 for the MP2 approach.
For experimental 13C values independent of solva-tion effects we used the gas phase data of ref. [46](which are extrapolated to zero pressure) and own de-terminations of gas phase 1H chemical shifts at atmo-spheric pressure.
The accuracy of calculated and experimental NMRvalues is studied statistically by linear least squaresregressions, considering correlation coefficients, stan-dard deviations and the slopes of the best fit straightlines.
Another question remains: Whether to regard rela-tive chemical shifts based on TMS or absolute shield-ings. Though former are the common result of NMRexperiments, therefore being the natural choice forpractical chemists who wish to use calculated valuesas reference or for prediction, only the latter can beobtained directly from ab initio calculations. The gen-eration of relative shifts by subtraction from the ad-ditionally calculated shieldings of the TMS standardgives some benefit through error cancellation [27], butthe effect is not very systematic and dependent on theapplied TMS geometry [47]. Hence, good accuracy ofthe shielding values itself is a legitimate goal.
Since published gas phase NMR measurements ofsimple organic molecules are quite rare, we recorded1H NMR spectra at 400 MHz for all examined com-pounds. Here, attention was paid to obtain spectraat equilibrated temperature and atmospheric pressure.The sample and the reference substance TMS weremeasured together in a new, versatile usable flow probewith the flow NMR technique [52] as described in theexperimental section.
T. Zuschneid et al. · Experimental Gas Phase 1H NMR Spectra 1155
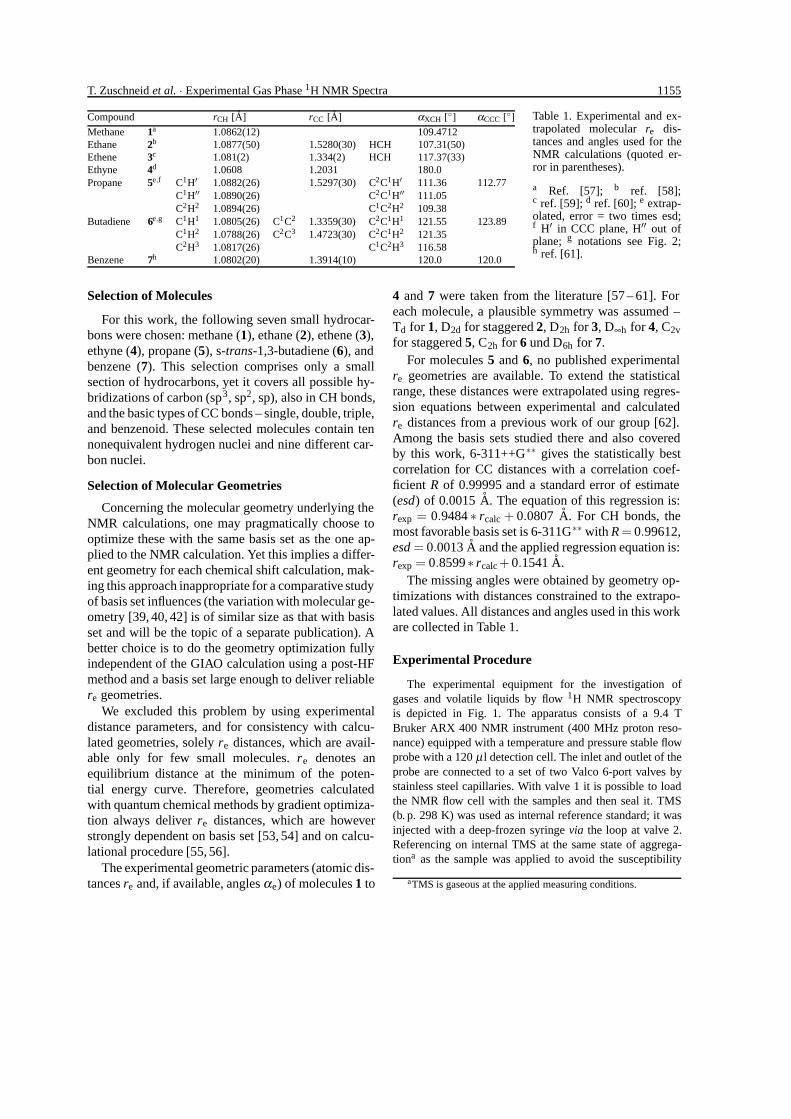
Compound rCH [A] rCC [A] αXCH [◦] αCCC [◦]
Methane 1a 1.0862(12) 109.4712Ethane 2b 1.0877(50) 1.5280(30) HCH 107.31(50)Ethene 3c 1.081(2) 1.334(2) HCH 117.37(33)Ethyne 4d 1.0608 1.2031 180.0Propane 5e,f C1H′ 1.0882(26) 1.5297(30) C2C1H′ 111.36 112.77
C1H′′ 1.0890(26) C2C1H′′ 111.05C2H2 1.0894(26) C1C2H2 109.38
Butadiene 6e,g C1H1 1.0805(26) C1C2 1.3359(30) C2C1H1 121.55 123.89C1H2 1.0788(26) C2C3 1.4723(30) C2C1H2 121.35C2H3 1.0817(26) C1C2H3 116.58
Benzene 7h 1.0802(20) 1.3914(10) 120.0 120.0
Table 1. Experimental and ex-trapolated molecular re dis-tances and angles used for theNMR calculations (quoted er-ror in parentheses).
a Ref. [57]; b ref. [58];c ref. [59]; d ref. [60]; e extrap-olated, error = two times esd;f H′ in CCC plane, H′′ out ofplane; g notations see Fig. 2;h ref. [61].
Selection of Molecules
For this work, the following seven small hydrocar-bons were chosen: methane (1), ethane (2), ethene (3),ethyne (4), propane (5), s-trans-1,3-butadiene (6), andbenzene (7). This selection comprises only a smallsection of hydrocarbons, yet it covers all possible hy-bridizations of carbon (sp3, sp2, sp), also in CH bonds,and the basic types of CC bonds – single, double, triple,and benzenoid. These selected molecules contain tennonequivalent hydrogen nuclei and nine different car-bon nuclei.
Selection of Molecular Geometries
Concerning the molecular geometry underlying theNMR calculations, one may pragmatically choose tooptimize these with the same basis set as the one ap-plied to the NMR calculation. Yet this implies a differ-ent geometry for each chemical shift calculation, mak-ing this approach inappropriate for a comparative studyof basis set influences (the variation with molecular ge-ometry [39, 40, 42] is of similar size as that with basisset and will be the topic of a separate publication). Abetter choice is to do the geometry optimization fullyindependent of the GIAO calculation using a post-HFmethod and a basis set large enough to deliver reliablere geometries.
We excluded this problem by using experimentaldistance parameters, and for consistency with calcu-lated geometries, solely re distances, which are avail-able only for few small molecules. re denotes anequilibrium distance at the minimum of the poten-tial energy curve. Therefore, geometries calculatedwith quantum chemical methods by gradient optimiza-tion always deliver re distances, which are howeverstrongly dependent on basis set [53, 54] and on calcu-lational procedure [55, 56].
The experimental geometric parameters (atomic dis-tances re and, if available, angles αe) of molecules 1 to
4 and 7 were taken from the literature [57 – 61]. Foreach molecule, a plausible symmetry was assumed –Td for 1, D2d for staggered 2, D2h for 3, D∞h for 4, C2vfor staggered 5, C2h for 6 und D6h for 7.
For molecules 5 and 6, no published experimentalre geometries are available. To extend the statisticalrange, these distances were extrapolated using regres-sion equations between experimental and calculatedre distances from a previous work of our group [62].Among the basis sets studied there and also coveredby this work, 6-311++G∗∗ gives the statistically bestcorrelation for CC distances with a correlation coef-ficient R of 0.99995 and a standard error of estimate(esd) of 0.0015 A. The equation of this regression is:rexp = 0.9484 ∗ rcalc + 0.0807 A. For CH bonds, themost favorable basis set is 6-311G∗∗ with R = 0.99612,esd = 0.0013 A and the applied regression equation is:rexp = 0.8599∗ rcalc + 0.1541 A.
The missing angles were obtained by geometry op-timizations with distances constrained to the extrapo-lated values. All distances and angles used in this workare collected in Table 1.
Experimental Procedure
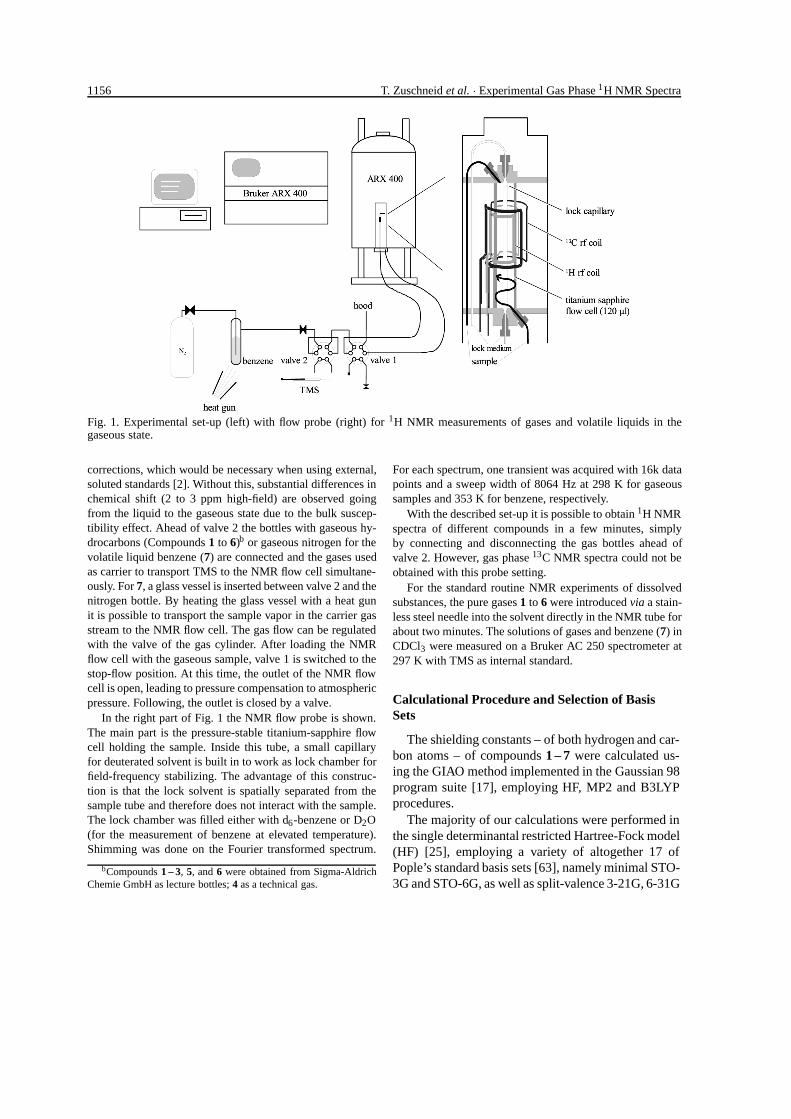
The experimental equipment for the investigation ofgases and volatile liquids by flow 1H NMR spectroscopyis depicted in Fig. 1. The apparatus consists of a 9.4 TBruker ARX 400 NMR instrument (400 MHz proton reso-nance) equipped with a temperature and pressure stable flowprobe with a 120 µl detection cell. The inlet and outlet of theprobe are connected to a set of two Valco 6-port valves bystainless steel capillaries. With valve 1 it is possible to loadthe NMR flow cell with the samples and then seal it. TMS(b. p. 298 K) was used as internal reference standard; it wasinjected with a deep-frozen syringe via the loop at valve 2.Referencing on internal TMS at the same state of aggrega-tiona as the sample was applied to avoid the susceptibility
aTMS is gaseous at the applied measuring conditions.
1156 T. Zuschneid et al. · Experimental Gas Phase 1H NMR Spectra
Fig. 1. Experimental set-up (left) with flow probe (right) for 1H NMR measurements of gases and volatile liquids in thegaseous state.
corrections, which would be necessary when using external,soluted standards [2]. Without this, substantial differences inchemical shift (2 to 3 ppm high-field) are observed goingfrom the liquid to the gaseous state due to the bulk suscep-tibility effect. Ahead of valve 2 the bottles with gaseous hy-drocarbons (Compounds 1 to 6)b or gaseous nitrogen for thevolatile liquid benzene (7) are connected and the gases usedas carrier to transport TMS to the NMR flow cell simultane-ously. For 7, a glass vessel is inserted between valve 2 and thenitrogen bottle. By heating the glass vessel with a heat gunit is possible to transport the sample vapor in the carrier gasstream to the NMR flow cell. The gas flow can be regulatedwith the valve of the gas cylinder. After loading the NMRflow cell with the gaseous sample, valve 1 is switched to thestop-flow position. At this time, the outlet of the NMR flowcell is open, leading to pressure compensation to atmosphericpressure. Following, the outlet is closed by a valve.
In the right part of Fig. 1 the NMR flow probe is shown.The main part is the pressure-stable titanium-sapphire flowcell holding the sample. Inside this tube, a small capillaryfor deuterated solvent is built in to work as lock chamber forfield-frequency stabilizing. The advantage of this construc-tion is that the lock solvent is spatially separated from thesample tube and therefore does not interact with the sample.The lock chamber was filled either with d6-benzene or D2O(for the measurement of benzene at elevated temperature).Shimming was done on the Fourier transformed spectrum.
bCompounds 1 – 3, 5, and 6 were obtained from Sigma-AldrichChemie GmbH as lecture bottles; 4 as a technical gas.
For each spectrum, one transient was acquired with 16k datapoints and a sweep width of 8064 Hz at 298 K for gaseoussamples and 353 K for benzene, respectively.
With the described set-up it is possible to obtain 1H NMRspectra of different compounds in a few minutes, simplyby connecting and disconnecting the gas bottles ahead ofvalve 2. However, gas phase 13C NMR spectra could not beobtained with this probe setting.
For the standard routine NMR experiments of dissolvedsubstances, the pure gases 1 to 6 were introduced via a stain-less steel needle into the solvent directly in the NMR tube forabout two minutes. The solutions of gases and benzene (7) inCDCl3 were measured on a Bruker AC 250 spectrometer at297 K with TMS as internal standard.
Calculational Procedure and Selection of BasisSets
The shielding constants – of both hydrogen and car-bon atoms – of compounds 1 – 7 were calculated us-ing the GIAO method implemented in the Gaussian 98program suite [17], employing HF, MP2 and B3LYPprocedures.
The majority of our calculations were performed inthe single determinantal restricted Hartree-Fock model(HF) [25], employing a variety of altogether 17 ofPople’s standard basis sets [63], namely minimal STO-3G and STO-6G, as well as split-valence 3-21G, 6-31G
T. Zuschneid et al. · Experimental Gas Phase 1H NMR Spectra 1157
5.1285
6.28666.3118
6.3370
6.3622
6.3873
5.09004.9864
4.9641
0.0000
HDO
butadiene
H
H
H
H H
H
2
3,3'
1,1'2,2'
2' 3'
1
3
1'
7.5 7.0 6.5 6.0 5.5 5.0 4.5 4.0 3.5 3.0 2.5 2.0 1.5 1.0 0.5 0.0 -0.5 -1.0ppm
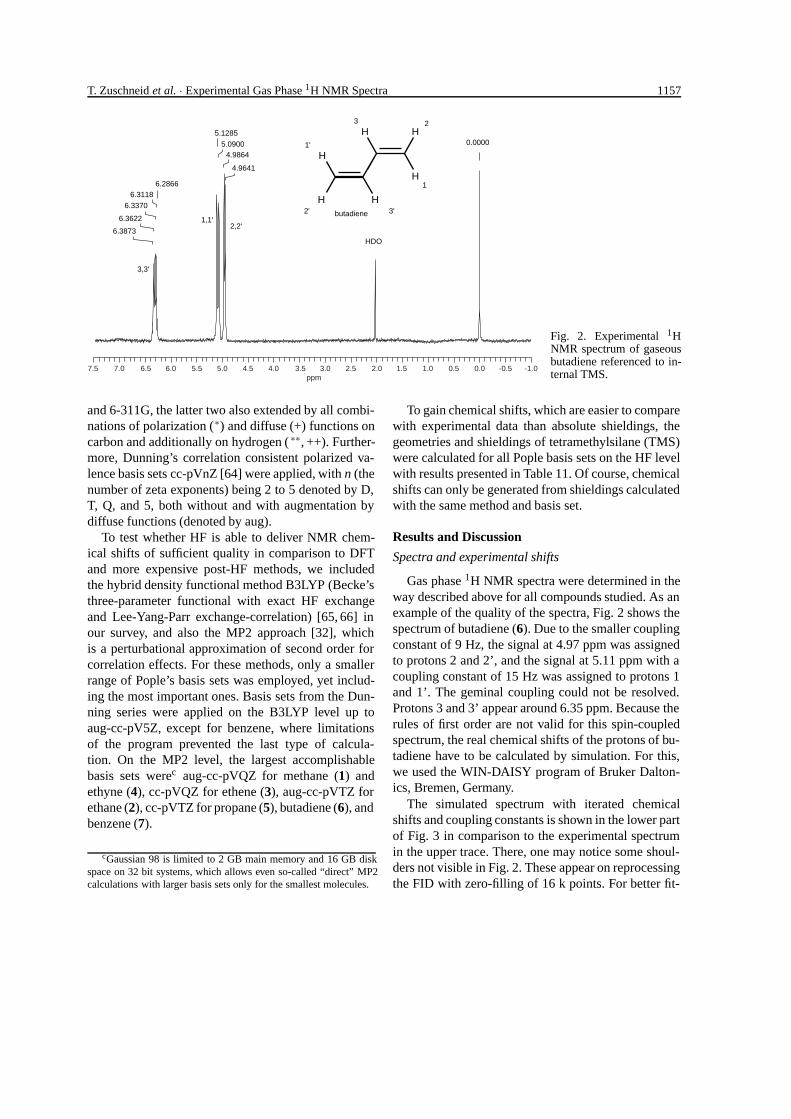
Fig. 2. Experimental 1HNMR spectrum of gaseousbutadiene referenced to in-ternal TMS.
and 6-311G, the latter two also extended by all combi-nations of polarization (∗) and diffuse (+) functions oncarbon and additionally on hydrogen ( ∗∗, ++). Further-more, Dunning’s correlation consistent polarized va-lence basis sets cc-pVnZ [64] were applied, with n (thenumber of zeta exponents) being 2 to 5 denoted by D,T, Q, and 5, both without and with augmentation bydiffuse functions (denoted by aug).
To test whether HF is able to deliver NMR chem-ical shifts of sufficient quality in comparison to DFTand more expensive post-HF methods, we includedthe hybrid density functional method B3LYP (Becke’sthree-parameter functional with exact HF exchangeand Lee-Yang-Parr exchange-correlation) [65, 66] inour survey, and also the MP2 approach [32], whichis a perturbational approximation of second order forcorrelation effects. For these methods, only a smallerrange of Pople’s basis sets was employed, yet includ-ing the most important ones. Basis sets from the Dun-ning series were applied on the B3LYP level up toaug-cc-pV5Z, except for benzene, where limitationsof the program prevented the last type of calcula-tion. On the MP2 level, the largest accomplishablebasis sets werec aug-cc-pVQZ for methane (1) andethyne (4), cc-pVQZ for ethene (3), aug-cc-pVTZ forethane (2), cc-pVTZ for propane (5), butadiene (6), andbenzene (7).
cGaussian 98 is limited to 2 GB main memory and 16 GB diskspace on 32 bit systems, which allows even so-called “direct” MP2calculations with larger basis sets only for the smallest molecules.
To gain chemical shifts, which are easier to comparewith experimental data than absolute shieldings, thegeometries and shieldings of tetramethylsilane (TMS)were calculated for all Pople basis sets on the HF levelwith results presented in Table 11. Of course, chemicalshifts can only be generated from shieldings calculatedwith the same method and basis set.
Results and Discussion
Spectra and experimental shifts
Gas phase 1H NMR spectra were determined in theway described above for all compounds studied. As anexample of the quality of the spectra, Fig. 2 shows thespectrum of butadiene (6). Due to the smaller couplingconstant of 9 Hz, the signal at 4.97 ppm was assignedto protons 2 and 2’, and the signal at 5.11 ppm with acoupling constant of 15 Hz was assigned to protons 1and 1’. The geminal coupling could not be resolved.Protons 3 and 3’ appear around 6.35 ppm. Because therules of first order are not valid for this spin-coupledspectrum, the real chemical shifts of the protons of bu-tadiene have to be calculated by simulation. For this,we used the WIN-DAISY program of Bruker Dalton-ics, Bremen, Germany.
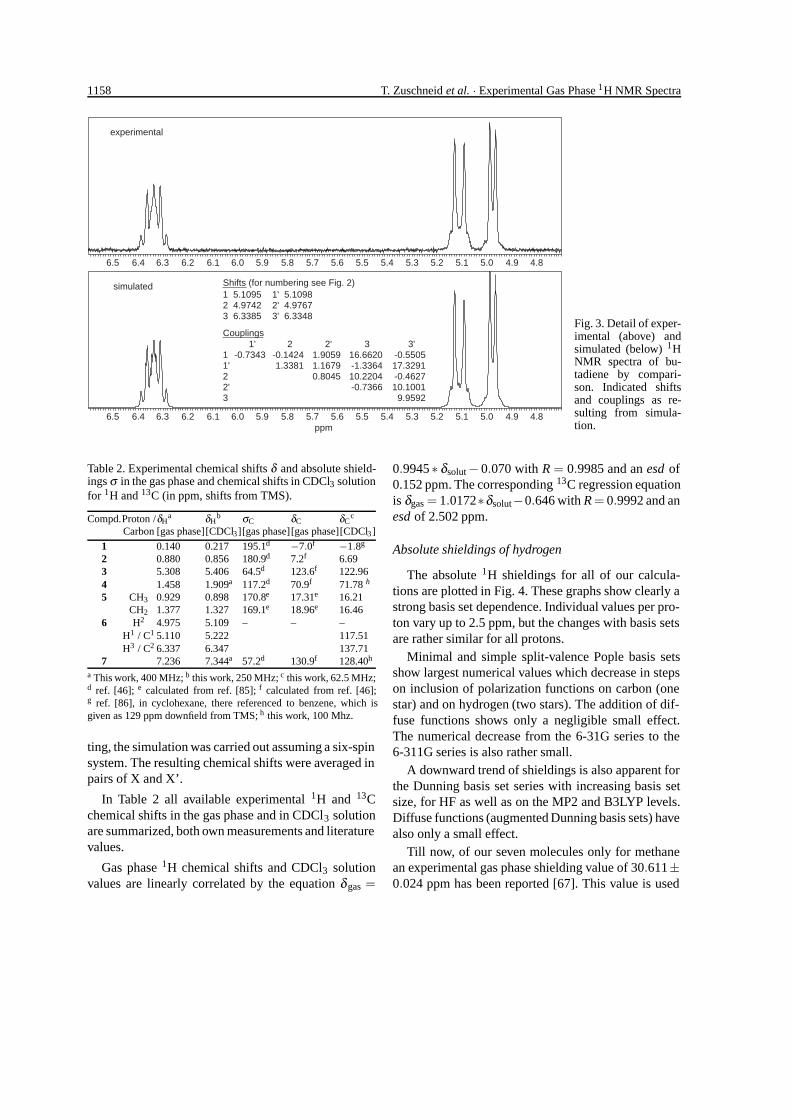
The simulated spectrum with iterated chemicalshifts and coupling constants is shown in the lower partof Fig. 3 in comparison to the experimental spectrumin the upper trace. There, one may notice some shoul-ders not visible in Fig. 2. These appear on reprocessingthe FID with zero-filling of 16 k points. For better fit-
1158 T. Zuschneid et al. · Experimental Gas Phase 1H NMR Spectra
simulated
6.5 6.4 6.3 6.2 6.1 6.0 5.9 5.8 5.7ppm
5.6 5.5 5.4 5.3 5.2 5.1 5.0 4.9 4.8
experimental
Shifts (for numbering see Fig. 2)1 5.10952 4.97423 6.3385
1' 5.10982' 4.97673' 6.3348
Couplings
11'22'3
-0.550517.3291-0.462710.10019.9592
16.6620-1.336410.2204-0.7366
1.90591.16790.8045
-0.14241.3381
-0.73431' 2 2' 3 3'
6.5 6.4 6.3 6.2 6.1 6.0 5.9 5.8 5.7 5.6 5.5 5.4 5.3 5.2 5.1 5.0 4.9 4.8
Fig. 3. Detail of exper-imental (above) andsimulated (below) 1HNMR spectra of bu-tadiene by compari-son. Indicated shiftsand couplings as re-sulting from simula-tion.
Table 2. Experimental chemical shifts δ and absolute shield-ings σ in the gas phase and chemical shifts in CDCl3 solutionfor 1H and 13C (in ppm, shifts from TMS).
Compd.Proton /δHa δH
b σC δC δCc
Carbon [gas phase][CDCl3][gas phase][gas phase][CDCl3]
1 0.140 0.217 195.1d −7.0f −1.8g
2 0.880 0.856 180.9d 7.2f 6.693 5.308 5.406 64.5d 123.6f 122.964 1.458 1.909a 117.2d 70.9f 71.78 h
5 CH3 0.929 0.898 170.8e 17.31e 16.21CH2 1.377 1.327 169.1e 18.96e 16.46
6 H2 4.975 5.109 – – –H1 / C1 5.110 5.222 117.51H3 / C2 6.337 6.347 137.71
7 7.236 7.344a 57.2d 130.9f 128.40h
a This work, 400 MHz; b this work, 250 MHz; c this work, 62.5 MHz;d ref. [46]; e calculated from ref. [85]; f calculated from ref. [46];g ref. [86], in cyclohexane, there referenced to benzene, which isgiven as 129 ppm downfield from TMS; h this work, 100 Mhz.
ting, the simulation was carried out assuming a six-spinsystem. The resulting chemical shifts were averaged inpairs of X and X’.
In Table 2 all available experimental 1H and 13Cchemical shifts in the gas phase and in CDCl3 solutionare summarized, both own measurements and literaturevalues.
Gas phase 1H chemical shifts and CDCl3 solutionvalues are linearly correlated by the equation δgas =
0.9945 ∗ δsolut − 0.070 with R = 0.9985 and an esd of0.152 ppm. The corresponding 13C regression equationis δgas = 1.0172∗δsolut−0.646 with R = 0.9992 and anesd of 2.502 ppm.
Absolute shieldings of hydrogen
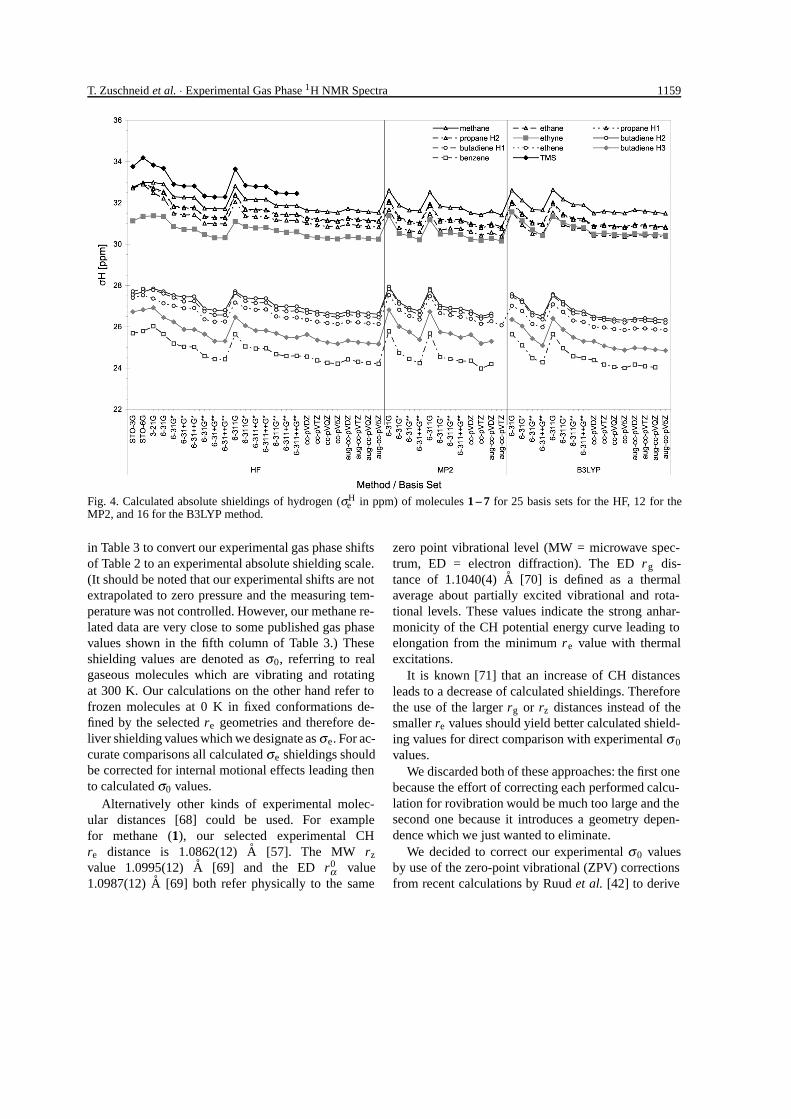
The absolute 1H shieldings for all of our calcula-tions are plotted in Fig. 4. These graphs show clearly astrong basis set dependence. Individual values per pro-ton vary up to 2.5 ppm, but the changes with basis setsare rather similar for all protons.
Minimal and simple split-valence Pople basis setsshow largest numerical values which decrease in stepson inclusion of polarization functions on carbon (onestar) and on hydrogen (two stars). The addition of dif-fuse functions shows only a negligible small effect.The numerical decrease from the 6-31G series to the6-311G series is also rather small.
A downward trend of shieldings is also apparent forthe Dunning basis set series with increasing basis setsize, for HF as well as on the MP2 and B3LYP levels.Diffuse functions (augmented Dunning basis sets) havealso only a small effect.
Till now, of our seven molecules only for methanean experimental gas phase shielding value of 30.611±0.024 ppm has been reported [67]. This value is used
T. Zuschneid et al. · Experimental Gas Phase 1H NMR Spectra 1159
Fig. 4. Calculated absolute shieldings of hydrogen (σHe in ppm) of molecules 1 – 7 for 25 basis sets for the HF, 12 for the
MP2, and 16 for the B3LYP method.
in Table 3 to convert our experimental gas phase shiftsof Table 2 to an experimental absolute shielding scale.(It should be noted that our experimental shifts are notextrapolated to zero pressure and the measuring tem-perature was not controlled. However, our methane re-lated data are very close to some published gas phasevalues shown in the fifth column of Table 3.) Theseshielding values are denoted as σ0, referring to realgaseous molecules which are vibrating and rotatingat 300 K. Our calculations on the other hand refer tofrozen molecules at 0 K in fixed conformations de-fined by the selected re geometries and therefore de-liver shielding values which we designate as σe. For ac-curate comparisons all calculated σe shieldings shouldbe corrected for internal motional effects leading thento calculated σ0 values.
Alternatively other kinds of experimental molec-ular distances [68] could be used. For examplefor methane (1), our selected experimental CHre distance is 1.0862(12) A [57]. The MW rz
value 1.0995(12) A [69] and the ED r0α value
1.0987(12) A [69] both refer physically to the same
zero point vibrational level (MW = microwave spec-trum, ED = electron diffraction). The ED rg dis-tance of 1.1040(4) A [70] is defined as a thermalaverage about partially excited vibrational and rota-tional levels. These values indicate the strong anhar-monicity of the CH potential energy curve leading toelongation from the minimum re value with thermalexcitations.
It is known [71] that an increase of CH distancesleads to a decrease of calculated shieldings. Thereforethe use of the larger rg or rz distances instead of thesmaller re values should yield better calculated shield-ing values for direct comparison with experimental σ 0
values.We discarded both of these approaches: the first one
because the effort of correcting each performed calcu-lation for rovibration would be much too large and thesecond one because it introduces a geometry depen-dence which we just wanted to eliminate.
We decided to correct our experimental σ0 valuesby use of the zero-point vibrational (ZPV) correctionsfrom recent calculations by Ruud et al. [42] to derive
1160 T. Zuschneid et al. · Experimental Gas Phase 1H NMR Spectra
Table 3. Adjustment of our experimental gas phase chemicalshifts (δTMS) of Table 2 to absolute shieldings (σ0) based onthe methane value from [67] and application of zero pointvibration corrections (∆σZPV) from [42] to σexp
e values
Compd. Group δTMS σ0 lit. σ0 ∆ σZPVb σ exp
e σ calce
b
1 0.136 30.611a 30.611 0.59 31.201 31.96(24)a 31.60f
31.26g
2 0.882 29.865 29.870c 0.67 30.535 31.523 5.308 25.439 25.430c 0.52 25.959 26.804 1.458 29.289 29.276c 0.76 30.049 30.98
29.278d
5 C1H′ 0.929 29.818 0.69 30.508 31.34C1H′′ 31.60C2H 1.377 29.370 0.70 30.070 31.21
6 H1 5.110 25.637 0.42 26.057 27.03H2 4.975 25.772 0.47 26.242 27.20H3 6.337 24.410 0.54 24.950 25.85
7 7.236 23.512 23.57e 0.38 23.892 24.8124.20h
23.2 to24.3e,i
a Ref. [67]; b ref. [42]; c ref. [87]; d ref. [88]; e ref. [89]; f ref. [37],CCSD(T) result; g ref. [38], MCSCF result; h ref. [16]; i estimatedHF limit.
estimated experimental shieldings (denoted as σ expe )
presented in Table 3.
Methane (1) as the prototype of saturated hydrocar-bons may be used as secondary standard as done withthe value of 30.611 ppm to derive experimental abso-lute shieldings σ0 in Table 3. Due to its small size itsshielding can be calculated with very advanced meth-ods. Several results of GIAO benchmark calculationsfor re distances with very large basis sets have beenpresented by Gauss and Stanton [5, 37]: for r e geome-try, the HF limit σe is 31.7 ppm, the MP2 shielding is31.4 ppm, which increases to 31.5 ppm in MP3, MP4
Table 4. Exponentially determined Dunning basis set limits (σlimit) for 1H shieldings (∆σe are deviations from σexpe shieldings
of Table 3).
HF HF aug MP2 MP2 aug B3LYP B3LYP augCompd. σlimit ∆ σe σlimit ∆ σe σlimit ∆ σe σlimit ∆ σe σlimit ∆ σe σlimit ∆ σe
1 31.506 0.305 31.510 0.309 a 31.193 −0.008 31.470 0.269 31.342 0.1412 31.011 0.476 31.051 0.515 30.802 0.267 30.820 0.2853 26.028 0.068 26.079 0.120 25.686 −0.273 25.777 −0.183 25.780 −0.1794 30.150 0.101 30.078 0.029 a 29.889 −0.160 30.380 0.331 a
5 H1 30.974 0.465 30.983 0.475 30.758 0.249 30.787 0.279H2 30.792 0.721 30.768 0.698 30.326 0.255 30.375 0.305
6 H1 26.300 0.242 26.431 0.373 26.122 0.065 26.175 0.118H2 26.549 0.307 26.559 0.316 26.292 0.049 26.271 0.028H3 25.132 0.182 25.106 0.156 24.791 −0.160 24.786 −0.164
7 24.162 0.270 24.173 0.281 23.948 0.057 23.977 0.086av. |∆ σe| 0.314 0.327 0.273 0.084 0.188 0.176av. |∆ σ0| b 0.888 0.901 0.247 0.591 0.694 0.653a Calculated shieldings could not be fitted by exponential function;b average deviations from experimental σ0 shieldings of Table 3.
and CCSD calculations. The most advanced calcula-tions yield 31.60 ppm with CCSD(T) and 31.26 ppmwith MCSCF [38], but this with a larger CH distanceof 1.094 A. These values show a small dependenceon calculational procedures and nearly no influence ofelectron correlation. Our estimated σ exp
e shielding of31.20 ppm is close to these values, and in much bet-ter agreement than the experimental σ0 of 30.611±0.024 ppm.
The last column in Table 3 lists HF calculationsfrom ref. [42] using a triple zeta basis with polarizationfunctions on C and H. The methane value of 31.96 ppmis larger than the before mentioned values. Our small-est calculated σe values for methane with largest basissets are 31.54 ppm on the HF, 31.41 ppm on the MP2,and 31.50 ppm on the B3LYP level.
Extrapolations of Dunning basis set calculations for1H shieldings
The consecutive character of Dunning’s correla-tion consistent basis sets [64, 72] which all includepolarization functions allows an exponential extra-polation for the determination of the correspondingbasis set limit. This procedure was suggested byFeller [73] and applied for the Hartree-Fock limit ofenergies [73, 74] and for estimation of experimental r e
distances [75, 76].Our calculated Dunning values have been extrapo-
lated to the limit by use of the equation σ = σ limit +be−kζ for at least three consecutive values. The param-eter σlimit delivers the basis set limit shielding. In Ta-ble 4, our extrapolated limits for the molecules 1 – 7are presented together with deviations ∆σe from theestimated σ exp
e values.
T. Zuschneid et al. · Experimental Gas Phase 1H NMR Spectra 1161
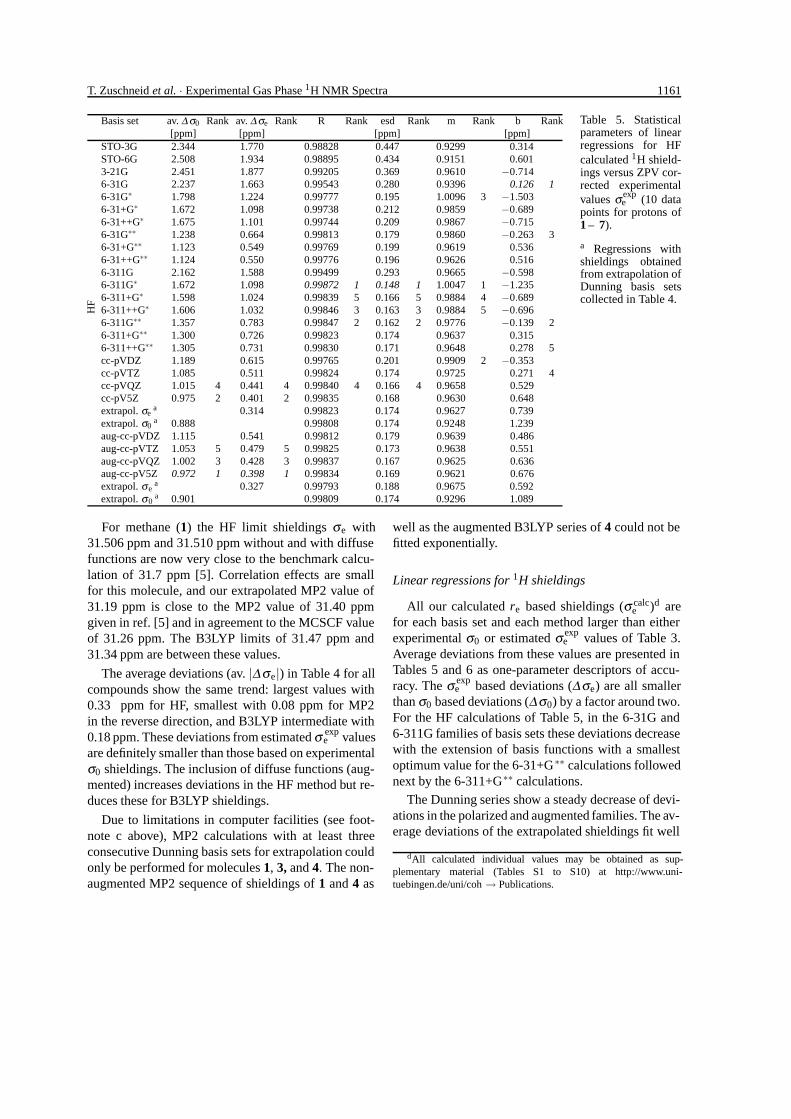
Basis set av. ∆ σ0 Rank av. ∆ σe Rank R Rank esd Rank m Rank b Rank[ppm] [ppm] [ppm] [ppm]
STO-3G 2.344 1.770 0.98828 0.447 0.9299 0.314STO-6G 2.508 1.934 0.98895 0.434 0.9151 0.6013-21G 2.451 1.877 0.99205 0.369 0.9610 −0.7146-31G 2.237 1.663 0.99543 0.280 0.9396 0.126 16-31G∗ 1.798 1.224 0.99777 0.195 1.0096 3 −1.5036-31+G∗ 1.672 1.098 0.99738 0.212 0.9859 −0.6896-31++G∗ 1.675 1.101 0.99744 0.209 0.9867 −0.7156-31G∗∗ 1.238 0.664 0.99813 0.179 0.9860 −0.263 36-31+G∗∗ 1.123 0.549 0.99769 0.199 0.9619 0.5366-31++G∗∗ 1.124 0.550 0.99776 0.196 0.9626 0.5166-311G 2.162 1.588 0.99499 0.293 0.9665 −0.5986-311G∗ 1.672 1.098 0.99872 1 0.148 1 1.0047 1 −1.2356-311+G∗ 1.598 1.024 0.99839 5 0.166 5 0.9884 4 −0.6896-311++G∗ 1.606 1.032 0.99846 3 0.163 3 0.9884 5 −0.6966-311G∗∗ 1.357 0.783 0.99847 2 0.162 2 0.9776 −0.139 26-311+G∗∗ 1.300 0.726 0.99823 0.174 0.9637 0.3156-311++G∗∗ 1.305 0.731 0.99830 0.171 0.9648 0.278 5cc-pVDZ 1.189 0.615 0.99765 0.201 0.9909 2 −0.353cc-pVTZ 1.085 0.511 0.99824 0.174 0.9725 0.271 4cc-pVQZ 1.015 4 0.441 4 0.99840 4 0.166 4 0.9658 0.529cc-pV5Z 0.975 2 0.401 2 0.99835 0.168 0.9630 0.648extrapol. σe
a 0.314 0.99823 0.174 0.9627 0.739extrapol. σ0
a 0.888 0.99808 0.174 0.9248 1.239aug-cc-pVDZ 1.115 0.541 0.99812 0.179 0.9639 0.486aug-cc-pVTZ 1.053 5 0.479 5 0.99825 0.173 0.9638 0.551aug-cc-pVQZ 1.002 3 0.428 3 0.99837 0.167 0.9625 0.636aug-cc-pV5Z 0.972 1 0.398 1 0.99834 0.169 0.9621 0.676extrapol. σe
a 0.327 0.99793 0.188 0.9675 0.592
HF
extrapol. σ0a 0.901 0.99809 0.174 0.9296 1.089
Table 5. Statisticalparameters of linearregressions for HFcalculated 1H shield-ings versus ZPV cor-rected experimentalvalues σexp
e (10 datapoints for protons of1 – 7).
a Regressions withshieldings obtainedfrom extrapolation ofDunning basis setscollected in Table 4.
For methane (1) the HF limit shieldings σe with31.506 ppm and 31.510 ppm without and with diffusefunctions are now very close to the benchmark calcu-lation of 31.7 ppm [5]. Correlation effects are smallfor this molecule, and our extrapolated MP2 value of31.19 ppm is close to the MP2 value of 31.40 ppmgiven in ref. [5] and in agreement to the MCSCF valueof 31.26 ppm. The B3LYP limits of 31.47 ppm and31.34 ppm are between these values.
The average deviations (av. |∆σe|) in Table 4 for allcompounds show the same trend: largest values with0.33 ppm for HF, smallest with 0.08 ppm for MP2in the reverse direction, and B3LYP intermediate with0.18 ppm. These deviations from estimated σ exp
e valuesare definitely smaller than those based on experimentalσ0 shieldings. The inclusion of diffuse functions (aug-mented) increases deviations in the HF method but re-duces these for B3LYP shieldings.
Due to limitations in computer facilities (see foot-note c above), MP2 calculations with at least threeconsecutive Dunning basis sets for extrapolation couldonly be performed for molecules 1, 3, and 4. The non-augmented MP2 sequence of shieldings of 1 and 4 as
well as the augmented B3LYP series of 4 could not befitted exponentially.
Linear regressions for 1H shieldings
All our calculated re based shieldings (σ calce )d are
for each basis set and each method larger than eitherexperimental σ0 or estimated σ exp
e values of Table 3.Average deviations from these values are presented inTables 5 and 6 as one-parameter descriptors of accu-racy. The σ exp
e based deviations (∆σe) are all smallerthan σ0 based deviations (∆σ0) by a factor around two.For the HF calculations of Table 5, in the 6-31G and6-311G families of basis sets these deviations decreasewith the extension of basis functions with a smallestoptimum value for the 6-31+G∗∗ calculations followednext by the 6-311+G∗∗ calculations.
The Dunning series show a steady decrease of devi-ations in the polarized and augmented families. The av-erage deviations of the extrapolated shieldings fit well
dAll calculated individual values may be obtained as sup-plementary material (Tables S1 to S10) at http://www.uni-tuebingen.de/uni/coh → Publications.
1162 T. Zuschneid et al. · Experimental Gas Phase 1H NMR Spectra
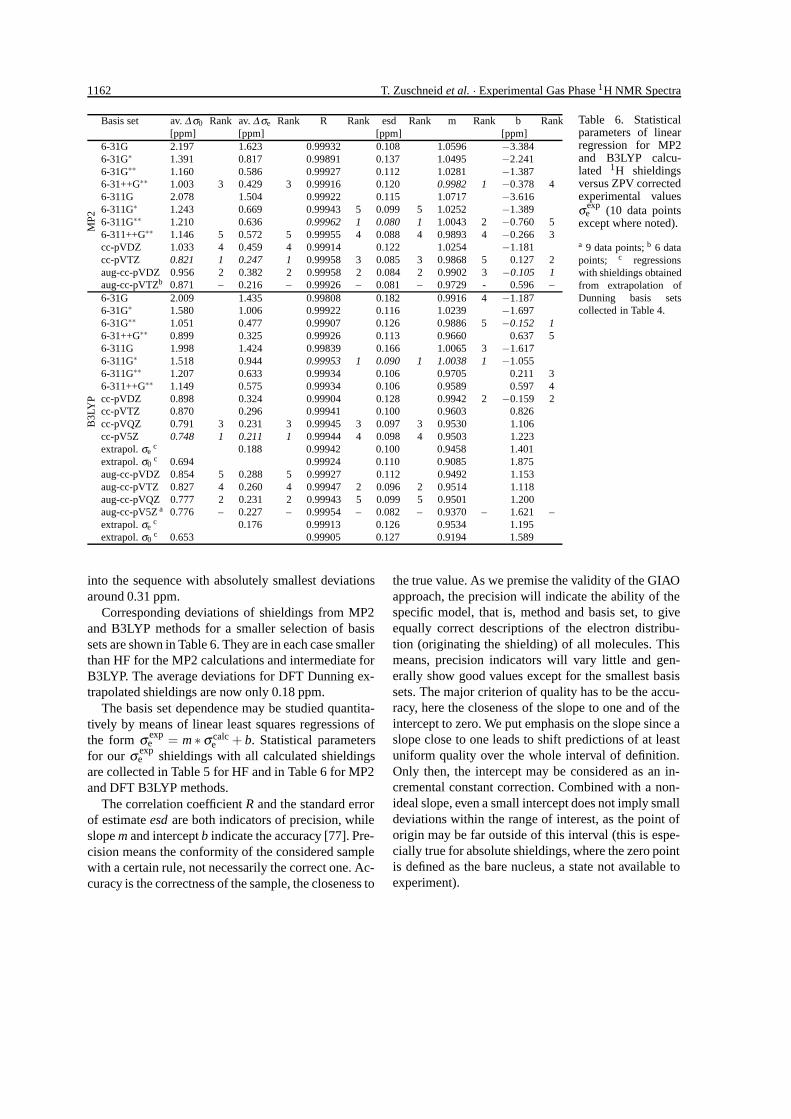
Basis set av. ∆ σ0 Rank av. ∆ σe Rank R Rank esd Rank m Rank b Rank[ppm] [ppm] [ppm] [ppm]
6-31G 2.197 1.623 0.99932 0.108 1.0596 −3.3846-31G∗ 1.391 0.817 0.99891 0.137 1.0495 −2.2416-31G∗∗ 1.160 0.586 0.99927 0.112 1.0281 −1.3876-31++G∗∗ 1.003 3 0.429 3 0.99916 0.120 0.9982 1 −0.378 46-311G 2.078 1.504 0.99922 0.115 1.0717 −3.6166-311G∗ 1.243 0.669 0.99943 5 0.099 5 1.0252 −1.3896-311G∗∗ 1.210 0.636 0.99962 1 0.080 1 1.0043 2 −0.760 56-311++G∗∗ 1.146 5 0.572 5 0.99955 4 0.088 4 0.9893 4 −0.266 3cc-pVDZ 1.033 4 0.459 4 0.99914 0.122 1.0254 −1.181cc-pVTZ 0.821 1 0.247 1 0.99958 3 0.085 3 0.9868 5 0.127 2aug-cc-pVDZ 0.956 2 0.382 2 0.99958 2 0.084 2 0.9902 3 −0.105 1
MP2
aug-cc-pVTZb 0.871 – 0.216 – 0.99926 – 0.081 – 0.9729 - 0.596 –6-31G 2.009 1.435 0.99808 0.182 0.9916 4 −1.1876-31G∗ 1.580 1.006 0.99922 0.116 1.0239 −1.6976-31G∗∗ 1.051 0.477 0.99907 0.126 0.9886 5 −0.152 16-31++G∗∗ 0.899 0.325 0.99926 0.113 0.9660 0.637 56-311G 1.998 1.424 0.99839 0.166 1.0065 3 −1.6176-311G∗ 1.518 0.944 0.99953 1 0.090 1 1.0038 1 −1.0556-311G∗∗ 1.207 0.633 0.99934 0.106 0.9705 0.211 36-311++G∗∗ 1.149 0.575 0.99934 0.106 0.9589 0.597 4cc-pVDZ 0.898 0.324 0.99904 0.128 0.9942 2 −0.159 2cc-pVTZ 0.870 0.296 0.99941 0.100 0.9603 0.826cc-pVQZ 0.791 3 0.231 3 0.99945 3 0.097 3 0.9530 1.106cc-pV5Z 0.748 1 0.211 1 0.99944 4 0.098 4 0.9503 1.223extrapol. σe
c 0.188 0.99942 0.100 0.9458 1.401extrapol. σ0
c 0.694 0.99924 0.110 0.9085 1.875aug-cc-pVDZ 0.854 5 0.288 5 0.99927 0.112 0.9492 1.153aug-cc-pVTZ 0.827 4 0.260 4 0.99947 2 0.096 2 0.9514 1.118aug-cc-pVQZ 0.777 2 0.231 2 0.99943 5 0.099 5 0.9501 1.200aug-cc-pV5Z a 0.776 – 0.227 – 0.99954 – 0.082 – 0.9370 – 1.621 –extrapol. σe
c 0.176 0.99913 0.126 0.9534 1.195
B3L
YP
extrapol. σ0c 0.653 0.99905 0.127 0.9194 1.589
Table 6. Statisticalparameters of linearregression for MP2and B3LYP calcu-lated 1H shieldingsversus ZPV correctedexperimental valuesσ exp
e (10 data pointsexcept where noted).
a 9 data points; b 6 datapoints; c regressionswith shieldings obtainedfrom extrapolation ofDunning basis setscollected in Table 4.
into the sequence with absolutely smallest deviationsaround 0.31 ppm.
Corresponding deviations of shieldings from MP2and B3LYP methods for a smaller selection of basissets are shown in Table 6. They are in each case smallerthan HF for the MP2 calculations and intermediate forB3LYP. The average deviations for DFT Dunning ex-trapolated shieldings are now only 0.18 ppm.
The basis set dependence may be studied quantita-tively by means of linear least squares regressions ofthe form σ exp
e = m ∗ σ calce + b. Statistical parameters
for our σ expe shieldings with all calculated shieldings
are collected in Table 5 for HF and in Table 6 for MP2and DFT B3LYP methods.
The correlation coefficient R and the standard errorof estimate esd are both indicators of precision, whileslope m and intercept b indicate the accuracy [77]. Pre-cision means the conformity of the considered samplewith a certain rule, not necessarily the correct one. Ac-curacy is the correctness of the sample, the closeness to
the true value. As we premise the validity of the GIAOapproach, the precision will indicate the ability of thespecific model, that is, method and basis set, to giveequally correct descriptions of the electron distribu-tion (originating the shielding) of all molecules. Thismeans, precision indicators will vary little and gen-erally show good values except for the smallest basissets. The major criterion of quality has to be the accu-racy, here the closeness of the slope to one and of theintercept to zero. We put emphasis on the slope since aslope close to one leads to shift predictions of at leastuniform quality over the whole interval of definition.Only then, the intercept may be considered as an in-cremental constant correction. Combined with a non-ideal slope, even a small intercept does not imply smalldeviations within the range of interest, as the point oforigin may be far outside of this interval (this is espe-cially true for absolute shieldings, where the zero pointis defined as the bare nucleus, a state not available toexperiment).
T. Zuschneid et al. · Experimental Gas Phase 1H NMR Spectra 1163
R values are poor for the first three basis sets of theHF values of Table 5 which will be safely discarded.Other R values are statistically highly acceptable in therange of 0.995 to 0.998. Standard deviations (esd) arebetween 0.293 and 0.148 ppm indicating high preci-sion for a total range of about 13 ppm for the 1H NMRscale. Best R and esd values delivers the 6-311G∗ basisset. In Table 6, best R and esd values (which behave al-ways similar) are observed for the B3LYP calculationsalso with the 6-311G∗ basis set with R = 0.9995 andesd = 0.090 ppm. But corresponding MP2 parametersare best for the 6-311G∗∗ basis set with R = 0.9996 andesd = 0.080 ppm. The MP2 regressions for the aug-mented cc-pVTZ basis set cannot be compared quan-titatively because they are based on a smaller numberof data points. The tables contain rankings for the fivebest values of each parameter within one method.
Slopes and intercepts as indicators of accuracy im-prove for same basis sets on different levels of theoryin the sequence HF < B3LYP < MP2, but the two pa-rameters do not follow the same ranking pattern. Theintercept is also best for 6-311G∗ HF and B3LYP cal-culations, but the MP2 intercept is most accurate for 6-31++G∗∗ which represents larger flexibility, but is bet-ter than that of the larger 6-311++G∗∗ basis set. Slopesshow a different ranking as compared to esd which willnot be discussed in detail.
Absolute shieldings of carbon
We could not measure gas phase 13C NMR spec-tra with our installation, but experimental gaseous13C shielding values at 300 K (σ0) extrapolated to zeropressure are available from ref. [46] as shown in Ta-ble 2 for all of our compounds except butadiene (6). Asbefore in the case of 1H shieldings, we have to differen-tiate between these experimental σ0 values and calcu-lated absolute shieldings σ calc
e based on re geometries.In Table 7, we apply ZPV corrections from ref. [42] ina range of 3.2 to 5.9 ppm to derive corrected σ exp
e val-ues which may be compared directly to our calculatedσ calc
e values.
M e t h a n e
The simplest hydrocarbon methane (1) was treatedin numerous calculations and it is important as a sec-ondary standard for an absolute 13C shielding scale.Its experimental σ0 value is reported as 193.697 ppmin ref. [39], but as 195.1 ppm in ref. [46] and most
Table 7. Zero point vibration corrections (∆σZPV) of experi-mental 13C gas phase shieldings (σexp
0 ).
Compd. σ exp0
a ∆ σZPVb σ exp
e σ calce
b
1 195.1 3.20 198.30 197.83193.697 c 3.591 c 197.374 c 197.392 k
194.8(9) d 3.695 c,h 198.5(9) c,f 198.9 i,m
194.8 i,n
2 180.9 3.95 184.85 186.61180.827(6) e
3 64.5 4.79 69.29 65.6864.344(15) e,f
4 117.2 4.44 121.64 120.03116.58(90) g
5 C1 170.8 4.26 175.06 178.65170.654(6) e,f
C2 169.1 5.22 174.32 177.84169.069(6) e,f
6 C1 5.92 72.98C2 4.13 50.26
7 57.2 3.37 60.57 59.4660.4 o
57.73 p
a Ref. [46]; b ref. [42]; c ref. [39]; d ref. [78]; e ref. [90]; f based onmethane = 194.8±0.9 ppm (ref. [78]); g ref. [88]; h total correctionto nuclear motions at 300 K; i ref. [37]; k ref. [79]; m CCSD(T) value;n estimated HF limit; o ref. [91], IGLO value; p ref. [16].
recent as 194.8 ± 0.9 ppm in ref. [78]. In Table 7,three available ZPV values are given for the conver-sion from σ0 to an estimated σe: From ref. [39] thetotal correction to nuclear motion at 300 K is calcu-lated as 3.695 ppm and solely the smaller ZPV cor-rection as 3.591 ppm. These are larger than the valueof 3.20 ppm reported by Ruud et al. [42]. However,Ruud’s ZPV values have been used in Table 7 to de-rive the estimated σ exp
e values from the σ0 data of theJamesons [46]. Our value of 198.30 ppm is consistentto 197.374 ppm and the estimate of 198.5± 0.9 ppmof ref. [39]. Cited σe calculations for 1 in the last col-umn of Table 7 are in very good agreement with theseestimates. Most important is the CCSD(T) benchmarkcalculation of Gauss and Stanton [37] with 198.9 ppmwhich differs strictly from their σe HF limit value of194.8 ppm. This difference shows the influence of elec-tron correlation on 13C shieldinge which is more im-portant than in the 1H shieldings studied before.
Other calculations for 1 are very nonuniform.Lazzeretti et al. [79] cite a compilation of 11 refer-
eIn the recent review [5], large basis set calculations for re dis-tances of 1 are reported with the following σe values: MP2: 201.0,MP3: 198.8, MP4: 199.5, CCSD: 198.7, MCSCF: 198.2 andCCSD(T): 199.1 ppm (the last value is in numerical discrepancy to198.9 ppm given in ref. [37]).
1164 T. Zuschneid et al. · Experimental Gas Phase 1H NMR Spectra
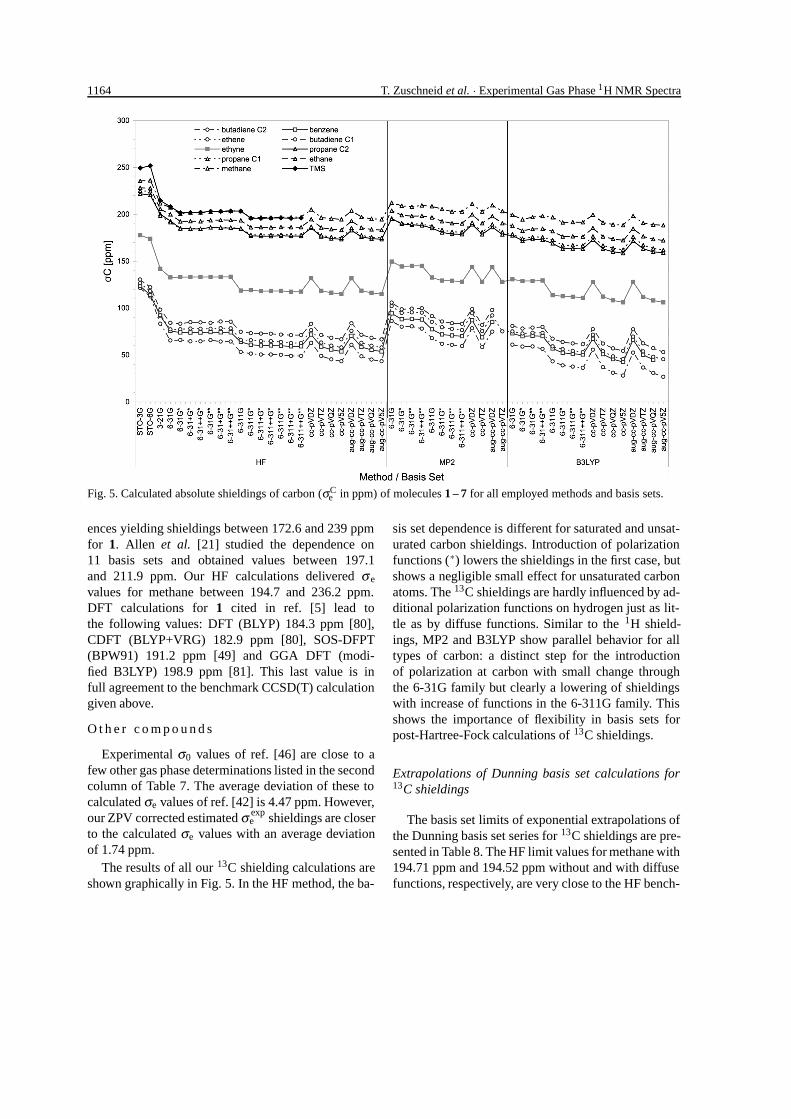
Fig. 5. Calculated absolute shieldings of carbon (σCe in ppm) of molecules 1 – 7 for all employed methods and basis sets.
ences yielding shieldings between 172.6 and 239 ppmfor 1. Allen et al. [21] studied the dependence on11 basis sets and obtained values between 197.1and 211.9 ppm. Our HF calculations delivered σ e
values for methane between 194.7 and 236.2 ppm.DFT calculations for 1 cited in ref. [5] lead tothe following values: DFT (BLYP) 184.3 ppm [80],CDFT (BLYP+VRG) 182.9 ppm [80], SOS-DFPT(BPW91) 191.2 ppm [49] and GGA DFT (modi-fied B3LYP) 198.9 ppm [81]. This last value is infull agreement to the benchmark CCSD(T) calculationgiven above.
O t h e r c o m p o u n d s
Experimental σ0 values of ref. [46] are close to afew other gas phase determinations listed in the secondcolumn of Table 7. The average deviation of these tocalculated σe values of ref. [42] is 4.47 ppm. However,our ZPV corrected estimated σ exp
e shieldings are closerto the calculated σe values with an average deviationof 1.74 ppm.
The results of all our 13C shielding calculations areshown graphically in Fig. 5. In the HF method, the ba-
sis set dependence is different for saturated and unsat-urated carbon shieldings. Introduction of polarizationfunctions (∗) lowers the shieldings in the first case, butshows a negligible small effect for unsaturated carbonatoms. The 13C shieldings are hardly influenced by ad-ditional polarization functions on hydrogen just as lit-tle as by diffuse functions. Similar to the 1H shield-ings, MP2 and B3LYP show parallel behavior for alltypes of carbon: a distinct step for the introductionof polarization at carbon with small change throughthe 6-31G family but clearly a lowering of shieldingswith increase of functions in the 6-311G family. Thisshows the importance of flexibility in basis sets forpost-Hartree-Fock calculations of 13C shieldings.
Extrapolations of Dunning basis set calculations for13C shieldings
The basis set limits of exponential extrapolations ofthe Dunning basis set series for 13C shieldings are pre-sented in Table 8. The HF limit values for methane with194.71 ppm and 194.52 ppm without and with diffusefunctions, respectively, are very close to the HF bench-
T. Zuschneid et al. · Experimental Gas Phase 1H NMR Spectra 1165
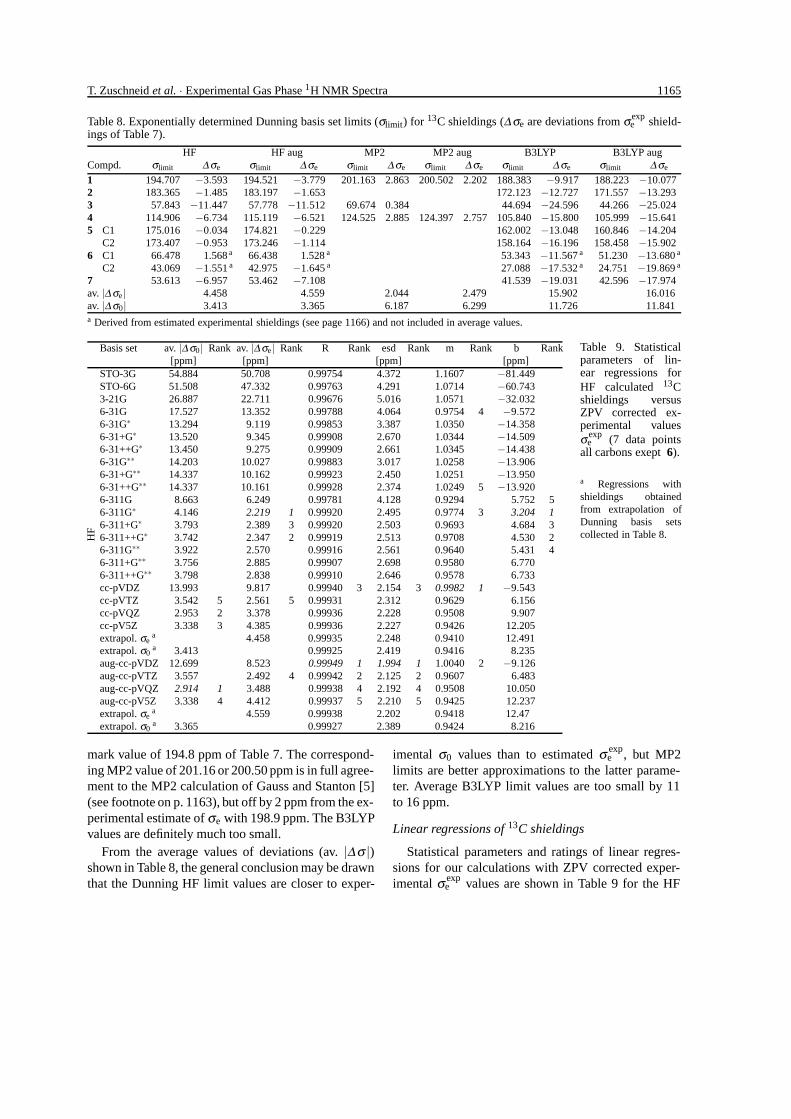
Table 8. Exponentially determined Dunning basis set limits (σlimit) for 13C shieldings (∆σe are deviations from σexpe shield-
ings of Table 7).
HF HF aug MP2 MP2 aug B3LYP B3LYP augCompd. σlimit ∆ σe σlimit ∆ σe σlimit ∆ σe σlimit ∆ σe σlimit ∆ σe σlimit ∆ σe
1 194.707 −3.593 194.521 −3.779 201.163 2.863 200.502 2.202 188.383 −9.917 188.223 −10.0772 183.365 −1.485 183.197 −1.653 172.123 −12.727 171.557 −13.2933 57.843 −11.447 57.778 −11.512 69.674 0.384 44.694 −24.596 44.266 −25.0244 114.906 −6.734 115.119 −6.521 124.525 2.885 124.397 2.757 105.840 −15.800 105.999 −15.6415 C1 175.016 −0.034 174.821 −0.229 162.002 −13.048 160.846 −14.204
C2 173.407 −0.953 173.246 −1.114 158.164 −16.196 158.458 −15.9026 C1 66.478 1.568 a 66.438 1.528 a 53.343 −11.567 a 51.230 −13.680 a
C2 43.069 −1.551 a 42.975 −1.645 a 27.088 −17.532 a 24.751 −19.869 a
7 53.613 −6.957 53.462 −7.108 41.539 −19.031 42.596 −17.974av. |∆ σe| 4.458 4.559 2.044 2.479 15.902 16.016av. |∆ σ0| 3.413 3.365 6.187 6.299 11.726 11.841a Derived from estimated experimental shieldings (see page 1166) and not included in average values.
Basis set av. |∆ σ0| Rank av. |∆ σe| Rank R Rank esd Rank m Rank b Rank[ppm] [ppm] [ppm] [ppm]
STO-3G 54.884 50.708 0.99754 4.372 1.1607 −81.449STO-6G 51.508 47.332 0.99763 4.291 1.0714 −60.7433-21G 26.887 22.711 0.99676 5.016 1.0571 −32.0326-31G 17.527 13.352 0.99788 4.064 0.9754 4 −9.5726-31G∗ 13.294 9.119 0.99853 3.387 1.0350 −14.3586-31+G∗ 13.520 9.345 0.99908 2.670 1.0344 −14.5096-31++G∗ 13.450 9.275 0.99909 2.661 1.0345 −14.4386-31G∗∗ 14.203 10.027 0.99883 3.017 1.0258 −13.9066-31+G∗∗ 14.337 10.162 0.99923 2.450 1.0251 −13.9506-31++G∗∗ 14.337 10.161 0.99928 2.374 1.0249 5 −13.9206-311G 8.663 6.249 0.99781 4.128 0.9294 5.752 56-311G∗ 4.146 2.219 1 0.99920 2.495 0.9774 3 3.204 16-311+G∗ 3.793 2.389 3 0.99920 2.503 0.9693 4.684 36-311++G∗ 3.742 2.347 2 0.99919 2.513 0.9708 4.530 26-311G∗∗ 3.922 2.570 0.99916 2.561 0.9640 5.431 46-311+G∗∗ 3.756 2.885 0.99907 2.698 0.9580 6.7706-311++G∗∗ 3.798 2.838 0.99910 2.646 0.9578 6.733cc-pVDZ 13.993 9.817 0.99940 3 2.154 3 0.9982 1 −9.543cc-pVTZ 3.542 5 2.561 5 0.99931 2.312 0.9629 6.156cc-pVQZ 2.953 2 3.378 0.99936 2.228 0.9508 9.907cc-pV5Z 3.338 3 4.385 0.99936 2.227 0.9426 12.205extrapol. σe
a 4.458 0.99935 2.248 0.9410 12.491extrapol. σ0
a 3.413 0.99925 2.419 0.9416 8.235aug-cc-pVDZ 12.699 8.523 0.99949 1 1.994 1 1.0040 2 −9.126aug-cc-pVTZ 3.557 2.492 4 0.99942 2 2.125 2 0.9607 6.483aug-cc-pVQZ 2.914 1 3.488 0.99938 4 2.192 4 0.9508 10.050aug-cc-pV5Z 3.338 4 4.412 0.99937 5 2.210 5 0.9425 12.237extrapol. σe
a 4.559 0.99938 2.202 0.9418 12.47
HF
extrapol. σ0a 3.365 0.99927 2.389 0.9424 8.216
Table 9. Statisticalparameters of lin-ear regressions forHF calculated 13Cshieldings versusZPV corrected ex-perimental valuesσ exp
e (7 data pointsall carbons exept 6).
a Regressions withshieldings obtainedfrom extrapolation ofDunning basis setscollected in Table 8.
mark value of 194.8 ppm of Table 7. The correspond-ing MP2 value of 201.16 or 200.50 ppm is in full agree-ment to the MP2 calculation of Gauss and Stanton [5](see footnote on p. 1163), but off by 2 ppm from the ex-perimental estimate of σe with 198.9 ppm. The B3LYPvalues are definitely much too small.
From the average values of deviations (av. |∆σ |)shown in Table 8, the general conclusion may be drawnthat the Dunning HF limit values are closer to exper-
imental σ0 values than to estimated σ expe , but MP2
limits are better approximations to the latter parame-ter. Average B3LYP limit values are too small by 11to 16 ppm.
Linear regressions of 13C shieldings
Statistical parameters and ratings of linear regres-sions for our calculations with ZPV corrected exper-imental σ exp
e values are shown in Table 9 for the HF
1166 T. Zuschneid et al. · Experimental Gas Phase 1H NMR Spectra
Basis set av. ∆ σ0 Rank av. ∆ σe Rank R Rank esd Rank m Rank b Rank[ppm] [ppm] [ppm] [ppm]
6-31G 28.329 24.153 0.99960 1.772 1.1473 −48.4126-31G∗ 23.037 18.862 0.99975 1.400 1.1230 −38.4776-31G∗∗ 22.794 18.618 0.99964 1.664 1.1390 −40.7516-31++G∗∗ 22.708 18.532 0.99969 1.554 1.1305 −39.2986-311G 16.946 5 12.771 5 0.99975 1.406 1.0411 5 −19.070 56-311G∗ 12.636 4 8.461 4 0.99987 5 1.010 5 1.0270 2 −12.486 46-311G∗∗ 10.997 3 6.821 3 0.99993 1 0.755 1 1.0353 4 −12.020 36-311++G∗∗ 10.473 2 6.297 2 0.99991 3 0.840 3 1.0285 3 −10.482 2cc-pVDZ 23.216 19.040 0.99987 4 1.002 4 1.1056 −35.900cc-pVTZ 10.117 1 5.941 1 0.99992 2 0.812 2 1.0185 1 −8.646 1aug-cc-pVDZ 21.414 17.238 0.99956 1.853 1.1058 −33.929
MP2
aug-cc-pVTZ a 9.864 – 5.554 – 0.99991 – 0.734 – 1.0083 – −6.875 –6-31G 9.741 5.565 0.99925 2.424 1.0612 −14.5136-31G∗ 5.923 4.244 5 0.99893 2.888 1.0860 −13.8436-31G∗∗ 7.070 3.602 4 0.99923 2.455 1.0724 −13.2886-31++G∗∗ 7.170 3.424 3 0.99909 2.660 1.0660 −12.476 56-311G 1.936 1 4.783 0.99915 2.565 0.9649 9.547 36-311G∗ 5.061 2 9.237 0.99949 1 1.996 1 0.9821 1 11.586 46-311G∗∗ 5.419 3 9.595 0.99938 4 2.197 4 0.9695 3 13.5946-311++G∗∗ 6.067 10.242 0.99931 2.319 0.9625 15.134cc-pVDZ 6.679 2.840 2 0.99931 2.323 1.0365 −7.720 2cc-pVTZ 5.710 4 9.886 0.99939 3 2.175 3 0.9695 2 13.875cc-pVQZ 9.344 13.520 0.99932 2.294 0.9472 20.234cc-pV5Z 11.197 15.373 0.99930 2.336 0.9347 23.549extrapol. σe
b 15.902 0.99928 2.375 0.9296 24.674extrapol. σ0
b 11.726 0.99960 1.768 0.9306 20.377aug-cc-pVDZ 5.767 5 2.364 1 0.99881 3.049 1.0327 4 −6.243 1aug-cc-pVTZ 5.800 9.975 0.99947 2 2.024 2 0.9658 5 14.448aug-cc-pVQZ 9.563 13.738 0.99936 5 2.240 5 0.9460 20.588aug-cc-pV5Z a 10.693 – 15.003 – 0.99956 – 1.625 – 0.9160 – 26.670 –extrapol. σe
b 16.016 0.99907 2.692 0.9347 24.153
B3L
YP
extrapol. σ0b 11.841 0.99943 2.114 0.9357 19.8515
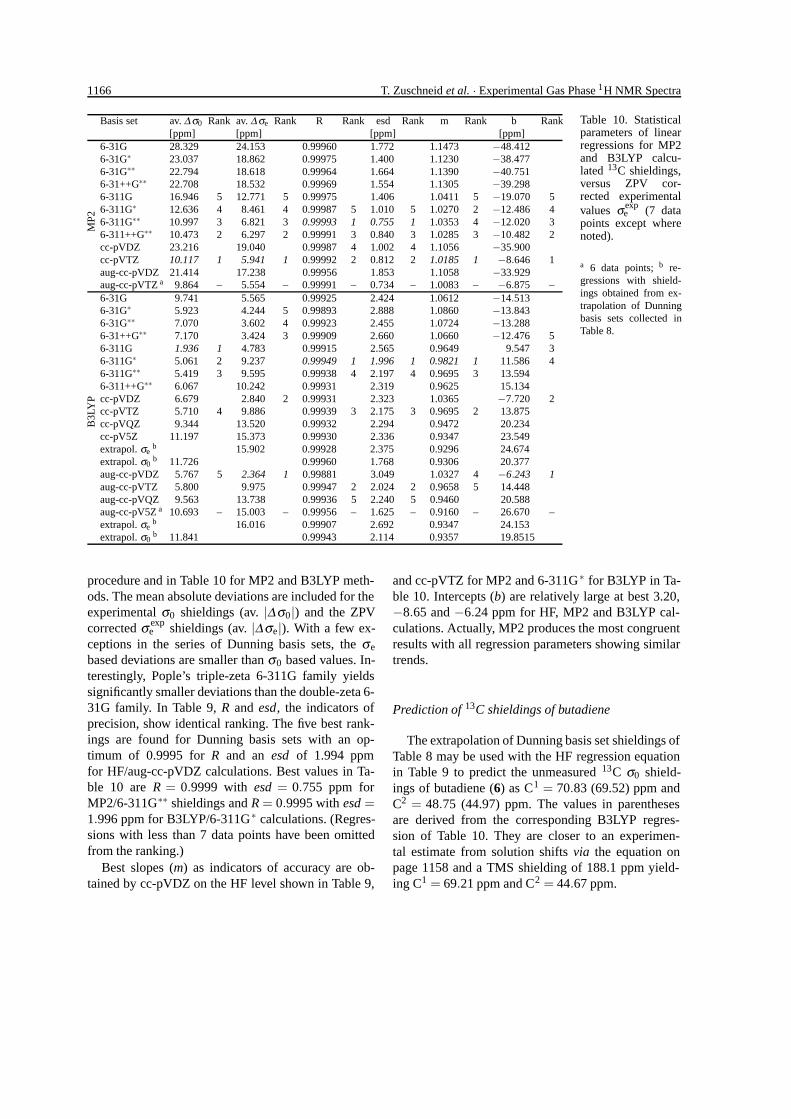
Table 10. Statisticalparameters of linearregressions for MP2and B3LYP calcu-lated 13C shieldings,versus ZPV cor-rected experimentalvalues σexp
e (7 datapoints except wherenoted).
a 6 data points; b re-gressions with shield-ings obtained from ex-trapolation of Dunningbasis sets collected inTable 8.
procedure and in Table 10 for MP2 and B3LYP meth-ods. The mean absolute deviations are included for theexperimental σ0 shieldings (av. |∆σ0|) and the ZPVcorrected σ exp
e shieldings (av. |∆σe|). With a few ex-ceptions in the series of Dunning basis sets, the σe
based deviations are smaller than σ0 based values. In-terestingly, Pople’s triple-zeta 6-311G family yieldssignificantly smaller deviations than the double-zeta 6-31G family. In Table 9, R and esd, the indicators ofprecision, show identical ranking. The five best rank-ings are found for Dunning basis sets with an op-timum of 0.9995 for R and an esd of 1.994 ppmfor HF/aug-cc-pVDZ calculations. Best values in Ta-ble 10 are R = 0.9999 with esd = 0.755 ppm forMP2/6-311G∗∗ shieldings and R = 0.9995 with esd =1.996 ppm for B3LYP/6-311G∗ calculations. (Regres-sions with less than 7 data points have been omittedfrom the ranking.)
Best slopes (m) as indicators of accuracy are ob-tained by cc-pVDZ on the HF level shown in Table 9,
and cc-pVTZ for MP2 and 6-311G∗ for B3LYP in Ta-ble 10. Intercepts (b) are relatively large at best 3.20,−8.65 and −6.24 ppm for HF, MP2 and B3LYP cal-culations. Actually, MP2 produces the most congruentresults with all regression parameters showing similartrends.
Prediction of 13C shieldings of butadiene
The extrapolation of Dunning basis set shieldings ofTable 8 may be used with the HF regression equationin Table 9 to predict the unmeasured 13C σ0 shield-ings of butadiene (6) as C1 = 70.83 (69.52) ppm andC2 = 48.75 (44.97) ppm. The values in parenthesesare derived from the corresponding B3LYP regres-sion of Table 10. They are closer to an experimen-tal estimate from solution shifts via the equation onpage 1158 and a TMS shielding of 188.1 ppm yield-ing C1 = 69.21 ppm and C2 = 44.67 ppm.
T. Zuschneid et al. · Experimental Gas Phase 1H NMR Spectra 1167
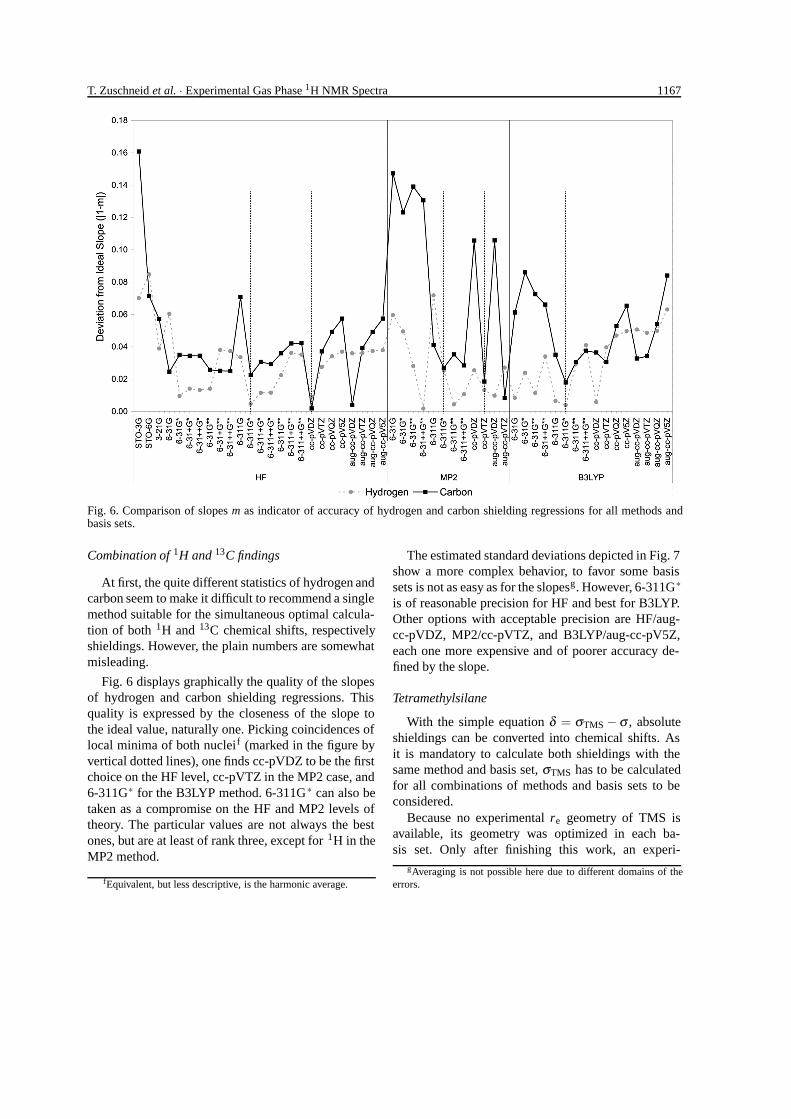
Fig. 6. Comparison of slopes m as indicator of accuracy of hydrogen and carbon shielding regressions for all methods andbasis sets.
Combination of 1H and 13C findings
At first, the quite different statistics of hydrogen andcarbon seem to make it difficult to recommend a singlemethod suitable for the simultaneous optimal calcula-tion of both 1H and 13C chemical shifts, respectivelyshieldings. However, the plain numbers are somewhatmisleading.
Fig. 6 displays graphically the quality of the slopesof hydrogen and carbon shielding regressions. Thisquality is expressed by the closeness of the slope tothe ideal value, naturally one. Picking coincidences oflocal minima of both nucleif (marked in the figure byvertical dotted lines), one finds cc-pVDZ to be the firstchoice on the HF level, cc-pVTZ in the MP2 case, and6-311G∗ for the B3LYP method. 6-311G∗ can also betaken as a compromise on the HF and MP2 levels oftheory. The particular values are not always the bestones, but are at least of rank three, except for 1H in theMP2 method.
fEquivalent, but less descriptive, is the harmonic average.
The estimated standard deviations depicted in Fig. 7show a more complex behavior, to favor some basissets is not as easy as for the slopesg. However, 6-311G∗is of reasonable precision for HF and best for B3LYP.Other options with acceptable precision are HF/aug-cc-pVDZ, MP2/cc-pVTZ, and B3LYP/aug-cc-pV5Z,each one more expensive and of poorer accuracy de-fined by the slope.
Tetramethylsilane
With the simple equation δ = σTMS −σ , absoluteshieldings can be converted into chemical shifts. Asit is mandatory to calculate both shieldings with thesame method and basis set, σTMS has to be calculatedfor all combinations of methods and basis sets to beconsidered.
Because no experimental re geometry of TMS isavailable, its geometry was optimized in each ba-sis set. Only after finishing this work, an experi-
gAveraging is not possible here due to different domains of theerrors.
1168 T. Zuschneid et al. · Experimental Gas Phase 1H NMR Spectra
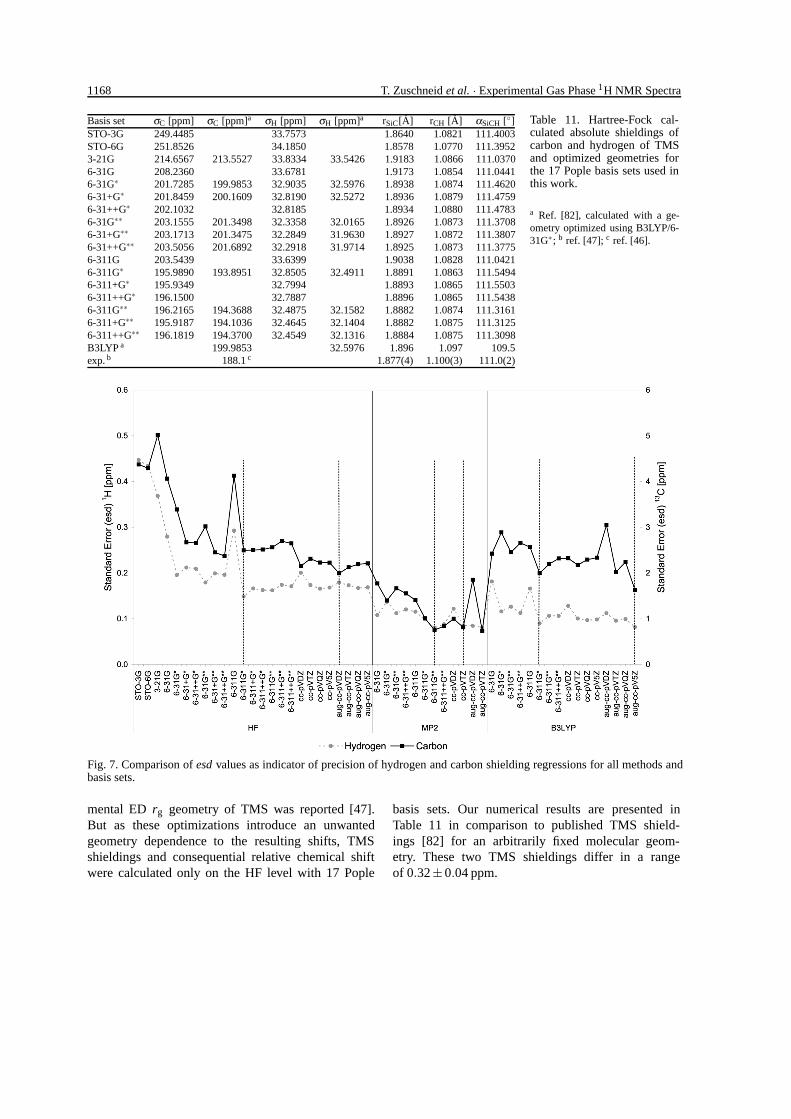
Basis set σC [ppm] σC [ppm]a σH [ppm] σH [ppm]a rSiC[A] rCH [A] αSiCH [◦]STO-3G 249.4485 33.7573 1.8640 1.0821 111.4003STO-6G 251.8526 34.1850 1.8578 1.0770 111.39523-21G 214.6567 213.5527 33.8334 33.5426 1.9183 1.0866 111.03706-31G 208.2360 33.6781 1.9173 1.0854 111.04416-31G∗ 201.7285 199.9853 32.9035 32.5976 1.8938 1.0874 111.46206-31+G∗ 201.8459 200.1609 32.8190 32.5272 1.8936 1.0879 111.47596-31++G∗ 202.1032 32.8185 1.8934 1.0880 111.47836-31G∗∗ 203.1555 201.3498 32.3358 32.0165 1.8926 1.0873 111.37086-31+G∗∗ 203.1713 201.3475 32.2849 31.9630 1.8927 1.0872 111.38076-31++G∗∗ 203.5056 201.6892 32.2918 31.9714 1.8925 1.0873 111.37756-311G 203.5439 33.6399 1.9038 1.0828 111.04216-311G∗ 195.9890 193.8951 32.8505 32.4911 1.8891 1.0863 111.54946-311+G∗ 195.9349 32.7994 1.8893 1.0865 111.55036-311++G∗ 196.1500 32.7887 1.8896 1.0865 111.54386-311G∗∗ 196.2165 194.3688 32.4875 32.1582 1.8882 1.0874 111.31616-311+G∗∗ 195.9187 194.1036 32.4645 32.1404 1.8882 1.0875 111.31256-311++G∗∗ 196.1819 194.3700 32.4549 32.1316 1.8884 1.0875 111.3098B3LYP a 199.9853 32.5976 1.896 1.097 109.5exp. b 188.1 c 1.877(4) 1.100(3) 111.0(2)
Table 11. Hartree-Fock cal-culated absolute shieldings ofcarbon and hydrogen of TMSand optimized geometries forthe 17 Pople basis sets used inthis work.
a Ref. [82], calculated with a ge-ometry optimized using B3LYP/6-31G∗; b ref. [47]; c ref. [46].
Fig. 7. Comparison of esd values as indicator of precision of hydrogen and carbon shielding regressions for all methods andbasis sets.
mental ED rg geometry of TMS was reported [47].But as these optimizations introduce an unwantedgeometry dependence to the resulting shifts, TMSshieldings and consequential relative chemical shiftwere calculated only on the HF level with 17 Pople
basis sets. Our numerical results are presented inTable 11 in comparison to published TMS shield-ings [82] for an arbitrarily fixed molecular geom-etry. These two TMS shieldings differ in a rangeof 0.32±0.04 ppm.
T. Zuschneid et al. · Experimental Gas Phase 1H NMR Spectra 1169
Basis set av. |∆ δ | Rank R Rank esd Rank m Rank b Rank[ppm] [ppm] [ppm]
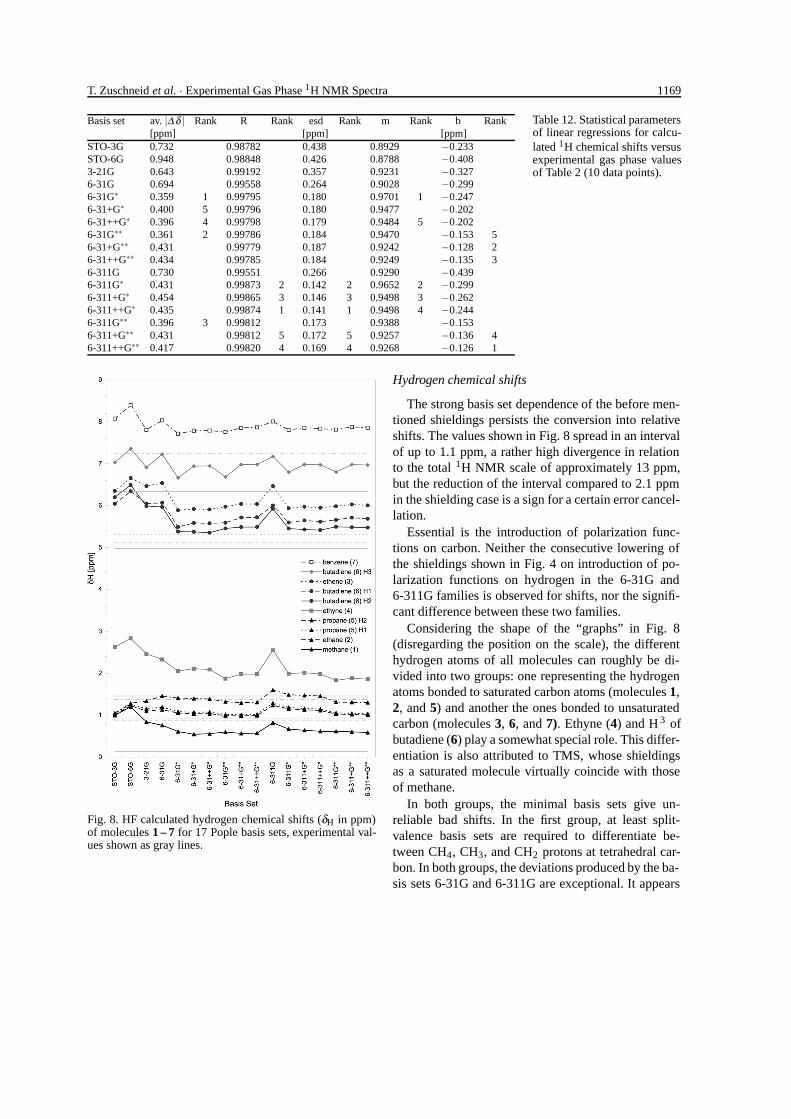
STO-3G 0.732 0.98782 0.438 0.8929 −0.233STO-6G 0.948 0.98848 0.426 0.8788 −0.4083-21G 0.643 0.99192 0.357 0.9231 −0.3276-31G 0.694 0.99558 0.264 0.9028 −0.2996-31G∗ 0.359 1 0.99795 0.180 0.9701 1 −0.2476-31+G∗ 0.400 5 0.99796 0.180 0.9477 −0.2026-31++G∗ 0.396 4 0.99798 0.179 0.9484 5 −0.2026-31G∗∗ 0.361 2 0.99786 0.184 0.9470 −0.153 56-31+G∗∗ 0.431 0.99779 0.187 0.9242 −0.128 26-31++G∗∗ 0.434 0.99785 0.184 0.9249 −0.135 36-311G 0.730 0.99551 0.266 0.9290 −0.4396-311G∗ 0.431 0.99873 2 0.142 2 0.9652 2 −0.2996-311+G∗ 0.454 0.99865 3 0.146 3 0.9498 3 −0.2626-311++G∗ 0.435 0.99874 1 0.141 1 0.9498 4 −0.2446-311G∗∗ 0.396 3 0.99812 0.173 0.9388 −0.1536-311+G∗∗ 0.431 0.99812 5 0.172 5 0.9257 −0.136 46-311++G∗∗ 0.417 0.99820 4 0.169 4 0.9268 −0.126 1
Table 12. Statistical parametersof linear regressions for calcu-lated 1H chemical shifts versusexperimental gas phase valuesof Table 2 (10 data points).
Fig. 8. HF calculated hydrogen chemical shifts (δH in ppm)of molecules 1 – 7 for 17 Pople basis sets, experimental val-ues shown as gray lines.
Hydrogen chemical shifts
The strong basis set dependence of the before men-tioned shieldings persists the conversion into relativeshifts. The values shown in Fig. 8 spread in an intervalof up to 1.1 ppm, a rather high divergence in relationto the total 1H NMR scale of approximately 13 ppm,but the reduction of the interval compared to 2.1 ppmin the shielding case is a sign for a certain error cancel-lation.
Essential is the introduction of polarization func-tions on carbon. Neither the consecutive lowering ofthe shieldings shown in Fig. 4 on introduction of po-larization functions on hydrogen in the 6-31G and6-311G families is observed for shifts, nor the signifi-cant difference between these two families.
Considering the shape of the “graphs” in Fig. 8(disregarding the position on the scale), the differenthydrogen atoms of all molecules can roughly be di-vided into two groups: one representing the hydrogenatoms bonded to saturated carbon atoms (molecules 1,2, and 5) and another the ones bonded to unsaturatedcarbon (molecules 3, 6, and 7). Ethyne (4) and H 3 ofbutadiene (6) play a somewhat special role. This differ-entiation is also attributed to TMS, whose shieldingsas a saturated molecule virtually coincide with thoseof methane.
In both groups, the minimal basis sets give un-reliable bad shifts. In the first group, at least split-valence basis sets are required to differentiate be-tween CH4, CH3, and CH2 protons at tetrahedral car-bon. In both groups, the deviations produced by the ba-sis sets 6-31G and 6-311G are exceptional. It appears
1170 T. Zuschneid et al. · Experimental Gas Phase 1H NMR Spectra
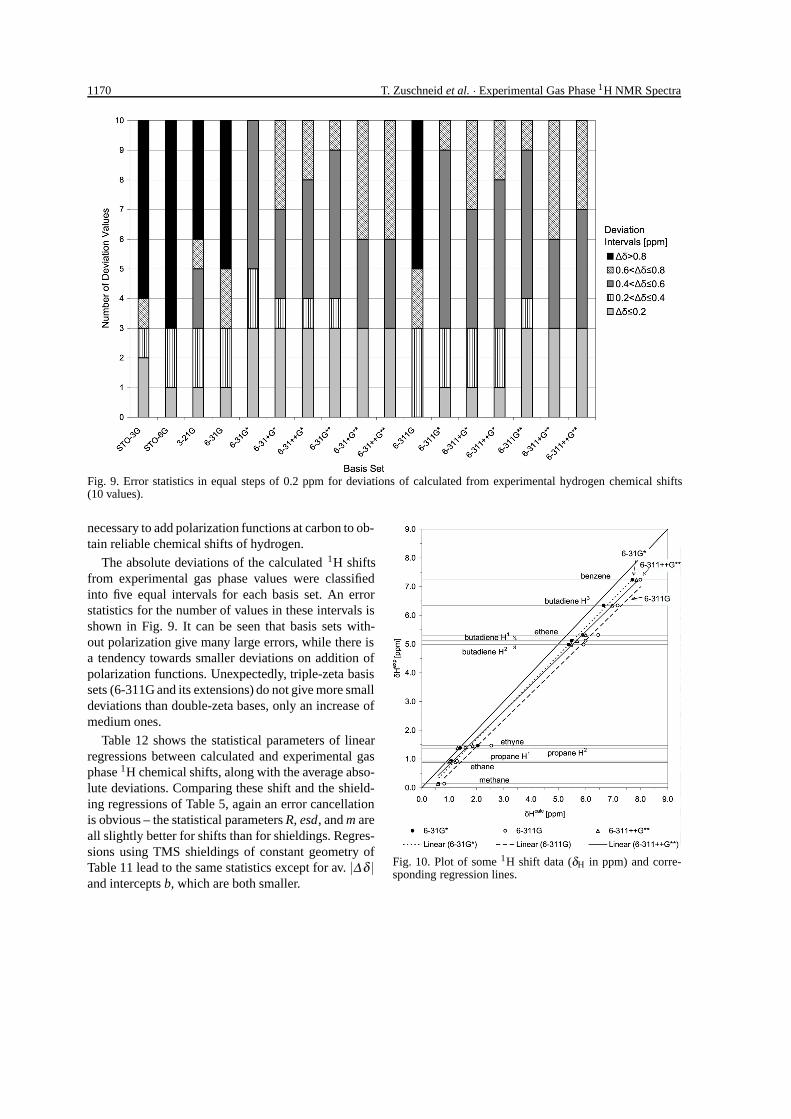
Fig. 9. Error statistics in equal steps of 0.2 ppm for deviations of calculated from experimental hydrogen chemical shifts(10 values).
necessary to add polarization functions at carbon to ob-tain reliable chemical shifts of hydrogen.
The absolute deviations of the calculated 1H shiftsfrom experimental gas phase values were classifiedinto five equal intervals for each basis set. An errorstatistics for the number of values in these intervals isshown in Fig. 9. It can be seen that basis sets with-out polarization give many large errors, while there isa tendency towards smaller deviations on addition ofpolarization functions. Unexpectedly, triple-zeta basissets (6-311G and its extensions) do not give more smalldeviations than double-zeta bases, only an increase ofmedium ones.
Table 12 shows the statistical parameters of linearregressions between calculated and experimental gasphase 1H chemical shifts, along with the average abso-lute deviations. Comparing these shift and the shield-ing regressions of Table 5, again an error cancellationis obvious – the statistical parameters R, esd, and m areall slightly better for shifts than for shieldings. Regres-sions using TMS shieldings of constant geometry ofTable 11 lead to the same statistics except for av. |∆δ |and intercepts b, which are both smaller.
Fig. 10. Plot of some 1H shift data (δH in ppm) and corre-sponding regression lines.
T. Zuschneid et al. · Experimental Gas Phase 1H NMR Spectra 1171
Basis set av. |∆ δ | Rank R Rank esd Rank m Rank b Rank[ppm] [ppm] [ppm]
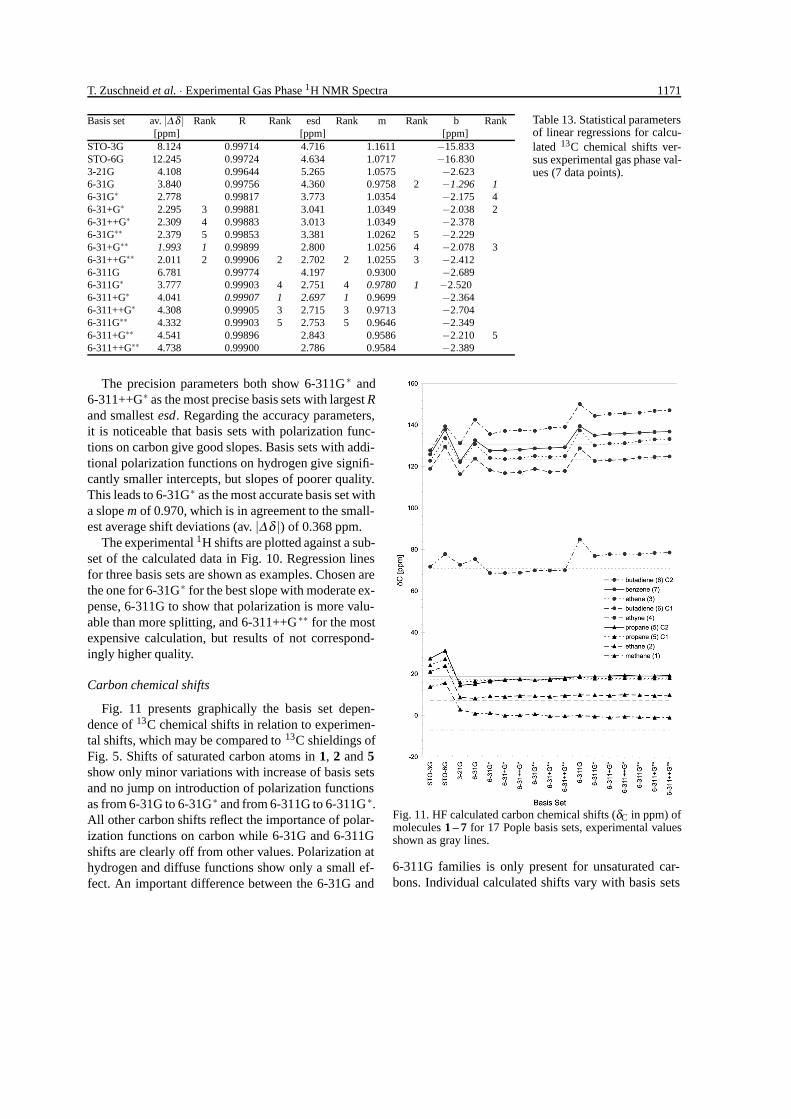
STO-3G 8.124 0.99714 4.716 1.1611 −15.833STO-6G 12.245 0.99724 4.634 1.0717 −16.8303-21G 4.108 0.99644 5.265 1.0575 −2.6236-31G 3.840 0.99756 4.360 0.9758 2 −1.296 16-31G∗ 2.778 0.99817 3.773 1.0354 −2.175 46-31+G∗ 2.295 3 0.99881 3.041 1.0349 −2.038 26-31++G∗ 2.309 4 0.99883 3.013 1.0349 −2.3786-31G∗∗ 2.379 5 0.99853 3.381 1.0262 5 −2.2296-31+G∗∗ 1.993 1 0.99899 2.800 1.0256 4 −2.078 36-31++G∗∗ 2.011 2 0.99906 2 2.702 2 1.0255 3 −2.4126-311G 6.781 0.99774 4.197 0.9300 −2.6896-311G∗ 3.777 0.99903 4 2.751 4 0.9780 1 −2.5206-311+G∗ 4.041 0.99907 1 2.697 1 0.9699 −2.3646-311++G∗ 4.308 0.99905 3 2.715 3 0.9713 −2.7046-311G∗∗ 4.332 0.99903 5 2.753 5 0.9646 −2.3496-311+G∗∗ 4.541 0.99896 2.843 0.9586 −2.210 56-311++G∗∗ 4.738 0.99900 2.786 0.9584 −2.389
Table 13. Statistical parametersof linear regressions for calcu-lated 13C chemical shifts ver-sus experimental gas phase val-ues (7 data points).
The precision parameters both show 6-311G∗ and6-311++G∗ as the most precise basis sets with largest Rand smallest esd. Regarding the accuracy parameters,it is noticeable that basis sets with polarization func-tions on carbon give good slopes. Basis sets with addi-tional polarization functions on hydrogen give signifi-cantly smaller intercepts, but slopes of poorer quality.This leads to 6-31G∗ as the most accurate basis set witha slope m of 0.970, which is in agreement to the small-est average shift deviations (av. |∆δ |) of 0.368 ppm.
The experimental 1H shifts are plotted against a sub-set of the calculated data in Fig. 10. Regression linesfor three basis sets are shown as examples. Chosen arethe one for 6-31G∗ for the best slope with moderate ex-pense, 6-311G to show that polarization is more valu-able than more splitting, and 6-311++G∗∗ for the mostexpensive calculation, but results of not correspond-ingly higher quality.
Carbon chemical shifts
Fig. 11 presents graphically the basis set depen-dence of 13C chemical shifts in relation to experimen-tal shifts, which may be compared to 13C shieldings ofFig. 5. Shifts of saturated carbon atoms in 1, 2 and 5show only minor variations with increase of basis setsand no jump on introduction of polarization functionsas from 6-31G to 6-31G∗ and from 6-311G to 6-311G∗.All other carbon shifts reflect the importance of polar-ization functions on carbon while 6-31G and 6-311Gshifts are clearly off from other values. Polarization athydrogen and diffuse functions show only a small ef-fect. An important difference between the 6-31G and
Fig. 11. HF calculated carbon chemical shifts (δC in ppm) ofmolecules 1 – 7 for 17 Pople basis sets, experimental valuesshown as gray lines.
6-311G families is only present for unsaturated car-bons. Individual calculated shifts vary with basis sets
1172 T. Zuschneid et al. · Experimental Gas Phase 1H NMR Spectra
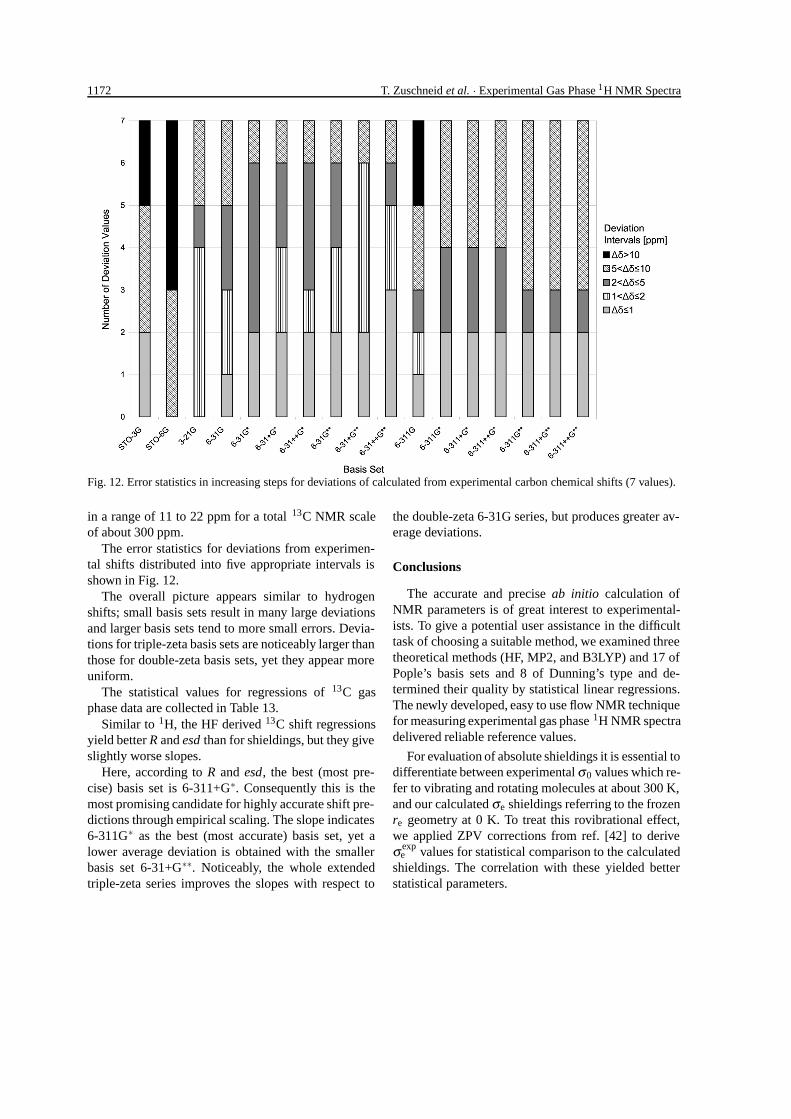
Fig. 12. Error statistics in increasing steps for deviations of calculated from experimental carbon chemical shifts (7 values).
in a range of 11 to 22 ppm for a total 13C NMR scaleof about 300 ppm.
The error statistics for deviations from experimen-tal shifts distributed into five appropriate intervals isshown in Fig. 12.
The overall picture appears similar to hydrogenshifts; small basis sets result in many large deviationsand larger basis sets tend to more small errors. Devia-tions for triple-zeta basis sets are noticeably larger thanthose for double-zeta basis sets, yet they appear moreuniform.
The statistical values for regressions of 13C gasphase data are collected in Table 13.
Similar to 1H, the HF derived 13C shift regressionsyield better R and esd than for shieldings, but they giveslightly worse slopes.
Here, according to R and esd, the best (most pre-cise) basis set is 6-311+G∗. Consequently this is themost promising candidate for highly accurate shift pre-dictions through empirical scaling. The slope indicates6-311G∗ as the best (most accurate) basis set, yet alower average deviation is obtained with the smallerbasis set 6-31+G∗∗. Noticeably, the whole extendedtriple-zeta series improves the slopes with respect to
the double-zeta 6-31G series, but produces greater av-erage deviations.
Conclusions
The accurate and precise ab initio calculation ofNMR parameters is of great interest to experimental-ists. To give a potential user assistance in the difficulttask of choosing a suitable method, we examined threetheoretical methods (HF, MP2, and B3LYP) and 17 ofPople’s basis sets and 8 of Dunning’s type and de-termined their quality by statistical linear regressions.The newly developed, easy to use flow NMR techniquefor measuring experimental gas phase 1H NMR spectradelivered reliable reference values.
For evaluation of absolute shieldings it is essential todifferentiate between experimental σ0 values which re-fer to vibrating and rotating molecules at about 300 K,and our calculated σe shieldings referring to the frozenre geometry at 0 K. To treat this rovibrational effect,we applied ZPV corrections from ref. [42] to deriveσ exp
e values for statistical comparison to the calculatedshieldings. The correlation with these yielded betterstatistical parameters.
T. Zuschneid et al. · Experimental Gas Phase 1H NMR Spectra 1173
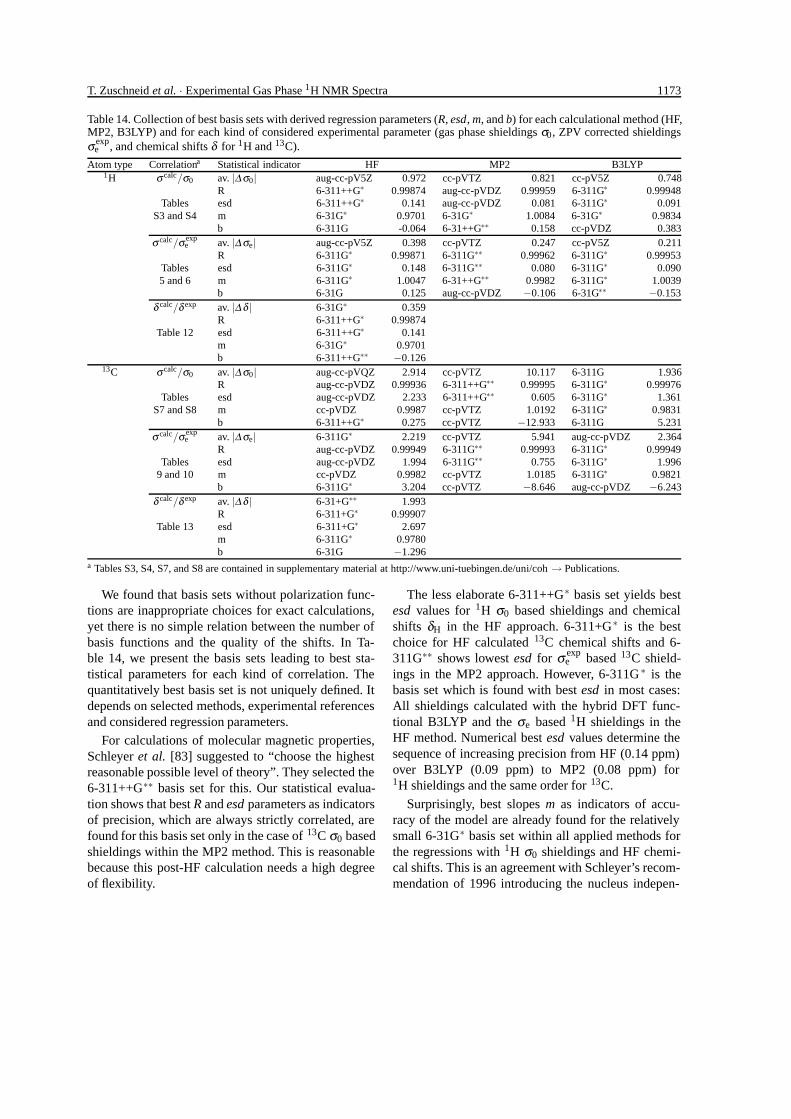
Table 14. Collection of best basis sets with derived regression parameters (R, esd, m, and b) for each calculational method (HF,MP2, B3LYP) and for each kind of considered experimental parameter (gas phase shieldings σ0, ZPV corrected shieldingsσ exp
e , and chemical shifts δ for 1H and 13C).
Atom type Correlationa Statistical indicator HF MP2 B3LYP1H σ calc/σ0 av. |∆ σ0| aug-cc-pV5Z 0.972 cc-pVTZ 0.821 cc-pV5Z 0.748
R 6-311++G∗ 0.99874 aug-cc-pVDZ 0.99959 6-311G∗ 0.99948Tables esd 6-311++G∗ 0.141 aug-cc-pVDZ 0.081 6-311G∗ 0.091
S3 and S4 m 6-31G∗ 0.9701 6-31G∗ 1.0084 6-31G∗ 0.9834b 6-311G -0.064 6-31++G∗∗ 0.158 cc-pVDZ 0.383
σ calc/σ expe av. |∆ σe| aug-cc-pV5Z 0.398 cc-pVTZ 0.247 cc-pV5Z 0.211
R 6-311G∗ 0.99871 6-311G∗∗ 0.99962 6-311G∗ 0.99953Tables esd 6-311G∗ 0.148 6-311G∗∗ 0.080 6-311G∗ 0.0905 and 6 m 6-311G∗ 1.0047 6-31++G∗∗ 0.9982 6-311G∗ 1.0039
b 6-31G 0.125 aug-cc-pVDZ −0.106 6-31G∗∗ −0.153δ calc/δ exp av. |∆ δ | 6-31G∗ 0.359
R 6-311++G∗ 0.99874Table 12 esd 6-311++G∗ 0.141
m 6-31G∗ 0.9701b 6-311++G∗∗ −0.126
13C σ calc/σ0 av. |∆ σ0| aug-cc-pVQZ 2.914 cc-pVTZ 10.117 6-311G 1.936R aug-cc-pVDZ 0.99936 6-311++G∗∗ 0.99995 6-311G∗ 0.99976
Tables esd aug-cc-pVDZ 2.233 6-311++G∗∗ 0.605 6-311G∗ 1.361S7 and S8 m cc-pVDZ 0.9987 cc-pVTZ 1.0192 6-311G∗ 0.9831
b 6-311++G∗ 0.275 cc-pVTZ −12.933 6-311G 5.231σ calc/σ exp
e av. |∆ σe| 6-311G∗ 2.219 cc-pVTZ 5.941 aug-cc-pVDZ 2.364R aug-cc-pVDZ 0.99949 6-311G∗∗ 0.99993 6-311G∗ 0.99949
Tables esd aug-cc-pVDZ 1.994 6-311G∗∗ 0.755 6-311G∗ 1.9969 and 10 m cc-pVDZ 0.9982 cc-pVTZ 1.0185 6-311G∗ 0.9821
b 6-311G∗ 3.204 cc-pVTZ −8.646 aug-cc-pVDZ −6.243δ calc/δ exp av. |∆ δ | 6-31+G∗∗ 1.993
R 6-311+G∗ 0.99907Table 13 esd 6-311+G∗ 2.697
m 6-311G∗ 0.9780b 6-31G −1.296
a Tables S3, S4, S7, and S8 are contained in supplementary material at http://www.uni-tuebingen.de/uni/coh → Publications.
We found that basis sets without polarization func-tions are inappropriate choices for exact calculations,yet there is no simple relation between the number ofbasis functions and the quality of the shifts. In Ta-ble 14, we present the basis sets leading to best sta-tistical parameters for each kind of correlation. Thequantitatively best basis set is not uniquely defined. Itdepends on selected methods, experimental referencesand considered regression parameters.
For calculations of molecular magnetic properties,Schleyer et al. [83] suggested to “choose the highestreasonable possible level of theory”. They selected the6-311++G∗∗ basis set for this. Our statistical evalua-tion shows that best R and esd parameters as indicatorsof precision, which are always strictly correlated, arefound for this basis set only in the case of 13C σ0 basedshieldings within the MP2 method. This is reasonablebecause this post-HF calculation needs a high degreeof flexibility.
The less elaborate 6-311++G∗ basis set yields bestesd values for 1H σ0 based shieldings and chemicalshifts δH in the HF approach. 6-311+G∗ is the bestchoice for HF calculated 13C chemical shifts and 6-311G∗∗ shows lowest esd for σ exp
e based 13C shield-ings in the MP2 approach. However, 6-311G ∗ is thebasis set which is found with best esd in most cases:All shieldings calculated with the hybrid DFT func-tional B3LYP and the σe based 1H shieldings in theHF method. Numerical best esd values determine thesequence of increasing precision from HF (0.14 ppm)over B3LYP (0.09 ppm) to MP2 (0.08 ppm) for1H shieldings and the same order for 13C.
Surprisingly, best slopes m as indicators of accu-racy of the model are already found for the relativelysmall 6-31G∗ basis set within all applied methods forthe regressions with 1H σ0 shieldings and HF chemi-cal shifts. This is an agreement with Schleyer’s recom-mendation of 1996 introducing the nucleus indepen-
1174 T. Zuschneid et al. · Experimental Gas Phase 1H NMR Spectra
dent chemical shift (NICS) calculations as a probe ofaromaticity [84].
Average deviations between calculated and experi-mental values (av. |∆x|) of Table 14 are with two ex-ceptions lowest for different basis sets of the Dunningseries, especially cc-pVTZ.
For HF and B3LYP, three consecutive calculationswith Dunning basis sets could be exponentially ex-trapolated to determine basis set limits of 1H and13C shieldings. For 1H shieldings, average deviationsare smallest for these limits.
The selection of best basis sets presented in Table 14may be misleading as the numerical differences be-tween the five foremost basis sets indicated by rank-ings in the appropriate tables of this paper and the sup-plementary material are not too big. For example, the
6-311G∗ basis set occurs relatively often ranking sec-ond with hardly poorer quality.
For any basis set of our selection, the correspondingregression equation can be used to correct a calculatedσe shielding of 1H or 13C to a predicted shielding orchemical shift which can be compared to experiment.
As a general conclusion, the 6-311G∗ basis set maybe recommended for simultaneous GIAO calculationsof 1H and 13C with both high precision and accuracyin the HF and B3LYP methods. For MP2 calculations,a larger basis set between 6-311G∗∗ and 6-311++G∗∗or cc-pVTZ is advisable, but diffuse functions are notessential.
Acknowledgements
The authors wish to thank Dr. Heidrun Handel for assistancewith WIN-DAISY.
[1] L. M. Jackman, S. Sternhell, “Applications of NuclearMagnetic Resonance Spectroscopy in Organic Chem-istry”, 2nd ed., Pergamon Press, Oxford (1969).
[2] H. Gunther, “NMR-Spektroskopie”, 3rd ed., Thieme,Stuttgart (1992).
[3] J. K. M. Sanders, B. K. Hunter, “Modern NMR Spec-troscopy. A Guide for Chemists”, Oxford UniversityPress (1987).
[4] T. Helgaker, M. Jaszunski, K. Ruud, “Ab Initio Meth-ods for the Calculation of NMR Shielding and IndirectSpin-Spin Coupling Constants”, Chem. Rev. 99, 293(1999).
[5] J. Gauss, J. F. Stanton, “Electron-Correlated Ap-proaches for the Calculation of NMR ChemicalShifts”, Adv. Chem. Phys. 123, 355 (2002).
[6] M. Kaupp, M. Buhl, V. G. Malkin (Eds.), “Calculationof NMR and EPR Parameters, Theory and Applica-tions”, Wiley-VCH, Weinheim (2004).
[7] N. F. Ramsay, Phys. Rev. 78, 699 (1950).[8] W. Kutzelnigg, Isr. J. Chem. 19, 193 (1980).[9] M. Schindler, W. Kutzelnigg, J. Chem. Phys. 76, 1919
(1982).[10] A. E. Hansen, T. D. Bouman, J. Chem. Phys. 82, 5035
(1985).[11] T. A. Keith, R. F. W. Bader, Chem. Phys. Lett. 210, 223
(1993).[12] F. London, Naturwissenschaften 15, 187 (1937).[13] F. London, J. Phys. Radium 8, 397 (1937).[14] R. Ditchfield, Chem. Phys. Lett. 15, 203 (1972).[15] R. Ditchfield, Mol. Phys. 27, 789 (1974).[16] K. Wolinski, J. F. Hinton, P. Pulay, J. Am. Chem. Soc.
112, 8251 (1990).[17] Gaussian 98, Revision A.7, M. J. Frisch, G. W.
Trucks, H. B. Schlegel, G. E. Scuseria, M. A. Robb,J. R. Cheeseman, V. G. Zakrzewski, J. A. Montgomery
(Jr.), R. E. Stratmann, J. C. Burant, S. Dapprich,J. M. Millam, A. D. Daniels, K. N. Kudin, M. C.Strain, O. Farkas, J. Tomasi, V. Barone, M. Cossi,R. Cammi, B. Mennucci, C. Pomelli, C. Adamo,S. Clifford, J. Ochterski, G. A. Petersson, P. Y. Ayala,Q. Cui, K. Morokuma, D. K. Malick, A. D. Rabuck,K. Raghavachari, J. B. Foresman, J. Cioslowski,J. V. Ortiz, A. G. Baboul, B. B. Stefanov, G. Liu,A. Liashenko, P. Piskorz, I. Komaromi, R. Gomperts,R. L. Martin, D. J. Fox, T. Keith, M. A. Al-Laham, C. Y.Peng, A. Nanayakkara, C. Gonzalez, M. Challacombe,P. M. W. Gill, B. Johnson, W. Chen, M. W. Wong, J. L.Andres, C. Gonzalez, M. Head-Gordon, E. S. Replogle,J. A. Pople, Gaussian, Inc., Pittsburgh PA (1998).
[18] D. B. Chesnut, C. K. Foley, J. Chem. Phys. 84, 852(1986).
[19] D. B. Chesnut, C. G. Phung, J. Chem. Phys. 91, 6238(1989).
[20] D. B. Chesnut, D. W. Wright, J. Comput. Chem. 12,546 (1991).
[21] C. M. Rohlfing, L. C. Allen, R. Ditchfield, Chem. Phys.87, 9 (1984).
[22] H. Fukui, T. Baba, H. Matsuda, K. Miura, J. Chem.Phys. 100, 6608 (1994).
[23] J. R. Cheeseman, G. W. Trucks, T. A. Keith, M. J.Frisch, J. Chem. Phys. 104, 5497 (1996).
[24] D. B. Chesnut, Chem. Phys. 214, 73 (1997).[25] W. J. Hehre, L. Radom, P. v. R. Schleyer, J. A.
Pople, “Ab initio Molecular Orbital Theory”, Wiley-Interscience, New York (1986).
[26] W. Koch, M. C. Holthausen, “A Chemists Guideto Density Functional Theory”, Wiley/VCH, NewYork/Weinheim (1999).
[27] D. A. Forsyth, A. B. Sebag, J. Am. Chem. Soc. 119,9483 (1997).
T. Zuschneid et al. · Experimental Gas Phase 1H NMR Spectra 1175
[28] I. Alkorta, J. Elguero, New J. Chem. 381 (1998).[29] K. B. Wiberg, J. Comput. Chem. 20, 1299 (1999).[30] P. R. Rablen, S. A. Pearlman, J. Finkbiner, J. Phys.
Chem. A 103, 7357 (1999).[31] K. B. Wiberg, J. D. Hammer, K. W. Zilm, J. R. Cheese-
man, J. Org. Chem. 64, 6394 (1999).[32] C. Møller, M. S. Plesset, Phys. Rev. 46, 618 (1934).[33] J. Gauss, J. Chem. Phys. 99, 3629 (1993).[34] J. Gauss, Chem. Phys. Lett. 229, 198 (1994).[35] J. Gauss, J. F. Stanton, J. Chem. Phys. 102, 251 (1995).[36] J. Gauss, J. F. Stanton, J. Chem. Phys. 103, 3561
(1995).[37] J. Gauss, J. F. Stanton, J. Chem. Phys. 104, 2574
(1996).[38] K. Ruud, T. Helgaker, R. Kobayashi, P. Jørgensen,
K. L. Bak, H. J. Aa. Jensen, J. Chem. Phys. 100, 8178(1994).
[39] W. T. Raynes, P. W. Fowler, P. Lazzeretti, R. Zanasi,M. Grayson, Mol. Phys. 64, 143 (1988).
[40] D. Sundholm, J. Gauss, A. Schafer, J. Chem. Phys. 105,11051 (1996).
[41] K. Ruud, P.-O. Astrand, P. R. Taylor, J. Chem. Phys.112, 2668 (2000).
[42] K. Ruud, P.-O. Astrand, P. R. Taylor, J. Am. Chem.Soc. 123, 4826 (2001).
[43] J. Vaara, K. Ruud, O. Vahtras, J. Chem. Phys. 41, 2900(1999).
[44] R. Cammi, B. Mennucci, J. Tomasi, J. Chem. Phys.110, 7627 (1999).
[45] K. Jackowski, W. T. Raynes, Mol. Phys. 34, 465(1977).
[46] A. K. Jameson, C. J. Jameson, Chem. Phys. Lett. 134,461 (1987).
[47] A. R. Campanelli, F. Ramondo, A. Domenicano, I. Har-gittai, Struct. Chem. 11, 155 (2000).
[48] J. Gauss, Ber. Bunsenges. Phys. Chem. 99, 1001(1995).
[49] L. Olsson, D. Cremer, J. Chem. Phys. 105, 8995(1996).
[50] B. Wang, U. Fleischer, J. F. Hinton, P. Pulay, J. Com-put. Chem. 22, 1887 (2001).
[51] J. Gauss, J. Chem. Phys. 116, 4773 (2002).[52] H. C. Dorn, in D. M. Grant, R. K. Harris (eds): Ency-
clopedia of Nuclear Magnetic Resonance, p. 2026 –2037, Wiley, Chichester (1996).
[53] G. Hafelinger, C. U. Regelmann, T. M. Krygowski,K. Wozniak, J. Comput. Chem. 10, 329 (1989).
[54] G. Hafelinger, in R. Zalewski, T. M. Krygowski,J. Shorter (eds): Similarity Models in Organic Chem-istry, Biochemistry and Related Fields, p. 177 – 229,Elsevier, Amsterdam (1991).
[55] A. Neugebauer, G. Hafelinger, J. Mol. Struct.(Theochem) 578, 229 (2002).
[56] A. Neugebauer, G. Hafelinger, J. Mol. Struct.(Theochem) 585, 35 (2002).
[57] L. S. Bartell, H. K. Kuchitsu, J. Chem. Phys. 68, 1213(1978).
[58] J. L. Duncan, D. C. McKean, A. J. Bruce, J. Mol. Spec-trosc. 74, 361 (1979).
[59] J. L. Duncan, Mol. Phys. 28, 1177 (1974).[60] W. J. Lafferty, R. J. Thibault, J. Mol. Spectrosc. 14, 79
(1964).[61] J. Gauss, J. F. Stanton, J. Phys. Chem. A 104, 2865
(2000).[62] M.-N. Homsi, Dissertation, Universitat Tubingen
(1999).[63] M. J. Frisch, J. A. Pople, J. S. Binkley, J. Chem. Phys.
80, 3265 (1984).[64] T. H. Dunning, Jr., J. Chem. Phys. 90, 1007 (1989).[65] A. D. Becke, J. Chem. Phys. 98, 5648 (1993).[66] P. J. Stephens, F. J. Devlin, C. F. Chabalowski, M. J.
Frisch, J. Phys. Chem. 98, 11623 (1994).[67] W. T. Raynes, Nucl. Magn. Reson. 7, 25 (1977).[68] L. V. Vilkov, V. S. Mastrynkov, N. I. Sadova, “De-
termination of the Geometrical Structure of FreeMolecules”, Mir Publ., Moscow (1983).
[69] Y. Morino, K. Kuchitsu, T. Oka, J. Chem. Phys. 37,1108 (1963).
[70] M. Fink, C. W. Schmiedekamp, D. Gregory, J. Chem.Phys. 71, 5238 (1976).
[71] C. J. Jameson, A. C. de Dios, Nucl. Magn. Reson. 31,64 (2001).
[72] D. E. Woon, T. H. Dunning, Jr., J. Chem. Phys. 99,1914 (1993).
[73] D. Feller, J. Chem. Phys. 96, 6104 (1992).[74] W. Kloppert, K. L. Bak, P. Jørgensen, J. Olsen, T. Hel-
gaker, J. Phys. B: At. Mol. Opt. Phys. 32, R103 (1999).[75] A. Neugebauer, Dissertation, Universitat Tubingen
(2002).[76] A. Neugebauer, G. Hafelinger, J. Phys. Org. Chem.
submitted (2004).[77] C. J. Guare, J. Chem. Educ. 68, 649 (1991).[78] W. T. Raynes, R. McVay, S. J. Wright, J. Chem. Soc.
Faraday Trans. 2 85, 759 (1989).[79] P. Lazzeretti, R. Zanasi, A. J. Sadlej, W. T. Raynes,
Mol. Phys. 62, 605 (1987).[80] A. M. Lee, N. C. Handy, S. M. Colwell, J. Chem. Phys.
103, 10095 (1995).[81] P. J. Wilson, R. D. Amos, N. C. Handy, Chem. Phys.
Letters 312, 475 (1999).[82] J. B. Foresman, Æ. Frisch, “Exploring Chemistry with
Electronic Structure Methods”, 2nd ed., Gaussian, Inc.,Pittsburgh PA (1996).
[83] M. K. Cyranski, T. M. Krygowski, A. R. Katritzky,P. v. R. Schleyer, J. Org. Chem. 67, 1333 (2002).
[84] P. v. R. Schleyer, C. Maerker, A. Dransfeld, H. Jiao,

1176 T. Zuschneid et al. · Experimental Gas Phase 1H NMR Spectra
N. J. R. van Eikema Hommes, J. Am. Chem. Soc. 118,6317 (1996).
[85] C. Suarez, N. S. True, B. E. Weiss, Bol. Soc. Chil.Quim. 34, 15 (1989).
[86] H. Spiesecke, W. G. Schneider, J. Chem. Phys. 35, 722(1961).
[87] L. Petrarkis, C. H. Sederholm, J. Chem. Phys. 35, 1175(1961).
[88] K. Jackowski, M. Wilczek, M. Pecul, J. Sadlej, J. Phys.Chem. 104, 5955 and 9806 (2000).
[89] P. Lazzeretti, M. Malagoli, R. Zanasi, J. Mol. Struct.(Theochem) 234, 127 (1991).
[90] B. Bennett, W. T. Raynes, Magn. Reson. Chem. 29, 946(1991).
[91] U. Fleischer, W. Kutzelnigg, P. Lazzeretti,V. Muhlenkamp, J. Am. Chem. Soc. 116, 5298(1994).