Embed Size (px)
Citation preview
Addison County Pellet Addison County Pellet Feasibility StudyFeasibility Study
Final Report • November 2009
Acknowledgements
Many people contributed to this study by provid-ing their insight, review, and expertise. A steering committee was established and provided guidance throughout the study. These study stakeholders pro-vided essential information and feedback throughout the process, and we thank the Steering Committee Members:
Kevin Behm, Assistant Director, Addison County Regional Planning Commission
Sid Bosworth, Associate Extension Professor, Univer-sity of Vermont
Ted Foster, Co-Owner, Foster Brothers Dairy Farm
Adam Lougee, Executive Director, Addison County Regional Planning Commission
Bob McNary, Addison County Regional Planning Commission – Energy Committee Chair
Harvey Smith, Former Director of Vermont Farm Service Agency and ACRPC Executive Board Member
Chris Olson, Addison County Forester, State of Vermont Department of Forests and Parks
Bill Scott, Chair, Addison County Farm Bureau
Netaka White, BioFuels Director, Vermont Sustainable Jobs Fund
Robin Scheu, Executive Director, Addison County Economic Development Corporation
Special thanks go also to Mike Brouillette at Vermont Center for Geographic Information for the spatial analysis performed for the fi ber assessment and to Scott Sawyer at Vermont Sustainable Jobs Fund for coordinating synergistic efforts on the Vermont Energy Atlas. Nancy Wasserman of Sleeping Lion Associates conducted review of the conceptual pellet mill business fi nancials.
Additional thanks go to the following individuals for their assistance:
Andy Mayer, Executive Director, Addison Chamber of Commerce
Chris Brooks, CEO, Vermont Wood Pellet L.L.C
Brian Terry, General Manager, Curran Energy L.L.C
Duncan Harris, Redstone Real Estate
Disclaimer
This report presents the best effort to determine, conceptually, whether a pellet fuel manufacturing business could be established in Addison County and if so what the optimal sized business would be. None of the information contained in this report is specifi c to any particular business or project. All information and conclusions drawn are conceptual in nature and should not be construed as professional assessment of the viability of any specifi c project.
Biomass Energy Resource Center
The mission of the Biomass Energy Resource Center (BERC) is to achieve a healthier environment, strengthen local economies, and increase energy se-curity across the United States by developing sustain-able biomass energy systems at the community level.
BERC is an independent, national nonprofi t organiza-tion that assists communities, colleges and universi-ties, schools, state and local governments, businesses, utilities, and others in making the most of their local energy resources. With expertise in institutional and community-scale wood energy systems, BERC helps initiate and implement biomass projects for heating and power needs.
Printed on 100% post-consumer recycled paper manufactured using 100% wind-generated electricity.
© Copyright November 2009 Biomass Energy Resource Center. All rights reserved.

Addison County Pellet Feasibility Study
Final Report • November 2009
Contents
Executive Summary 1
1.0 Introduction 4
2.0 Study Scope 5
3.0 Methods 7
4.0 Introduction to Pellets 8
5.0 Wood Fiber Assessment
for Addison County 12
6.0 Agricultural Fiber Assessment
for Addison County 37
7.0 Potential Pellet Mill Site
Identifi cation 48
8.0 Pellet Fuel Market Assessment
for Addison County 55
9.0 Pellet Fuel Manufacturing
Business Overview 69
10.0 Study Conclusions 82
11.0 Appendices
Page BERC Final Report on Addison County Pellet Feasibility Study1
The Town of Bridport and the Addison Coun-
ty Regional Planning Commission (ACRPC)
received a Vermont Community Development
Program – Planning Grant from the State of
Vermont. They hired Biomass Energy Re-
source Center (BERC) to assess the feasibility
of locating a pellet mill in Addison County and
to determine to what extent fi bers for mak-
ing pellets could be sourced from within the
county and pellet fuel could be sold locally to
serve the Addison County heating market.
The scope of work includes an estimation of
wood and agricultural fi ber availability and
pricing, identifi cation of sites for a potential
bio-fi ber fuel production plant, an assessment
of the pellet fuel market in Addison County,
and an overview of a pellet fuel manufacturing
business including site layout and capital costs.
FIBER SUPPLY
Pellet fuel is nearly completely dry whereas
freshly cut wood or grass contains signifi cant
moisture levels. Any pellet mill using green
wood fi ber as its primary ingredient requires
nearly twice as much input material than its
production of pellets. The major difference is
water weight lost in drying.
Addison County covers 516,895 acres in
total, of which 230,268 acres or 45 percent
are forested and 133,946 acres or 25 percent
are under agricultural uses. The remainder is
mostly developed areas and bodies of water.
Small volumes of wood residues from sawmills,
secondary wood processing, and communi-
ties exist, but are either in high demand, have
a dwindling supply, or are not ideal for pellet
making. In order to use wood fi ber for pellet
making, any facility will require an abundant,
stable supply. Therefore, a very large majority of
the wood fi ber will be sourced from harvested
low-grade wood from local forests. Detailed
analysis of the forest wood fi ber available in Ad-
dison County concluded that there is less than
100,000 green tons of low-grade wood suitable
for wood fuel production on an accessible and
presumably managed footprint of forestland.
When current demand for residential fi rewood,
pulp fi ber, and biomass for energy are subtract-
ed, less than 20,000 green tons remain in excess
capacity. If a pellet mill were built in Addison
County and the owners looked to source its
wood exclusively from within Addison County,
it would signifi cantly limit the size of the pellet
mill to the lower end of the normal pellet mill
size spectrum. It should be noted that a typical
sized pellet mill would likely draw upon several
counties for its fi ber supply not exclusively Ad-
dison County. If a larger procurement area were
used, a dramatically larger pellet mill could be
supported with wood fi ber.
Wood is not the only fi ber from which pellets
can be made. Agricultural materials such as
grass can be made into pellets; for this reason,
the study also included analysis of the potential
for agricultural fi bers to supplement the supply
of wood. In any given year there are signifi cant
amounts of “waste” hay (hay unsuitable for
animal feed) produced each year in Addison
County. However, due to the highly variable
weather from year to year, the exact amount
produced annually fl uctuates widely. In addi-
tion, the potential for dedicated energy crops
(primarily grasses) were modeled. This analysis
concluded there is far greater capacity to grow
agricultural fi ber than there is sustainable sup-
ply of wood fi ber(beyond existing demand for
wood fuel)—conservative scenarios targeting
small percentages of under-utilized farm land
yielded amounts of fi ber equal to the modest
amounts available from forests in the county.
Executive Summary
Study purpose:
• to assess the fea-
sibility of locating
a pellet mill in
Addison County
• to determine to
what extent fi bers
for making pellets
could be sourced
from within the
county and pel-
let fuel could be
sold locally to
serve the Addison
County heating
market
BERC Final Report on Addison County Pellet Feasibility Study Page 2
However, while the in-county potential is
greater for grass than for wood, the pellet mill
business model does not currently support us-
ing more grass than wood fi ber. There are two
main reasons why—grass costs on average 72
percent more than wood fi ber and grass fi bers
contain on average four to six times greater
levels of ash causing minerals. The large ma-
jority of the pellet purchasing market wants
low-price and low ash pellet fuel with excel-
lent performance and convenience. Therefore,
at the current time, agricultural fi bers cannot
compete in the market with wood fi ber and
should only be considered a short term rem-
edy to fi ll supply holes in the wood supply. As
the markets change over time, grass may prove
a more viable option.
Left only with wood fi ber, the local resources
of Addison County could not fully support a
small pellet mill (3 tons per hour capacity) pro-
ducing approximately 10,000 tons of saleable
pellets annually. A more likely scenario of draw-
ing wood from surrounding counties in ad-
dition to Addison County would signifi cantly
increase the viability of fi ber supply for a larger
pellet mill (6 or 12 ton per hour capacity).
PELLET MILL LOCATIONS
Pellet mills are fairly similar to sawmills in their
facility size, nature of operation, and siting
requirements. By reviewing industrial zoned
parcels fi ve acres and larger, this study identi-
fi ed multiple locations for a possible pellet mill
in Addison County. The scope was narrowed
by reviewing truck access, distance to neigh-
bors, access to rail spurs, distance to three-
phase electricity, and current use compatibility
to select the fi ve best sites1. These were, in no
particular order:
• Undeveloped farmland adjacent to the
Vermont Natural Ag Products composting
operation
• Undeveloped land located on Industrial
Ave in the Middlebury Industrial Park
• Integrated at the former Claire Lathrup
Bandmill site in Bristol
• Integrated with the A Johnson Company’s
active sawmill operation in Bristol
• Integrated with the current feed mill opera-
tions at the old White Pigment mill in New
Haven
Most of the sites identifi ed above could sup-
port 3 or 6 ton per hour pellet mills, however
only the largest parcels could support a full 12
ton per hour pellet mill.
PELLET FUEL MARKET
At roughly 2.4 percent of the total heating
market, the current commercial and residen-
tial markets for pellet heating fuels in Addison
County are in their infancy, but the market
potential for further conversion to pellet-based
heating is strong. Analysis of Addison County
commercial and residential heating concluded
that there is insuffi cient current market within
Addison County alone to support even a small
pellet mill. However, further analysis of pro-
jected pellet heating market growth concluded
a more than 600 percent increase in Addison’s
pellet market would be necessary to support
a small pellet mill producing 10,000 tons an-
nually. Like the fi ber assessment, the market
study found that while the current in-county
market for pellet sales is rather small, extend-
ing distribution to include both Chittenden
and Rutland Counties would dramatically in-
crease the size pellet mill that could be viable.
1 There are numerous other possible sites that could possibly support a pellet mill in Addison County. The list presented above is intended to present the best fi ve sites of those identifi ed in this search and not intended to be an exhaustive list.
Page BERC Final Report on Addison County Pellet Feasibility Study3
A small online survey of Addison County resi-
dents and businesses showed that considerable
interest exists in converting to pellet-based
heating. However, most of those surveyed
need less than a four-year simple payback on
the investment to install the pellet heating
appliance and a reliable source of pellets. At
today’s heating oil price of $2.50 per gallon,
a typical payback period for installing a pellet
heating appliance would be 5.3 years (only
3.7 years with current tax incentives). Whereas
at $4.50 per gallon heating oil, this payback
period would be cut in half. Survey responses
from Addison County residents and businesses
support the conclusion that dramatic expan-
sion of the current pellet market would occur
should the price of oil and propane rebound to
their 2008 levels.
CONCLUSIONS
Based upon the results of this fi ber resource
assessment, the potential site location review,
and the market assessment, BERC concludes
that a pellet mill producing 10,000 tons per
year is the optimum sized pellet manufactur-
ing facility to serve Addison County. However,
it is important to note that should a business
envision a larger fi ber procurement area and
larger product distribution area, Addison
County could support a larger pellet mill—up
to 50,000 tons per year in capacity.
Development and examination of conceptual
business pro forma fi nancials for three differ-
ent sized pellet mills indicated that the largest
pellet mill (capable of producing upward of
90,000 tons per year) produced the greatest
fi nancial rate of return while the smaller pellet
mill size (10,000 tons per year) yielded a very
modest yet still positive return on investment.
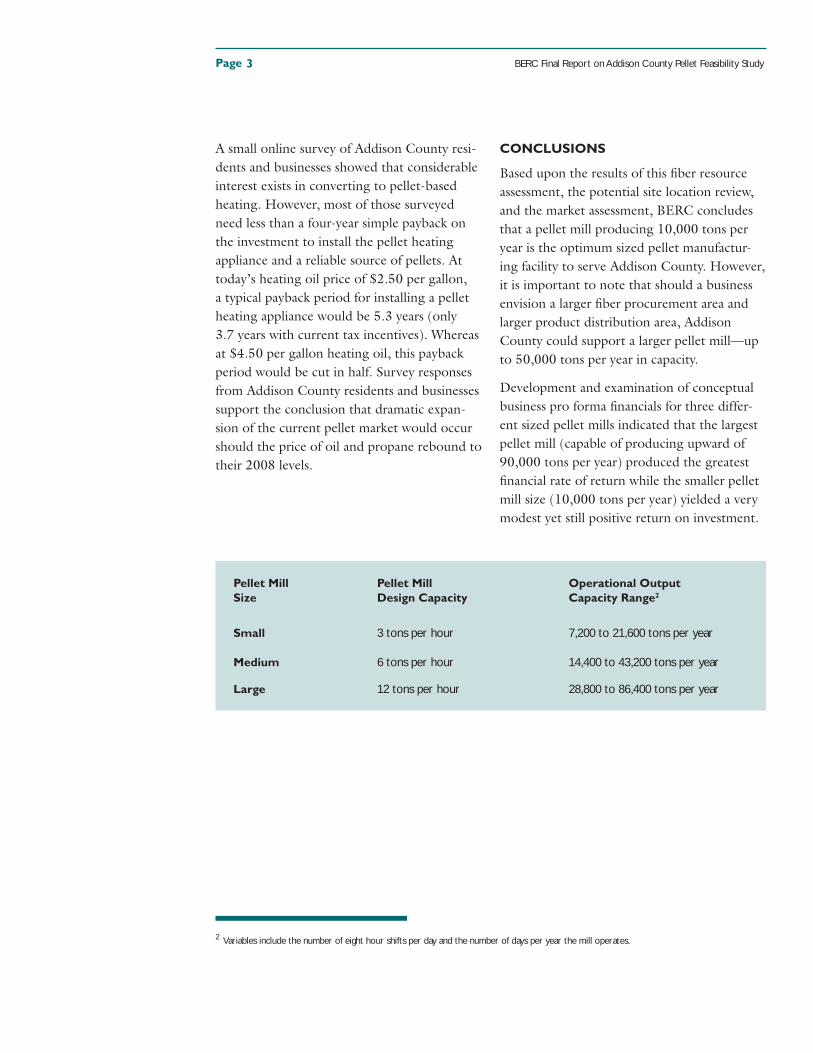
Pellet Mill Pellet Mill Operational Output
Size Design Capacity Capacity Range2
Small 3 tons per hour 7,200 to 21,600 tons per year
Medium 6 tons per hour 14,400 to 43,200 tons per year
Large 12 tons per hour 28,800 to 86,400 tons per year
2 Variables include the number of eight hour shifts per day and the number of days per year the mill operates.
BERC Final Report on Addison County Pellet Feasibility Study Page 4
1.1 PROJECT OVERVIEW
The Town of Bridport, Vermont and the Ad-
dison County Regional Planning Commission
(ACRPC) received a Vermont Community
Development Program Planning Grant from
the State of Vermont to assess the feasibility
of a solid bio-fuel production facility to be
located in and draw feedstock from Addison
County. They hired Biomass Energy Resource
Center (BERC) to do this assessment. The fol-
lowing report details the fi ndings of the study.
1.2 PROJECT PARTNERS
1.2.1 Addison County Regional Planning
Commission. ACRPC has 21 member com-
munities and assists these communities by pro-
viding a forum for towns to discuss and resolve
mutual concerns, providing assistance to towns
with the planning process and information
gathering, and developing a regional plan.
1.2.2 Biomass Energy Resource Center.
BERC is an independent, national nonprofi t
organization located in Montpelier, Vermont
with a Midwest offi ce in Madison, Wiscon-
sin. BERC assists communities, colleges and
universities, state and local governments, busi-
nesses, utilities, schools, and others in making
the most of their local energy resources.
BERC is a project-focused organization whose
mission is to achieve a healthier environment,
strengthen local economies, and increase en-
ergy security across the United States through
the development of sustainable biomass energy
systems at the community level. BERC’s par-
ticular focus is on the use of woody biomass
and other pelletizable biomass fuels.
1.0 Introduction
Page BERC Final Report on Addison County Pellet Feasibility Study
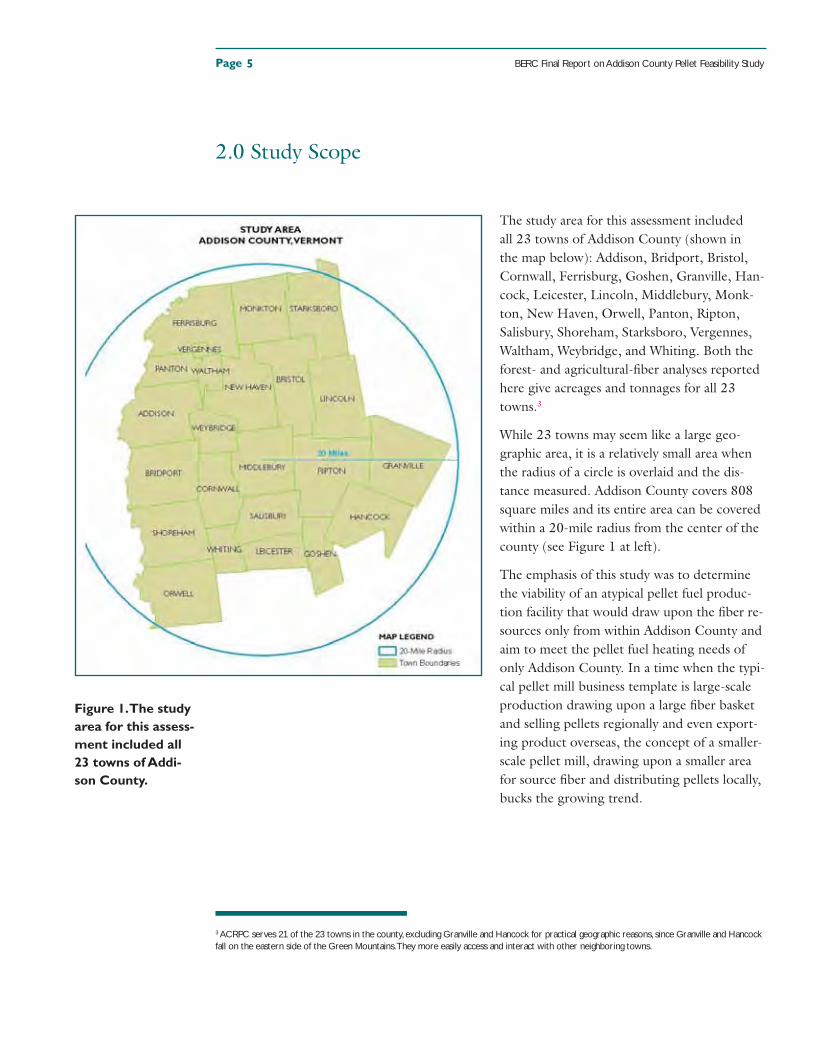
The study area for this assessment included
all 23 towns of Addison County (shown in
the map below): Addison, Bridport, Bristol,
Cornwall, Ferrisburg, Goshen, Granville, Han-
cock, Leicester, Lincoln, Middlebury, Monk-
ton, New Haven, Orwell, Panton, Ripton,
Salisbury, Shoreham, Starksboro, Vergennes,
Waltham, Weybridge, and Whiting. Both the
forest- and agricultural-fi ber analyses reported
here give acreages and tonnages for all 23
towns.3
While 23 towns may seem like a large geo-
graphic area, it is a relatively small area when
the radius of a circle is overlaid and the dis-
tance measured. Addison County covers 808
square miles and its entire area can be covered
within a 20-mile radius from the center of the
county (see Figure 1 at left).
The emphasis of this study was to determine
the viability of an atypical pellet fuel produc-
tion facility that would draw upon the fi ber re-
sources only from within Addison County and
aim to meet the pellet fuel heating needs of
only Addison County. In a time when the typi-
cal pellet mill business template is large-scale
production drawing upon a large fi ber basket
and selling pellets regionally and even export-
ing product overseas, the concept of a smaller-
scale pellet mill, drawing upon a smaller area
for source fi ber and distributing pellets locally,
bucks the growing trend.
5
2.0 Study Scope
Figure 1. The study
area for this assess-
ment included all
23 towns of Addi-
son County.
3 ACRPC serves 21 of the 23 towns in the county, excluding Granville and Hancock for practical geographic reasons, since Granville and Hancock fall on the eastern side of the Green Mountains. They more easily access and interact with other neighboring towns.
BERC Final Report on Addison County Pellet Feasibility Study Page 6
BERC conducted a county-wide assessment to
quantify, at the town level, the available and
potential bio-fi bers that could be used as pellet
feedstocks for this pellet mill. The study in-
cluded both wood fi bers and the potential for
agricultural fi bers. Average pricing and poten-
tial impacts on pricing were also considered.
Other waste materials were not quantifi ed
due to the uncertainty of their performance
as marketable pellet fuel. The study included
market surveys and analysis of census data to
determine the size of the potential market for
pellet fuel within Addison County.
The best sites were identifi ed within the coun-
ty for a solid bio-fuel production facility to be
located in and draw feedstock from within the
county. Pro forma fi nancials were developed
and assessed for three different sized pellet
mills based on pellet mill capital costs, produc-
tion costs, and market projections.
From the fi ber assessments, the site review,
the market assessment, and the review of the
pro forma fi nancials for three different sizes
of pellet mill, conclusions were drawn on the
optimally sized facility suitable for Addison
County.
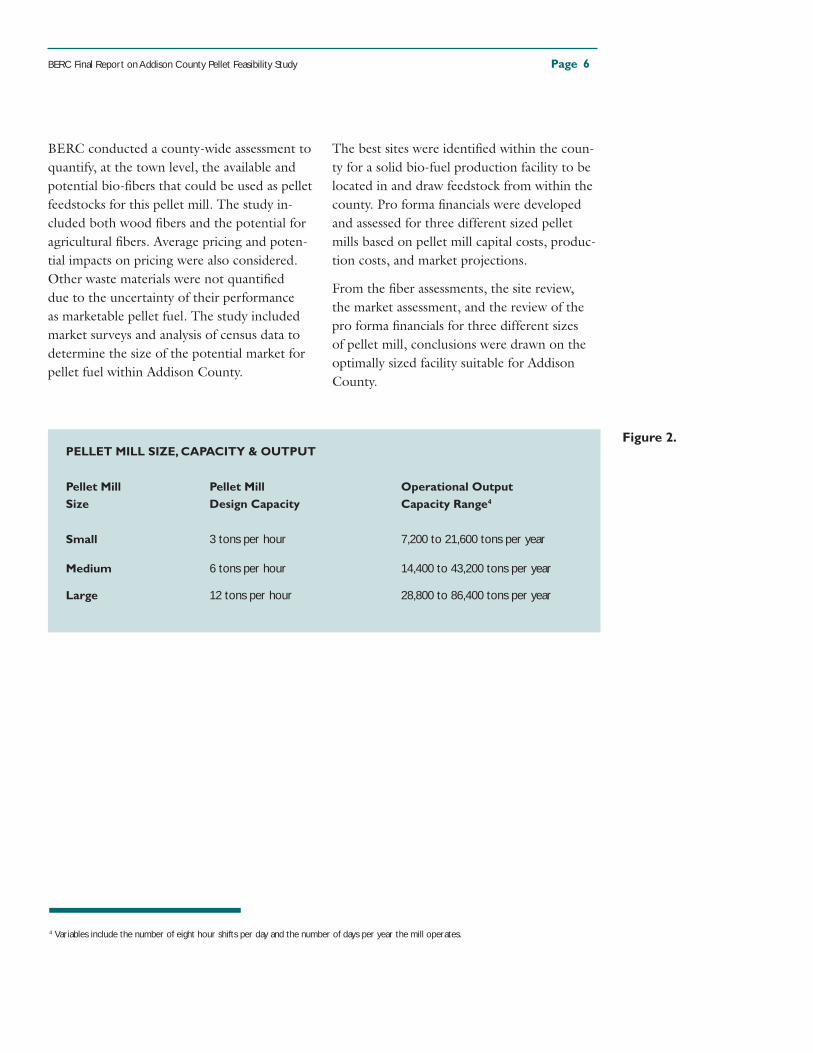
PELLET MILL SIZE, CAPACITY & OUTPUT
Pellet Mill Pellet Mill Operational Output
Size Design Capacity Capacity Range4
Small 3 tons per hour 7,200 to 21,600 tons per year
Medium 6 tons per hour 14,400 to 43,200 tons per year
Large 12 tons per hour 28,800 to 86,400 tons per year
4 Variables include the number of eight hour shifts per day and the number of days per year the mill operates.
Figure 2.
Page BERC Final Report on Addison County Pellet Feasibility Study7
The project methods are outlined in summary
below. Full descriptions of methods used are
provided in detail within the respective sec-
tions of this report.
1. FIBER ASSESSMENT
a. Wood fi ber assessment. Best available
data on forestland area, forestland owner-
ship, forest inventory, forest growth, and
harvesting were assembled and entered into
a custom model designed to calculate the
amount of surplus wood fi ber at the town
level.
b. Agricultural fi ber assessment. Best
available data on agricultural land area,
agricultural land use classifi cation, and
dedicated energy crop yield were assembled
and entered into a custom model to exam-
ine the dedicated energy crop yield capacity
in Addison County at the town level.
2. IDENTIFICATION OF POTENTIAL
SITES FOR A PELLET MANUFACTUR-
ING FACILITY
a. Digitized town zoning maps were assembled and standardized to identify industrial zoned sites of fi ve acres or larger. Preliminary sites identifi ed were
further assessed to determine viability based
on location, truck and electric access, access
to rail, distance to nearest neighbors, and
compatibility with existing and/or historic
site use.
3. MARKET STUDY
a. Quantifi cation of the existing and potential residential market for pellet fuel. Data were assembled and reviewed.
Scenarios of possible market expansion
were explored based on fossil fuel heating
prices and simple payback on installing pel-
let heating equipment. Residential survey
responses were used to supplement the data
gathered.
b. Quantifi cation of the existing and potential commercial market for pellet fuel. Data were assembled and reviewed.
Scenarios of possible market expansion
were explored based on fossil fuel heating
prices and simple payback on installing pel-
let heating equipment. Commercial survey
responses were used to supplement the data
gathered.
4. DEVELOPMENT AND ASSESSMENT
OF PRO FORMA FINANCIALS FOR
VARIOUS SIZES OF PELLET MILLS
a. Projected capital costs, year one cash fl ow, and 10-year pro forma fi nancials were developed for three different sizes of pellet mill using information from pel-
let industry experts, published reports, and
pellet mill owners and operators.
3.0 Methods
BERC Final Report on Addison County Pellet Feasibility Study Page 8
4.1 PELLET OVERVIEW
To introduce the framework for this study, a
general discussion of pellet fuel is given in this
section of the report, including the fuel’s char-
acteristics, specifi cations, and the advantages to
using pelletized biomass fuels.
4.1.1 Description of Pellet Fuel. Fuel pellets
can be made from a wide variety of biomass
materials. Pellets are usually manufactured
out of by-product wood fi bers from the forest
products industry, such as sawdust and shav-
ings, which are dried and extruded through
pellet dies under high heat and pressure.
Pellets can also be made using woodchips
and/or non-woody plant material. Nation-
ally, and even in Vermont where forests cover
78 percent of the land area, there is growing
interest in the development of biomass fuel
pellets made from agricultural feedstocks such
as crops like grass or residues like corn sto-
ver or oat hulls. The recommended biomass
feedstock depends on the cost of the fuel, the
size of the facility, its heat load, boiler type and
size, and other factors.
Wood and agricultural biomass is generally
processed or densifi ed into pellets, cubes, or
briquettes. While sometimes small amounts of
binders or lubricants are added to the mate-
rial, pellets can be made without the use of any
additives. Natural plant lignin in the pelletized
material is melted by the friction heat created
as material is extruded through the pellet die,
creating a durable casing that holds the pellets
together without glues or additives.
4.0 Introduction to Pellets
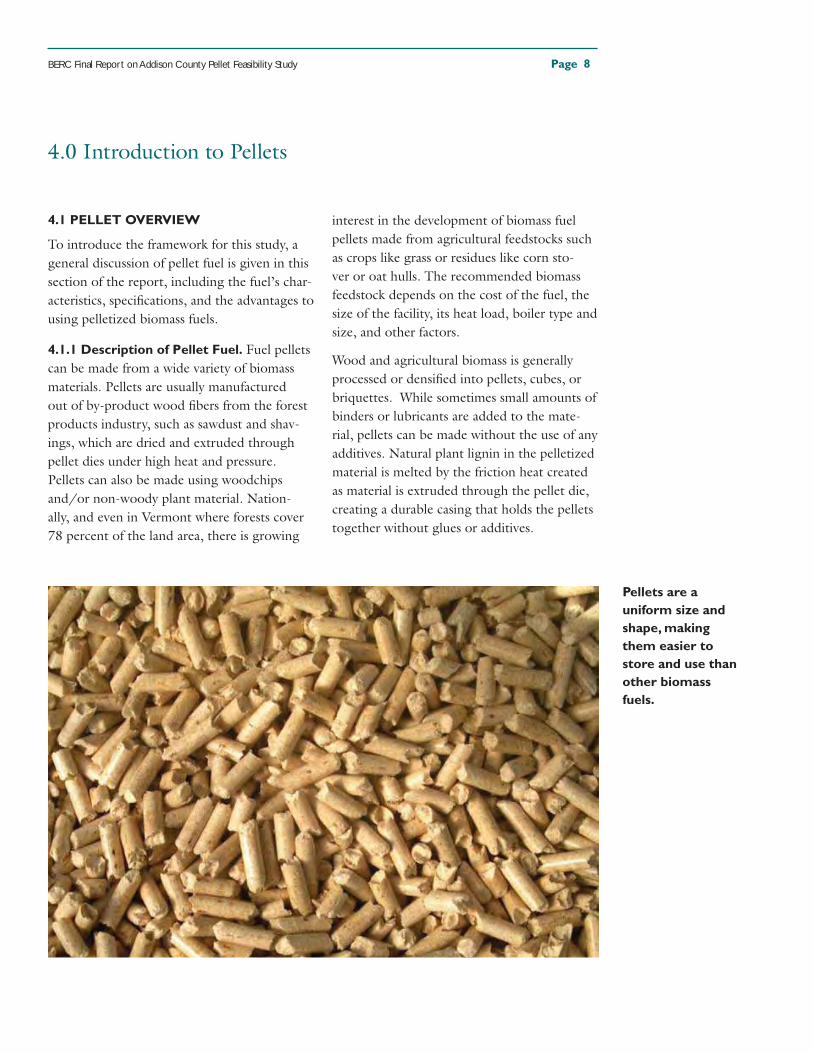
Pellets are a
uniform size and
shape, making
them easier to
store and use than
other biomass
fuels.
Page BERC Final Report on Addison County Pellet Feasibility Study9
4.1.2 Advantages to Heating with Pellets.
Biomass fuels such as pellets help to mitigate
environmental issues like acid rain and global
climate change. Perhaps the greatest advan-
tage to biomass fuels, however, is they cost on
average 25-50 percent less than traditional fos-
sil heating fuels and are more stable in pricing.
Also, any future carbon or energy taxes are
less likely to increase the cost of biomass fuels
and are more likely to raise the cost of heating
with fossil fuels. Pellets are a locally-available
and cost-effective biomass heating fuel, with
several advantages over other types of biomass
fuels. Pellets are a condensed form of biomass
energy available in a uniformly sized package,
which makes them easier to store and use than
some other biomass fuels. The technology is
also quite simple, minimizing operation and
maintenance requirements. In addition,
pellets:
• have a high energy content by volume and
can be bulk stored in less space than other
biomass fuels;
• are a clean-burning renewable fuel source
and the technology is highly effi cient com-
pared to other biomass fuels;
• are price stable compared to fossil fuels.
4.1.3 Pellet Fuel Markets. Wood pellets
are manufactured in the US and Canada and
are available for residential use in 40-pound
bags which can be bought in hardware or
feed stores, nurseries, or other supply stores.
Increasingly, heating with pellets is becom-
ing common on larger scales—in municipal or
federal buildings, educational facilities, hous-
ing complexes, offi ce buildings, and other
businesses.
While the majority of installations in this size
range are in Europe, a growing number are in
North America, including New England. The
greater heating requirements of these build-
ings differ from those of residential settings,
thus requiring different technology (boilers
rather than stoves) and fuel supply infrastruc-
ture (bulk wood pellet supply as opposed to
bags).
When heating oil prices began their rapid rise
in 2006 there was a resulting surge of mar-
ket growth in the northeastern US, where
oil heating is very prevalent, for both pellet
heating appliances (mostly stoves) and for the
pellet fuel itself. For the past two years there
have been reports of long waiting periods for
shipment of pellet stoves and shortages of
pellet fuel. Today, only a small portion of the
pellets burned in Vermont come from within
New England. Signifi cant volumes of pellets
are imported into the region from the Rocky
Mountain Region, British Columbia, and
Quebec.
4.1.4 The Importance of Local and
Sustainable Biomass Fuel. The benefi ts to
heating with biomass fuels described above
are best achieved when the feedstock is
sourced locally and sustainably. In response
to increased pellet fuel heating and increased
demand for pellet fuel in Vermont, several
pellet mills have been proposed in the state.
By producing pellets in Addison County from
locally- and sustainably-procured forest and
agricultural feedstocks, greater energy security
and self-suffi ciency can be achieved.
BERC Final Report on Addison County Pellet Feasibility Study Page 10
4.2 PELLET QUALITY
Pellet fuel quality can range widely depend-
ing on the source materials and manufactur-
ing process control. There are many different
species and sources of feedstock and many
ways in which the material can be harvested,
processed, loaded, transported, and received,
all of which can impact the overall quality of
the pellet and thereby the successful operation
of the pellet heating system. The performance
of pellet heating systems is optimized by using
a high-quality fuel designed for the heating
equipment.
4.2.1 Pellet Fuel Specifi cations. Pellets
provide clean, consistent, and uniformly-sized
fuel. Ensuring that pellet fuel is up to certain
standards means fewer mechanical jams, less
ash produced (and therefore less time spent on
removing ash), and longer periods of mainte-
nance-free burn time. The Pellet Fuels Institute
(PFI) is a national organization that promotes
the use of pellet fuels and has established stan-
dards governing the quality of pellet fuels sold
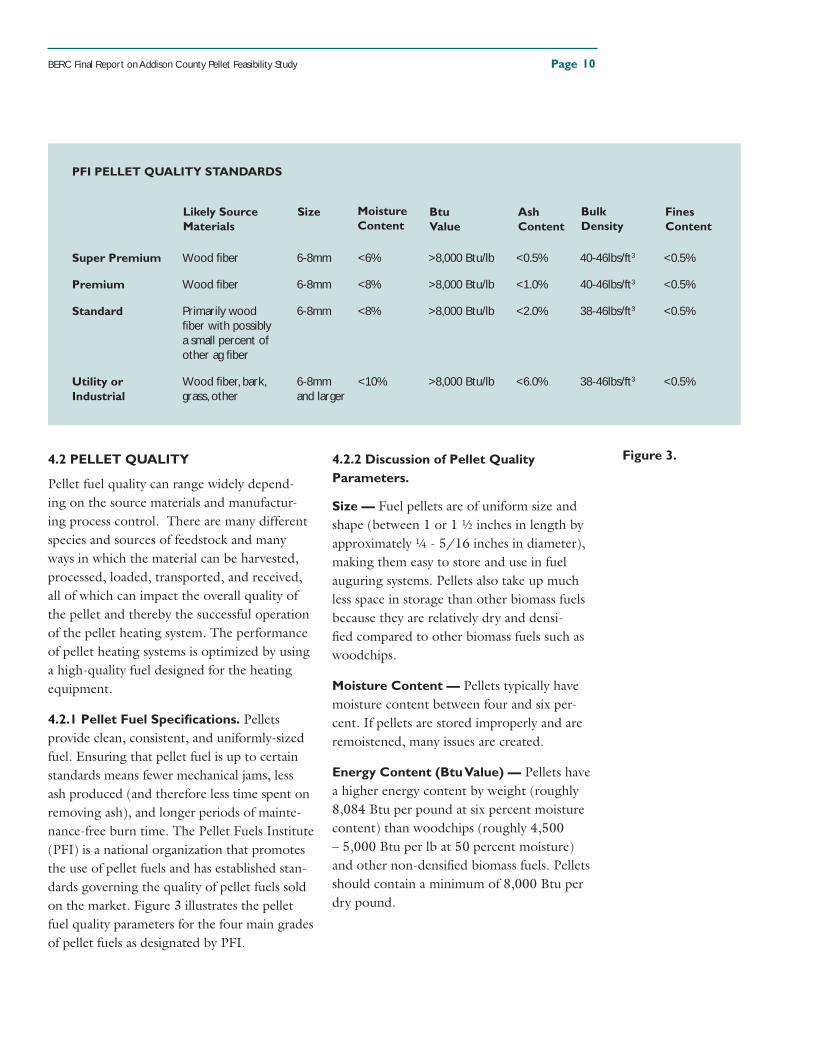
on the market. Figure 3 illustrates the pellet
fuel quality parameters for the four main grades
of pellet fuels as designated by PFI.
4.2.2 Discussion of Pellet Quality
Parameters.
Size — Fuel pellets are of uniform size and
shape (between 1 or 1 ½ inches in length by
approximately ¼ - 5/16 inches in diameter),
making them easy to store and use in fuel
auguring systems. Pellets also take up much
less space in storage than other biomass fuels
because they are relatively dry and densi-
fi ed compared to other biomass fuels such as
woodchips.
Moisture Content — Pellets typically have
moisture content between four and six per-
cent. If pellets are stored improperly and are
remoistened, many issues are created.
Energy Content (Btu Value) — Pellets have
a higher energy content by weight (roughly
8,084 Btu per pound at six percent moisture
content) than woodchips (roughly 4,500
– 5,000 Btu per lb at 50 percent moisture)
and other non-densifi ed biomass fuels. Pellets
should contain a minimum of 8,000 Btu per
dry pound.
PFI PELLET QUALITY STANDARDS
Super Premium Wood fi ber 6-8mm <6% >8,000 Btu/lb <0.5% 40-46lbs/ft3 <0.5%
Premium Wood fi ber 6-8mm <8% >8,000 Btu/lb <1.0% 40-46lbs/ft3 <0.5%
Standard Primarily wood 6-8mm <8% >8,000 Btu/lb <2.0% 38-46lbs/ft3 <0.5% fi ber with possibly a small percent of other ag fi ber
Utility or Wood fi ber, bark, 6-8mm <10% >8,000 Btu/lb <6.0% 38-46lbs/ft3 <0.5%Industrial grass, other and larger
Figure 3.
Fines Content
Likely Source Materials
Size Moisture Content
Btu Value
Ash Content
Bulk Density
Page BERC Final Report on Addison County Pellet Feasibility Study11
Ash content and mineral composition —
Ash content is perhaps the greatest distinguish-
ing parameter among the four grades of pellet
fuels. Super Premium pellets have less than
0.5 percent ash content; Premium pellets, less
than one percent; Standard pellets, between
one and two percent; and Utility or Industrial
pellets have two to six percent. The amount
and composition of minerals in the fuel will
determine the amount of ash produced and
to what extent these minerals will fuse or melt
together, forming clinkers during combustion
at standard combustion temperatures.5
Density — Pellets have consistent hardness and
energy content (minimum 40 pounds/cubic
foot for Premium or Super Premium). Density
is a key factor in pellet fuel quality. Less dense
pellets will burn less effi ciently and deliver less
heat. Less dense pellets are also less durable and
often degrade into fi nes prematurely.
Fines — There is commonly a small amount
of fi nes or dust from pellet breakdown due to
wear and tear in handling and shipping. Exces-
sive fi nes content can cause material bridging
in the fuel hopper; minimizing the amount
of fi nes content avoids fairly serious problems
with the fuel feeding systems. The amount
of fi ne dust passing through 1/8-inch screen
should be no more than 0.5 percent by weight.
Chlorides — There should be limited salt
content (no more than 300 parts per million)
in pellets. When pellets are burned, chloride
gases are extremely corrosive to metal and
excessive levels can cause signifi cant damage to
heat exchange and exhaust venting systems.
4.3 RECOMMENDED PELLET QUALITY
FOR A PELLET BUSINESS IN ADDISON
COUNTY
In order to increase pellet fuel use within the
residential and commercial markets, pellet fuel
producers must strive to manufacture high
quality pellets that can be burned easily and re-
liably in pellet heating appliances on the mar-
ket today. Without the convenience of burning
high-quality, reliable pellet fuel, fewer hom-
eowners and business owners will likely switch
from burning no-hassle liquid fossil fuels.
Super Premium and Premium grade pellets are
suitable for almost any pellet stove appliance.
Premium and, to a certain extent, Standard
pellets are suitable for most pellet boilers with
automatic ash removal systems. Industrial
grade pellets, or those with the increased risk
of clinker (fused ash) formation are suitable for
use in very large industrial boilers designed to
handle such high ash content fuels.
For the purpose of this report, it is assumed
that Super Premium, Premium, and perhaps
Standard grade pellets are the target products
for Addison County. Industrial grade pellets
could be produced, but would have a limited
market, particularly since woodchips fi ll the
industrial grade biomass heating fuel niche
at roughly half the cost per Btu compared to
pellets.
5 http://www.pelletheat.org/3/industry/index.html.
BERC Final Report on Addison County Pellet Feasibility Study Page
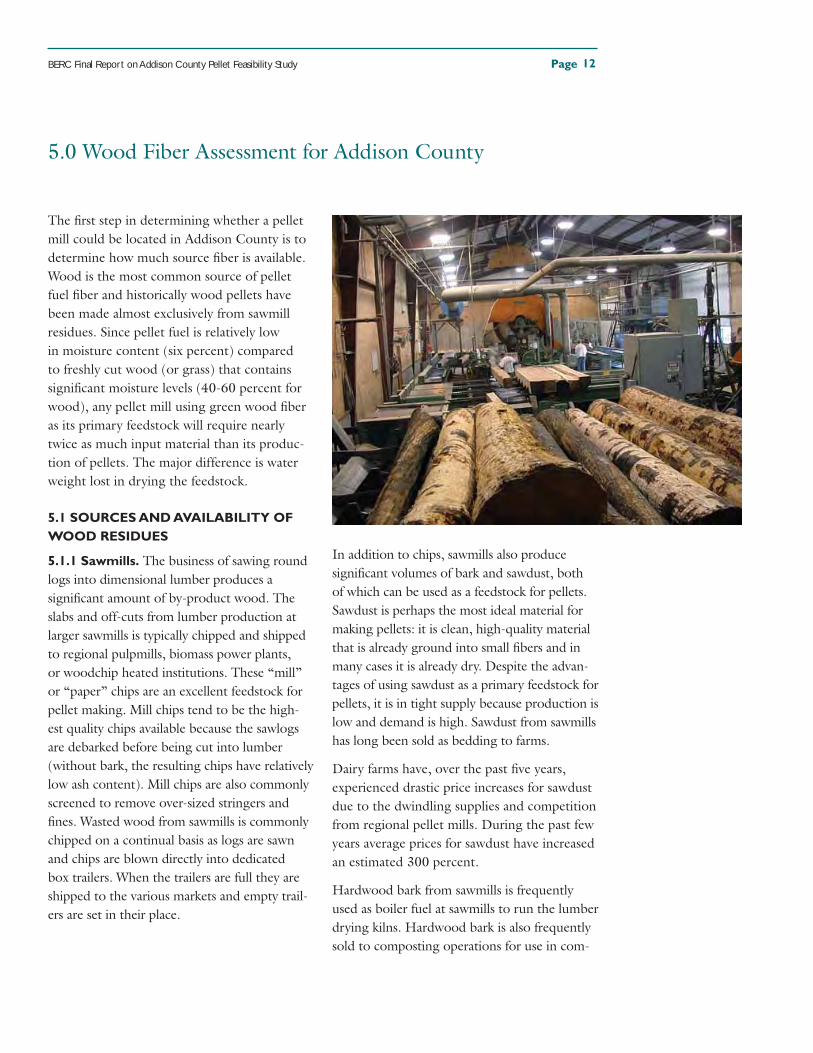
The fi rst step in determining whether a pellet
mill could be located in Addison County is to
determine how much source fi ber is available.
Wood is the most common source of pellet
fuel fi ber and historically wood pellets have
been made almost exclusively from sawmill
residues. Since pellet fuel is relatively low
in moisture content (six percent) compared
to freshly cut wood (or grass) that contains
signifi cant moisture levels (40-60 percent for
wood), any pellet mill using green wood fi ber
as its primary feedstock will require nearly
twice as much input material than its produc-
tion of pellets. The major difference is water
weight lost in drying the feedstock.
5.1 SOURCES AND AVAILABILITY OF
WOOD RESIDUES
5.1.1 Sawmills. The business of sawing round
logs into dimensional lumber produces a
signifi cant amount of by-product wood. The
slabs and off-cuts from lumber production at
larger sawmills is typically chipped and shipped
to regional pulpmills, biomass power plants,
or woodchip heated institutions. These “mill”
or “paper” chips are an excellent feedstock for
pellet making. Mill chips tend to be the high-
est quality chips available because the sawlogs
are debarked before being cut into lumber
(without bark, the resulting chips have relatively
low ash content). Mill chips are also commonly
screened to remove over-sized stringers and
fi nes. Wasted wood from sawmills is commonly
chipped on a continual basis as logs are sawn
and chips are blown directly into dedicated
box trailers. When the trailers are full they are
shipped to the various markets and empty trail-
ers are set in their place.
In addition to chips, sawmills also produce
signifi cant volumes of bark and sawdust, both
of which can be used as a feedstock for pellets.
Sawdust is perhaps the most ideal material for
making pellets: it is clean, high-quality material
that is already ground into small fi bers and in
many cases it is already dry. Despite the advan-
tages of using sawdust as a primary feedstock for
pellets, it is in tight supply because production is
low and demand is high. Sawdust from sawmills
has long been sold as bedding to farms.
Dairy farms have, over the past fi ve years,
experienced drastic price increases for sawdust
due to the dwindling supplies and competition
from regional pellet mills. During the past few
years average prices for sawdust have increased
an estimated 300 percent.
Hardwood bark from sawmills is frequently
used as boiler fuel at sawmills to run the lumber
drying kilns. Hardwood bark is also frequently
sold to composting operations for use in com-
12
5.0 Wood Fiber Assessment for Addison County
Page BERC Final Report on Addison County Pellet Feasibility Study13
post and top-soil production. Softwood bark is
most commonly sold to the horticultural mar-
kets as a mulch product. The value of softwood
bark as mulch far exceeds its value as a fuel.
It is extremely important to note that in the
past several years the regional production of by-
products such as chips, bark, and sawdust has
declined for two main reasons: (1) increased
sawmill effi ciencies (producing more lumber
and less waste) and (2) declining sawmill activ-
ity due to softening lumber markets. At the
same time, demand for sawmill by-products
has grown dramatically: Biomass power plants,
wood heating systems, and regional pellet mills
have increased the demand for these materials.
There are two large sawmills in Addison
County: A Johnson and Lathrup’s Maple Sup-
ply, both in Bristol, Vermont. There are several
other smaller sawmills in the county producing
well under one million board feet (MBF) per
year. There are also several portable sawmills in
operation, but these mills process relatively small
volumes and thereby generate minimal volumes
of residues. When assessing residue availability,
larger sawmills should be targeted because they
generate suffi cient volumes and because the
infrastructure to collect, load, and transport the
material is already in place at the mill.
Again, it is important to note that nearly all
the material generated from these sawmills has
existing markets and any use of these materi-
als for pellet making would divert this material
from another market that may be very depen-
dent on its supply (i.e. farmers using sawdust
for bedding).
5.1.2 Wood Products Manufacturing. There
are several wood products manufacturing busi-
nesses in Addison County that generate waste
wood scraps and sawdust from manufacturing
raw lumber into value-added products such as
fl ooring, furniture, and cabinets.
Many of the businesses that manufacture wood
products and generate wood scraps and saw-
dust produce very small volumes. Most either
burn their scrap wood onsite for space heating
or bag and sell it as kindling. Any signifi cant
volumes of sawdust are sold to local farms.
5.1.3 Clean Community Wood Wastes.
Addison County Solid Waste District (AC-
SWD) diverts approximately 800 tons of clean
community wood waste each year from their
facility. This material includes tree trimmings
less than six inches in diameter, discarded
Christmas trees, wooden pallets, tree stumps,
etc. This material is collected at the transfer
station, periodically ground into mulch chips,
and currently given away as mulch to area
residents.6
While ACSWD’s wood waste is relatively
clean, only a small amount is available since
a large percentage of the waste wood in rural
areas like Addison County is pile-burned or
dragged into the woods to slowly decompose.
Also, in general, community wood waste is
a poor feedstock for making pellets. The ash
content is high and the risk for contamination
from painted or treated wood is too great.
Community wood waste is not a recommend-
ed feedstock for pellet making.
6 Addison County Solid Waste District 2007 Annual Report.
BERC Final Report on Addison County Pellet Feasibility Study Page 14
5.1.4 Conclusions on the Availability of
Wood Residues. Addison County does not
have a signifi cant wood residue resource.
Community wood waste is not recommended
for pellet manufacturing. While mill residues
and waste from wood products manufacturing
could be available, there are typically already
established markets for this material. Increased
demand will escalate prices, potentially hurting
other parts of Addison County’s economy. In
addition, mill residues have declined in avail-
ability and may continue to do so. Building a
pellet manufacturing business that is depen-
dent on this material is not recommended.
5.2 LOW-GRADE WOOD HARVEST
POTENTIAL
With extremely limited availability of wood
residues within Addison County, harvested
wood will likely account for nearly all wood fi -
ber sourced by a pellet mill. While higher-qual-
ity timber products such as veneer and sawlogs
are commercially harvested routinely as part of
forest management, low-grade wood has often
been left behind in the absence of a reliable
market. Reliable local markets for low-grade
wood can create economic incentive to remove
low-grade trees to help enhance the growth of
the higher-quality trees for future harvest.
Estimates were made of the amount of low-
grade wood that is accessible and available on
an annual basis for making pellets. In an effort
to quantify the low-grade wood that could be
harvested for a pellet mill, a thorough review
was conducted of forestland area, ownership,
inventory, growth, and removals.
In order to quantify the potential wood re-
source in Addison County, BERC identifi ed
the footprint of actively managed forestland
that would be accessible for harvesting and
estimated the annual growth of low-grade
wood that could be harvested sustainably from
that footprint. By accounting for existing rates
of harvest in the county for fi rewood, biomass,
and pulp, BERC estimated the net amount
of low-grade wood that would be available
annually in Addison County (on a sustainable
basis). The process is outlined below.
1. Gather and review data on wood residue
generation.
2. Identify the total forested footprint in Ad-
dison County at the town level.
3. Perform spatial analysis to fi lter out inacces-
sible forestland and ecologically sensitive
areas where forest management requiring
periodic harvesting would be inappropriate.
This was done sequentially so that areas
were not double-counted if they fell within
more than one category of inaccessibility.
4. Model annual growth of low-grade wood at
the town level in Addison County using US
Forest Service inventory data on forestland
area ownership, forest inventory and com-
position, and forest growth.
5. Determine existing demand for wood (us-
ing State data on harvesting) and the net
availability of low-grade wood from Ad-
dison County for potential use in pellet fuel
manufacturing.
6. Examine harvesting and transportation costs
and market pricing for low-grade wood to
estimate wood fi ber prices.
Page BERC Final Report on Addison County Pellet Feasibility Study15
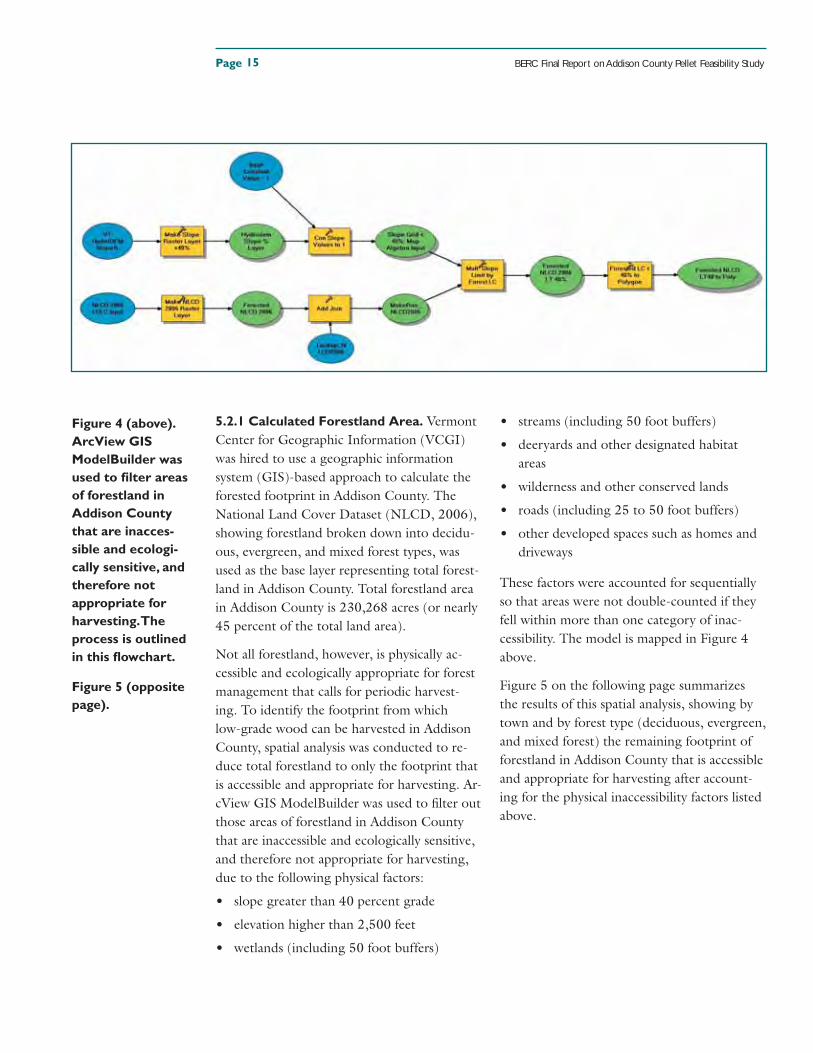
5.2.1 Calculated Forestland Area. Vermont
Center for Geographic Information (VCGI)
was hired to use a geographic information
system (GIS)-based approach to calculate the
forested footprint in Addison County. The
National Land Cover Dataset (NLCD, 2006),
showing forestland broken down into decidu-
ous, evergreen, and mixed forest types, was
used as the base layer representing total forest-
land in Addison County. Total forestland area
in Addison County is 230,268 acres (or nearly
45 percent of the total land area).
Not all forestland, however, is physically ac-
cessible and ecologically appropriate for forest
management that calls for periodic harvest-
ing. To identify the footprint from which
low-grade wood can be harvested in Addison
County, spatial analysis was conducted to re-
duce total forestland to only the footprint that
is accessible and appropriate for harvesting. Ar-
cView GIS ModelBuilder was used to fi lter out
those areas of forestland in Addison County
that are inaccessible and ecologically sensitive,
and therefore not appropriate for harvesting,
due to the following physical factors:
• slope greater than 40 percent grade
• elevation higher than 2,500 feet
• wetlands (including 50 foot buffers)
• streams (including 50 foot buffers)
• deeryards and other designated habitat
areas
• wilderness and other conserved lands
• roads (including 25 to 50 foot buffers)
• other developed spaces such as homes and
driveways
These factors were accounted for sequentially
so that areas were not double-counted if they
fell within more than one category of inac-
cessibility. The model is mapped in Figure 4
above.
Figure 5 on the following page summarizes
the results of this spatial analysis, showing by
town and by forest type (deciduous, evergreen,
and mixed forest) the remaining footprint of
forestland in Addison County that is accessible
and appropriate for harvesting after account-
ing for the physical inaccessibility factors listed
above.
Figure 4 (above).
ArcView GIS
ModelBuilder was
used to fi lter areas
of forestland in
Addison County
that are inacces-
sible and ecologi-
cally sensitive, and
therefore not
appropriate for
harvesting. The
process is outlined
in this fl owchart.
Figure 5 (opposite
page).
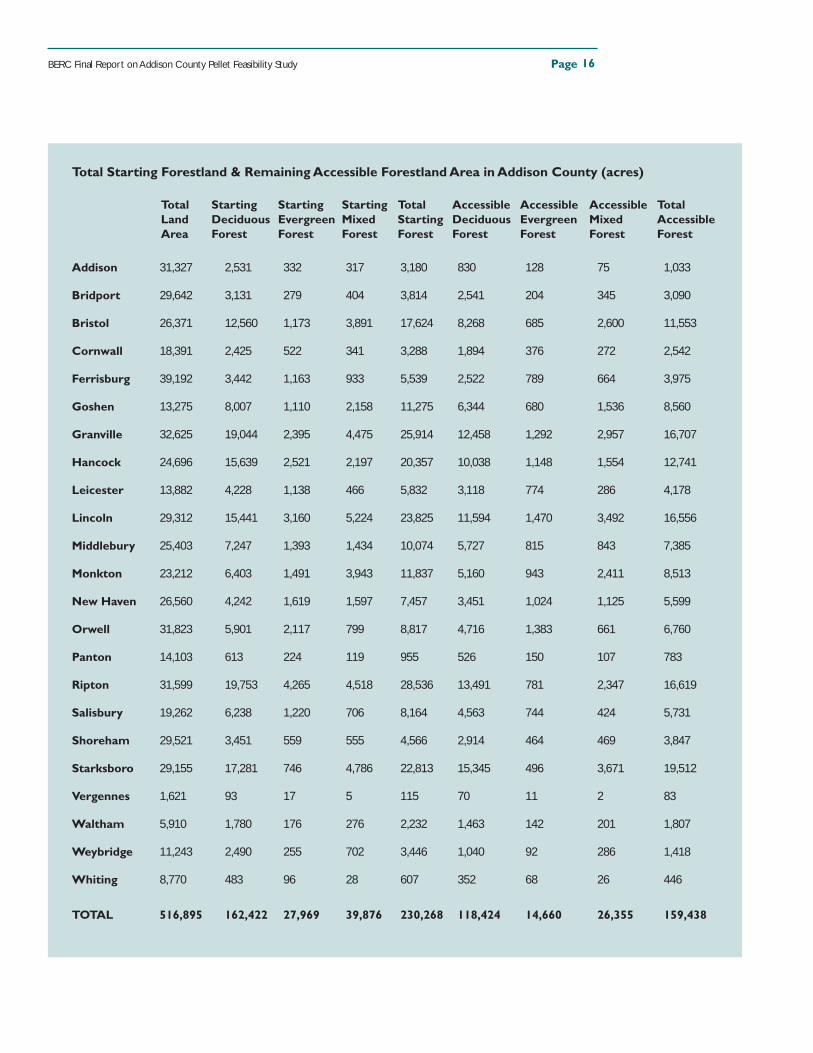
BERC Final Report on Addison County Pellet Feasibility Study Page 16
Total Starting Forestland & Remaining Accessible Forestland Area in Addison County (acres)
Addison 31,327 2,531 332 317 3,180 830 128 75 1,033
Bridport 29,642 3,131 279 404 3,814 2,541 204 345 3,090
Bristol 26,371 12,560 1,173 3,891 17,624 8,268 685 2,600 11,553
Cornwall 18,391 2,425 522 341 3,288 1,894 376 272 2,542
Ferrisburg 39,192 3,442 1,163 933 5,539 2,522 789 664 3,975
Goshen 13,275 8,007 1,110 2,158 11,275 6,344 680 1,536 8,560
Granville 32,625 19,044 2,395 4,475 25,914 12,458 1,292 2,957 16,707
Hancock 24,696 15,639 2,521 2,197 20,357 10,038 1,148 1,554 12,741
Leicester 13,882 4,228 1,138 466 5,832 3,118 774 286 4,178
Lincoln 29,312 15,441 3,160 5,224 23,825 11,594 1,470 3,492 16,556
Middlebury 25,403 7,247 1,393 1,434 10,074 5,727 815 843 7,385
Monkton 23,212 6,403 1,491 3,943 11,837 5,160 943 2,411 8,513
New Haven 26,560 4,242 1,619 1,597 7,457 3,451 1,024 1,125 5,599
Orwell 31,823 5,901 2,117 799 8,817 4,716 1,383 661 6,760
Panton 14,103 613 224 119 955 526 150 107 783
Ripton 31,599 19,753 4,265 4,518 28,536 13,491 781 2,347 16,619
Salisbury 19,262 6,238 1,220 706 8,164 4,563 744 424 5,731
Shoreham 29,521 3,451 559 555 4,566 2,914 464 469 3,847
Starksboro 29,155 17,281 746 4,786 22,813 15,345 496 3,671 19,512
Vergennes 1,621 93 17 5 115 70 11 2 83
Waltham 5,910 1,780 176 276 2,232 1,463 142 201 1,807
Weybridge 11,243 2,490 255 702 3,446 1,040 92 286 1,418
Whiting 8,770 483 96 28 607 352 68 26 446
TOTAL 516,895 162,422 27,969 39,876 230,268 118,424 14,660 26,355 159,438
Total
Accessible
Forest
Total
Land
Area
Starting
Deciduous
Forest
Starting
Evergreen
Forest
Starting
Mixed
Forest
Total
Starting
Forest
Accessible
Deciduous
Forest
Accessible
Evergreen
Forest
Accessible
Mixed
Forest
Page BERC Final Report on Addison County Pellet Feasibility Study
As shown in Figure 5 on the previous page,
out of the total forestland in Addison County,
159,438 acres (or nearly 70 percent) are found
to be accessible and appropriate for harvesting
low-grade wood. Results are shown by town
and, as can be seen in the table above, some
towns are more heavily forested, such as those
on the eastern side of the county like Bristol,
Goshen, Granville, Hancock, Lincoln, Ripton,
and Starksboro.
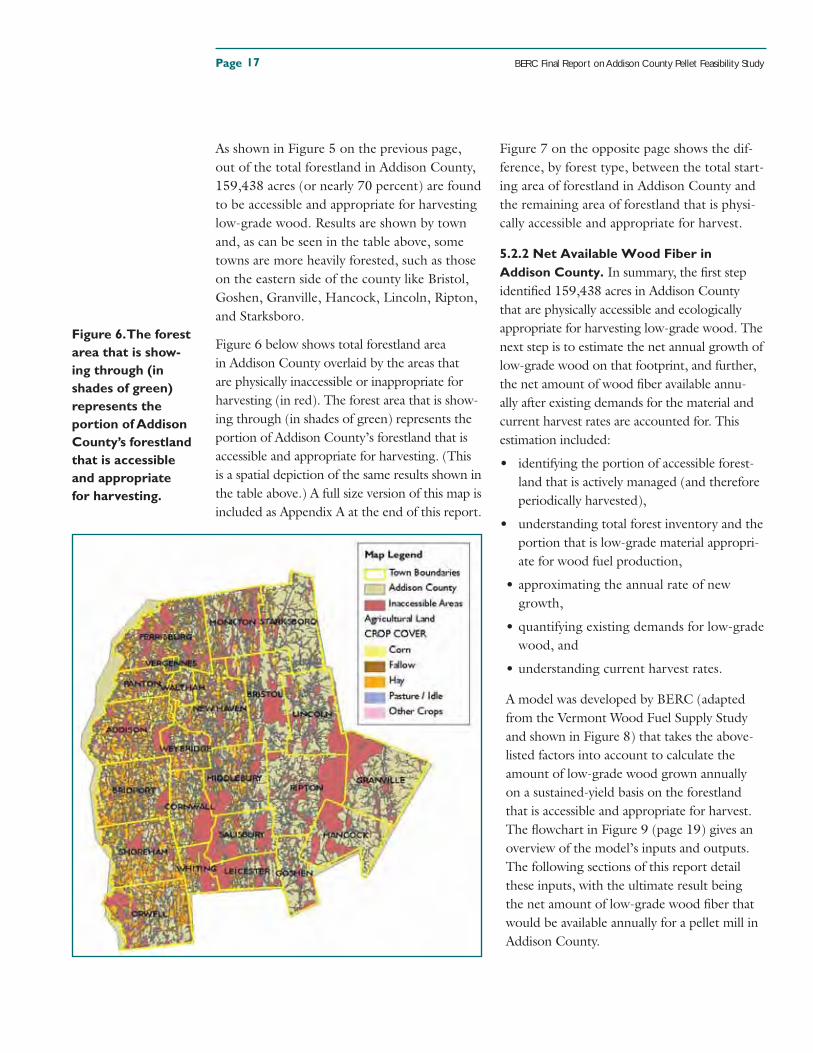
Figure 6 below shows total forestland area
in Addison County overlaid by the areas that
are physically inaccessible or inappropriate for
harvesting (in red). The forest area that is show-
ing through (in shades of green) represents the
portion of Addison County’s forestland that is
accessible and appropriate for harvesting. (This
is a spatial depiction of the same results shown in
the table above.) A full size version of this map is
included as Appendix A at the end of this report.
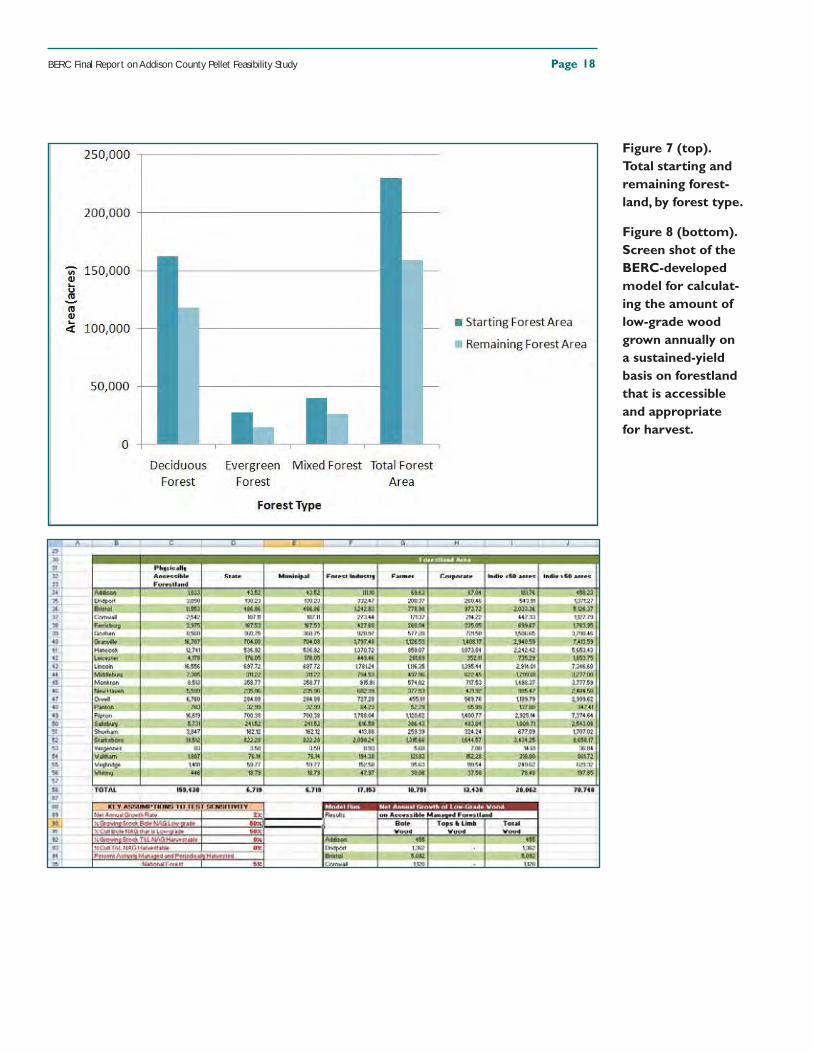
Figure 7 on the opposite page shows the dif-
ference, by forest type, between the total start-
ing area of forestland in Addison County and
the remaining area of forestland that is physi-
cally accessible and appropriate for harvest.
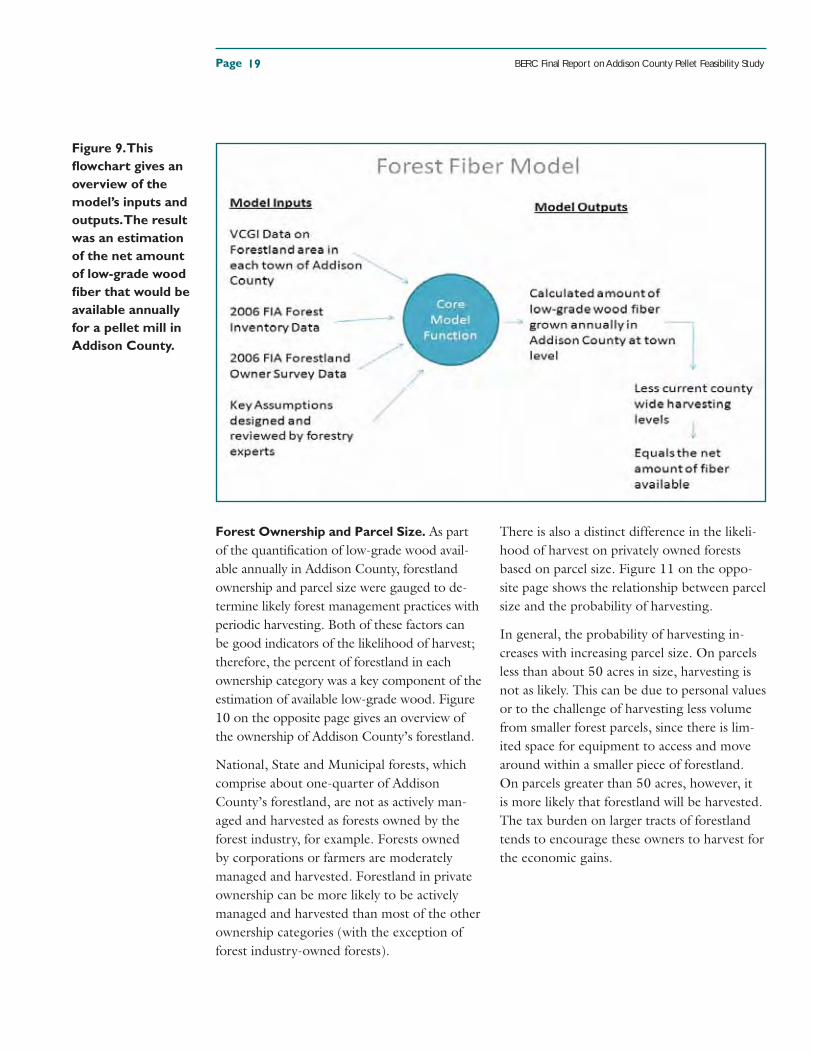
5.2.2 Net Available Wood Fiber in
Addison County. In summary, the fi rst step
identifi ed 159,438 acres in Addison County
that are physically accessible and ecologically
appropriate for harvesting low-grade wood. The
next step is to estimate the net annual growth of
low-grade wood on that footprint, and further,
the net amount of wood fi ber available annu-
ally after existing demands for the material and
current harvest rates are accounted for. This
estimation included:
• identifying the portion of accessible forest-
land that is actively managed (and therefore
periodically harvested),
• understanding total forest inventory and the
portion that is low-grade material appropri-
ate for wood fuel production,
• approximating the annual rate of new
growth,
• quantifying existing demands for low-grade
wood, and
• understanding current harvest rates.
A model was developed by BERC (adapted
from the Vermont Wood Fuel Supply Study
and shown in Figure 8) that takes the above-
listed factors into account to calculate the
amount of low-grade wood grown annually
on a sustained-yield basis on the forestland
that is accessible and appropriate for harvest.
The fl owchart in Figure 9 (page 19) gives an
overview of the model’s inputs and outputs.
The following sections of this report detail
these inputs, with the ultimate result being
the net amount of low-grade wood fi ber that
would be available annually for a pellet mill in
Addison County.
17
Figure 6. The forest
area that is show-
ing through (in
shades of green)
represents the
portion of Addison
County’s forestland
that is accessible
and appropriate
for harvesting.
BERC Final Report on Addison County Pellet Feasibility Study Page 18
Figure 7 (top).
Total starting and
remaining forest-
land, by forest type.
Figure 8 (bottom).
Screen shot of the
BERC-developed
model for calculat-
ing the amount of
low-grade wood
grown annually on
a sustained-yield
basis on forestland
that is accessible
and appropriate
for harvest.
Page BERC Final Report on Addison County Pellet Feasibility Study
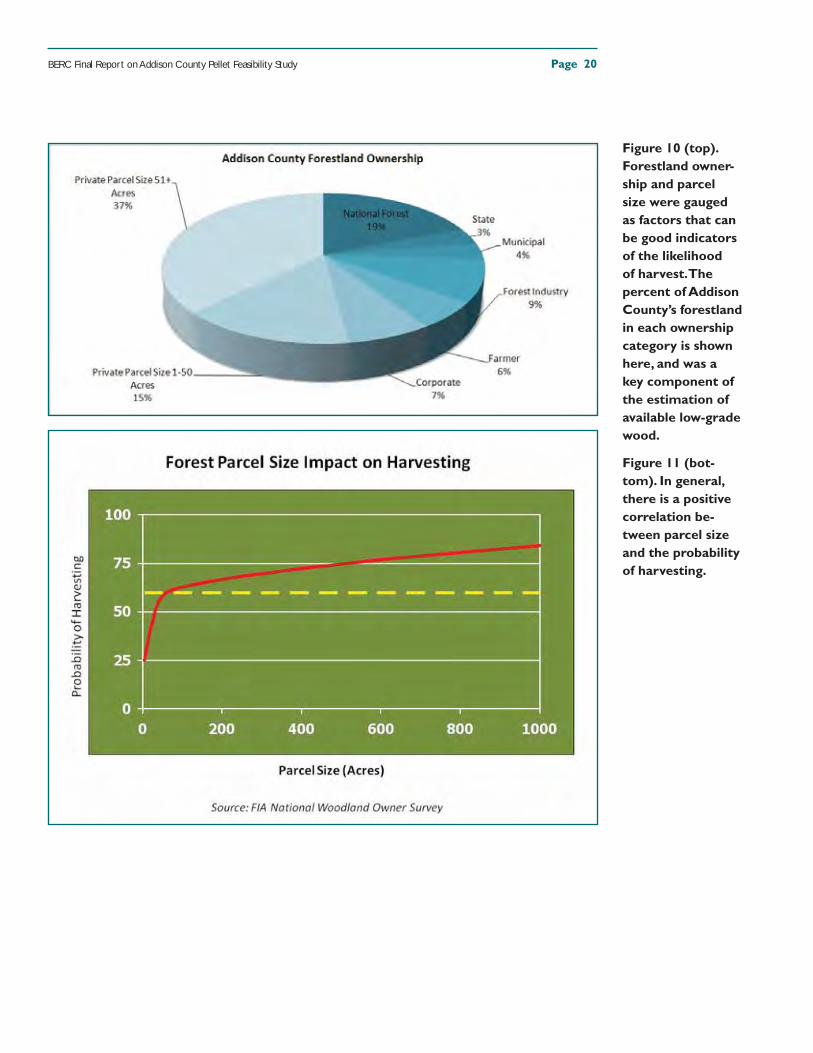
Forest Ownership and Parcel Size. As part
of the quantifi cation of low-grade wood avail-
able annually in Addison County, forestland
ownership and parcel size were gauged to de-
termine likely forest management practices with
periodic harvesting. Both of these factors can
be good indicators of the likelihood of harvest;
therefore, the percent of forestland in each
ownership category was a key component of the
estimation of available low-grade wood. Figure
10 on the opposite page gives an overview of
the ownership of Addison County’s forestland.
National, State and Municipal forests, which
comprise about one-quarter of Addison
County’s forestland, are not as actively man-
aged and harvested as forests owned by the
forest industry, for example. Forests owned
by corporations or farmers are moderately
managed and harvested. Forestland in private
ownership can be more likely to be actively
managed and harvested than most of the other
ownership categories (with the exception of
forest industry-owned forests).
There is also a distinct difference in the likeli-
hood of harvest on privately owned forests
based on parcel size. Figure 11 on the oppo-
site page shows the relationship between parcel
size and the probability of harvesting.
In general, the probability of harvesting in-
creases with increasing parcel size. On parcels
less than about 50 acres in size, harvesting is
not as likely. This can be due to personal values
or to the challenge of harvesting less volume
from smaller forest parcels, since there is lim-
ited space for equipment to access and move
around within a smaller piece of forestland.
On parcels greater than 50 acres, however, it
is more likely that forestland will be harvested.
The tax burden on larger tracts of forestland
tends to encourage these owners to harvest for
the economic gains.
Figure 9. This
fl owchart gives an
overview of the
model’s inputs and
outputs. The result
was an estimation
of the net amount
of low-grade wood
fi ber that would be
available annually
for a pellet mill in
Addison County.
19
BERC Final Report on Addison County Pellet Feasibility Study Page 20
Figure 10 (top).
Forestland owner-
ship and parcel
size were gauged
as factors that can
be good indicators
of the likelihood
of harvest. The
percent of Addison
County’s forestland
in each ownership
category is shown
here, and was a
key component of
the estimation of
available low-grade
wood.
Figure 11 (bot-
tom). In general,
there is a positive
correlation be-
tween parcel size
and the probability
of harvesting.
Page BERC Final Report on Addison County Pellet Feasibility Study21
Forest Inventory. Another component of
quantifying the amount of low-grade wood
available annually in Addison County is esti-
mating both the total inventory on the acces-
sible forestland and the portion of inventory
that is low-grade wood appropriate for wood
fuel production. The only source of complete
forest inventory data in Addison County is
compiled by the USDA Forest Service.
Since it is impossible to count every tree, the
USDA Forest Service Forest Inventory and
Analysis (FIA) Program uses a statistically
designed sampling method. First, aerial pho-
tographs of the forest are interpreted. Next, a
grid of thousands of points is overlaid on the
aerial photos. If forested, each point is classi-
fi ed according to land use and tree size. Using
this information, a sample of dozens of plots is
selected for measurement by FIA fi eld crews.
In the most recent annual survey there were
70 FIA inventory plots in Addison County.
The sample includes plots that were estab-
lished during previous forest inventories. The
re-measurements of the same plots yield valu-
able information on how individual trees grow.
Field crews also collect data on the number,
size, and species of trees, and the
related forest attributes. All this in-
formation is used to generate reliable
estimates of the condition and health
of the forest resource, and how it is
changing over time.
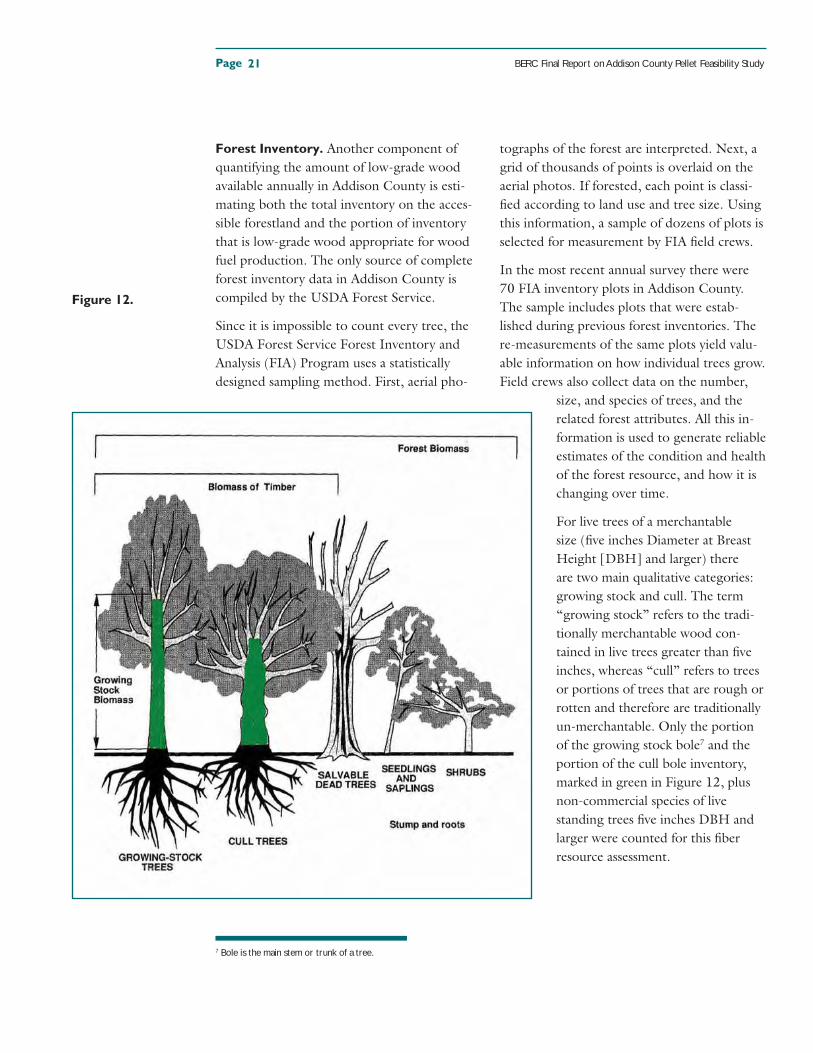
For live trees of a merchantable
size (fi ve inches Diameter at Breast
Height [DBH] and larger) there
are two main qualitative categories:
growing stock and cull. The term
“growing stock” refers to the tradi-
tionally merchantable wood con-
tained in live trees greater than fi ve
inches, whereas “cull” refers to trees
or portions of trees that are rough or
rotten and therefore are traditionally
un-merchantable. Only the portion
of the growing stock bole7 and the
portion of the cull bole inventory,
marked in green in Figure 12, plus
non-commercial species of live
standing trees fi ve inches DBH and
larger were counted for this fi ber
resource assessment.
7 Bole is the main stem or trunk of a tree.
Figure 12.
BERC Final Report on Addison County Pellet Feasibility Study Page 22
While top and limb wood is a common
source of wood fuel for other biomass
energy markets (such as woodchips for
electrical generation), it was excluded
from this assessment for two main
reasons: forest ecology and pellet fuel
quality. Top and limb wood, often
extracted from the forest as part of
whole-tree timber harvests, are a vital
source of organic matter and nutrients
for forest soils. Removing this wood re-
peatedly in each harvest cycle runs the
risk of adversely impacting forest soil
productivity. In addition to the ecologi-
cal reasons for excluding top and limb
wood, it is diffi cult to produce high-
quality pellets from smaller diameter
top and limb wood.
High quality pellets that fetch the higher mar-
ket price are produced from the “white wood”
(wood without bark) component of the tree by
stripping off the outer bark layer. Larger diam-
eter and straighter stems are easier to effectively
de-bark. Smaller stems with more curves, such
as those included in the T&L wood, are ex-
tremely diffi cult to debark and will dramatically
increase the resulting pellet’s bark content,
therefore increasing its ash content.
Standing and downed deadwood was not
counted due to its value as wildlife habitat and
because it does not represent inventory on
which new growth occurs. Seedling and sap-
lings were not counted either. Foliage, roots,
and stumps are not counted.
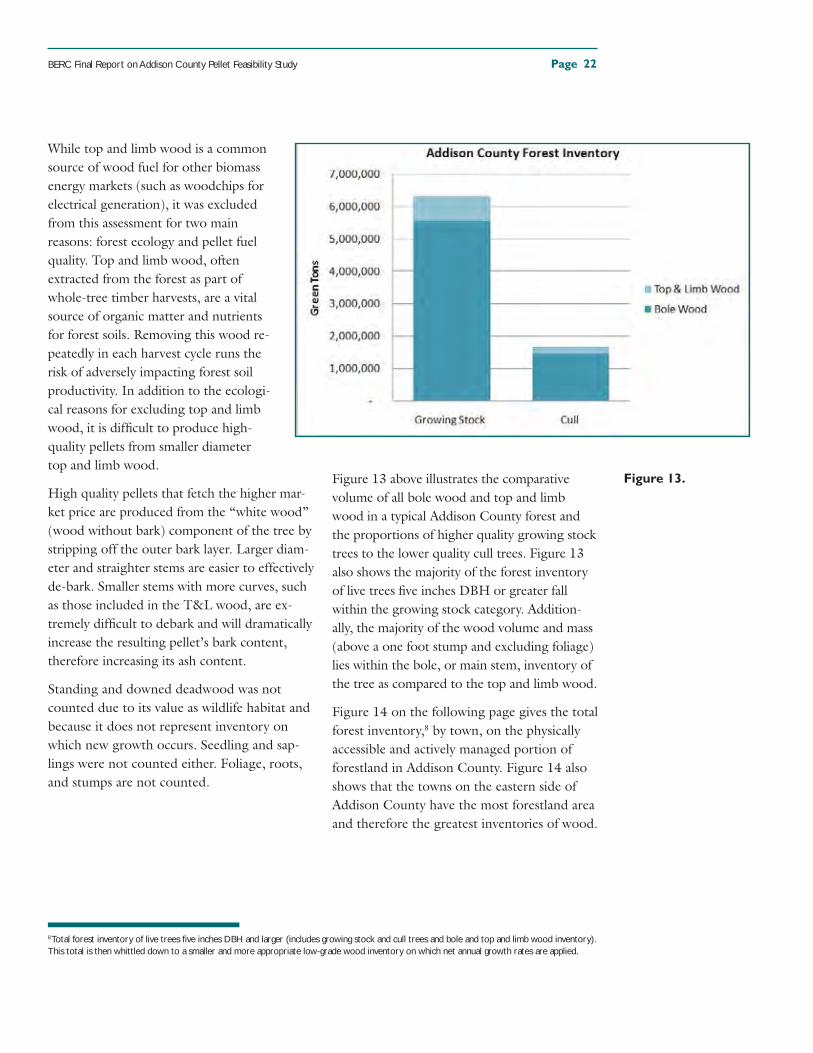
Figure 13 above illustrates the comparative
volume of all bole wood and top and limb
wood in a typical Addison County forest and
the proportions of higher quality growing stock
trees to the lower quality cull trees. Figure 13
also shows the majority of the forest inventory
of live trees fi ve inches DBH or greater fall
within the growing stock category. Addition-
ally, the majority of the wood volume and mass
(above a one foot stump and excluding foliage)
lies within the bole, or main stem, inventory of
the tree as compared to the top and limb wood.
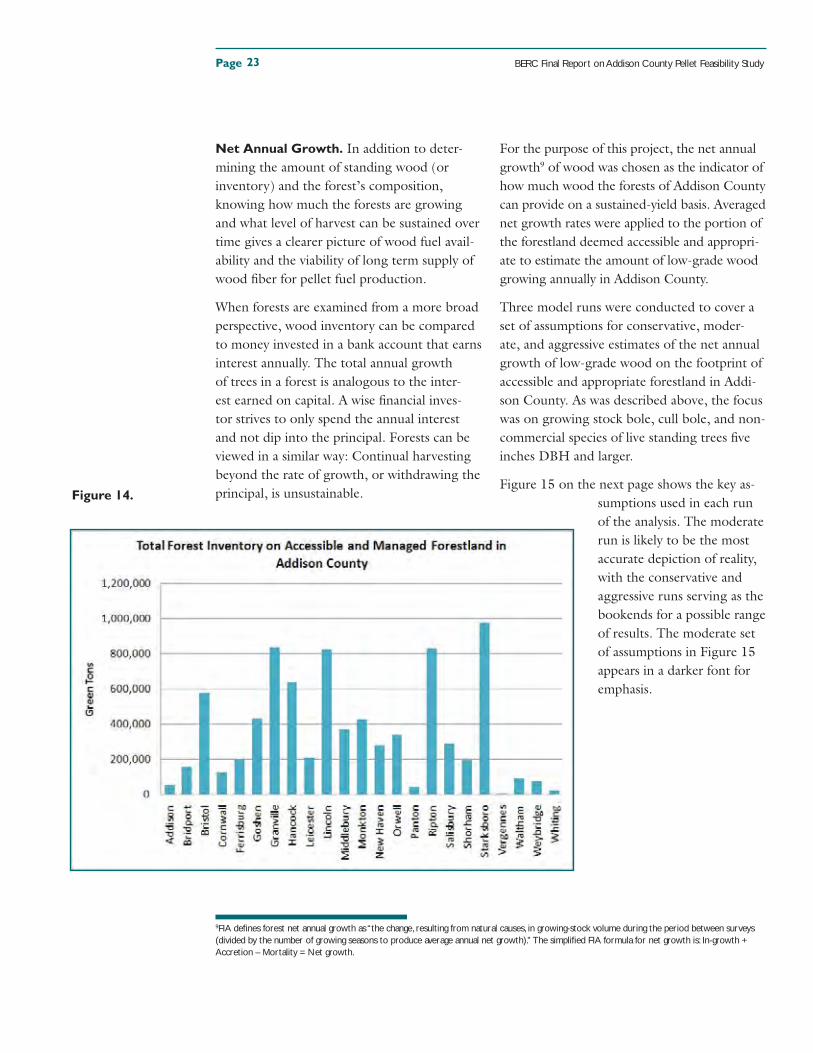
Figure 14 on the following page gives the total
forest inventory,8 by town, on the physically
accessible and actively managed portion of
forestland in Addison County. Figure 14 also
shows that the towns on the eastern side of
Addison County have the most forestland area
and therefore the greatest inventories of wood.
Figure 13.
8 Total forest inventory of live trees fi ve inches DBH and larger (includes growing stock and cull trees and bole and top and limb wood inventory). This total is then whittled down to a smaller and more appropriate low-grade wood inventory on which net annual growth rates are applied.
Page BERC Final Report on Addison County Pellet Feasibility Study23
Net Annual Growth. In addition to deter-
mining the amount of standing wood (or
inventory) and the forest’s composition,
knowing how much the forests are growing
and what level of harvest can be sustained over
time gives a clearer picture of wood fuel avail-
ability and the viability of long term supply of
wood fi ber for pellet fuel production.
When forests are examined from a more broad
perspective, wood inventory can be compared
to money invested in a bank account that earns
interest annually. The total annual growth
of trees in a forest is analogous to the inter-
est earned on capital. A wise fi nancial inves-
tor strives to only spend the annual interest
and not dip into the principal. Forests can be
viewed in a similar way: Continual harvesting
beyond the rate of growth, or withdrawing the
principal, is unsustainable.
For the purpose of this project, the net annual
growth9 of wood was chosen as the indicator of
how much wood the forests of Addison County
can provide on a sustained-yield basis. Averaged
net growth rates were applied to the portion of
the forestland deemed accessible and appropri-
ate to estimate the amount of low-grade wood
growing annually in Addison County.
Three model runs were conducted to cover a
set of assumptions for conservative, moder-
ate, and aggressive estimates of the net annual
growth of low-grade wood on the footprint of
accessible and appropriate forestland in Addi-
son County. As was described above, the focus
was on growing stock bole, cull bole, and non-
commercial species of live standing trees fi ve
inches DBH and larger.
Figure 15 on the next page shows the key as-
sumptions used in each run
of the analysis. The moderate
run is likely to be the most
accurate depiction of reality,
with the conservative and
aggressive runs serving as the
bookends for a possible range
of results. The moderate set
of assumptions in Figure 15
appears in a darker font for
emphasis.
9FIA defi nes forest net annual growth as “the change, resulting from natural causes, in growing-stock volume during the period between surveys (divided by the number of growing seasons to produce average annual net growth).” The simplifi ed FIA formula for net growth is: In-growth + Accretion – Mortality = Net growth.
Figure 14.
BERC Final Report on Addison County Pellet Feasibility Study Page 24
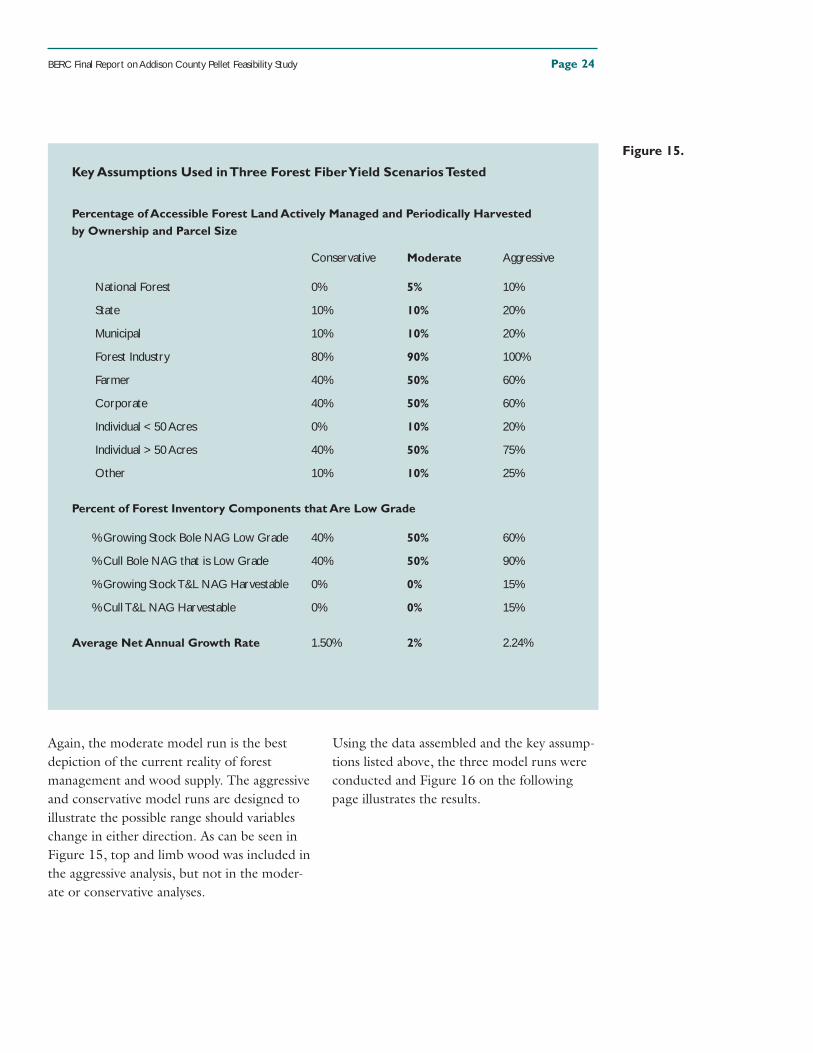
Key Assumptions Used in Three Forest Fiber Yield Scenarios Tested
Percentage of Accessible Forest Land Actively Managed and Periodically Harvested by Ownership and Parcel Size
Conservative Moderate Aggressive
National Forest 0% 5% 10%
State 10% 10% 20%
Municipal 10% 10% 20%
Forest Industry 80% 90% 100%
Farmer 40% 50% 60%
Corporate 40% 50% 60%
Individual < 50 Acres 0% 10% 20%
Individual > 50 Acres 40% 50% 75%
Other 10% 10% 25%
Percent of Forest Inventory Components that Are Low Grade
% Growing Stock Bole NAG Low Grade 40% 50% 60%
% Cull Bole NAG that is Low Grade 40% 50% 90%
% Growing Stock T&L NAG Harvestable 0% 0% 15%
% Cull T&L NAG Harvestable 0% 0% 15%
Average Net Annual Growth Rate 1.50% 2% 2.24%
Again, the moderate model run is the best
depiction of the current reality of forest
management and wood supply. The aggressive
and conservative model runs are designed to
illustrate the possible range should variables
change in either direction. As can be seen in
Figure 15, top and limb wood was included in
the aggressive analysis, but not in the moder-
ate or conservative analyses.
Using the data assembled and the key assump-
tions listed above, the three model runs were
conducted and Figure 16 on the following
page illustrates the results.
Figure 15.
Page BERC Final Report on Addison County Pellet Feasibility Study25
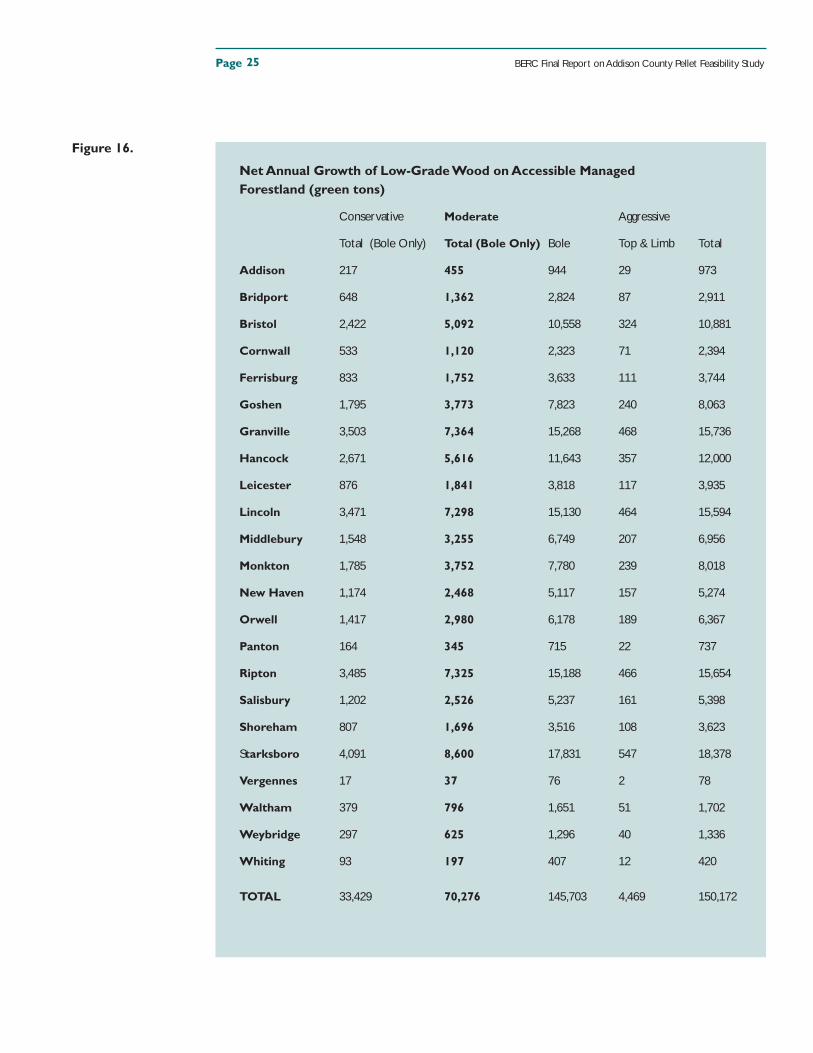
Net Annual Growth of Low-Grade Wood on Accessible Managed
Forestland (green tons)
Conservative Moderate Aggressive
Total (Bole Only) Total (Bole Only) Bole Top & Limb Total
Addison 217 455 944 29 973
Bridport 648 1,362 2,824 87 2,911
Bristol 2,422 5,092 10,558 324 10,881
Cornwall 533 1,120 2,323 71 2,394
Ferrisburg 833 1,752 3,633 111 3,744
Goshen 1,795 3,773 7,823 240 8,063
Granville 3,503 7,364 15,268 468 15,736
Hancock 2,671 5,616 11,643 357 12,000
Leicester 876 1,841 3,818 117 3,935
Lincoln 3,471 7,298 15,130 464 15,594
Middlebury 1,548 3,255 6,749 207 6,956
Monkton 1,785 3,752 7,780 239 8,018
New Haven 1,174 2,468 5,117 157 5,274
Orwell 1,417 2,980 6,178 189 6,367
Panton 164 345 715 22 737
Ripton 3,485 7,325 15,188 466 15,654
Salisbury 1,202 2,526 5,237 161 5,398
Shoreham 807 1,696 3,516 108 3,623
Starksboro 4,091 8,600 17,831 547 18,378
Vergennes 17 37 76 2 78
Waltham 379 796 1,651 51 1,702
Weybridge 297 625 1,296 40 1,336
Whiting 93 197 407 12 420
TOTAL 33,429 70,276 145,703 4,469 150,172
Figure 16.
BERC Final Report on Addison County Pellet Feasibility Study Page 26
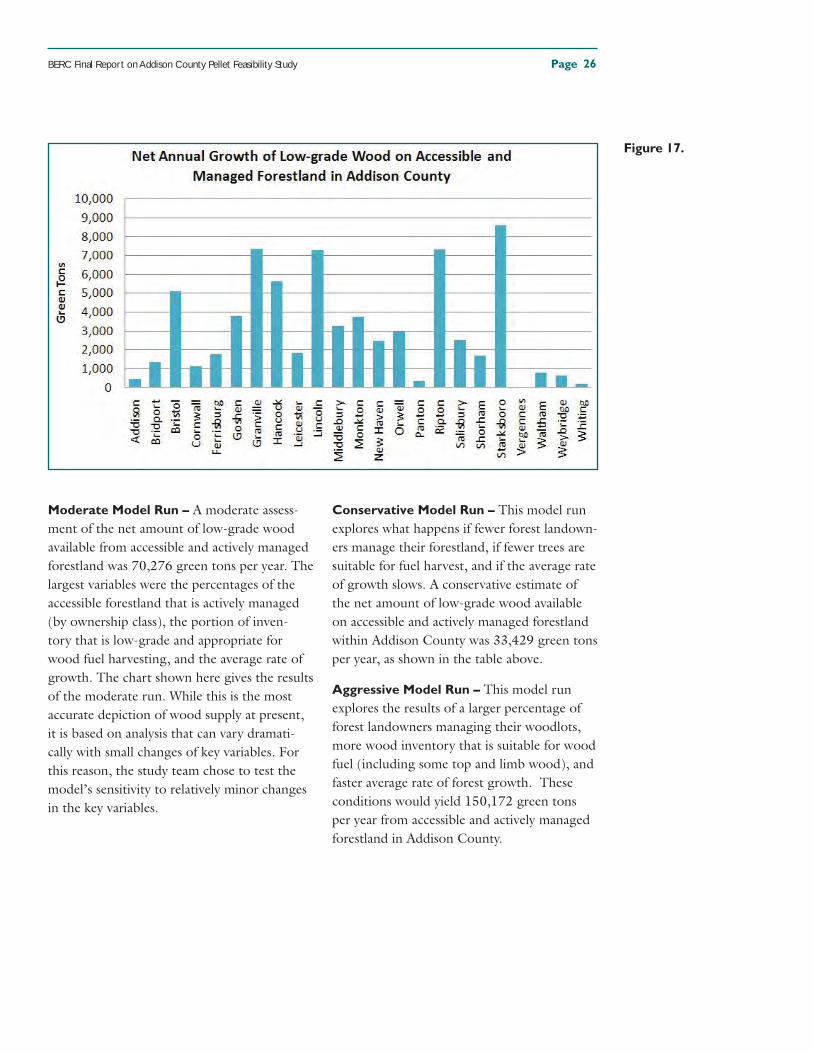
Moderate Model Run – A moderate assess-
ment of the net amount of low-grade wood
available from accessible and actively managed
forestland was 70,276 green tons per year. The
largest variables were the percentages of the
accessible forestland that is actively managed
(by ownership class), the portion of inven-
tory that is low-grade and appropriate for
wood fuel harvesting, and the average rate of
growth. The chart shown here gives the results
of the moderate run. While this is the most
accurate depiction of wood supply at present,
it is based on analysis that can vary dramati-
cally with small changes of key variables. For
this reason, the study team chose to test the
model’s sensitivity to relatively minor changes
in the key variables.
Conservative Model Run – This model run
explores what happens if fewer forest landown-
ers manage their forestland, if fewer trees are
suitable for fuel harvest, and if the average rate
of growth slows. A conservative estimate of
the net amount of low-grade wood available
on accessible and actively managed forestland
within Addison County was 33,429 green tons
per year, as shown in the table above.
Aggressive Model Run – This model run
explores the results of a larger percentage of
forest landowners managing their woodlots,
more wood inventory that is suitable for wood
fuel (including some top and limb wood), and
faster average rate of forest growth. These
conditions would yield 150,172 green tons
per year from accessible and actively managed
forestland in Addison County.
Figure 17.
Page BERC Final Report on Addison County Pellet Feasibility Study27
Existing Demands for Low-grade Wood.
The town level numbers presented above do not
account for removals. Harvesting information is
only gathered at the county level; therefore the
net amount of low-grade wood remaining after
removals are accounted for can only be calcu-
lated at the county level and not at the town
level. Forest inventory and growth data can
be applied at the town level using county wide
per acre averages, but harvesting data cannot
be applied using per acre averages. The section
below explores the current market demand for
low-grade wood from Addison County.
Historically, there have been three main mar-
kets for low-grade wood: fi rewood, pulp, and
biomass. Both fi rewood and pulp markets con-
sume mostly low-grade bole wood, whereas
biomass markets often consume just top and
limb wood, but in some cases they utilize
entire chipped trees. More recently, two more
markets have emerged in addition to fi rewood,
pulp, and biomass: The seasonal chip heating
market has grown dramatically over the past
few years and pellet manufacturing will soon
be a signifi cant market for low-grade wood.
Firewood – Residential fi rewood accounts for
a large majority of low-grade wood demand
in the region. Given the current high cost
of heating oil, Vermont has seen a dramatic
increase in demand for cordwood for home
heating over the past fi ve years. Current
estimates of fi rewood use and harvesting in
Vermont are 300,000 cords or 700,000 green
tons annually.
Pulpwood – Pulpwood demand and harvest-
ing in Vermont has gradually declined over
the past decade, although there are still several
large pulpmills in eastern New York, southern
Quebec and northwestern Maine that still
draw upon Vermont for their wood supply.
Although pulp volumes have declined, current
prices paid by the pulpmills have increased dra-
matically in the past 12 months. In 2004, over
650,000 green tons of pulpwood were har-
vested and exported to the regional pulpmills.
Just two years later only 250,000 greens tons
of pulpwood were harvested—a 62 percent
reduction.
Biomass Power Plants – Both of Vermont’s
wood-fi red power plants, McNeil Station in
Burlington and Ryegate Power Station in
Ryegate, consume large amounts of harvested
wood in the form of whole-tree chips. Tops
and limbs left over from mechanized whole-
tree timber harvests are also chipped into fuel.
International Paper and Finch Paper also con-
sume whole-tree chips as boiler fuel in addi-
tion to the pulpwood and pulp chips they con-
sume for making paper. Over the past several
years nearly 200,000 green tons of low-grade
wood from whole-tree harvesting in Vermont
has been chipped for power plant fuel each
year. Due to their locations, both Ryegate and
McNeil Station source signifi cant portions of
their wood fuel from adjoining New York and
New Hampshire.
Institutional Chip Heating Market – Wood-
chip heating for schools and institutions has
grown steadily over the past two decades in
Vermont. In the past two years this growth
has increased dramatically with several more
schools and two college campus installations.
Initially, nearly all woodchip heating systems
sourced their chip fuel directly from sawmills
as a by-product material; however as sawmill
activity has slowly declined and demand for
chip fuel has increased (as was described in the
previous section on wood residues), a larger
percentage of chip systems now source their
fuel from chipped pulpwood as a commod-
ity. In the past two years the combined chip
heating market has grown from consuming
approximately 25,000 tons annually to over
50,000 tons. The recently installed woodchip
BERC Final Report on Addison County Pellet Feasibility Study Page 28
system at Middlebury College accounts for
a large portion of this recent growth. This
demand will continue to grow and there are
currently several larger district heating projects
proposed in Vermont.
Pellet Manufacturing – While there currently
are no operational pellet mills in Vermont and
few in the surrounding states, there are nu-
merous proposals for pellet mills to be built in
Vermont, New York, and New Hampshire in
the near future.10 If only a small portion of the
proposed mills are built, they will constitute a
signifi cant market for low-grade wood. Similar
to the institutional chip heating market, pellet
mills have transitioned from sourcing their
fi ber from exclusively sawmill by-product to
increasingly sourcing pulpwood that is then
debarked, chipped, and re-ground to their
specifi cations onsite.
Net Available Wood Fiber. The next and
fi nal step is to explore the capacity, if any, for
further market demand from a pellet mill in
Addison County. The previous step of this
analysis showed there are 70,276 green tons
(moderate assessment) of low-grade wood
growing annually on forestland that is acces-
sible and appropriate for harvest in Addison
County. Data on existing harvest rates of
low-grade wood being removed for fi rewood
(estimated), pulp, and biomass (pulp and
biomass amounts came from Vermont Depart-
ment of Forests, Parks and Recreation’s An-
nual Harvest Reports) were subtracted from
this net annual growth, giving the net available
low-grade wood in Addison County.
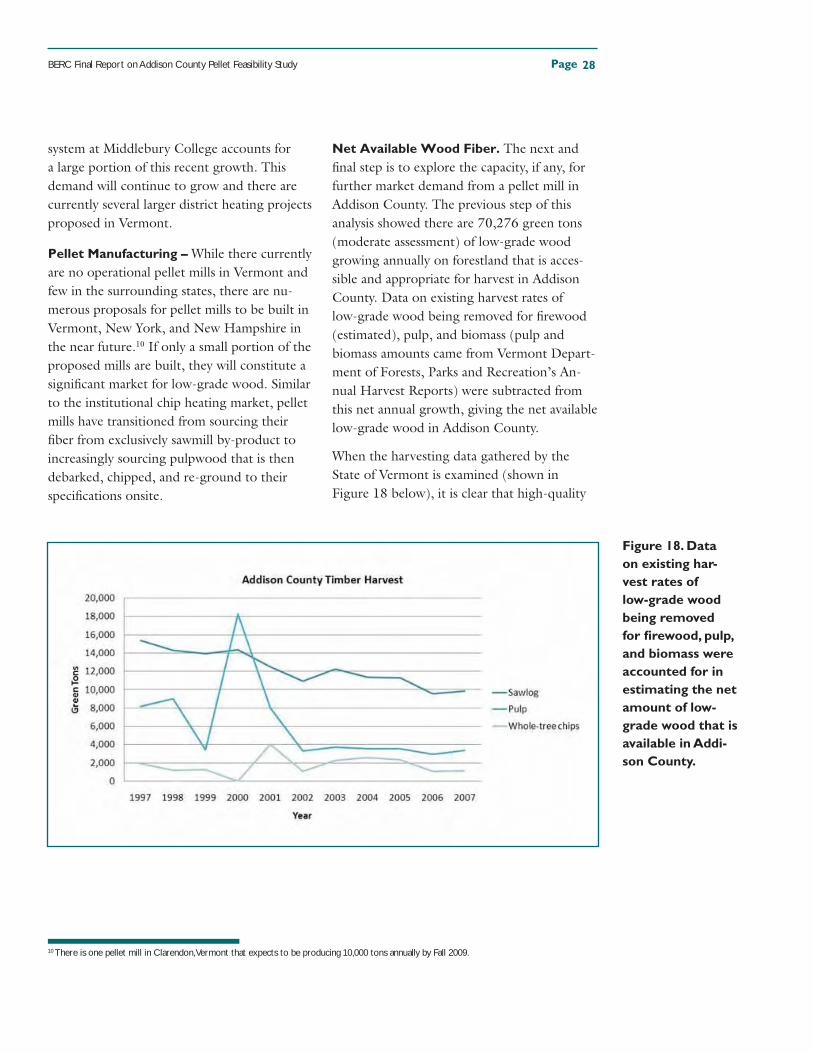
When the harvesting data gathered by the
State of Vermont is examined (shown in
Figure 18 below), it is clear that high-quality
10 There is one pellet mill in Clarendon, Vermont that expects to be producing 10,000 tons annually by Fall 2009.
Figure 18. Data
on existing har-
vest rates of
low-grade wood
being removed
for fi rewood, pulp,
and biomass were
accounted for in
estimating the net
amount of low-
grade wood that is
available in Addi-
son County.
Page BERC Final Report on Addison County Pellet Feasibility Study29
timber products such as sawlogs and veneer
account for the majority of harvested wood;
however, the amounts have been gradually de-
clining. Pulpwood saw a tremendous spike in
2000 and has since fallen to half its pre-1998
harvest levels. Whole-tree chips for biomass
power have accounted for a very small amount
of harvested wood over this time period.
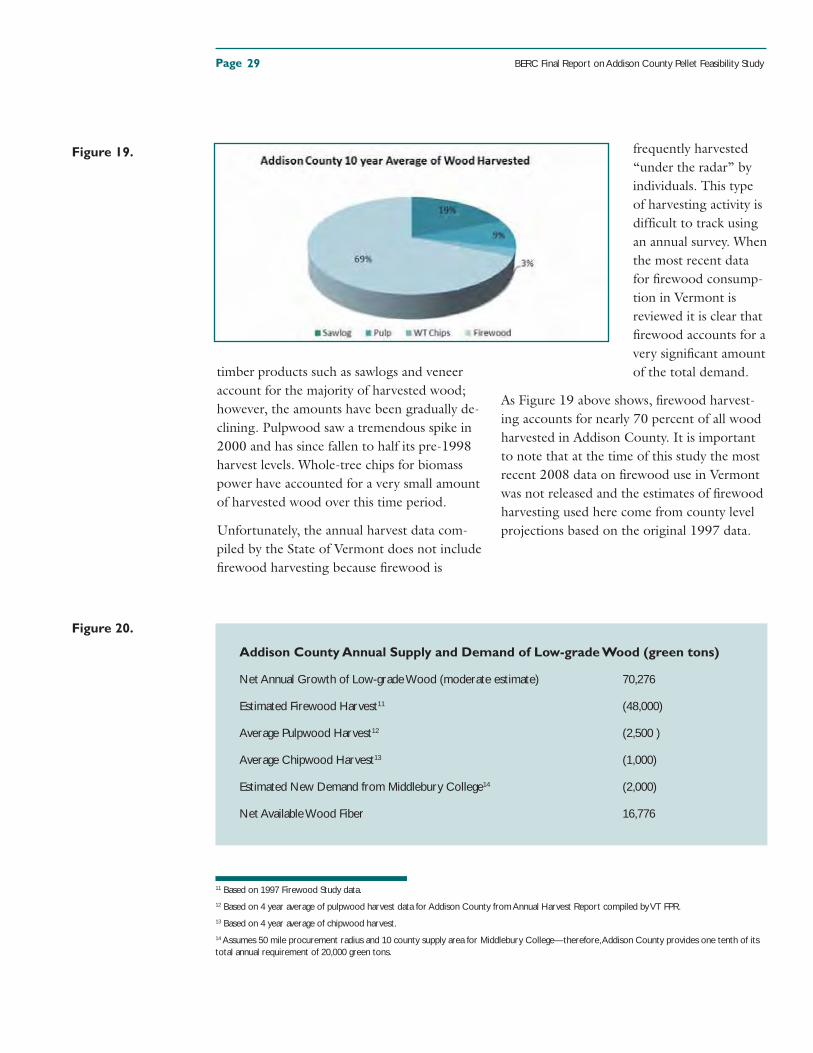
Unfortunately, the annual harvest data com-
piled by the State of Vermont does not include
fi rewood harvesting because fi rewood is
frequently harvested
“under the radar” by
individuals. This type
of harvesting activity is
diffi cult to track using
an annual survey. When
the most recent data
for fi rewood consump-
tion in Vermont is
reviewed it is clear that
fi rewood accounts for a
very signifi cant amount
of the total demand.
As Figure 19 above shows, fi rewood harvest-
ing accounts for nearly 70 percent of all wood
harvested in Addison County. It is important
to note that at the time of this study the most
recent 2008 data on fi rewood use in Vermont
was not released and the estimates of fi rewood
harvesting used here come from county level
projections based on the original 1997 data.
Figure 19.
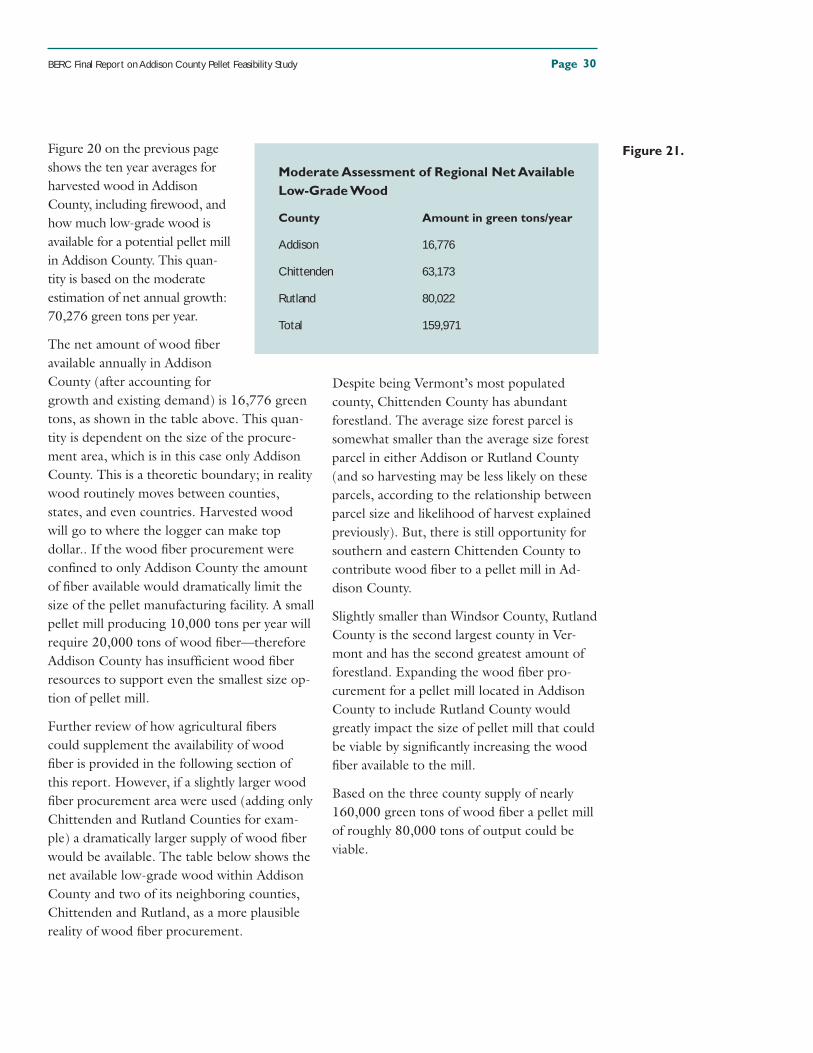
Addison County Annual Supply and Demand of Low-grade Wood (green tons)
Net Annual Growth of Low-grade Wood (moderate estimate) 70,276
Estimated Firewood Harvest11 (48,000)
Average Pulpwood Harvest12 (2,500 )
Average Chipwood Harvest13 (1,000)
Estimated New Demand from Middlebury College14 (2,000)
Net Available Wood Fiber 16,776
11 Based on 1997 Firewood Study data.12 Based on 4 year average of pulpwood harvest data for Addison County from Annual Harvest Report compiled by VT FPR.13 Based on 4 year average of chipwood harvest.14 Assumes 50 mile procurement radius and 10 county supply area for Middlebury College—therefore, Addison County provides one tenth of its total annual requirement of 20,000 green tons.
Figure 20.
BERC Final Report on Addison County Pellet Feasibility Study Page
Figure 20 on the previous page
shows the ten year averages for
harvested wood in Addison
County, including fi rewood, and
how much low-grade wood is
available for a potential pellet mill
in Addison County. This quan-
tity is based on the moderate
estimation of net annual growth:
70,276 green tons per year.
The net amount of wood fi ber
available annually in Addison
County (after accounting for
growth and existing demand) is 16,776 green
tons, as shown in the table above. This quan-
tity is dependent on the size of the procure-
ment area, which is in this case only Addison
County. This is a theoretic boundary; in reality
wood routinely moves between counties,
states, and even countries. Harvested wood
will go to where the logger can make top
dollar.. If the wood fi ber procurement were
confi ned to only Addison County the amount
of fi ber available would dramatically limit the
size of the pellet manufacturing facility. A small
pellet mill producing 10,000 tons per year will
require 20,000 tons of wood fi ber—therefore
Addison County has insuffi cient wood fi ber
resources to support even the smallest size op-
tion of pellet mill.
Further review of how agricultural fi bers
could supplement the availability of wood
fi ber is provided in the following section of
this report. However, if a slightly larger wood
fi ber procurement area were used (adding only
Chittenden and Rutland Counties for exam-
ple) a dramatically larger supply of wood fi ber
would be available. The table below shows the
net available low-grade wood within Addison
County and two of its neighboring counties,
Chittenden and Rutland, as a more plausible
reality of wood fi ber procurement.
Despite being Vermont’s most populated
county, Chittenden County has abundant
forestland. The average size forest parcel is
somewhat smaller than the average size forest
parcel in either Addison or Rutland County
(and so harvesting may be less likely on these
parcels, according to the relationship between
parcel size and likelihood of harvest explained
previously). But, there is still opportunity for
southern and eastern Chittenden County to
contribute wood fi ber to a pellet mill in Ad-
dison County.
Slightly smaller than Windsor County, Rutland
County is the second largest county in Ver-
mont and has the second greatest amount of
forestland. Expanding the wood fi ber pro-
curement for a pellet mill located in Addison
County to include Rutland County would
greatly impact the size of pellet mill that could
be viable by signifi cantly increasing the wood
fi ber available to the mill.
Based on the three county supply of nearly
160,000 green tons of wood fi ber a pellet mill
of roughly 80,000 tons of output could be
viable.
Moderate Assessment of Regional Net Available
Low-Grade Wood
County Amount in green tons/year
Addison 16,776
Chittenden 63,173
Rutland 80,022
Total 159,971
Figure 21.
30
Page BERC Final Report on Addison County Pellet Feasibility Study31
5.3 RESOURCE COMPETITION
FROM LARGE WOOD-CONSUMING
FACILITIES
If a pellet mill producing pellets from wood
fi ber were established in Addison County,
it would likely face competition from other
established and future large-scale consumers of
low-grade wood. Older facilities that have al-
ready paid down all debt service often are able
to out-compete newer start up businesses that
are laden with debt service on the large capital
cost of their facility. The following section de-
tails the existing facilities that would have the
greatest competitive impact.
Burlington Electric Department (BED)
Joseph McNeil Generation Station
Burlington, Vermont
This 50 megawatt power plant consumes ap-
proximately 400,000 green tons of wood per
year. The power plant is owned by BED with
minority ownership by several Vermont electric
utilities. Due to the McNeil Station’s proxim-
ity to downtown Burlington and Winooski,
their plant is limited to receiving only 25 per-
cent of their volume directly via tractor trailer
trucks due to concerns about truck traffi c from
city residents. Therefore the remaining 75
percent of the wood fuel received by McNeil is
transported to the facility via rail.
The Swanton Rail Yard is BED’s only rail yard
and it is located approximately 35 miles to the
north of the power plant in Swanton, Ver-
mont. The rail yard receives truck shipments of
chips and re-loads these chips onto railcars for
fi nal delivery to the McNeil Station.
Ryegate Power Station
East Ryegate, Vermont
Ryegate Power located on the eastern border
of Vermont, along the Connecticut River, is a
20 MW power plant owned and operated by
Suez Energy. The power plant consumes ap-
proximately 250,000 green tons of wood fuel
annually. A majority of the woodchip fuel is
whole-tree chips from commercial timber har-
vests. The rest of the material is mill residues
and clean urban wood.
Boralex Power Station
Chateauguay, New York
The Boralex power plant is a 20 MW plant
that consumes approximately 225,000 green
tons annually.
International Paper (IP) Company
Ticonderoga, New York
IP Ticonderoga is a large pulp and paper mill
that consumes raw wood fi ber for pulping and
boiler fuel. It consumes an estimated 700,000
green tons of wood annually. A majority of the
wood fi ber used at this facility comes as pulp-
grade roundwood.
Finch Paper
Glens Falls, New York
Finch Paper, formerly Finch Pryun, owns and
operates a pulp and paper mill in Glens Falls,
New York. This mill consumes raw wood fi ber
for pulping and boiler fuel. They consume an
estimated 500,000 tons annually.
Middlebury College
Middlebury, Vermont
At the end of 2008, Middlebury College com-
pleted the installation of a large woodchip-
fi red boiler at the campus’s central steam plant
in effort to replace one million gallons (or 50
percent) of the college’s oil use for heating
and powering their campus. This new wood
combustion system will consume an estimated
20,000 green tons annually when running at
full capacity. The college has announced its in-
tent to draw 100 percent of its wood fuel from
within a 75-mile radius.
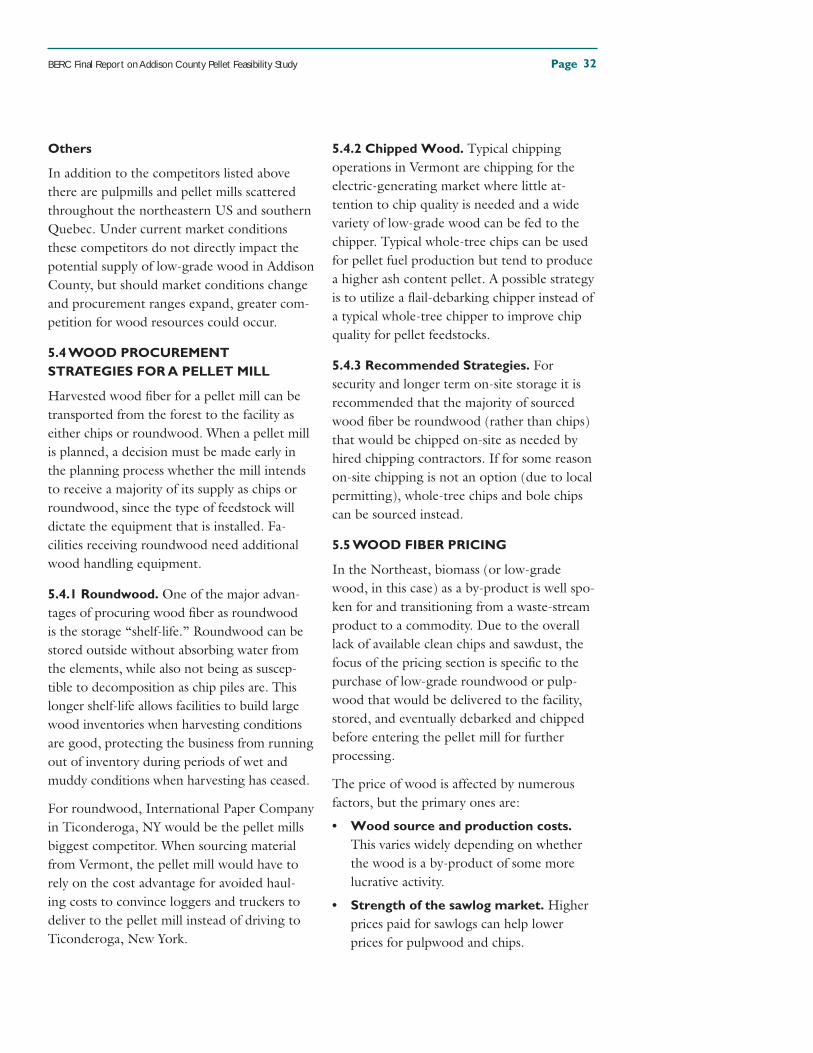
BERC Final Report on Addison County Pellet Feasibility Study Page 32
Others
In addition to the competitors listed above
there are pulpmills and pellet mills scattered
throughout the northeastern US and southern
Quebec. Under current market conditions
these competitors do not directly impact the
potential supply of low-grade wood in Addison
County, but should market conditions change
and procurement ranges expand, greater com-
petition for wood resources could occur.
5.4 WOOD PROCUREMENT
STRATEGIES FOR A PELLET MILL
Harvested wood fi ber for a pellet mill can be
transported from the forest to the facility as
either chips or roundwood. When a pellet mill
is planned, a decision must be made early in
the planning process whether the mill intends
to receive a majority of its supply as chips or
roundwood, since the type of feedstock will
dictate the equipment that is installed. Fa-
cilities receiving roundwood need additional
wood handling equipment.
5.4.1 Roundwood. One of the major advan-
tages of procuring wood fi ber as roundwood
is the storage “shelf-life.” Roundwood can be
stored outside without absorbing water from
the elements, while also not being as suscep-
tible to decomposition as chip piles are. This
longer shelf-life allows facilities to build large
wood inventories when harvesting conditions
are good, protecting the business from running
out of inventory during periods of wet and
muddy conditions when harvesting has ceased.
For roundwood, International Paper Company
in Ticonderoga, NY would be the pellet mills
biggest competitor. When sourcing material
from Vermont, the pellet mill would have to
rely on the cost advantage for avoided haul-
ing costs to convince loggers and truckers to
deliver to the pellet mill instead of driving to
Ticonderoga, New York.
5.4.2 Chipped Wood. Typical chipping
operations in Vermont are chipping for the
electric-generating market where little at-
tention to chip quality is needed and a wide
variety of low-grade wood can be fed to the
chipper. Typical whole-tree chips can be used
for pellet fuel production but tend to produce
a higher ash content pellet. A possible strategy
is to utilize a fl ail-debarking chipper instead of
a typical whole-tree chipper to improve chip
quality for pellet feedstocks.
5.4.3 Recommended Strategies. For
security and longer term on-site storage it is
recommended that the majority of sourced
wood fi ber be roundwood (rather than chips)
that would be chipped on-site as needed by
hired chipping contractors. If for some reason
on-site chipping is not an option (due to local
permitting), whole-tree chips and bole chips
can be sourced instead.
5.5 WOOD FIBER PRICING
In the Northeast, biomass (or low-grade
wood, in this case) as a by-product is well spo-
ken for and transitioning from a waste-stream
product to a commodity. Due to the overall
lack of available clean chips and sawdust, the
focus of the pricing section is specifi c to the
purchase of low-grade roundwood or pulp-
wood that would be delivered to the facility,
stored, and eventually debarked and chipped
before entering the pellet mill for further
processing.
The price of wood is affected by numerous
factors, but the primary ones are:
• Wood source and production costs.
This varies widely depending on whether
the wood is a by-product of some more
lucrative activity.
• Strength of the sawlog market. Higher
prices paid for sawlogs can help lower
prices for pulpwood and chips.
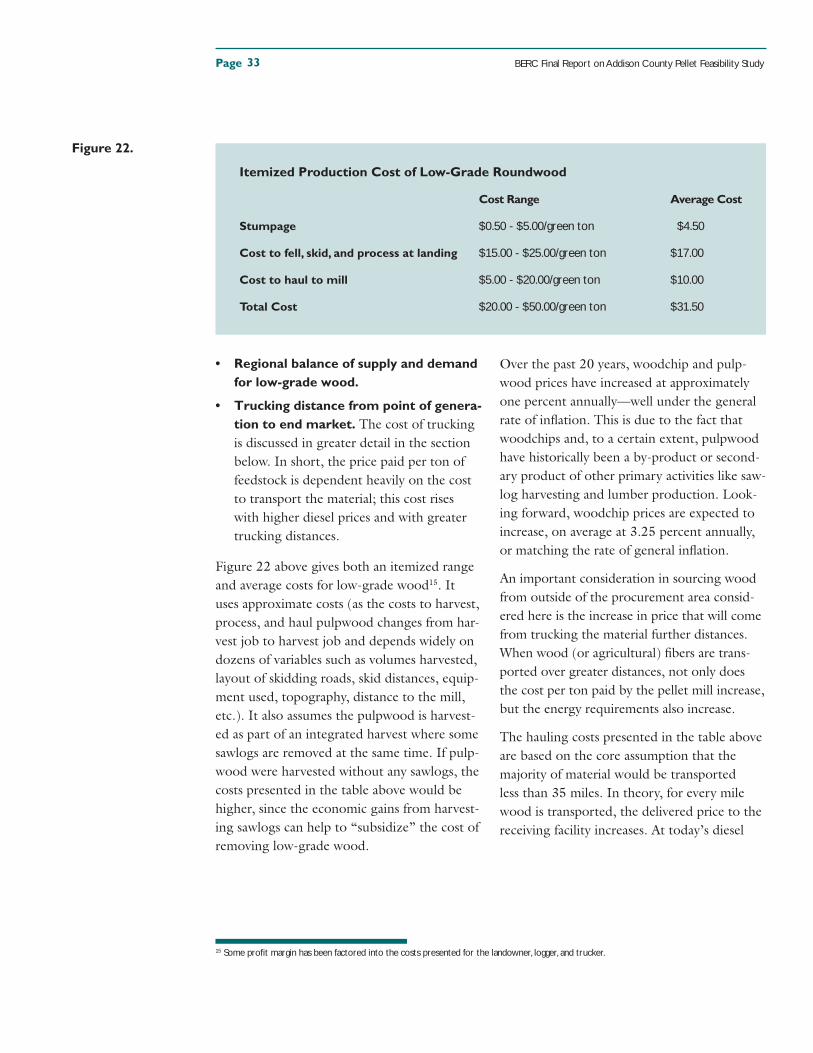
Page BERC Final Report on Addison County Pellet Feasibility Study
• Regional balance of supply and demand
for low-grade wood.
• Trucking distance from point of genera-
tion to end market. The cost of trucking
is discussed in greater detail in the section
below. In short, the price paid per ton of
feedstock is dependent heavily on the cost
to transport the material; this cost rises
with higher diesel prices and with greater
trucking distances.
Figure 22 above gives both an itemized range
and average costs for low-grade wood15. It
uses approximate costs (as the costs to harvest,
process, and haul pulpwood changes from har-
vest job to harvest job and depends widely on
dozens of variables such as volumes harvested,
layout of skidding roads, skid distances, equip-
ment used, topography, distance to the mill,
etc.). It also assumes the pulpwood is harvest-
ed as part of an integrated harvest where some
sawlogs are removed at the same time. If pulp-
wood were harvested without any sawlogs, the
costs presented in the table above would be
higher, since the economic gains from harvest-
ing sawlogs can help to “subsidize” the cost of
removing low-grade wood.
Over the past 20 years, woodchip and pulp-
wood prices have increased at approximately
one percent annually—well under the general
rate of infl ation. This is due to the fact that
woodchips and, to a certain extent, pulpwood
have historically been a by-product or second-
ary product of other primary activities like saw-
log harvesting and lumber production. Look-
ing forward, woodchip prices are expected to
increase, on average at 3.25 percent annually,
or matching the rate of general infl ation.
An important consideration in sourcing wood
from outside of the procurement area consid-
ered here is the increase in price that will come
from trucking the material further distances.
When wood (or agricultural) fi bers are trans-
ported over greater distances, not only does
the cost per ton paid by the pellet mill increase,
but the energy requirements also increase.
The hauling costs presented in the table above
are based on the core assumption that the
majority of material would be transported
less than 35 miles. In theory, for every mile
wood is transported, the delivered price to the
receiving facility increases. At today’s diesel
33
Itemized Production Cost of Low-Grade Roundwood
Cost Range Average Cost
Stumpage $0.50 - $5.00/green ton $4.50
Cost to fell, skid, and process at landing $15.00 - $25.00/green ton $17.00
Cost to haul to mill $5.00 - $20.00/green ton $10.00
Total Cost $20.00 - $50.00/green ton $31.50
Figure 22.
15 Some profi t margin has been factored into the costs presented for the landowner, logger, and trucker.
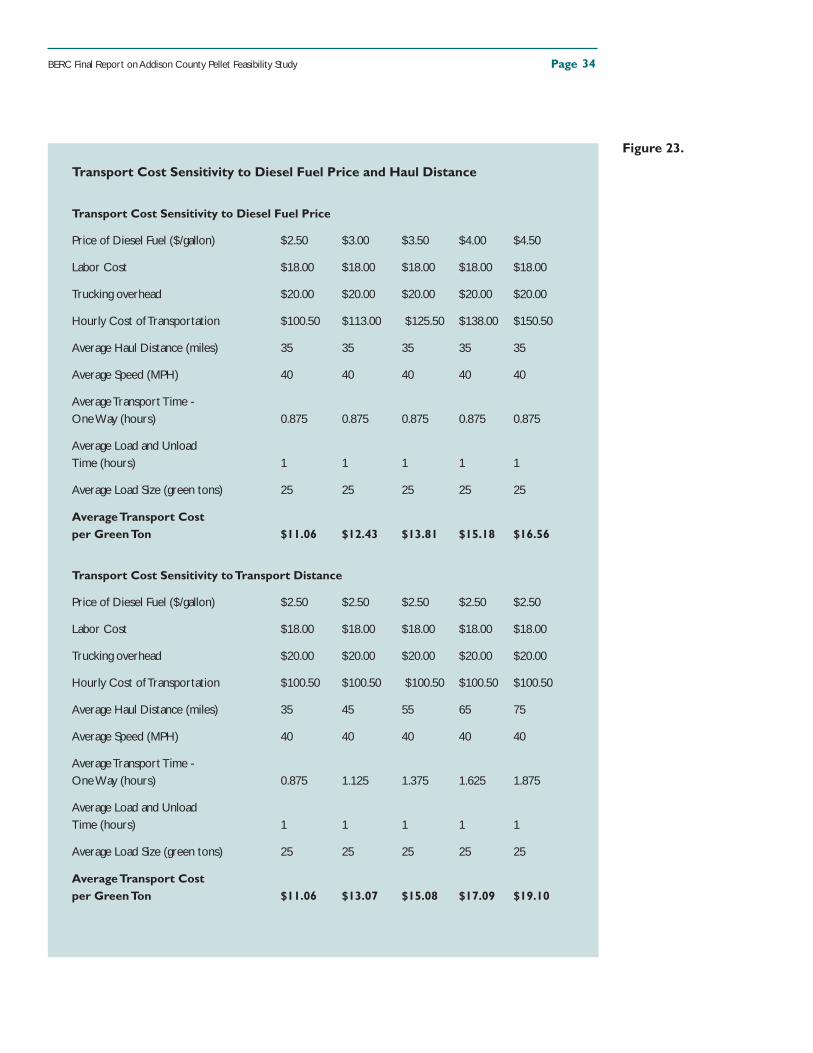
BERC Final Report on Addison County Pellet Feasibility Study Page
Transport Cost Sensitivity to Diesel Fuel Price and Haul Distance
Transport Cost Sensitivity to Diesel Fuel Price
Price of Diesel Fuel ($/gallon) $2.50 $3.00 $3.50 $4.00 $4.50
Labor Cost $18.00 $18.00 $18.00 $18.00 $18.00
Trucking overhead $20.00 $20.00 $20.00 $20.00 $20.00
Hourly Cost of Transportation $100.50 $113.00 $125.50 $138.00 $150.50
Average Haul Distance (miles) 35 35 35 35 35
Average Speed (MPH) 40 40 40 40 40
Average Transport Time - One Way (hours) 0.875 0.875 0.875 0.875 0.875
Average Load and Unload Time (hours) 1 1 1 1 1
Average Load Size (green tons) 25 25 25 25 25
Average Transport Cost per Green Ton $11.06 $12.43 $13.81 $15.18 $16.56
Transport Cost Sensitivity to Transport Distance
Price of Diesel Fuel ($/gallon) $2.50 $2.50 $2.50 $2.50 $2.50
Labor Cost $18.00 $18.00 $18.00 $18.00 $18.00
Trucking overhead $20.00 $20.00 $20.00 $20.00 $20.00
Hourly Cost of Transportation $100.50 $100.50 $100.50 $100.50 $100.50
Average Haul Distance (miles) 35 45 55 65 75
Average Speed (MPH) 40 40 40 40 40
Average Transport Time - One Way (hours) 0.875 1.125 1.375 1.625 1.875
Average Load and Unload Time (hours) 1 1 1 1 1
Average Load Size (green tons) 25 25 25 25 25
Average Transport Cost per Green Ton $11.06 $13.07 $15.08 $17.09 $19.10
Figure 23.
34
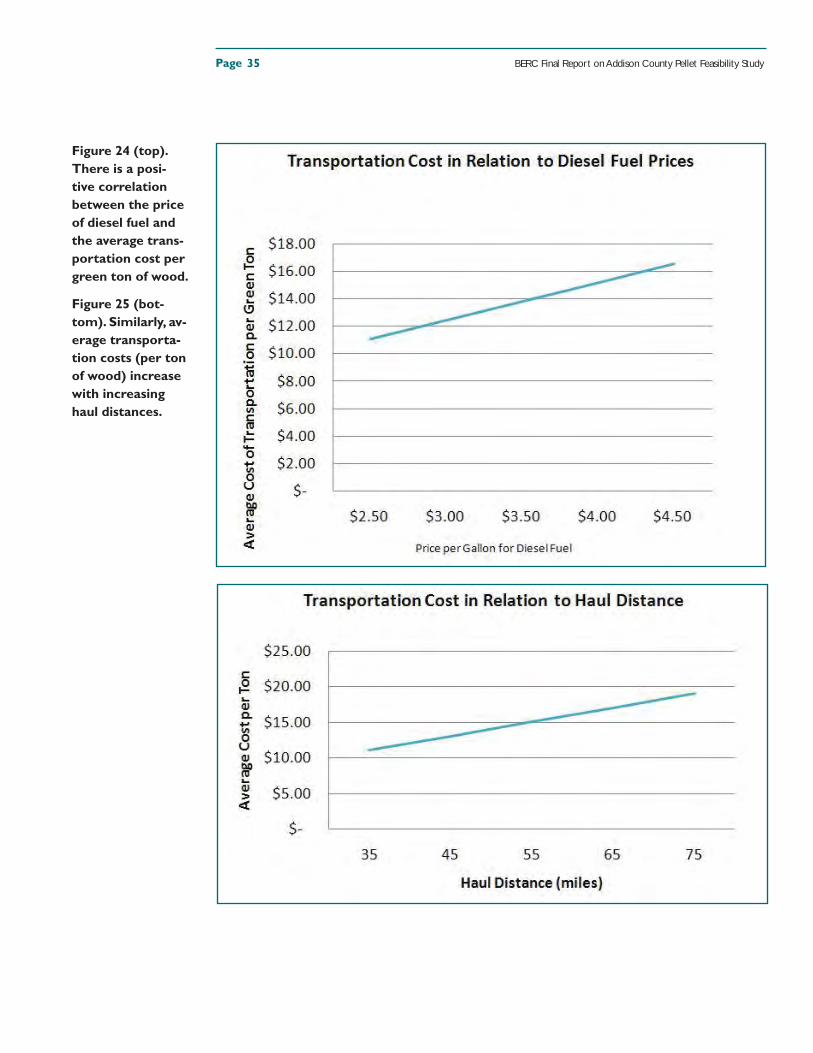
Page BERC Final Report on Addison County Pellet Feasibility Study
Figure 24 (top).
There is a posi-
tive correlation
between the price
of diesel fuel and
the average trans-
portation cost per
green ton of wood.
Figure 25 (bot-
tom). Similarly, av-
erage transporta-
tion costs (per ton
of wood) increase
with increasing
haul distances.
35
BERC Final Report on Addison County Pellet Feasibility Study Page
fuel prices, transporting 22 to 28 ton loads
(a trailer load) of roundwood or woodchips
costs between $2.50 and $3.00 per mile. More
detailed presentation on the cost of transport-
ing material distances greater than 35 miles is
given in the table and graphs below. Figure
24 on the previous page shows the positive
correlation between the price of diesel fuel and
the cost to transport a green ton of wood: As
diesel fuel prices escalate, the cost to transport
the material will also increase.
Similarly, there is a positive correlation be-
tween the haul distance and the cost to trans-
port a green ton of wood.
As Figure 25 on the previous page shows,
longer trucking distances will only slightly
increase the purchase cost of the wood fi ber.
Typically, it is advisable to keep trucking dis-
tances to a minimum, but $5 more per green
ton for wood hauled an extra 15 to 20 miles
is a small price to pay for greater assurance of
suffi cient supply. In the case of a pellet mill
for Addison County, the benefi ts of securing
additional wood from Chittenden and Rutland
County to supplement those secured from
Addison County far outweigh the few extra
dollars paid per ton for slightly longer haul
distances.
5.6 WOOD FIBER ASSESSMENT
CONCLUSIONS
All signifi cant volumes of desirable wood resi-
dues such as sawdust and mill chips are utilized
by other markets, and targeting sawdust for a
pellet mill would negatively impact bedding
prices paid by farmers, hurting other parts
of Addison County’s economy. Additionally,
clean community wood waste is not a recom-
mended feedstock. Since residue materials are
largely unavailable for a pellet mill in Addison
County, harvested wood will likely account for
nearly all wood fi ber sourced by a pellet mill.
Reliable local markets for low-grade wood can
bolster the local forest products industry and
enhance the growth of the higher-quality trees
for future harvest.
Addison County has a signifi cant amount
of forestland, with nearly 45 percent of the
county being forested. Of this, almost 70
percent of the county’s forestland was found
to be accessible and ecologically appropriate
for harvesting. An assessment was conducted
using moderate assumptions for the portion
of this forestland that is actively managed, the
inventory of low-grade wood, and the aver-
age rate of growth. This analysis found that
70,267 green tons of low-grade wood would
be available each year (the range could be as
wide as 33,429 to 150,172 green tons) to be
sustainably harvested from the accessible and
managed portion of forestland in Addison
County. Current harvesting to meet exist-
ing market demands signifi cantly impacts this
allotment, virtually reducing this moderate
fi gure to 16,776 green tons that are avail-
able—an amount insuffi cient to support a
small pellet mill. However, when neighboring
Chittenden and Rutland Counties are includ-
ed, this amount increases to 159,971 green
tons that would be available each year.
Pricing of roundwood from within Addison
County is estimated to cost $31.50 in the
fi rst year, but major swings in sawlog and
pulpwood markets and diesel fuel costs could
impact this price. Additionally, while it is typi-
cally advisable to keep trucking distances to
a minimum to prevent increasing prices for
wood, the advantage of greater feedstock secu-
rity from increased amounts of available wood
from neighboring counties would far outweigh
the relatively small increase in cost.
36
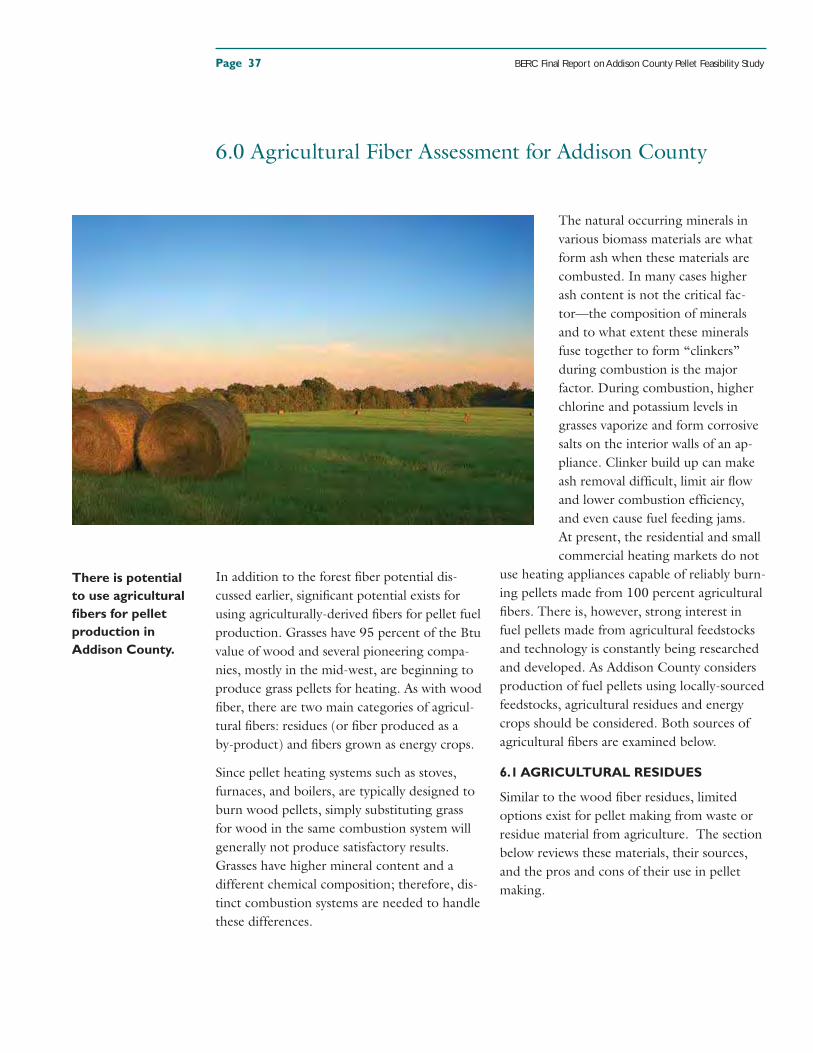
Page BERC Final Report on Addison County Pellet Feasibility Study
6.0 Agricultural Fiber Assessment for Addison County
In addition to the forest fi ber potential dis-
cussed earlier, signifi cant potential exists for
using agriculturally-derived fi bers for pellet fuel
production. Grasses have 95 percent of the Btu
value of wood and several pioneering compa-
nies, mostly in the mid-west, are beginning to
produce grass pellets for heating. As with wood
fi ber, there are two main categories of agricul-
tural fi bers: residues (or fi ber produced as a
by-product) and fi bers grown as energy crops.
Since pellet heating systems such as stoves,
furnaces, and boilers, are typically designed to
burn wood pellets, simply substituting grass
for wood in the same combustion system will
generally not produce satisfactory results.
Grasses have higher mineral content and a
different chemical composition; therefore, dis-
tinct combustion systems are needed to handle
these differences.
The natural occurring minerals in
various biomass materials are what
form ash when these materials are
combusted. In many cases higher
ash content is not the critical fac-
tor—the composition of minerals
and to what extent these minerals
fuse together to form “clinkers”
during combustion is the major
factor. During combustion, higher
chlorine and potassium levels in
grasses vaporize and form corrosive
salts on the interior walls of an ap-
pliance. Clinker build up can make
ash removal diffi cult, limit air fl ow
and lower combustion effi ciency,
and even cause fuel feeding jams.
At present, the residential and small
commercial heating markets do not
use heating appliances capable of reliably burn-
ing pellets made from 100 percent agricultural
fi bers. There is, however, strong interest in
fuel pellets made from agricultural feedstocks
and technology is constantly being researched
and developed. As Addison County considers
production of fuel pellets using locally-sourced
feedstocks, agricultural residues and energy
crops should be considered. Both sources of
agricultural fi bers are examined below.
6.1 AGRICULTURAL RESIDUES
Similar to the wood fi ber residues, limited
options exist for pellet making from waste or
residue material from agriculture. The section
below reviews these materials, their sources,
and the pros and cons of their use in pellet
making.
There is potential
to use agricultural
fi bers for pellet
production in
Addison County.
37
BERC Final Report on Addison County Pellet Feasibility Study Page
6.1.1 Sources and Availability of
Agricultural Residues. Many of the agricul-
tural residues commonly found in other parts
of the country are not typically generated here
in Vermont. In many parts of the country
there are harvestable residues left in the farm
fi elds after the commodity food or feed crop
has been harvested. Corn stover (stalks and
leaves) and oatstraw are good examples.
In Vermont—and in Addison County— the
majority of crops grown are feed for dairy
operations where the entire plant is harvested
and fed to the animals. Even with oil seed
crops, the resulting meal is very valuable as a
feed material leaving little as a potential feed-
stock for pellet fuel making.
Addison County has 80,608 acres of agricul-
tural land in hay yielding 257,010 dry tons of
hay annually16. In many years producing qual-
ity feed hay is diffi cult due to erratic weather
conditions. Hay that does not meet feed
quality, commonly referred to as waste hay,
is a potential source of agricultural fi ber from
which pellets could be made. This low-quality
hay is frequently sold and used as mulch. The
amount of waste hay produced annually in Ad-
dison County is extremely diffi cult to quantify
because, in good years, nearly all hay harvested
is high quality and therefore little waste hay is
produced, while in wet summers more waste
hay is produced.
6.2 DEDICATED ENERGY CROPS
Unlike by-product supply of agricultural fi bers
which are very fi nite, increasing amounts of
dedicated energy crops can be grown to meet
the market needs, so this study included devel-
oping a model to explore both the maximum
resource capacity and the moderate yield that
would be more likely. In a similar way to the
wood fi ber assessment described above, this
study considered the potential for and annual
availability of dedicated energy crops.
Numerous types of dedicated crops exist and
they are grown purposefully for various energy
markets. Oil crops, such as rapeseed, sunfl ow-
er, and soybean can be grown, harvested, and
pressed to extract the oil that is then converted
into fuel. Small amounts of oil seed crops are
already being grown throughout Vermont,
however the feed value of the resulting meal
(left over plant fi bers after the oil has been
extracted) well exceeds its value as a feedstock
for fuel pellets. For this reason, this analysis
focused only on fi ber crops, and not oil crops,
as a possible feedstock for making pellet fuel.
6.2.1 Grasses. No one grass species can be
grown effectively in all regions and climates;
however, the most broadly-considered grasses
for energy production are: Switchgrass (and
other native prairie grasses such as Big Blue-
stem and Prairie Cord grass); Miscanthus, a
hybrid high-yielding crop that has garnered
much interest; and Reed Canarygrass, an
important forage grass in Vermont that is
high-yielding and grows well in wet, marginal
areas, but that is also recognized as potentially
invasive, competing with other native wetland
species, making its use as an energy crop more
contentious. Each species has its own benefi ts
and drawbacks as a biomass fuel source. There
are other potential grasses as well, all of which
need further evaluation.
When deciding which species of grass is the
best choice for pellets, the fi rst consideration is
generally the yield per acre in any given micro-
climate or soil type, as this greatly infl uences
the economics of conversion of the crop to a
useful form for energy extraction.
16 USDA 2002 Census of Agriculture.
38
Page BERC Final Report on Addison County Pellet Feasibility Study
Another consideration is the mineral, and
therefore ash, content of a given grass on a
given plot, which may affect the value of the
crop as a densifi ed fuel for thermal applica-
tions. Another consideration may be harvest
windows as infl uenced by local climates. What
will the moisture content of the harvested
grass be? Will this limit uses? Are there other
users, birds for example, of the grass fi elds as it
is growing and how do they shape options for
harvesting?
Switchgrass (Panicum virgatum) is native to
the United States and is one of the best non-
woody energy crops because of its perennial
growth habit, high yield potential on a wide
variety of soil conditions and types, compat-
ibility with conventional farming practices, and
value in improving soil and water conservation
and quality. This native, warm-season grass is
widely adaptive once established; however, this
species requires attentive weed control in the
fi rst year of establishment so cool season grass-
es do not overwhelm it. Nitrogen fertilizer is
not recommended in the fi rst year to reduce
competition from grassy weeds. Switchgrass
should be harvested once per year, generally
after frost, using standard haying equipment.
Grasses cut in the fall and left to over-winter
are far lower in yield but have been shown to
leach out potassium and chlorine, two minerals
that may create issues during combustion.
Reed Canarygrass (Phylaris arundinacea) is
a perennial wetland grass, native to parts of
the US, Europe, and Asia. It is a cool-season
grass that is less productive than warm-season
grasses. It is winter hardy so can be grown in
colder climates and under shorter growing
seasons; however, many ecologists and con-
servation departments consider it an invasive
species because it frequently out competes and
threatens natural wetland species.
In general, grasses grown for energy are man-
aged for biomass yield rather than forage or
nutritive quality. In fact, lower nutrient levels
(nitrogen, sulfur, chlorine, etc.) may improve
fuel quality and reduce emissions. As expected,
the growth and yield of the grass crop is highly
dependent on soil conditions, moisture, fertil-
ity, weed control, and timing of harvest. Dur-
ing the growing season, modest use of fertiliz-
ers may be needed to maintain soil fertility and
improve crop yields. Careful attention must be
paid to ensure that crops are not over-fertil-
ized for risk of leaching surplus nutrients into
ground and surface waterways.
6.2.2 Woody Plants (Energy Crops). Wil-
low and poplar were reviewed and considered
as potential energy crops for this study. Willow
and poplar coppice have potential as dedicated
energy crops, but were largely not included
as part of the core analysis conducted for
this study (with exception of the Aggressive
model run). For one, these woody shrubs are
intensive to grow and are expensive when all
the costs of cultivation, fertilization, planting,
weed control, and harvesting are factored in.
Harvesting willow and poplar coppice also
requires specialized harvest equipment that is
not typically owned by farmers. Lastly, willow
and poplar coppice are suitable for biomass
fuel for large boiler systems but are not as
attractive for pellet making due to the rela-
tively high bark and foliage content in shrubby
willows as compared the proportionally lower
amount contained in larger diameter logs.
Bark and foliage have dramatically higher ash
content than “white” wood fi ber from the
inside of tree stem.
39
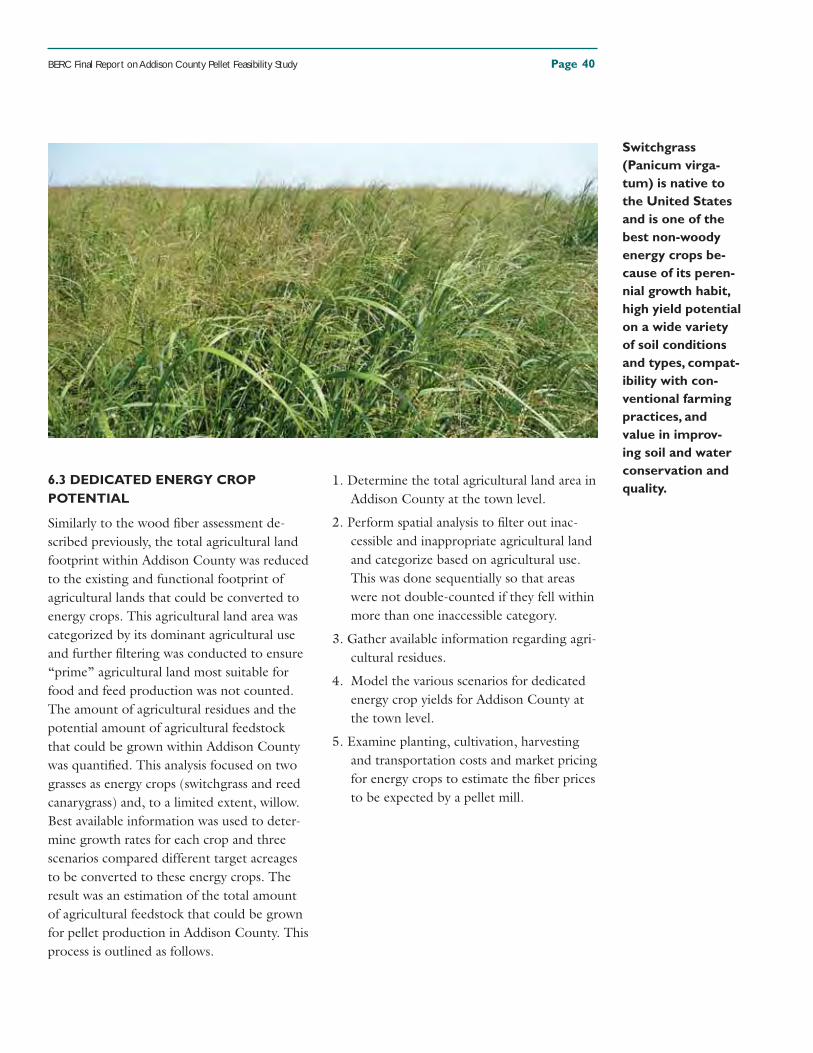
BERC Final Report on Addison County Pellet Feasibility Study Page
6.3 DEDICATED ENERGY CROP
POTENTIAL
Similarly to the wood fi ber assessment de-
scribed previously, the total agricultural land
footprint within Addison County was reduced
to the existing and functional footprint of
agricultural lands that could be converted to
energy crops. This agricultural land area was
categorized by its dominant agricultural use
and further fi ltering was conducted to ensure
“prime” agricultural land most suitable for
food and feed production was not counted.
The amount of agricultural residues and the
potential amount of agricultural feedstock
that could be grown within Addison County
was quantifi ed. This analysis focused on two
grasses as energy crops (switchgrass and reed
canarygrass) and, to a limited extent, willow.
Best available information was used to deter-
mine growth rates for each crop and three
scenarios compared different target acreages
to be converted to these energy crops. The
result was an estimation of the total amount
of agricultural feedstock that could be grown
for pellet production in Addison County. This
process is outlined as follows.
1. Determine the total agricultural land area in
Addison County at the town level.
2. Perform spatial analysis to fi lter out inac-
cessible and inappropriate agricultural land
and categorize based on agricultural use.
This was done sequentially so that areas
were not double-counted if they fell within
more than one inaccessible category.
3. Gather available information regarding agri-
cultural residues.
4. Model the various scenarios for dedicated
energy crop yields for Addison County at
the town level.
5. Examine planting, cultivation, harvesting
and transportation costs and market pricing
for energy crops to estimate the fi ber prices
to be expected by a pellet mill.
Switchgrass
(Panicum virga-
tum) is native to
the United States
and is one of the
best non-woody
energy crops be-
cause of its peren-
nial growth habit,
high yield potential
on a wide variety
of soil conditions
and types, compat-
ibility with con-
ventional farming
practices, and
value in improv-
ing soil and water
conservation and
quality.
40
Page BERC Final Report on Addison County Pellet Feasibility Study
6.3.1 Calculated Agricultural Area. The
fi rst step toward determining the potential
agriculture fi ber resource capacity is to deter-
mine how much agricultural land exists in the
county and explore its current use. To do this,
the Common Land Unit (CLU) spatial data
layer, maintained by the USDA Farm Service
Agency, was updated at the University of
Vermont’s Spatial Laboratory using 2003 im-
agery to show crop cover and pasture/subur-
ban areas. The suburban lawns were removed
and the crop and pasture feature classes were
merged to create a single detailed agricultural
layer. Of the total land area in Addison County
(516,895 acres), approximately 26 percent or
133,946 acres is agricultural land. This GIS
data layer categorizes the total agricultural
land into fi ve main groups: corn, hay, pasture,
urban pasture, and other. These categories ap-
proximate the total acreage that, at any given
time, is in corn production, hay production,
pasture use, idle urban pasture, or other. It is
important to note that corn and hay are often
rotated and to defi nitely categorize agricultural
land as corn or hay seems to ignore the reality
of typical crop rotations. However, the impor-
tant point to consider here is that this informa-
tion gives the user an approximate quantifi ca-
tion of the amount of agricultural land that is
in corn, hay, and so on at any given time.
While this starting CLU data source accurately
depicted the total agricultural land area, it con-
stituted too broad a measure of the functional
agricultural land area. This study fi ltered the
base layer of agricultural lands in a similar way
as the forested footprint (in ArcGIS) to ac-
count for the following factors:
• slope greater than 12 percent grade,
• wetlands (including 50 foot buffers),
• streams (including 50 foot buffers),
• other designated habitat areas,
• roads (including 25 to 50 foot buffers)
• buildings and three acre buffers surround-
ing them,
• and other developed spaces such as drive-
ways.
Figure 26 on the following page shows, by town
and by crop category, total starting agricultural
land area, the amount of land fi ltered out by
spatial analysis (by town only), and the remain-
ing agricultural land that serves as the function-
ing agricultural footprint for this assessment.
Using the fi lters described above, this analysis
concluded the actual functioning footprint of
agricultural land in Addison County is 98,626
acres, a 26.4 percent reduction from the start-
ing 133,946 acres. As a comparison to the spa-
tial analysis performed for this study, the 2007
Census of Agriculture reports that there are
102,629 acres of harvested agricultural land in
Addison County.17
Figure 27 on page 43 shows total agricultural
land area in Addison County and the por-
tions fi ltered out using spatial analysis (in red).
The agricultural area that is showing through
represents the remaining agricultural land that
serves as the functioning agricultural footprint
for this assessment. (This is a spatial depiction
of the same results shown in the table above.)
A full-size version of this map is included as
Appendix B of this report.
Figure 28 on page 43 illustrates the makeup of
the total starting and remaining functional ag-
ricultural land area in Addison County and its
distribution between corn, hay, pasture, urban
pasture and other.
Figure 26 (opposite
page).
17 Table 9 – 2007 Census of Agriculture – County Data compiled by USDA, national Agricultural Statistics Service.
41
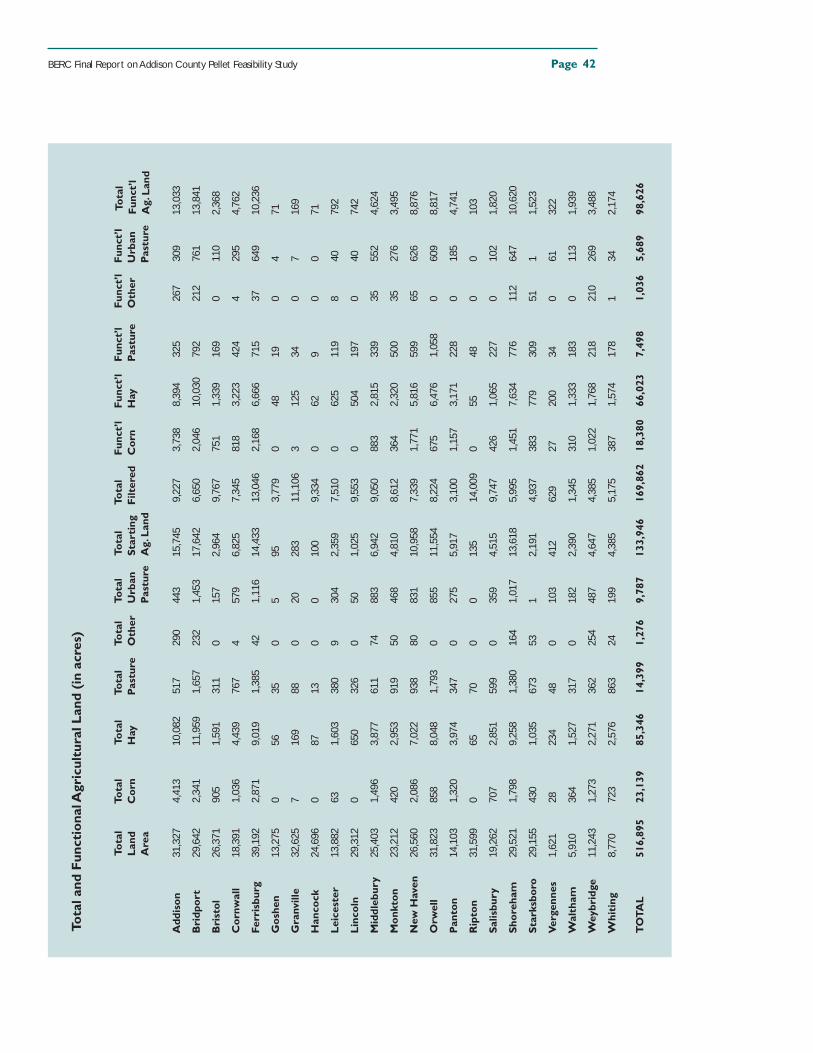
BERC Final Report on Addison County Pellet Feasibility Study Page T
ota
l an
d F
un
cti
on
al A
gri
cu
ltu
ral L
an
d (
in a
cre
s)
Add
ison
31
,327
4,
413
10,0
82
517
290
443
15,7
45
9,22
7 3,
738
8,39
4 32
5 26
7 30
9 13
,033
Bri
dpor
t 29
,642
2,
341
11,9
59
1,65
7 23
2 1,
453
17,6
42
6,65
0 2,
046
10,0
30
792
212
761
13,8
41
Bri
stol
26
,371
90
5 1,
591
311
0 15
7 2,
964
9,76
7 75
1 1,
339
169
0 11
0 2,
368
Cor
nwal
l 18
,391
1,
036
4,43
9 76
7 4
579
6,82
5 7,
345
818
3,22
3 42
4 4
295
4,76
2
Ferr
isbu
rg
39,1
92
2,87
1 9,
019
1,38
5 42
1,
116
14,4
33
13,0
46
2,16
8 6,
666
715
37
649
10,2
36
Gos
hen
13,2
75
0 56
35
0
5 95
3,
779
0 48
19
0
4 71
Gra
nvill
e 32
,625
7
169
88
0 20
28
3 11
,106
3
125
34
0 7
169
Han
cock
24
,696
0
87
13
0 0
100
9,33
4 0
62
9 0
0 71
Leic
este
r 13
,882
63
1,
603
380
9 30
4 2,
359
7,51
0 0
625
119
8 40
79
2
Linc
oln
29,3
12
0 65
0 32
6 0
50
1,02
5 9,
553
0 50
4 19
7 0
40
742
Mid
dleb
ury
25,4
03
1,49
6 3,
877
611
74
883
6,94
2 9,
050
883
2,81
5 33
9 35
55
2 4,
624
Mon
kton
23
,212
42
0 2,
953
919
50
468
4,81
0 8,
612
364
2,32
0 50
0 35
27
6 3,
495
New
Hav
en
26,5
60
2,08
6 7,
022
938
80
831
10,9
58
7,33
9 1,
771
5,81
6 59
9 65
62
6 8,
876
Orw
ell
31,8
23
858
8,04
8 1,
793
0 85
5 11
,554
8,
224
675
6,47
6 1,
058
0 60
9 8,
817
Pant
on
14,1
03
1,32
0 3,
974
347
0 27
5 5,
917
3,10
0 1,
157
3,17
1 22
8 0
185
4,74
1
Rip
ton
31,5
99
0 65
70
0
0 13
5 14
,009
0
55
48
0 0
103
Salis
bury
19
,262
70
7 2,
851
599
0 35
9 4,
515
9,74
7 42
6 1,
065
227
0 10
2 1,
820
Shor
eham
29
,521
1,
798
9,25
8 1,
380
164
1,01
7 13
,618
5,
995
1,45
1 7,
634
776
112
647
10,6
20
Star
ksbo
ro
29,1
55
430
1,03
5 67
3 53
1
2,19
1 4,
937
383
779
309
51
1 1,
523
Verg
enne
s 1,
621
28
234
48
0 10
3 41
2 62
9 27
20
0 34
0
61
322
Wal
tham
5,
910
364
1,52
7 31
7 0
182
2,39
0 1,
345
310
1,33
3 18
3 0
113
1,93
9
Wey
brid
ge
11,2
43
1,27
3 2,
271
362
254
487
4,64
7 4,
385
1,02
2 1,
768
218
210
269
3,48
8
Whi
ting
8,
770
723
2,57
6 86
3 24
19
9 4,
385
5,17
5 38
7 1,
574
178
1 34
2,
174
TO
TAL
516,
895
23,1
39
85,3
46
14,3
99
1,27
6 9,
787
133,
946
169,
862
18,3
80
66,0
23
7,49
8 1,
036
5,68
9 98
,626
Tot
al
Func
t’l
Ag.
Lan
d
Tota
l La
nd
Are
a
Tota
l C
orn
Tota
l H
ayTo
tal
Past
ure
Tota
l O
ther
Tota
l U
rban
Pa
stur
e
Tota
l St
arti
ng
Ag.
Lan
d
Tota
l Fi
lter
edFu
nct’
l C
orn
Func
t’l
Hay
Func
t’l
Past
ure
Func
t’l
Oth
erFu
nct’
l U
rban
Pa
stur
e
42
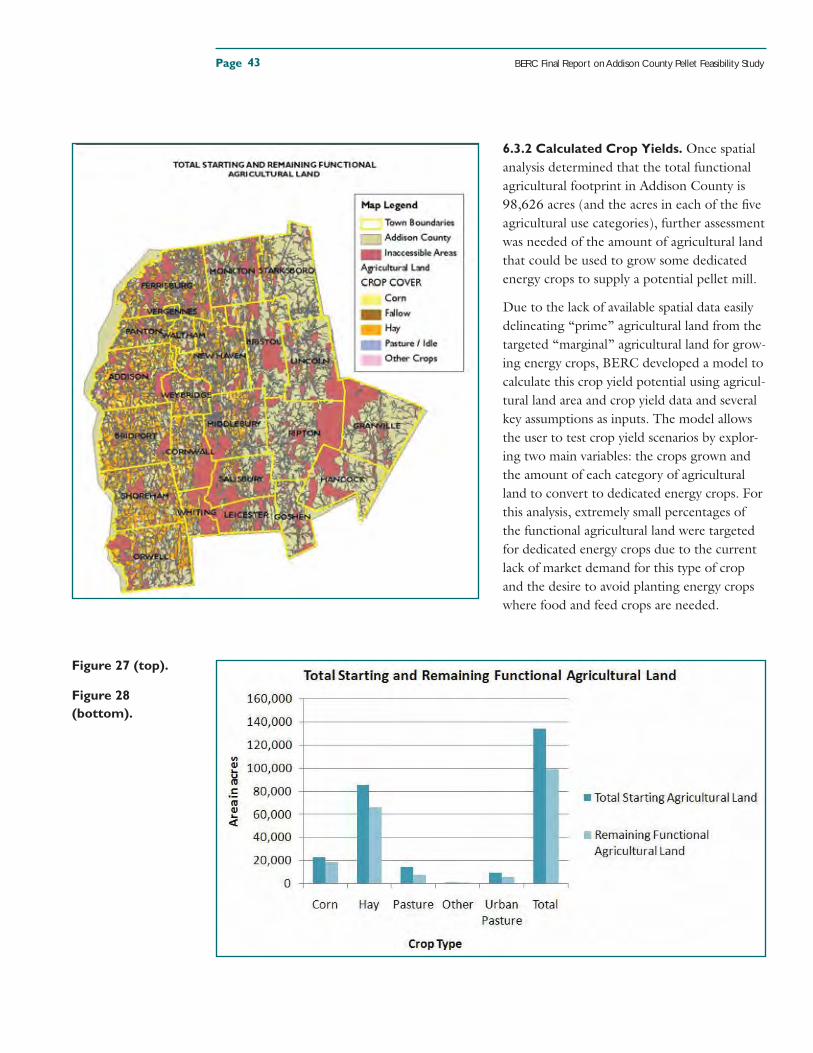
Page BERC Final Report on Addison County Pellet Feasibility Study
6.3.2 Calculated Crop Yields. Once spatial
analysis determined that the total functional
agricultural footprint in Addison County is
98,626 acres (and the acres in each of the fi ve
agricultural use categories), further assessment
was needed of the amount of agricultural land
that could be used to grow some dedicated
energy crops to supply a potential pellet mill.
Due to the lack of available spatial data easily
delineating “prime” agricultural land from the
targeted “marginal” agricultural land for grow-
ing energy crops, BERC developed a model to
calculate this crop yield potential using agricul-
tural land area and crop yield data and several
key assumptions as inputs. The model allows
the user to test crop yield scenarios by explor-
ing two main variables: the crops grown and
the amount of each category of agricultural
land to convert to dedicated energy crops. For
this analysis, extremely small percentages of
the functional agricultural land were targeted
for dedicated energy crops due to the current
lack of market demand for this type of crop
and the desire to avoid planting energy crops
where food and feed crops are needed.
Figure 27 (top).
Figure 28
(bottom).
43
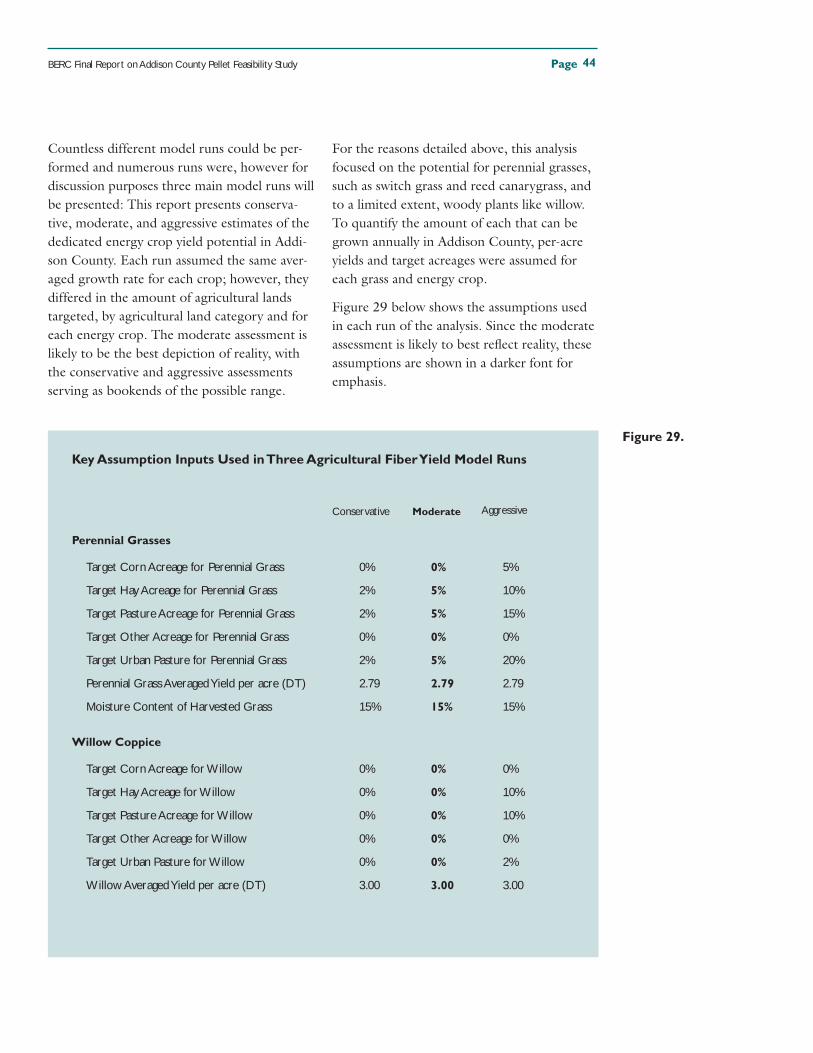
BERC Final Report on Addison County Pellet Feasibility Study Page
Countless different model runs could be per-
formed and numerous runs were, however for
discussion purposes three main model runs will
be presented: This report presents conserva-
tive, moderate, and aggressive estimates of the
dedicated energy crop yield potential in Addi-
son County. Each run assumed the same aver-
aged growth rate for each crop; however, they
differed in the amount of agricultural lands
targeted, by agricultural land category and for
each energy crop. The moderate assessment is
likely to be the best depiction of reality, with
the conservative and aggressive assessments
serving as bookends of the possible range.
For the reasons detailed above, this analysis
focused on the potential for perennial grasses,
such as switch grass and reed canarygrass, and
to a limited extent, woody plants like willow.
To quantify the amount of each that can be
grown annually in Addison County, per-acre
yields and target acreages were assumed for
each grass and energy crop.
Figure 29 below shows the assumptions used
in each run of the analysis. Since the moderate
assessment is likely to best refl ect reality, these
assumptions are shown in a darker font for
emphasis.
Key Assumption Inputs Used in Three Agricultural Fiber Yield Model Runs
Perennial Grasses
Target Corn Acreage for Perennial Grass 0% 0% 5%
Target Hay Acreage for Perennial Grass 2% 5% 10%
Target Pasture Acreage for Perennial Grass 2% 5% 15%
Target Other Acreage for Perennial Grass 0% 0% 0%
Target Urban Pasture for Perennial Grass 2% 5% 20%
Perennial Grass Averaged Yield per acre (DT) 2.79 2.79 2.79
Moisture Content of Harvested Grass 15% 15% 15%
Willow Coppice
Target Corn Acreage for Willow 0% 0% 0%
Target Hay Acreage for Willow 0% 0% 10%
Target Pasture Acreage for Willow 0% 0% 10%
Target Other Acreage for Willow 0% 0% 0%
Target Urban Pasture for Willow 0% 0% 2%
Willow Averaged Yield per acre (DT) 3.00 3.00 3.00
Figure 29.
AggressiveConservative Moderate
44
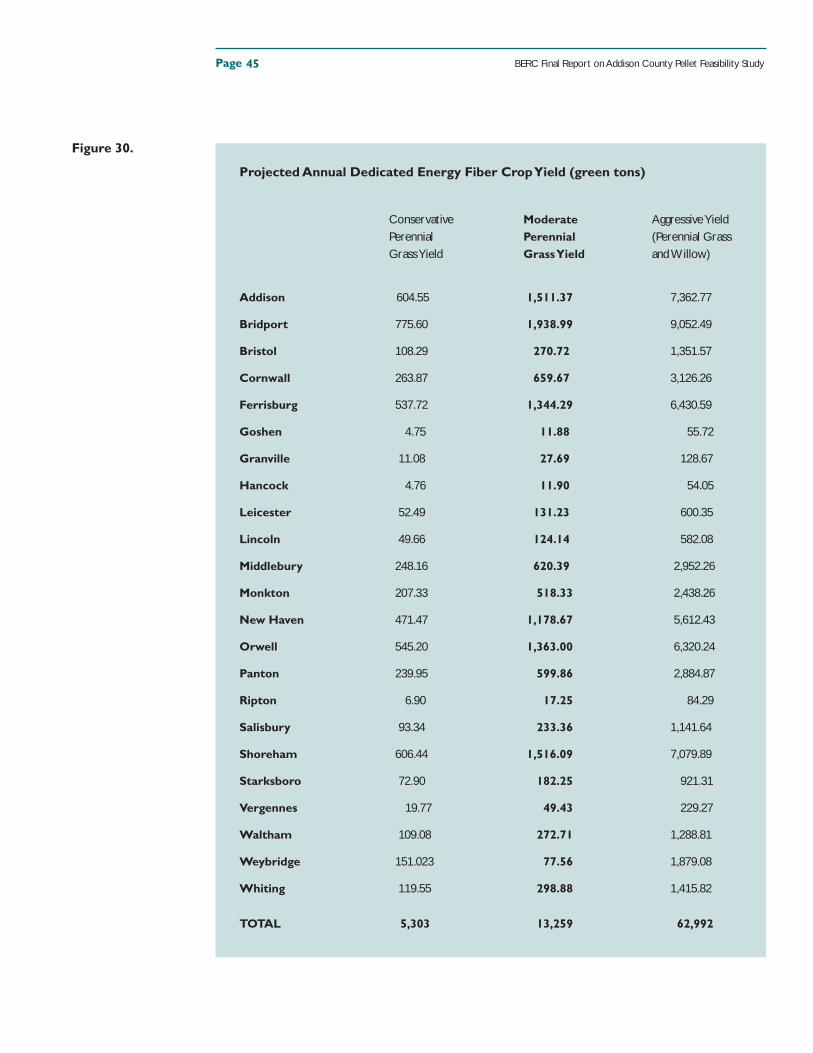
Page BERC Final Report on Addison County Pellet Feasibility Study
Projected Annual Dedicated Energy Fiber Crop Yield (green tons)
Addison 604.55 1,511.37 7,362.77
Bridport 775.60 1,938.99 9,052.49
Bristol 108.29 270.72 1,351.57
Cornwall 263.87 659.67 3,126.26
Ferrisburg 537.72 1,344.29 6,430.59
Goshen 4.75 11.88 55.72
Granville 11.08 27.69 128.67
Hancock 4.76 11.90 54.05
Leicester 52.49 131.23 600.35
Lincoln 49.66 124.14 582.08
Middlebury 248.16 620.39 2,952.26
Monkton 207.33 518.33 2,438.26
New Haven 471.47 1,178.67 5,612.43
Orwell 545.20 1,363.00 6,320.24
Panton 239.95 599.86 2,884.87
Ripton 6.90 17.25 84.29
Salisbury 93.34 233.36 1,141.64
Shoreham 606.44 1,516.09 7,079.89
Starksboro 72.90 182.25 921.31
Vergennes 19.77 49.43 229.27
Waltham 109.08 272.71 1,288.81
Weybridge 151.023 77.56 1,879.08
Whiting 119.55 298.88 1,415.82
TOTAL 5,303 13,259 62,992
Figure 30.
Conservative Perennial Grass Yield
Moderate Perennial Grass Yield
Aggressive Yield (Perennial Grass and Willow)
45
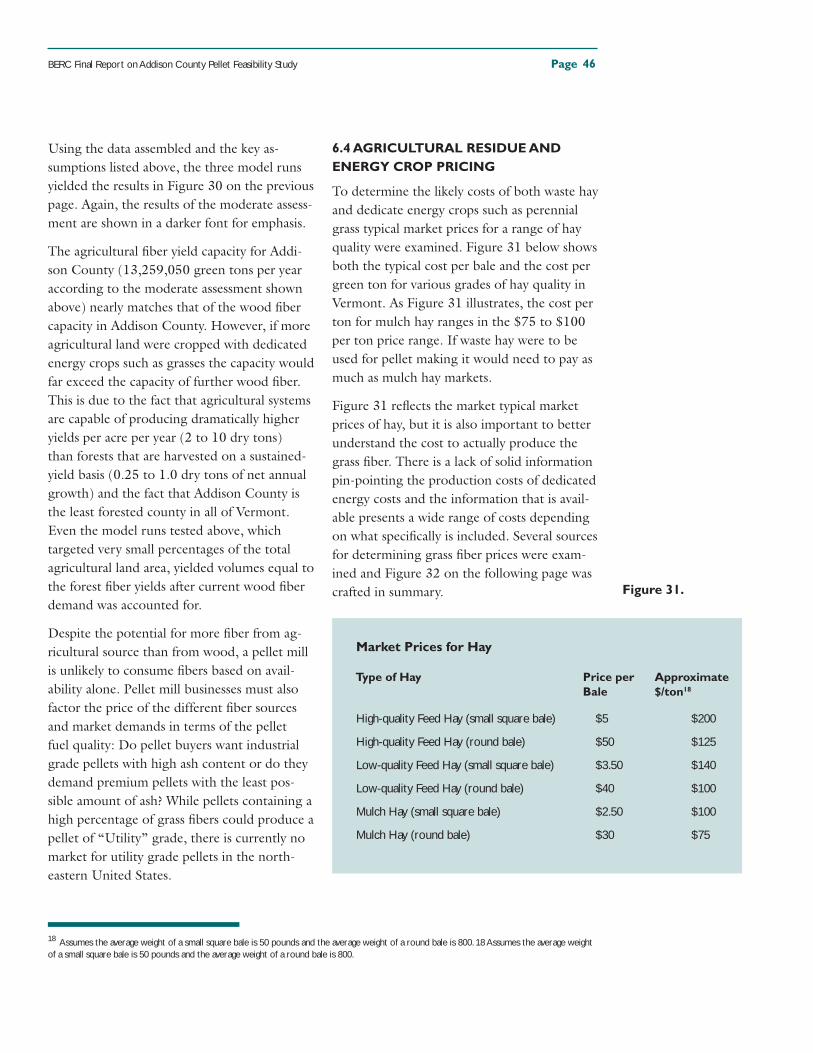
BERC Final Report on Addison County Pellet Feasibility Study Page
Using the data assembled and the key as-
sumptions listed above, the three model runs
yielded the results in Figure 30 on the previous
page. Again, the results of the moderate assess-
ment are shown in a darker font for emphasis.
The agricultural fi ber yield capacity for Addi-
son County (13,259,050 green tons per year
according to the moderate assessment shown
above) nearly matches that of the wood fi ber
capacity in Addison County. However, if more
agricultural land were cropped with dedicated
energy crops such as grasses the capacity would
far exceed the capacity of further wood fi ber.
This is due to the fact that agricultural systems
are capable of producing dramatically higher
yields per acre per year (2 to 10 dry tons)
than forests that are harvested on a sustained-
yield basis (0.25 to 1.0 dry tons of net annual
growth) and the fact that Addison County is
the least forested county in all of Vermont.
Even the model runs tested above, which
targeted very small percentages of the total
agricultural land area, yielded volumes equal to
the forest fi ber yields after current wood fi ber
demand was accounted for.
Despite the potential for more fi ber from ag-
ricultural source than from wood, a pellet mill
is unlikely to consume fi bers based on avail-
ability alone. Pellet mill businesses must also
factor the price of the different fi ber sources
and market demands in terms of the pellet
fuel quality: Do pellet buyers want industrial
grade pellets with high ash content or do they
demand premium pellets with the least pos-
sible amount of ash? While pellets containing a
high percentage of grass fi bers could produce a
pellet of “Utility” grade, there is currently no
market for utility grade pellets in the north-
eastern United States.
6.4 AGRICULTURAL RESIDUE AND
ENERGY CROP PRICING
To determine the likely costs of both waste hay
and dedicate energy crops such as perennial
grass typical market prices for a range of hay
quality were examined. Figure 31 below shows
both the typical cost per bale and the cost per
green ton for various grades of hay quality in
Vermont. As Figure 31 illustrates, the cost per
ton for mulch hay ranges in the $75 to $100
per ton price range. If waste hay were to be
used for pellet making it would need to pay as
much as mulch hay markets.
Figure 31 refl ects the market typical market
prices of hay, but it is also important to better
understand the cost to actually produce the
grass fi ber. There is a lack of solid information
pin-pointing the production costs of dedicated
energy costs and the information that is avail-
able presents a wide range of costs depending
on what specifi cally is included. Several sources
for determining grass fi ber prices were exam-
ined and Figure 32 on the following page was
crafted in summary.
Market Prices for Hay
High-quality Feed Hay (small square bale) $5 $200
High-quality Feed Hay (round bale) $50 $125
Low-quality Feed Hay (small square bale) $3.50 $140
Low-quality Feed Hay (round bale) $40 $100
Mulch Hay (small square bale) $2.50 $100
Mulch Hay (round bale) $30 $75
Figure 31.
18 Assumes the average weight of a small square bale is 50 pounds and the average weight of a round bale is 800. 18 Assumes the average weight of a small square bale is 50 pounds and the average weight of a round bale is 800.
Approximate $/ton18
Price per Bale
Type of Hay
46
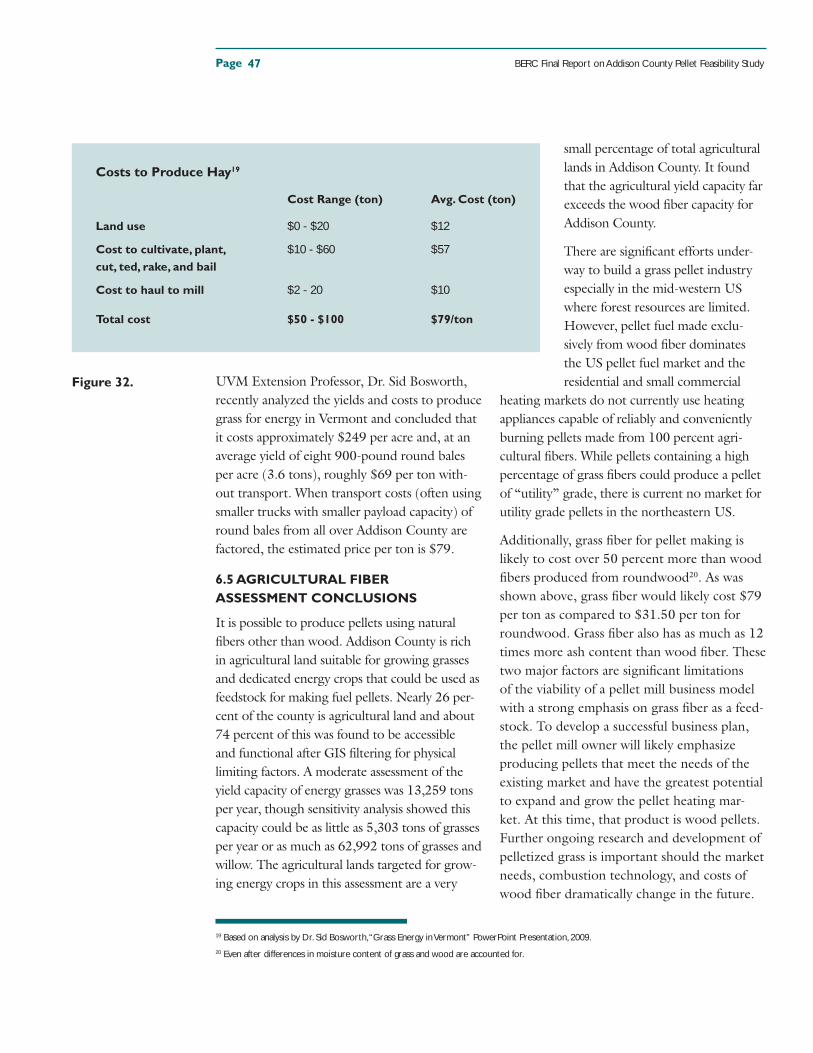
Page BERC Final Report on Addison County Pellet Feasibility Study
Costs to Produce Hay19
Cost Range (ton) Avg. Cost (ton)
Land use $0 - $20 $12
Cost to cultivate, plant, $10 - $60 $57cut, ted, rake, and bail
Cost to haul to mill $2 - 20 $10
Total cost $50 - $100 $79/ton
Figure 32. UVM Extension Professor, Dr. Sid Bosworth,
recently analyzed the yields and costs to produce
grass for energy in Vermont and concluded that
it costs approximately $249 per acre and, at an
average yield of eight 900-pound round bales
per acre (3.6 tons), roughly $69 per ton with-
out transport. When transport costs (often using
smaller trucks with smaller payload capacity) of
round bales from all over Addison County are
factored, the estimated price per ton is $79.
6.5 AGRICULTURAL FIBER
ASSESSMENT CONCLUSIONS
It is possible to produce pellets using natural
fi bers other than wood. Addison County is rich
in agricultural land suitable for growing grasses
and dedicated energy crops that could be used as
feedstock for making fuel pellets. Nearly 26 per-
cent of the county is agricultural land and about
74 percent of this was found to be accessible
and functional after GIS fi ltering for physical
limiting factors. A moderate assessment of the
yield capacity of energy grasses was 13,259 tons
per year, though sensitivity analysis showed this
capacity could be as little as 5,303 tons of grasses
per year or as much as 62,992 tons of grasses and
willow. The agricultural lands targeted for grow-
ing energy crops in this assessment are a very
small percentage of total agricultural
lands in Addison County. It found
that the agricultural yield capacity far
exceeds the wood fi ber capacity for
Addison County.
There are signifi cant efforts under-
way to build a grass pellet industry
especially in the mid-western US
where forest resources are limited.
However, pellet fuel made exclu-
sively from wood fi ber dominates
the US pellet fuel market and the
residential and small commercial
heating markets do not currently use heating
appliances capable of reliably and conveniently
burning pellets made from 100 percent agri-
cultural fi bers. While pellets containing a high
percentage of grass fi bers could produce a pellet
of “utility” grade, there is current no market for
utility grade pellets in the northeastern US.
Additionally, grass fi ber for pellet making is
likely to cost over 50 percent more than wood
fi bers produced from roundwood20. As was
shown above, grass fi ber would likely cost $79
per ton as compared to $31.50 per ton for
roundwood. Grass fi ber also has as much as 12
times more ash content than wood fi ber. These
two major factors are signifi cant limitations
of the viability of a pellet mill business model
with a strong emphasis on grass fi ber as a feed-
stock. To develop a successful business plan,
the pellet mill owner will likely emphasize
producing pellets that meet the needs of the
existing market and have the greatest potential
to expand and grow the pellet heating mar-
ket. At this time, that product is wood pellets.
Further ongoing research and development of
pelletized grass is important should the market
needs, combustion technology, and costs of
wood fi ber dramatically change in the future.
19 Based on analysis by Dr. Sid Bosworth, “Grass Energy in Vermont” PowerPoint Presentation, 2009.20 Even after differences in moisture content of grass and wood are accounted for.
47
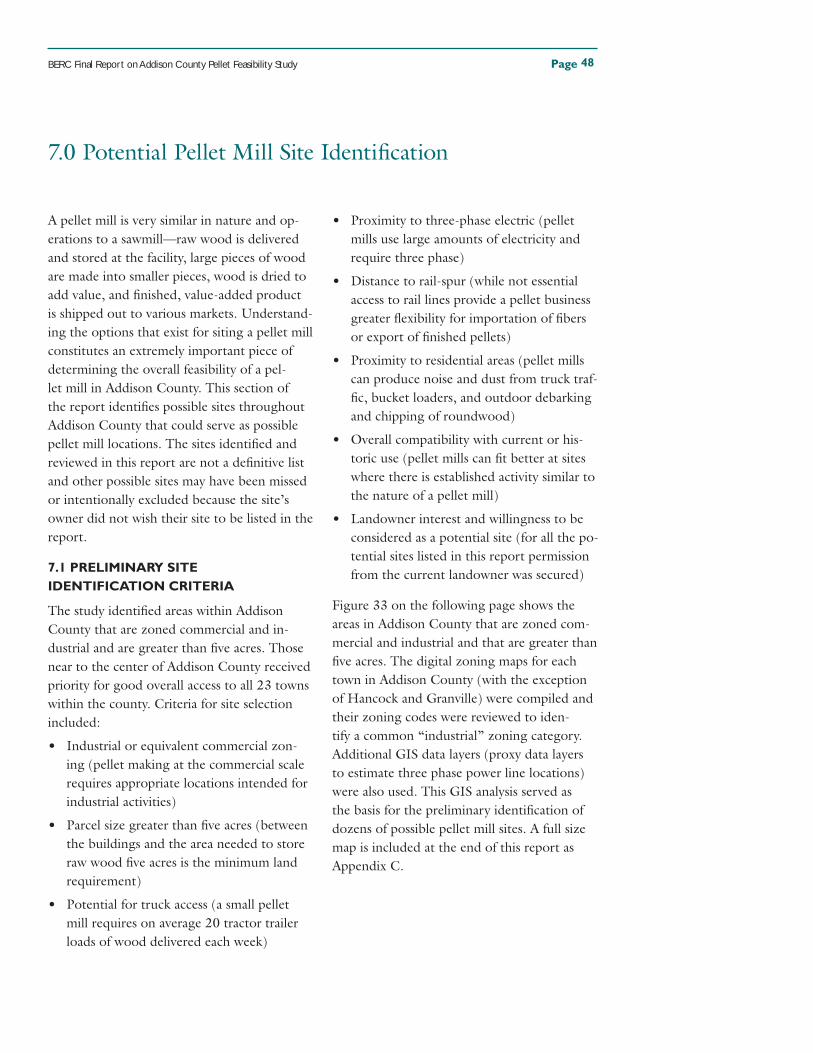
BERC Final Report on Addison County Pellet Feasibility Study Page
A pellet mill is very similar in nature and op-
erations to a sawmill—raw wood is delivered
and stored at the facility, large pieces of wood
are made into smaller pieces, wood is dried to
add value, and fi nished, value-added product
is shipped out to various markets. Understand-
ing the options that exist for siting a pellet mill
constitutes an extremely important piece of
determining the overall feasibility of a pel-
let mill in Addison County. This section of
the report identifi es possible sites throughout
Addison County that could serve as possible
pellet mill locations. The sites identifi ed and
reviewed in this report are not a defi nitive list
and other possible sites may have been missed
or intentionally excluded because the site’s
owner did not wish their site to be listed in the
report.
7.1 PRELIMINARY SITE
IDENTIFICATION CRITERIA
The study identifi ed areas within Addison
County that are zoned commercial and in-
dustrial and are greater than fi ve acres. Those
near to the center of Addison County received
priority for good overall access to all 23 towns
within the county. Criteria for site selection
included:
• Industrial or equivalent commercial zon-
ing (pellet making at the commercial scale
requires appropriate locations intended for
industrial activities)
• Parcel size greater than fi ve acres (between
the buildings and the area needed to store
raw wood fi ve acres is the minimum land
requirement)
• Potential for truck access (a small pellet
mill requires on average 20 tractor trailer
loads of wood delivered each week)
• Proximity to three-phase electric (pellet
mills use large amounts of electricity and
require three phase)
• Distance to rail-spur (while not essential
access to rail lines provide a pellet business
greater fl exibility for importation of fi bers
or export of fi nished pellets)
• Proximity to residential areas (pellet mills
can produce noise and dust from truck traf-
fi c, bucket loaders, and outdoor debarking
and chipping of roundwood)
• Overall compatibility with current or his-
toric use (pellet mills can fi t better at sites
where there is established activity similar to
the nature of a pellet mill)
• Landowner interest and willingness to be
considered as a potential site (for all the po-
tential sites listed in this report permission
from the current landowner was secured)
Figure 33 on the following page shows the
areas in Addison County that are zoned com-
mercial and industrial and that are greater than
fi ve acres. The digital zoning maps for each
town in Addison County (with the exception
of Hancock and Granville) were compiled and
their zoning codes were reviewed to iden-
tify a common “industrial” zoning category.
Additional GIS data layers (proxy data layers
to estimate three phase power line locations)
were also used. This GIS analysis served as
the basis for the preliminary identifi cation of
dozens of possible pellet mill sites. A full size
map is included at the end of this report as
Appendix C.
7.0 Potential Pellet Mill Site Identifi cation
48
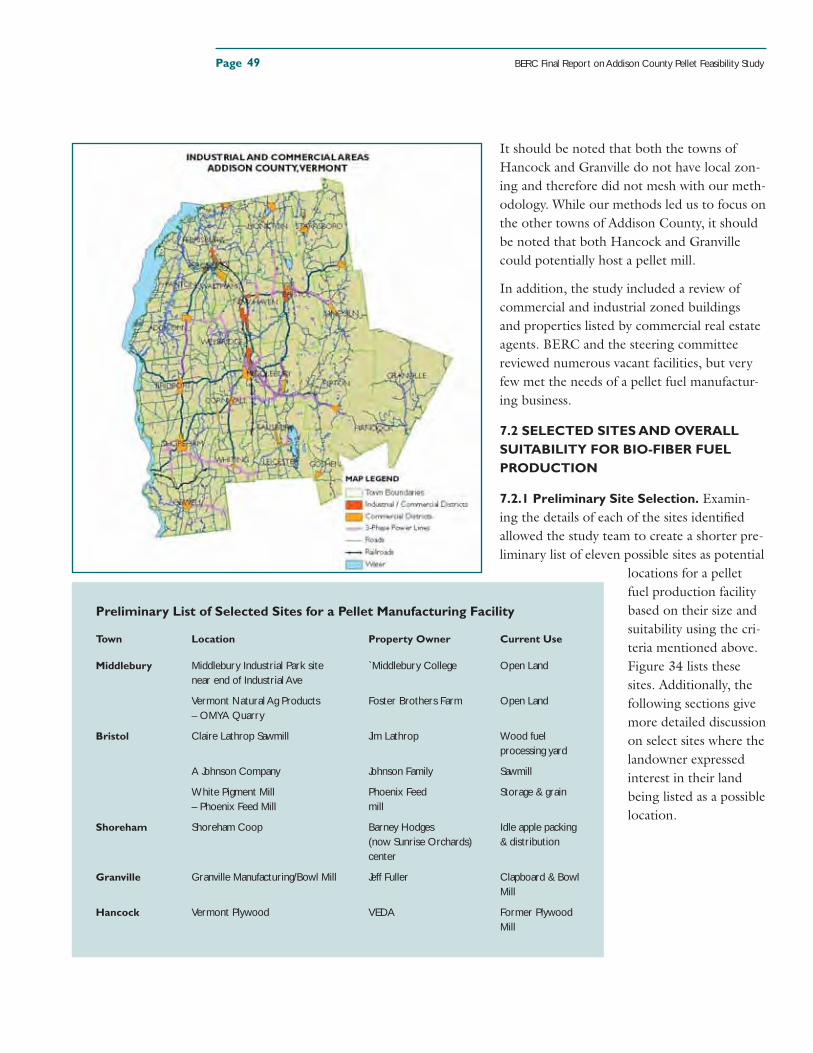
Page BERC Final Report on Addison County Pellet Feasibility Study
It should be noted that both the towns of
Hancock and Granville do not have local zon-
ing and therefore did not mesh with our meth-
odology. While our methods led us to focus on
the other towns of Addison County, it should
be noted that both Hancock and Granville
could potentially host a pellet mill.
In addition, the study included a review of
commercial and industrial zoned buildings
and properties listed by commercial real estate
agents. BERC and the steering committee
reviewed numerous vacant facilities, but very
few met the needs of a pellet fuel manufactur-
ing business.
7.2 SELECTED SITES AND OVERALL
SUITABILITY FOR BIO-FIBER FUEL
PRODUCTION
7.2.1 Preliminary Site Selection. Examin-
ing the details of each of the sites identifi ed
allowed the study team to create a shorter pre-
liminary list of eleven possible sites as potential
locations for a pellet
fuel production facility
based on their size and
suitability using the cri-
teria mentioned above.
Figure 34 lists these
sites. Additionally, the
following sections give
more detailed discussion
on select sites where the
landowner expressed
interest in their land
being listed as a possible
location.
Preliminary List of Selected Sites for a Pellet Manufacturing Facility
Town Location Property Owner Current Use
Middlebury Middlebury Industrial Park site `Middlebury College Open Land near end of Industrial Ave
Vermont Natural Ag Products Foster Brothers Farm Open Land – OMYA Quarry
Bristol Claire Lathrop Sawmill Jim Lathrop Wood fuel processing yard
A Johnson Company Johnson Family Sawmill
White Pigment Mill Phoenix Feed Storage & grain – Phoenix Feed Mill mill
Shoreham Shoreham Coop Barney Hodges Idle apple packing (now Sunrise Orchards) & distribution center
Granville Granville Manufacturing/Bowl Mill Jeff Fuller Clapboard & Bowl Mill
Hancock Vermont Plywood VEDA Former Plywood Mill
49
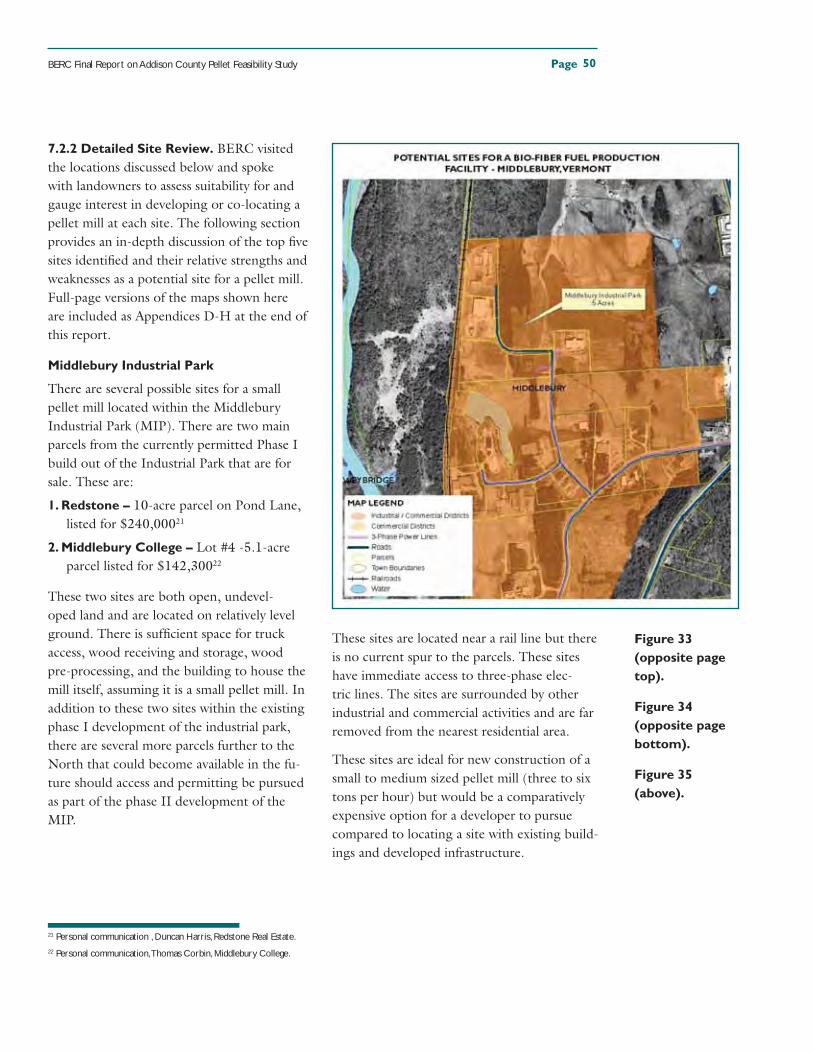
BERC Final Report on Addison County Pellet Feasibility Study Page
Figure 33
(opposite page
top).
Figure 34
(opposite page
bottom).
Figure 35
(above).
7.2.2 Detailed Site Review. BERC visited
the locations discussed below and spoke
with landowners to assess suitability for and
gauge interest in developing or co-locating a
pellet mill at each site. The following section
provides an in-depth discussion of the top fi ve
sites identifi ed and their relative strengths and
weaknesses as a potential site for a pellet mill.
Full-page versions of the maps shown here
are included as Appendices D-H at the end of
this report.
Middlebury Industrial Park
There are several possible sites for a small
pellet mill located within the Middlebury
Industrial Park (MIP). There are two main
parcels from the currently permitted Phase I
build out of the Industrial Park that are for
sale. These are:
1. Redstone – 10-acre parcel on Pond Lane,
listed for $240,00021
2. Middlebury College – Lot #4 -5.1-acre
parcel listed for $142,30022
These two sites are both open, undevel-
oped land and are located on relatively level
ground. There is suffi cient space for truck
access, wood receiving and storage, wood
pre-processing, and the building to house the
mill itself, assuming it is a small pellet mill. In
addition to these two sites within the existing
phase I development of the industrial park,
there are several more parcels further to the
North that could become available in the fu-
ture should access and permitting be pursued
as part of the phase II development of the
MIP.
These sites are located near a rail line but there
is no current spur to the parcels. These sites
have immediate access to three-phase elec-
tric lines. The sites are surrounded by other
industrial and commercial activities and are far
removed from the nearest residential area.
These sites are ideal for new construction of a
small to medium sized pellet mill (three to six
tons per hour) but would be a comparatively
expensive option for a developer to pursue
compared to locating a site with existing build-
ings and developed infrastructure.
21 Personal communication , Duncan Harris, Redstone Real Estate.22 Personal communication, Thomas Corbin, Middlebury College.
50
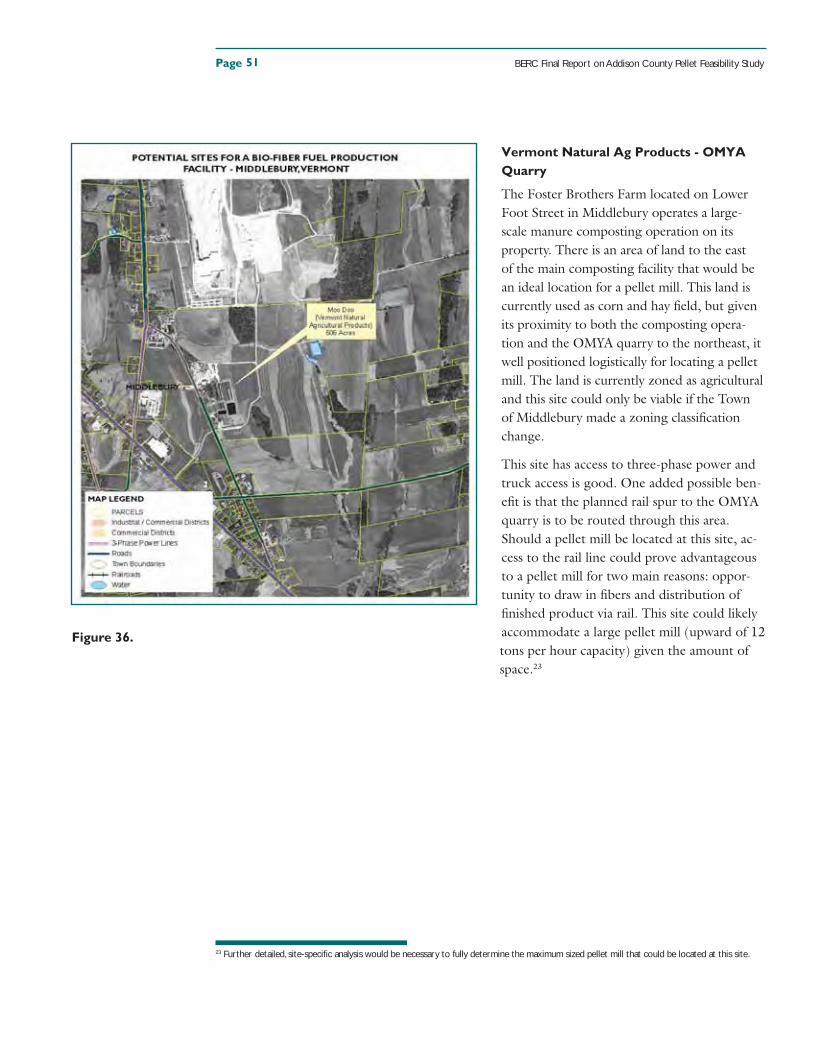
Page BERC Final Report on Addison County Pellet Feasibility Study
Vermont Natural Ag Products - OMYA
Quarry
The Foster Brothers Farm located on Lower
Foot Street in Middlebury operates a large-
scale manure composting operation on its
property. There is an area of land to the east
of the main composting facility that would be
an ideal location for a pellet mill. This land is
currently used as corn and hay fi eld, but given
its proximity to both the composting opera-
tion and the OMYA quarry to the northeast, it
well positioned logistically for locating a pellet
mill. The land is currently zoned as agricultural
and this site could only be viable if the Town
of Middlebury made a zoning classifi cation
change.
This site has access to three-phase power and
truck access is good. One added possible ben-
efi t is that the planned rail spur to the OMYA
quarry is to be routed through this area.
Should a pellet mill be located at this site, ac-
cess to the rail line could prove advantageous
to a pellet mill for two main reasons: oppor-
tunity to draw in fi bers and distribution of
fi nished product via rail. This site could likely
accommodate a large pellet mill (upward of 12
tons per hour capacity) given the amount of
space.23
23 Further detailed, site-specifi c analysis would be necessary to fully determine the maximum sized pellet mill that could be located at this site.
51
Figure 36.
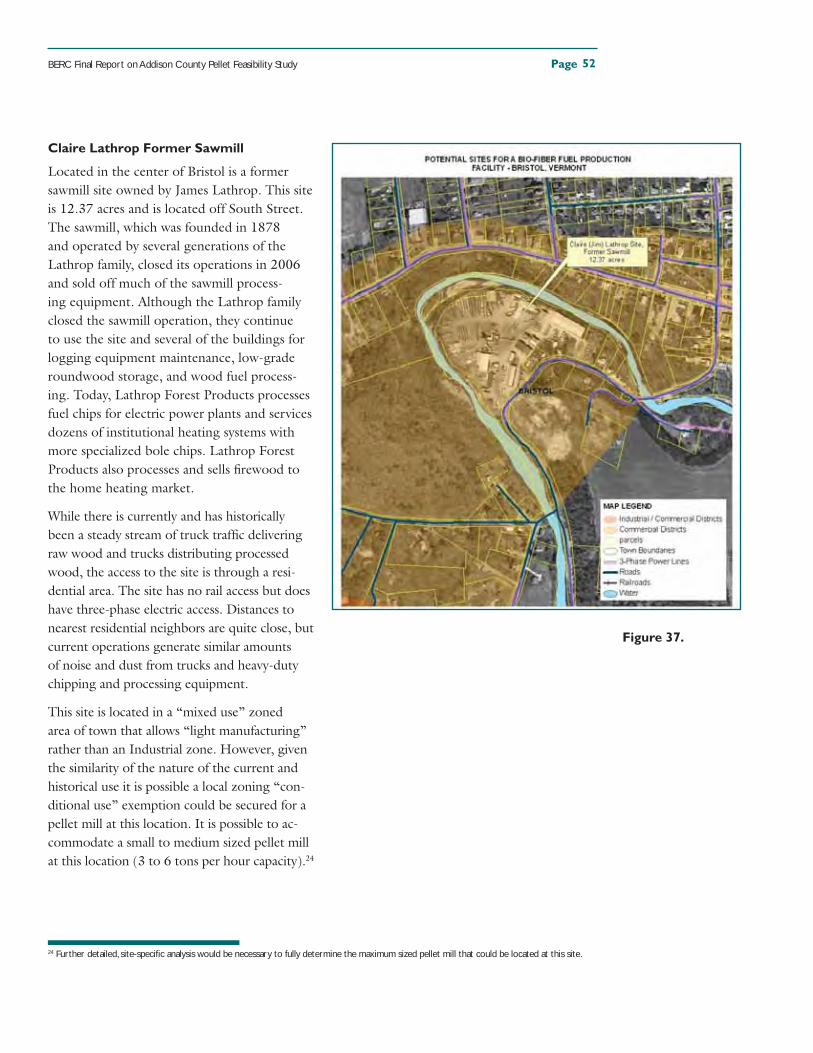
BERC Final Report on Addison County Pellet Feasibility Study Page
Claire Lathrop Former Sawmill
Located in the center of Bristol is a former
sawmill site owned by James Lathrop. This site
is 12.37 acres and is located off South Street.
The sawmill, which was founded in 1878
and operated by several generations of the
Lathrop family, closed its operations in 2006
and sold off much of the sawmill process-
ing equipment. Although the Lathrop family
closed the sawmill operation, they continue
to use the site and several of the buildings for
logging equipment maintenance, low-grade
roundwood storage, and wood fuel process-
ing. Today, Lathrop Forest Products processes
fuel chips for electric power plants and services
dozens of institutional heating systems with
more specialized bole chips. Lathrop Forest
Products also processes and sells fi rewood to
the home heating market.
While there is currently and has historically
been a steady stream of truck traffi c delivering
raw wood and trucks distributing processed
wood, the access to the site is through a resi-
dential area. The site has no rail access but does
have three-phase electric access. Distances to
nearest residential neighbors are quite close, but
current operations generate similar amounts
of noise and dust from trucks and heavy-duty
chipping and processing equipment.
This site is located in a “mixed use” zoned
area of town that allows “light manufacturing”
rather than an Industrial zone. However, given
the similarity of the nature of the current and
historical use it is possible a local zoning “con-
ditional use” exemption could be secured for a
pellet mill at this location. It is possible to ac-
commodate a small to medium sized pellet mill
at this location (3 to 6 tons per hour capacity).24
24 Further detailed, site-specifi c analysis would be necessary to fully determine the maximum sized pellet mill that could be located at this site.
52
Figure 37.
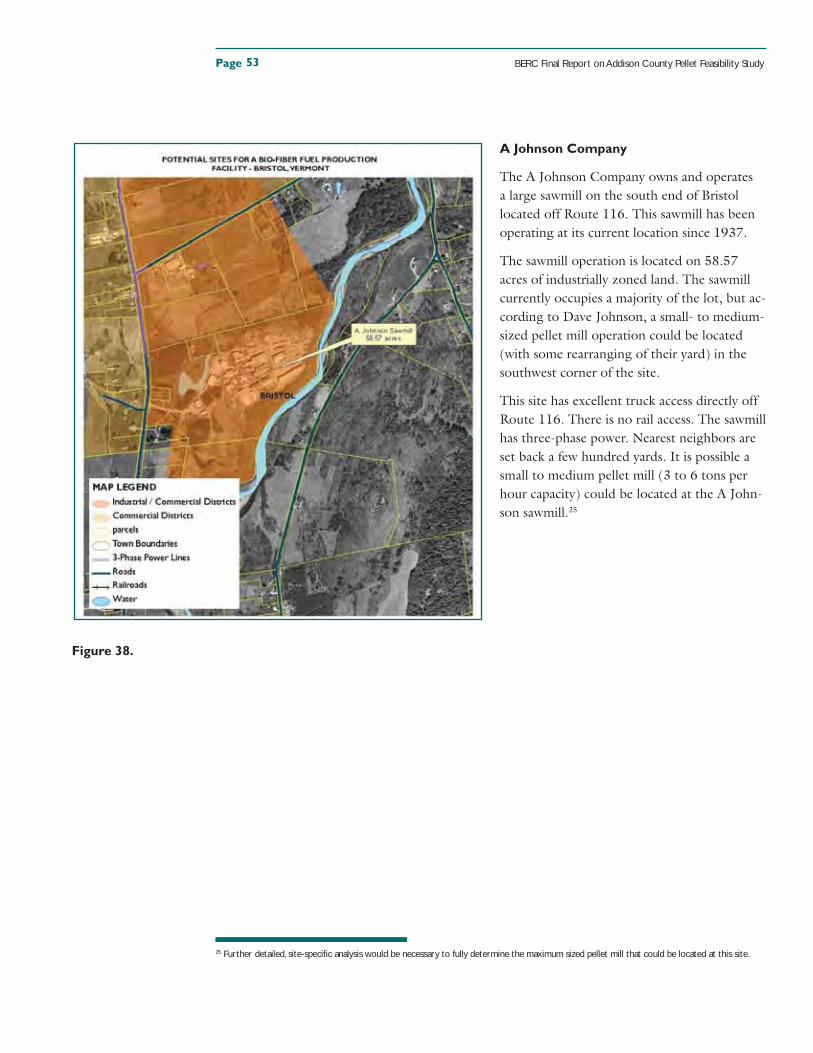
Page BERC Final Report on Addison County Pellet Feasibility Study
A Johnson Company
The A Johnson Company owns and operates
a large sawmill on the south end of Bristol
located off Route 116. This sawmill has been
operating at its current location since 1937.
The sawmill operation is located on 58.57
acres of industrially zoned land. The sawmill
currently occupies a majority of the lot, but ac-
cording to Dave Johnson, a small- to medium-
sized pellet mill operation could be located
(with some rearranging of their yard) in the
southwest corner of the site.
This site has excellent truck access directly off
Route 116. There is no rail access. The sawmill
has three-phase power. Nearest neighbors are
set back a few hundred yards. It is possible a
small to medium pellet mill (3 to 6 tons per
hour capacity) could be located at the A John-
son sawmill.25
25 Further detailed, site-specifi c analysis would be necessary to fully determine the maximum sized pellet mill that could be located at this site.
53
Figure 38.
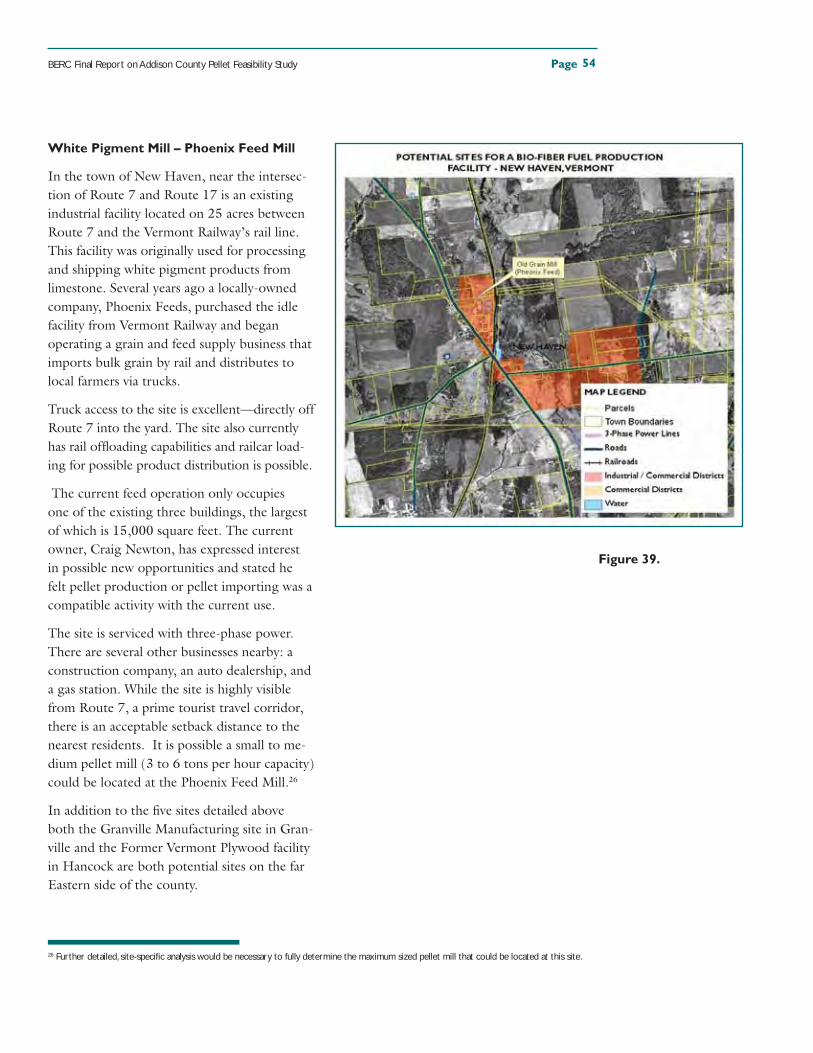
BERC Final Report on Addison County Pellet Feasibility Study Page
White Pigment Mill – Phoenix Feed Mill
In the town of New Haven, near the intersec-
tion of Route 7 and Route 17 is an existing
industrial facility located on 25 acres between
Route 7 and the Vermont Railway’s rail line.
This facility was originally used for processing
and shipping white pigment products from
limestone. Several years ago a locally-owned
company, Phoenix Feeds, purchased the idle
facility from Vermont Railway and began
operating a grain and feed supply business that
imports bulk grain by rail and distributes to
local farmers via trucks.
Truck access to the site is excellent—directly off
Route 7 into the yard. The site also currently
has rail offl oading capabilities and railcar load-
ing for possible product distribution is possible.
The current feed operation only occupies
one of the existing three buildings, the largest
of which is 15,000 square feet. The current
owner, Craig Newton, has expressed interest
in possible new opportunities and stated he
felt pellet production or pellet importing was a
compatible activity with the current use.
The site is serviced with three-phase power.
There are several other businesses nearby: a
construction company, an auto dealership, and
a gas station. While the site is highly visible
from Route 7, a prime tourist travel corridor,
there is an acceptable setback distance to the
nearest residents. It is possible a small to me-
dium pellet mill (3 to 6 tons per hour capacity)
could be located at the Phoenix Feed Mill.26
In addition to the fi ve sites detailed above
both the Granville Manufacturing site in Gran-
ville and the Former Vermont Plywood facility
in Hancock are both potential sites on the far
Eastern side of the county.
26 Further detailed, site-specifi c analysis would be necessary to fully determine the maximum sized pellet mill that could be located at this site.
54
Figure 39.
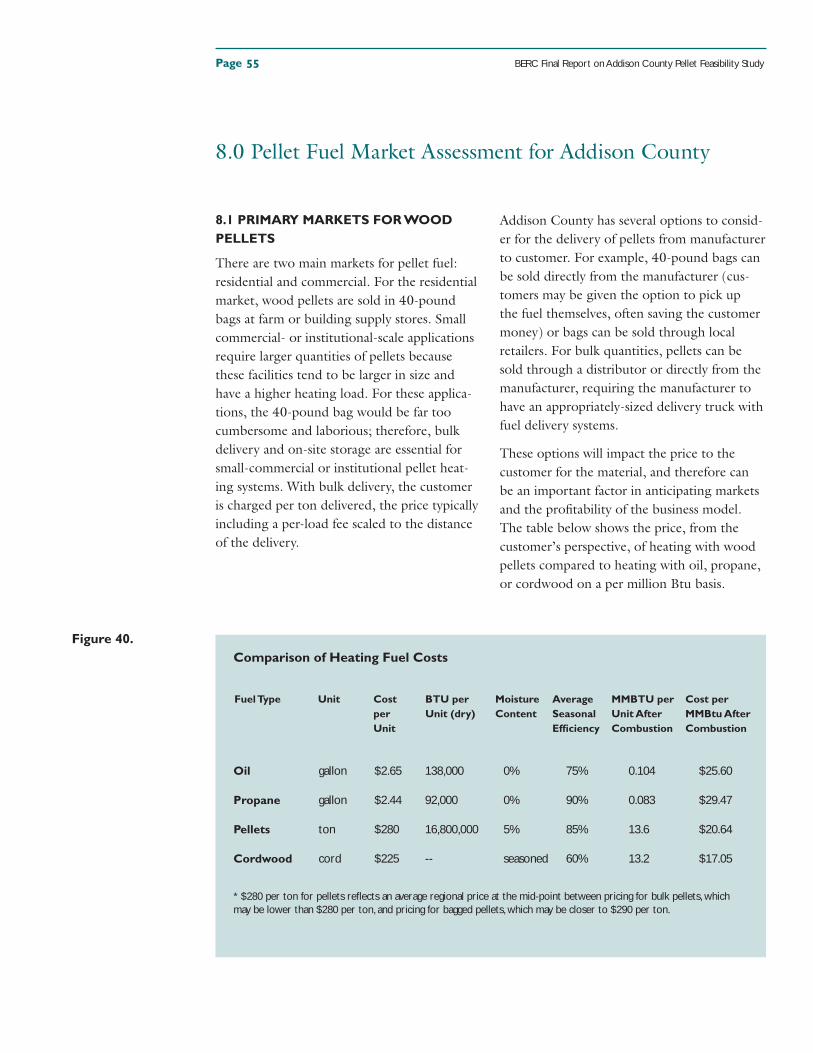
Page BERC Final Report on Addison County Pellet Feasibility Study
8.1 PRIMARY MARKETS FOR WOOD
PELLETS
There are two main markets for pellet fuel:
residential and commercial. For the residential
market, wood pellets are sold in 40-pound
bags at farm or building supply stores. Small
commercial- or institutional-scale applications
require larger quantities of pellets because
these facilities tend to be larger in size and
have a higher heating load. For these applica-
tions, the 40-pound bag would be far too
cumbersome and laborious; therefore, bulk
delivery and on-site storage are essential for
small-commercial or institutional pellet heat-
ing systems. With bulk delivery, the customer
is charged per ton delivered, the price typically
including a per-load fee scaled to the distance
of the delivery.
Addison County has several options to consid-
er for the delivery of pellets from manufacturer
to customer. For example, 40-pound bags can
be sold directly from the manufacturer (cus-
tomers may be given the option to pick up
the fuel themselves, often saving the customer
money) or bags can be sold through local
retailers. For bulk quantities, pellets can be
sold through a distributor or directly from the
manufacturer, requiring the manufacturer to
have an appropriately-sized delivery truck with
fuel delivery systems.
These options will impact the price to the
customer for the material, and therefore can
be an important factor in anticipating markets
and the profi tability of the business model.
The table below shows the price, from the
customer’s perspective, of heating with wood
pellets compared to heating with oil, propane,
or cordwood on a per million Btu basis.
8.0 Pellet Fuel Market Assessment for Addison County
Comparison of Heating Fuel Costs
Oil gallon $2.65 138,000 0% 75% 0.104 $25.60
Propane gallon $2.44 92,000 0% 90% 0.083 $29.47
Pellets ton $280 16,800,000 5% 85% 13.6 $20.64
Cordwood cord $225 -- seasoned 60% 13.2 $17.05
* $280 per ton for pellets refl ects an average regional price at the mid-point between pricing for bulk pellets, which may be lower than $280 per ton, and pricing for bagged pellets, which may be closer to $290 per ton.
Figure 40.
Cost per Unit
Fuel Type Unit Cost per MMBtu After Combustion
MMBTU per Unit After Combustion
Average Seasonal Effi ciency
Moisture Content
BTU per Unit (dry)
55
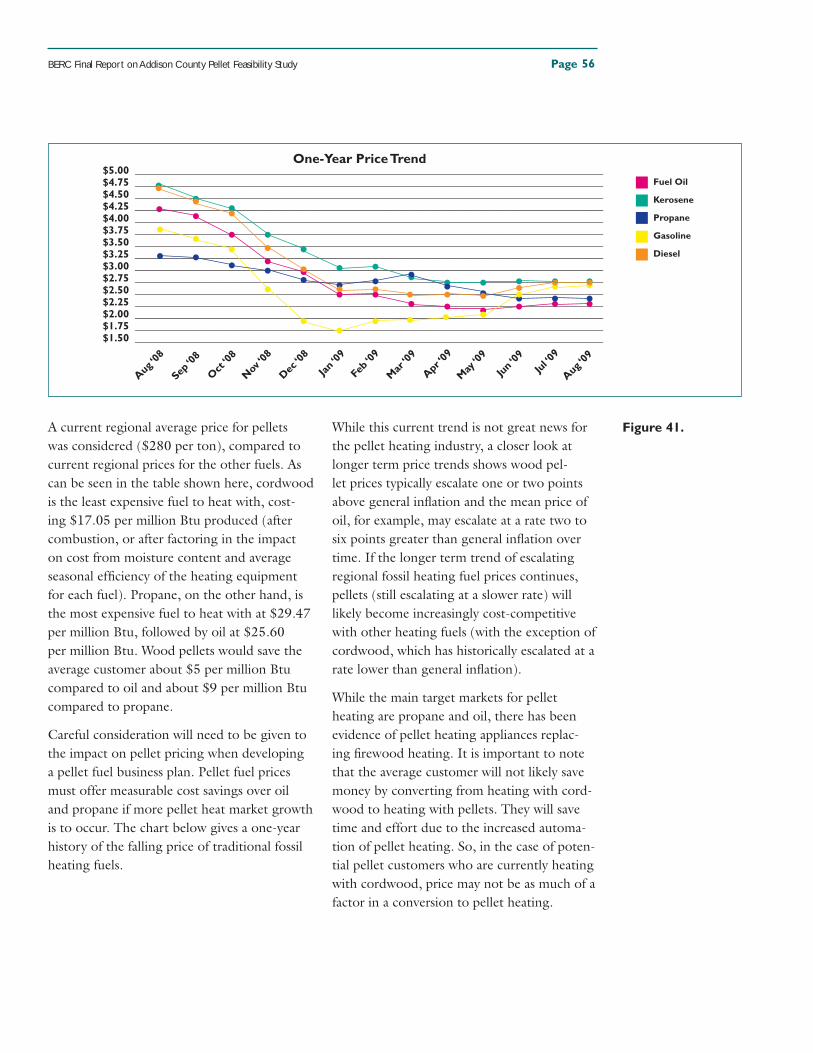
BERC Final Report on Addison County Pellet Feasibility Study Page
A current regional average price for pellets
was considered ($280 per ton), compared to
current regional prices for the other fuels. As
can be seen in the table shown here, cordwood
is the least expensive fuel to heat with, cost-
ing $17.05 per million Btu produced (after
combustion, or after factoring in the impact
on cost from moisture content and average
seasonal effi ciency of the heating equipment
for each fuel). Propane, on the other hand, is
the most expensive fuel to heat with at $29.47
per million Btu, followed by oil at $25.60
per million Btu. Wood pellets would save the
average customer about $5 per million Btu
compared to oil and about $9 per million Btu
compared to propane.
Careful consideration will need to be given to
the impact on pellet pricing when developing
a pellet fuel business plan. Pellet fuel prices
must offer measurable cost savings over oil
and propane if more pellet heat market growth
is to occur. The chart below gives a one-year
history of the falling price of traditional fossil
heating fuels.
While this current trend is not great news for
the pellet heating industry, a closer look at
longer term price trends shows wood pel-
let prices typically escalate one or two points
above general infl ation and the mean price of
oil, for example, may escalate at a rate two to
six points greater than general infl ation over
time. If the longer term trend of escalating
regional fossil heating fuel prices continues,
pellets (still escalating at a slower rate) will
likely become increasingly cost-competitive
with other heating fuels (with the exception of
cordwood, which has historically escalated at a
rate lower than general infl ation).
While the main target markets for pellet
heating are propane and oil, there has been
evidence of pellet heating appliances replac-
ing fi rewood heating. It is important to note
that the average customer will not likely save
money by converting from heating with cord-
wood to heating with pellets. They will save
time and effort due to the increased automa-
tion of pellet heating. So, in the case of poten-
tial pellet customers who are currently heating
with cordwood, price may not be as much of a
factor in a conversion to pellet heating.
Figure 41.
56
One-Year Price Trend$5.00 ________________________________________________________________________________________$4.75 ________________________________________________________________________________________$4.50 ________________________________________________________________________________________$4.25 ________________________________________________________________________________________$4.00 ________________________________________________________________________________________$3.75 ________________________________________________________________________________________$3.50 ________________________________________________________________________________________$3.25 ________________________________________________________________________________________$3.00 ________________________________________________________________________________________$2.75 ________________________________________________________________________________________$2.50 ________________________________________________________________________________________$2.25 ________________________________________________________________________________________$2.00 ________________________________________________________________________________________$1.75 ________________________________________________________________________________________$1.50 ________________________________________________________________________________________
Aug ‘0
8
Sep ‘0
8
Oct ‘0
8
Nov ‘0
8
Dec ‘0
8
Jan ‘0
9
Feb ‘
09
Mar ‘0
9
Apr ‘0
9
May ‘0
9
Jun ‘
09Ju
l ‘09
Aug ‘0
9
Fuel Oil
Kerosene
Propane
Gasoline
Diesel
Page BERC Final Report on Addison County Pellet Feasibility Study
8.2 RESIDENTIAL MARKET IN ADDISON
COUNTY
8.2.1 Estimating Annual Pellet Demand
for Residential Heating in Addison County.
The fi rst step in estimating the potential resi-
dential heating market for wood pellets is to
determine the current market demand for pel-
let fuels. The most recent census data (2000)
showed that Addison County has a total of
13,068 households. If the average household
is 2,000 square feet, then there is a total of
26,136,000 square feet of heated residential
area in Addison County. Figure 42 on the fol-
lowing page shows the population, number of
households, and estimated number of heated
residential square feet in Addison County by
town.
The Vermont Department of Public Service’s
Firewood Survey results (1997) showed that
the primary heating fuels used in Addison
County are oil (47 percent), propane (23
percent), and cordwood (18 percent). This
means that approximately 12,283,920 square
feet in Addison County are heated with oil,
6,011,280 square feet are heated with pro-
pane, and 4,704,480 square feet are heated
with cordwood.
There is extremely limited information avail-
able on the amount of pellet heating in the
United States, in the State of Vermont, or in
Addison County. However, a recent study con-
ducted by Macro International for the State
of Vermont concluded that 2.79 percent of
Vermont homes are currently heated in full or
in part by pellets. Therefore, the total annual
pellet demand for residential heating currently
is 2,313, tons of pellets. While this constitutes
a healthy market, it is not suffi cient to sup-
port a fi nancially viable pellet mill sized to the
service Addison County alone.
There are, however, numerous indicators that
pellet heating will continue its growth for the
next several years, especially in the Northeast-
ern US. Future demand for pellets is likely to
grow. For one, the VDPS Firewood Survey
Data (2009) reported that, of those respon-
dents who indicated they were planning to
install a wood heating system, over 28 per-
cent said they were planning to install a pellet
stove and another 4.4 percent said they were
planning to install a central pellet furnace or
boiler (the remainder were planning to install
cordwood stoves, furnaces or boilers).
In addition, national sales of pellet-fueled
heating appliances (stoves, furnaces and boil-
ers) have been growing dramatically over the
past few years. According to the national trade
association, Hearth, Patio, and Barbecue an-
nual sales of wood pellet stoves in the US has
increased by nearly 300 percent over the past
ten years. Also, the American Recovery and
Reinvestment Act of 2009 (ARRA) includes
a tax credit for homeowners on energy im-
provements, including 30 percent (or up to
$1,500) toward the purchase and installation
of biomass heating appliances such as stoves
and boilers through the end of 2010. All of
these factors point to the potential for further
market growth in pellet heating.
Given the likely trend towards greater conver-
sion to pellet heating, a basic analysis model
was developed to determine how many tons of
pellet fuel would be needed if the percentage
of pellet heating in Addison County continued
to grow in the future. Sensitivity analysis was
conducted to estimate total annual pellet de-
mand for three projected scenarios of further
pellet heating market growth—conservative,
moderate, and aggressive.
57
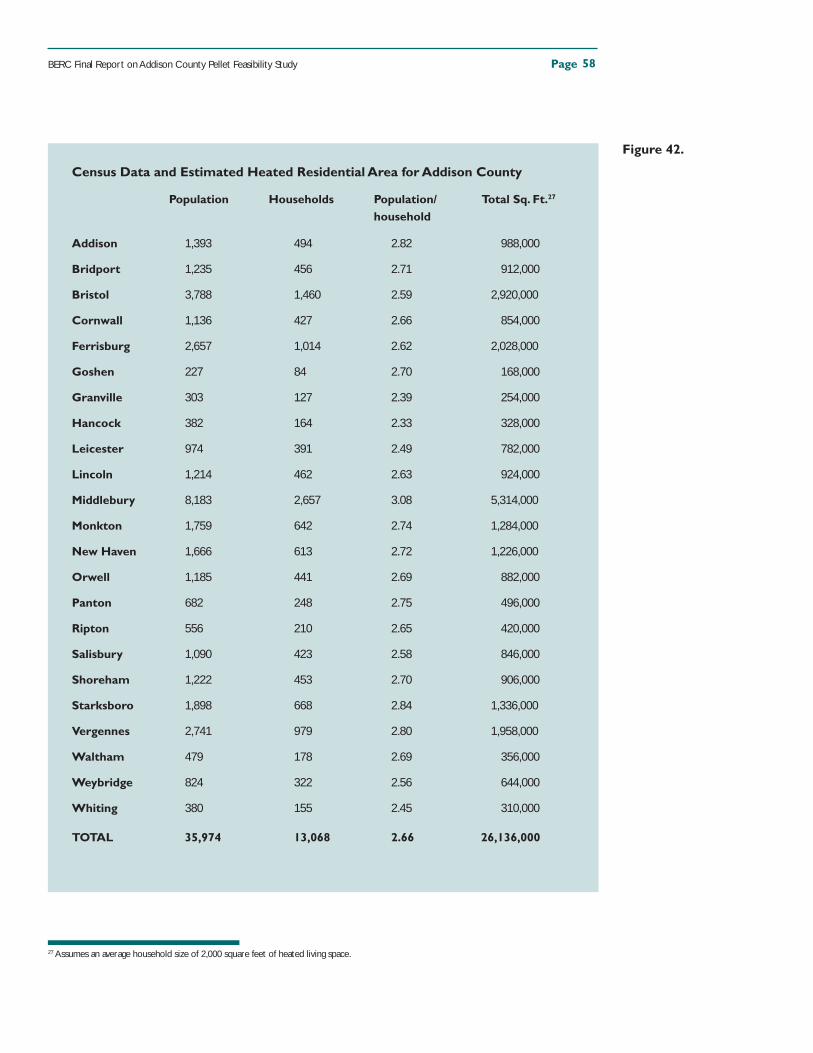
BERC Final Report on Addison County Pellet Feasibility Study Page
Census Data and Estimated Heated Residential Area for Addison County
Population Households Population/ Total Sq. Ft.27
household
Addison 1,393 494 2.82 988,000
Bridport 1,235 456 2.71 912,000
Bristol 3,788 1,460 2.59 2,920,000
Cornwall 1,136 427 2.66 854,000
Ferrisburg 2,657 1,014 2.62 2,028,000
Goshen 227 84 2.70 168,000
Granville 303 127 2.39 254,000
Hancock 382 164 2.33 328,000
Leicester 974 391 2.49 782,000
Lincoln 1,214 462 2.63 924,000
Middlebury 8,183 2,657 3.08 5,314,000
Monkton 1,759 642 2.74 1,284,000
New Haven 1,666 613 2.72 1,226,000
Orwell 1,185 441 2.69 882,000
Panton 682 248 2.75 496,000
Ripton 556 210 2.65 420,000
Salisbury 1,090 423 2.58 846,000
Shoreham 1,222 453 2.70 906,000
Starksboro 1,898 668 2.84 1,336,000
Vergennes 2,741 979 2.80 1,958,000
Waltham 479 178 2.69 356,000
Weybridge 824 322 2.56 644,000
Whiting 380 155 2.45 310,000
TOTAL 35,974 13,068 2.66 26,136,000
27 Assumes an average household size of 2,000 square feet of heated living space.
Figure 42.
58
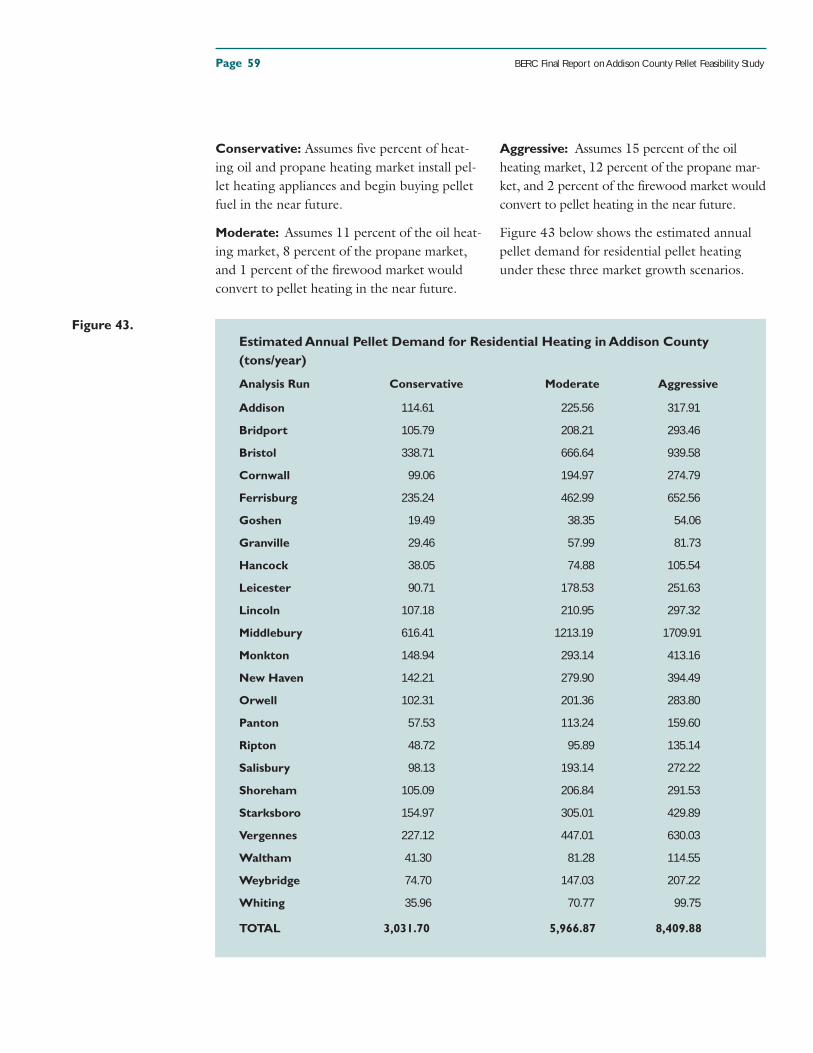
Page BERC Final Report on Addison County Pellet Feasibility Study
Conservative: Assumes fi ve percent of heat-
ing oil and propane heating market install pel-
let heating appliances and begin buying pellet
fuel in the near future.
Moderate: Assumes 11 percent of the oil heat-
ing market, 8 percent of the propane market,
and 1 percent of the fi rewood market would
convert to pellet heating in the near future.
Aggressive: Assumes 15 percent of the oil
heating market, 12 percent of the propane mar-
ket, and 2 percent of the fi rewood market would
convert to pellet heating in the near future.
Figure 43 below shows the estimated annual
pellet demand for residential pellet heating
under these three market growth scenarios.
Estimated Annual Pellet Demand for Residential Heating in Addison County
(tons/year)
Analysis Run Conservative Moderate Aggressive
Addison 114.61 225.56 317.91
Bridport 105.79 208.21 293.46
Bristol 338.71 666.64 939.58
Cornwall 99.06 194.97 274.79
Ferrisburg 235.24 462.99 652.56
Goshen 19.49 38.35 54.06
Granville 29.46 57.99 81.73
Hancock 38.05 74.88 105.54
Leicester 90.71 178.53 251.63
Lincoln 107.18 210.95 297.32
Middlebury 616.41 1213.19 1709.91
Monkton 148.94 293.14 413.16
New Haven 142.21 279.90 394.49
Orwell 102.31 201.36 283.80
Panton 57.53 113.24 159.60
Ripton 48.72 95.89 135.14
Salisbury 98.13 193.14 272.22
Shoreham 105.09 206.84 291.53
Starksboro 154.97 305.01 429.89
Vergennes 227.12 447.01 630.03
Waltham 41.30 81.28 114.55
Weybridge 74.70 147.03 207.22
Whiting 35.96 70.77 99.75
TOTAL 3,031.70 5,966.87 8,409.88
Figure 43.
59
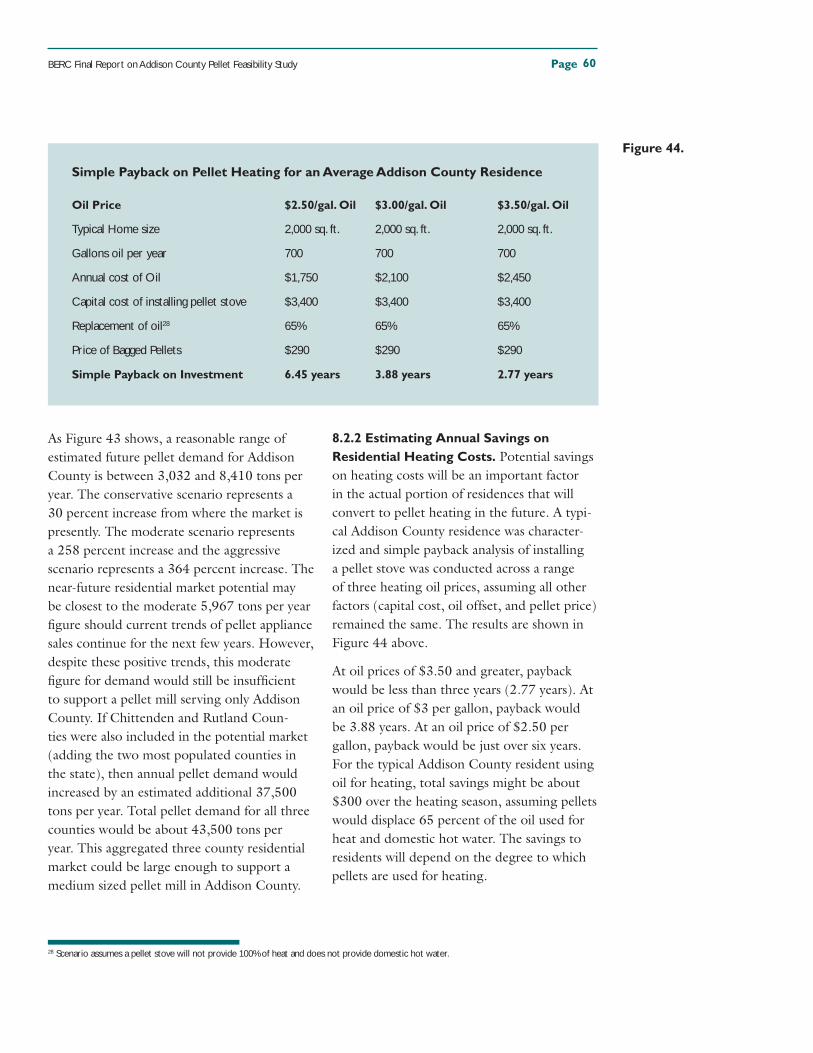
BERC Final Report on Addison County Pellet Feasibility Study Page
As Figure 43 shows, a reasonable range of
estimated future pellet demand for Addison
County is between 3,032 and 8,410 tons per
year. The conservative scenario represents a
30 percent increase from where the market is
presently. The moderate scenario represents
a 258 percent increase and the aggressive
scenario represents a 364 percent increase. The
near-future residential market potential may
be closest to the moderate 5,967 tons per year
fi gure should current trends of pellet appliance
sales continue for the next few years. However,
despite these positive trends, this moderate
fi gure for demand would still be insuffi cient
to support a pellet mill serving only Addison
County. If Chittenden and Rutland Coun-
ties were also included in the potential market
(adding the two most populated counties in
the state), then annual pellet demand would
increased by an estimated additional 37,500
tons per year. Total pellet demand for all three
counties would be about 43,500 tons per
year. This aggregated three county residential
market could be large enough to support a
medium sized pellet mill in Addison County.
8.2.2 Estimating Annual Savings on
Residential Heating Costs. Potential savings
on heating costs will be an important factor
in the actual portion of residences that will
convert to pellet heating in the future. A typi-
cal Addison County residence was character-
ized and simple payback analysis of installing
a pellet stove was conducted across a range
of three heating oil prices, assuming all other
factors (capital cost, oil offset, and pellet price)
remained the same. The results are shown in
Figure 44 above.
At oil prices of $3.50 and greater, payback
would be less than three years (2.77 years). At
an oil price of $3 per gallon, payback would
be 3.88 years. At an oil price of $2.50 per
gallon, payback would be just over six years.
For the typical Addison County resident using
oil for heating, total savings might be about
$300 over the heating season, assuming pellets
would displace 65 percent of the oil used for
heat and domestic hot water. The savings to
residents will depend on the degree to which
pellets are used for heating.
Simple Payback on Pellet Heating for an Average Addison County Residence
Oil Price $2.50/gal. Oil $3.00/gal. Oil $3.50/gal. Oil
Typical Home size 2,000 sq. ft. 2,000 sq. ft. 2,000 sq. ft.
Gallons oil per year 700 700 700
Annual cost of Oil $1,750 $2,100 $2,450
Capital cost of installing pellet stove $3,400 $3,400 $3,400
Replacement of oil28 65% 65% 65%
Price of Bagged Pellets $290 $290 $290
Simple Payback on Investment 6.45 years 3.88 years 2.77 years
Figure 44.
28 Scenario assumes a pellet stove will not provide 100% of heat and does not provide domestic hot water.
60
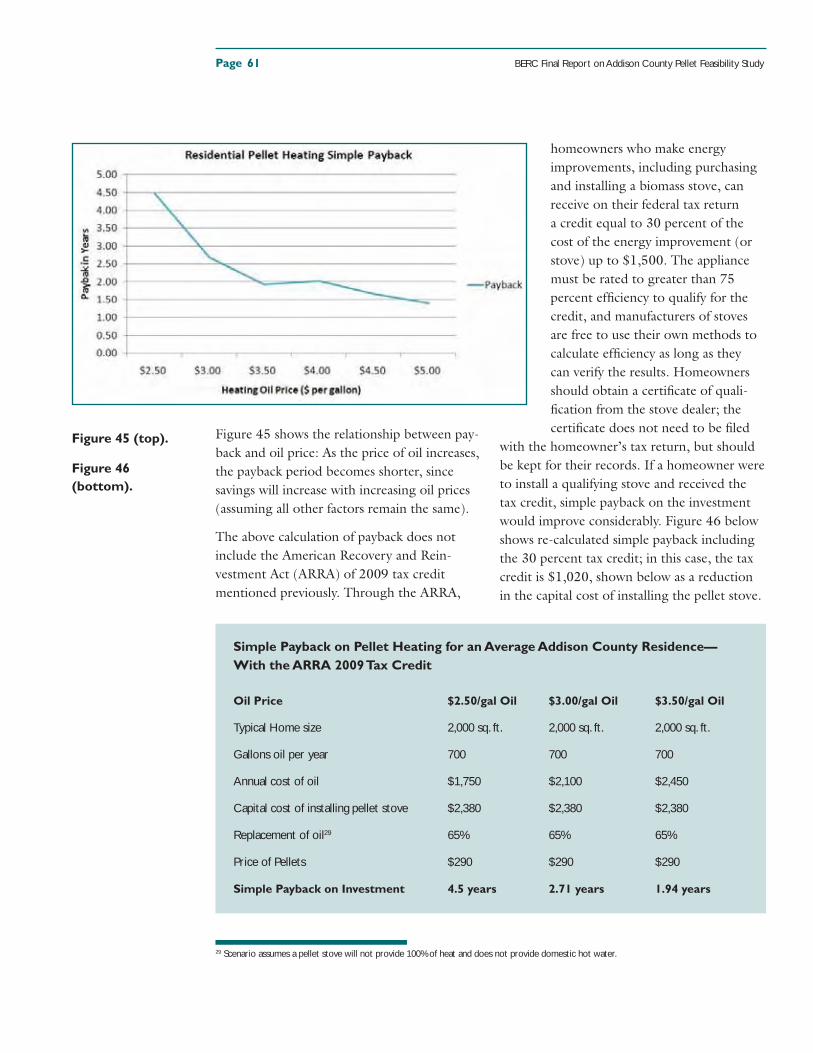
Page BERC Final Report on Addison County Pellet Feasibility Study
Figure 45 shows the relationship between pay-
back and oil price: As the price of oil increases,
the payback period becomes shorter, since
savings will increase with increasing oil prices
(assuming all other factors remain the same).
The above calculation of payback does not
include the American Recovery and Rein-
vestment Act (ARRA) of 2009 tax credit
mentioned previously. Through the ARRA,
homeowners who make energy
improvements, including purchasing
and installing a biomass stove, can
receive on their federal tax return
a credit equal to 30 percent of the
cost of the energy improvement (or
stove) up to $1,500. The appliance
must be rated to greater than 75
percent effi ciency to qualify for the
credit, and manufacturers of stoves
are free to use their own methods to
calculate effi ciency as long as they
can verify the results. Homeowners
should obtain a certifi cate of quali-
fi cation from the stove dealer; the
certifi cate does not need to be fi led
with the homeowner’s tax return, but should
be kept for their records. If a homeowner were
to install a qualifying stove and received the
tax credit, simple payback on the investment
would improve considerably. Figure 46 below
shows re-calculated simple payback including
the 30 percent tax credit; in this case, the tax
credit is $1,020, shown below as a reduction
in the capital cost of installing the pellet stove.
Figure 45 (top).
Figure 46
(bottom).
Simple Payback on Pellet Heating for an Average Addison County Residence—
With the ARRA 2009 Tax Credit
Oil Price $2.50/gal Oil $3.00/gal Oil $3.50/gal Oil
Typical Home size 2,000 sq. ft. 2,000 sq. ft. 2,000 sq. ft.
Gallons oil per year 700 700 700
Annual cost of oil $1,750 $2,100 $2,450
Capital cost of installing pellet stove $2,380 $2,380 $2,380
Replacement of oil29 65% 65% 65%
Price of Pellets $290 $290 $290
Simple Payback on Investment 4.5 years 2.71 years 1.94 years
29 Scenario assumes a pellet stove will not provide 100% of heat and does not provide domestic hot water.
61

BERC Final Report on Addison County Pellet Feasibility Study Page
8.2.3 Residential Market Survey Results. In
an effort to better assess both the existing and
future residential pellet heating fuel market in
Addison County, this study included an on-
line survey. A copy of this survey is included
as Appendix I at the end of this report. Please
note that while the survey gathered viable in-
formation, both the limited survey distribution
(sample size) and the low response rate dimin-
ish the overall validity of the survey results.
Nonetheless, the results are worth presenting
and discussing. The following section pres-
ents the results of the survey to supplement
the market information discussed above, but
should not be misinterpreted as being results
accurately depicting the whole of Addison
County.
Fifty-fi ve Addison County residents responded
to the on-line residential market survey, most
of who had been notifi ed of the survey by
the Addison County Chamber of Commerce.
Average home size among the respondents was
1,971 square feet. Of 55 respondents, 28 heat
with fi rewood, 27 heat with oil, 24 heat with
propane, 11 heat with pellets, four heat with
electric, three heat with solar, two heat with
biodiesel and one heats with corn (many use
more than one heating source/fuel). Figure
47 at right (top) shows the breakout of home
heating fuels among the survey respondents.
Average heating oil price among respondents
was $3.05 per gallon.
Of the fi rewood users, only four heat solely
with fi rewood; of the pellet users, two heat only
with pellets and two heat with fi rewood and
pellets only (for 100 percent wood heating).
Of 44 respondents, 24 have considered heat-
ing with pellets. Respondents said they would
be most likely to convert to pellet heating if oil
prices were $4 per gallon or more or if simple
payback on the investment was three years or
less. Figure 48 at right (bottom) shows the
likelihood of respondents to convert to wood
pellet heating across three possible payback
periods. As is shown in this chart, a payback
period of less than three years would make
respondents more likely to convert to pellet
heating. In the examples of payback period
given in the previous section, payback would
be less than three years when the oil price is $3
per gallon, the pellet price is $290 per bagged
ton, and the ARRA of 2009 tax credit is used.
Without the tax credit, payback would likely
be too long unless the oil price was $3.50 per
gallon or more.
Figure 47 (top).
Figure 48
(bottom).
62
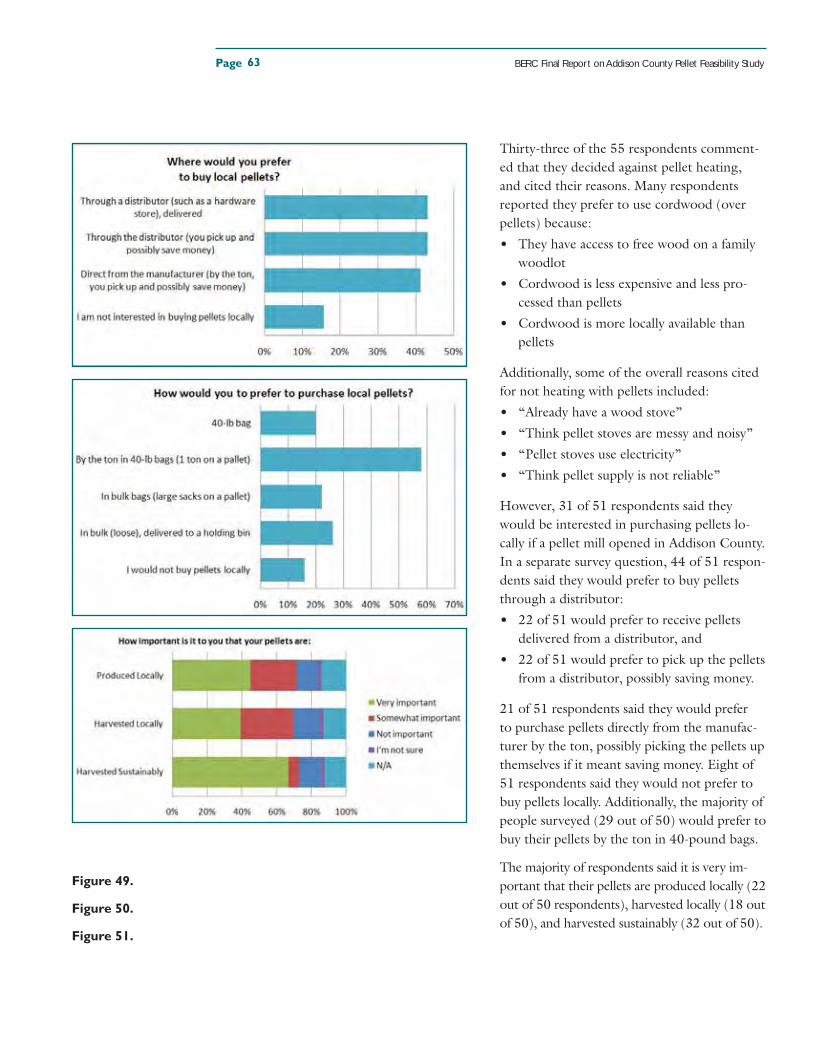
Page BERC Final Report on Addison County Pellet Feasibility Study
Thirty-three of the 55 respondents comment-
ed that they decided against pellet heating,
and cited their reasons. Many respondents
reported they prefer to use cordwood (over
pellets) because:
• They have access to free wood on a family
woodlot
• Cordwood is less expensive and less pro-
cessed than pellets
• Cordwood is more locally available than
pellets
Additionally, some of the overall reasons cited
for not heating with pellets included:
• “Already have a wood stove”
• “Think pellet stoves are messy and noisy”
• “Pellet stoves use electricity”
• “Think pellet supply is not reliable”
However, 31 of 51 respondents said they
would be interested in purchasing pellets lo-
cally if a pellet mill opened in Addison County.
In a separate survey question, 44 of 51 respon-
dents said they would prefer to buy pellets
through a distributor:
• 22 of 51 would prefer to receive pellets
delivered from a distributor, and
• 22 of 51 would prefer to pick up the pellets
from a distributor, possibly saving money.
21 of 51 respondents said they would prefer
to purchase pellets directly from the manufac-
turer by the ton, possibly picking the pellets up
themselves if it meant saving money. Eight of
51 respondents said they would not prefer to
buy pellets locally. Additionally, the majority of
people surveyed (29 out of 50) would prefer to
buy their pellets by the ton in 40-pound bags.
The majority of respondents said it is very im-
portant that their pellets are produced locally (22
out of 50 respondents), harvested locally (18 out
of 50), and harvested sustainably (32 out of 50).
Figure 49.
Figure 50.
Figure 51.
63
BERC Final Report on Addison County Pellet Feasibility Study Page
Respondents were given the opportunity to
provide any thoughts, comments, or feedback.
The two primary themes that emerged from
the 23 comments received were (1) the im-
portance of cost as a factor in the decision to
install a pellet heating system and (2) the need
for public education around the technology,
benefi ts, sustainability, and supply of pellets.
Some noteworthy comments are included be-
low, copied from the on-line survey (grammat-
ical and spelling errors were not corrected).
• “The problem is in fi nding the money to
purchase the unit - if there could be more
loan programs, people would buy. We had
the money, but when we could not fi nd
stoves or pellets last year, we went with a
wood stove.”
• “I think it would be nice to buy locally, not
to have to drive to Burlington or Rutland.”
• “I am very concerned about the impact on
our local forests and the sustainability of
our current forested landscape.”
• “Would think about purchasing a pellet
boiler if money was available whether or
not a facility is built in Addison (although
I’d like for one to become available) as
there is one in North Clarendon.”
• “I think pellets and biomass in general in
VT should not be considered a long term
solution to our energy issues. Wind and sun
are the only truly renewable resources and
we should be emphasizing those technolo-
gies as we force policy and market shifts.”
• I will always use my woodstove for heating
as I either harvest wood off my property or
buy logs and have all equipment necessary,
also it does not require electricity for its
operation. However I still rely on my boiler
to provide backup heat and domestic hot
water and am planning to replace my exist-
ing oil fi red unit within the next 5 years.
I have considered an outside wood boiler
or replacing the oil to a gas or pellet fi red
boiler. It would be easier to retro-fi t the
existing boiler and far cheaper and logisti-
cally easier to use pellets where it is located.
If a good quality locally produced pellet
was available it would defi nitely put me at
replacing the oil fi red boiler to a pellet. My
reluctance to switching to pellets at this
point are consistent quality, price fl uctua-
tions, and not a locally (at least regionally)
produced product, I’m already paying for
oil produced and transported half way
around the world.
• Would buy pellet boiler if present oil
boiler, now converted to use B100 biodie-
sel, needed replacement. Cost of pellets
compared with other fuels would not be a
factor. CO2 emissions would be.
• I am not interested in seeing a “plant” or
manufacturing facility of any kind in my
town unless it would mean that my prop-
erty taxes would go down signifi cantly.
8.3 COMMERCIAL MARKET
8.3.1 Estimating Annual Pellet Demand for
Commercial Heating in Addison County.
While the number of residences in Addison
County was easily obtained through census
data, the number of businesses in the County
was more diffi cult to determine—especially
those with heated building space. According
to ACRPC information, there are an estimated
1,800 businesses in Addison County including
all home based businesses. A large majority of
these businesses may not occupy physical space
requiring heat not already accounted for in the
residential survey. Therefore, a conservative
estimate of 300 businesses within the County
was assumed after surveying several sources of
information.
64
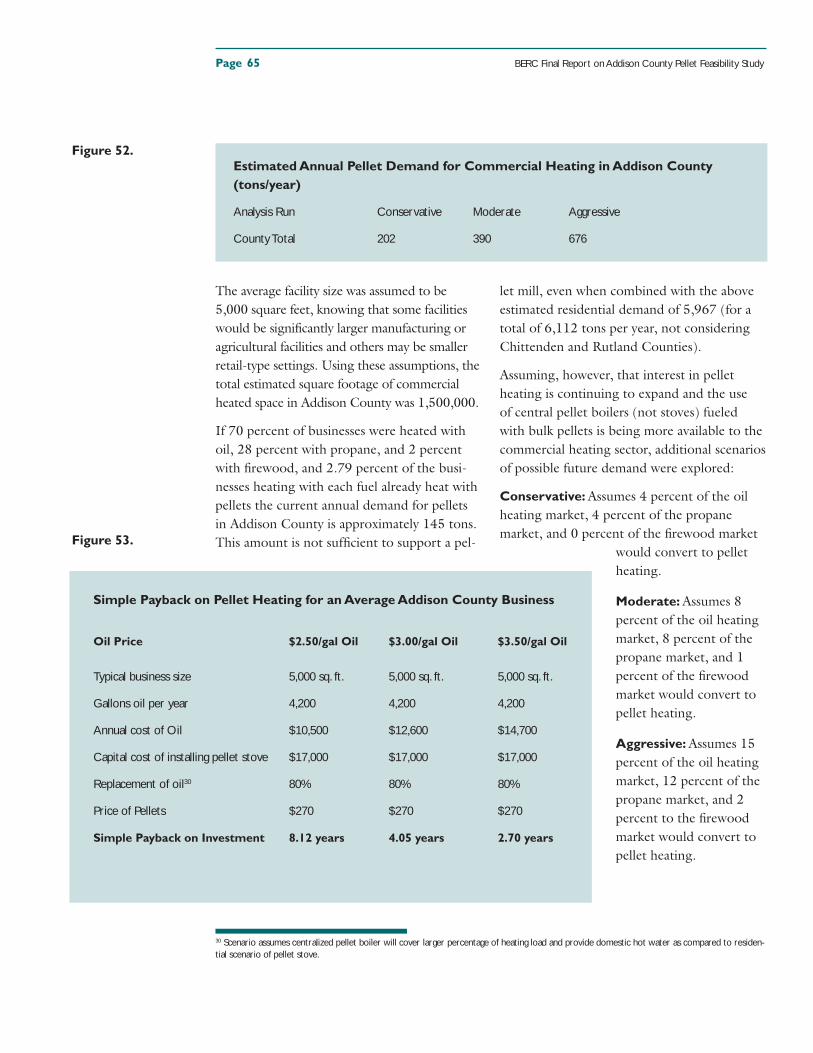
Page BERC Final Report on Addison County Pellet Feasibility Study
The average facility size was assumed to be
5,000 square feet, knowing that some facilities
would be signifi cantly larger manufacturing or
agricultural facilities and others may be smaller
retail-type settings. Using these assumptions, the
total estimated square footage of commercial
heated space in Addison County was 1,500,000.
If 70 percent of businesses were heated with
oil, 28 percent with propane, and 2 percent
with fi rewood, and 2.79 percent of the busi-
nesses heating with each fuel already heat with
pellets the current annual demand for pellets
in Addison County is approximately 145 tons.
This amount is not suffi cient to support a pel-
let mill, even when combined with the above
estimated residential demand of 5,967 (for a
total of 6,112 tons per year, not considering
Chittenden and Rutland Counties).
Assuming, however, that interest in pellet
heating is continuing to expand and the use
of central pellet boilers (not stoves) fueled
with bulk pellets is being more available to the
commercial heating sector, additional scenarios
of possible future demand were explored:
Conservative: Assumes 4 percent of the oil
heating market, 4 percent of the propane
market, and 0 percent of the fi rewood market
would convert to pellet
heating.
Moderate: Assumes 8
percent of the oil heating
market, 8 percent of the
propane market, and 1
percent of the fi rewood
market would convert to
pellet heating.
Aggressive: Assumes 15
percent of the oil heating
market, 12 percent of the
propane market, and 2
percent to the fi rewood
market would convert to
pellet heating.
Estimated Annual Pellet Demand for Commercial Heating in Addison County
(tons/year)
Analysis Run Conservative Moderate Aggressive
County Total 202 390 676
Simple Payback on Pellet Heating for an Average Addison County Business
Oil Price $2.50/gal Oil $3.00/gal Oil $3.50/gal Oil
Typical business size 5,000 sq. ft. 5,000 sq. ft. 5,000 sq. ft.
Gallons oil per year 4,200 4,200 4,200
Annual cost of Oil $10,500 $12,600 $14,700
Capital cost of installing pellet stove $17,000 $17,000 $17,000
Replacement of oil30 80% 80% 80%
Price of Pellets $270 $270 $270
Simple Payback on Investment 8.12 years 4.05 years 2.70 years
Figure 52.
Figure 53.
30 Scenario assumes centralized pellet boiler will cover larger percentage of heating load and provide domestic hot water as compared to residen-tial scenario of pellet stove.
65
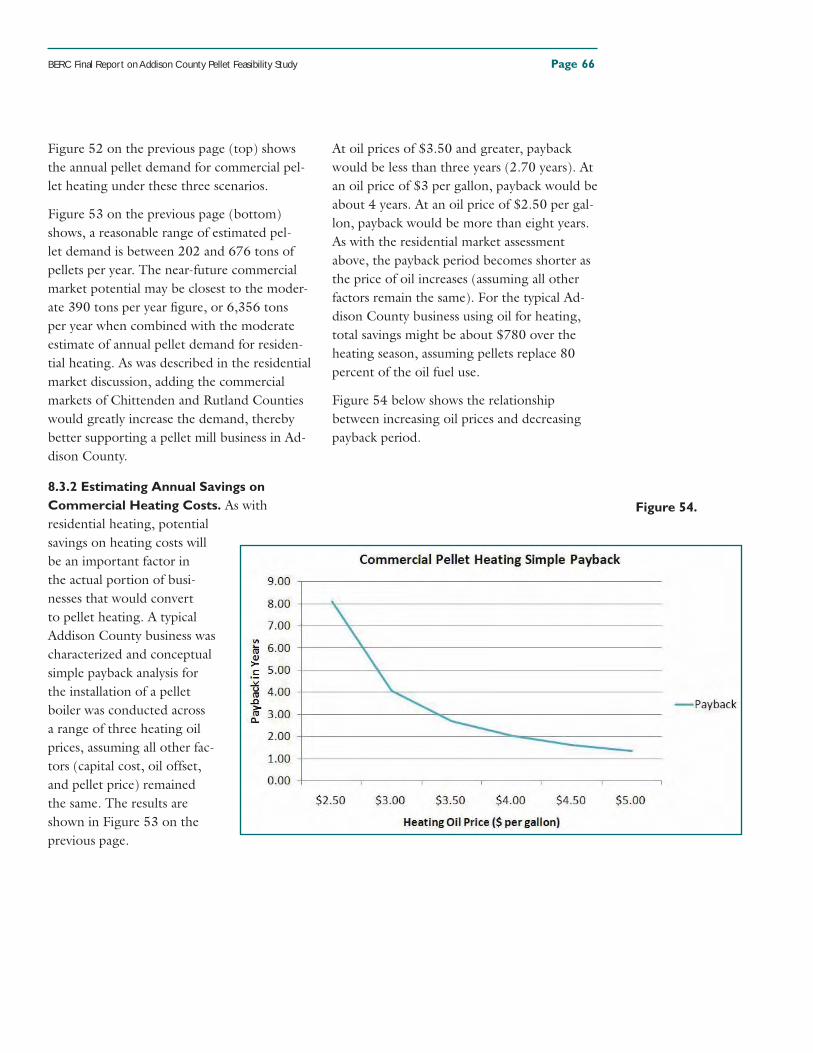
BERC Final Report on Addison County Pellet Feasibility Study Page
Figure 52 on the previous page (top) shows
the annual pellet demand for commercial pel-
let heating under these three scenarios.
Figure 53 on the previous page (bottom)
shows, a reasonable range of estimated pel-
let demand is between 202 and 676 tons of
pellets per year. The near-future commercial
market potential may be closest to the moder-
ate 390 tons per year fi gure, or 6,356 tons
per year when combined with the moderate
estimate of annual pellet demand for residen-
tial heating. As was described in the residential
market discussion, adding the commercial
markets of Chittenden and Rutland Counties
would greatly increase the demand, thereby
better supporting a pellet mill business in Ad-
dison County.
8.3.2 Estimating Annual Savings on
Commercial Heating Costs. As with
residential heating, potential
savings on heating costs will
be an important factor in
the actual portion of busi-
nesses that would convert
to pellet heating. A typical
Addison County business was
characterized and conceptual
simple payback analysis for
the installation of a pellet
boiler was conducted across
a range of three heating oil
prices, assuming all other fac-
tors (capital cost, oil offset,
and pellet price) remained
the same. The results are
shown in Figure 53 on the
previous page.
At oil prices of $3.50 and greater, payback
would be less than three years (2.70 years). At
an oil price of $3 per gallon, payback would be
about 4 years. At an oil price of $2.50 per gal-
lon, payback would be more than eight years.
As with the residential market assessment
above, the payback period becomes shorter as
the price of oil increases (assuming all other
factors remain the same). For the typical Ad-
dison County business using oil for heating,
total savings might be about $780 over the
heating season, assuming pellets replace 80
percent of the oil fuel use.
Figure 54 below shows the relationship
between increasing oil prices and decreasing
payback period.
Figure 54.
66
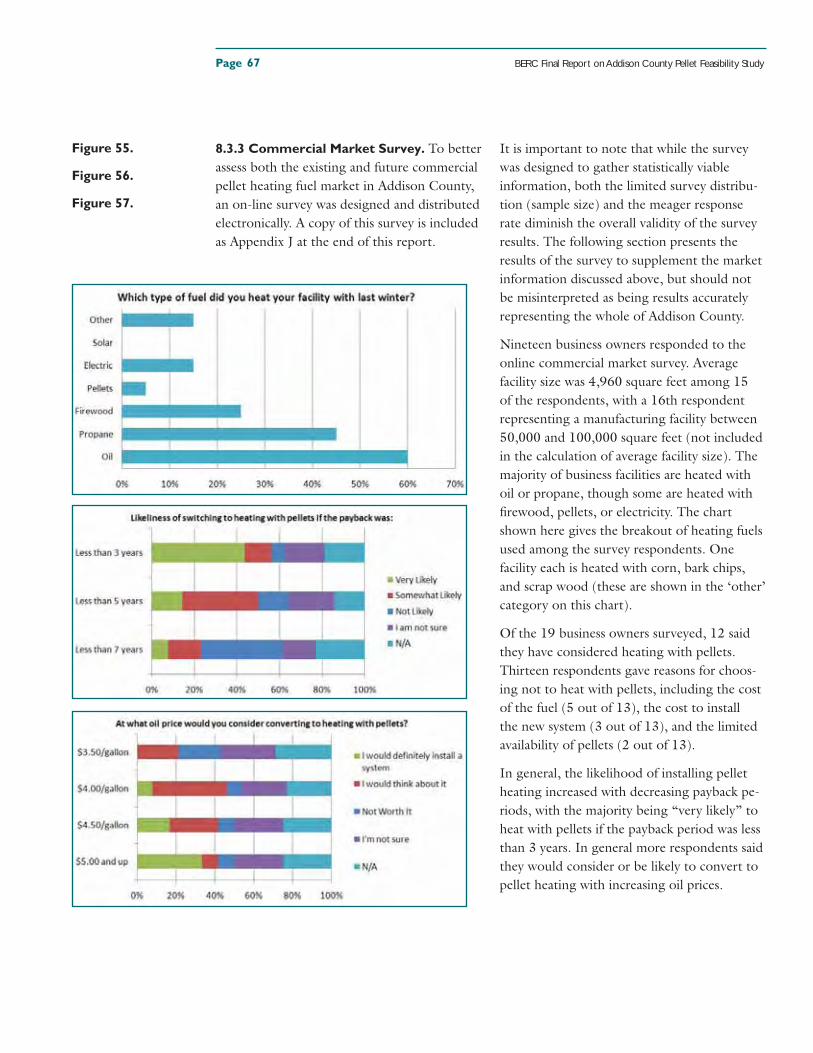
Page BERC Final Report on Addison County Pellet Feasibility Study
8.3.3 Commercial Market Survey. To better
assess both the existing and future commercial
pellet heating fuel market in Addison County,
an on-line survey was designed and distributed
electronically. A copy of this survey is included
as Appendix J at the end of this report.
It is important to note that while the survey
was designed to gather statistically viable
information, both the limited survey distribu-
tion (sample size) and the meager response
rate diminish the overall validity of the survey
results. The following section presents the
results of the survey to supplement the market
information discussed above, but should not
be misinterpreted as being results accurately
representing the whole of Addison County.
Nineteen business owners responded to the
online commercial market survey. Average
facility size was 4,960 square feet among 15
of the respondents, with a 16th respondent
representing a manufacturing facility between
50,000 and 100,000 square feet (not included
in the calculation of average facility size). The
majority of business facilities are heated with
oil or propane, though some are heated with
fi rewood, pellets, or electricity. The chart
shown here gives the breakout of heating fuels
used among the survey respondents. One
facility each is heated with corn, bark chips,
and scrap wood (these are shown in the ‘other’
category on this chart).
Of the 19 business owners surveyed, 12 said
they have considered heating with pellets.
Thirteen respondents gave reasons for choos-
ing not to heat with pellets, including the cost
of the fuel (5 out of 13), the cost to install
the new system (3 out of 13), and the limited
availability of pellets (2 out of 13).
In general, the likelihood of installing pellet
heating increased with decreasing payback pe-
riods, with the majority being “very likely” to
heat with pellets if the payback period was less
than 3 years. In general more respondents said
they would consider or be likely to convert to
pellet heating with increasing oil prices.
Figure 55.
Figure 56.
Figure 57.
67
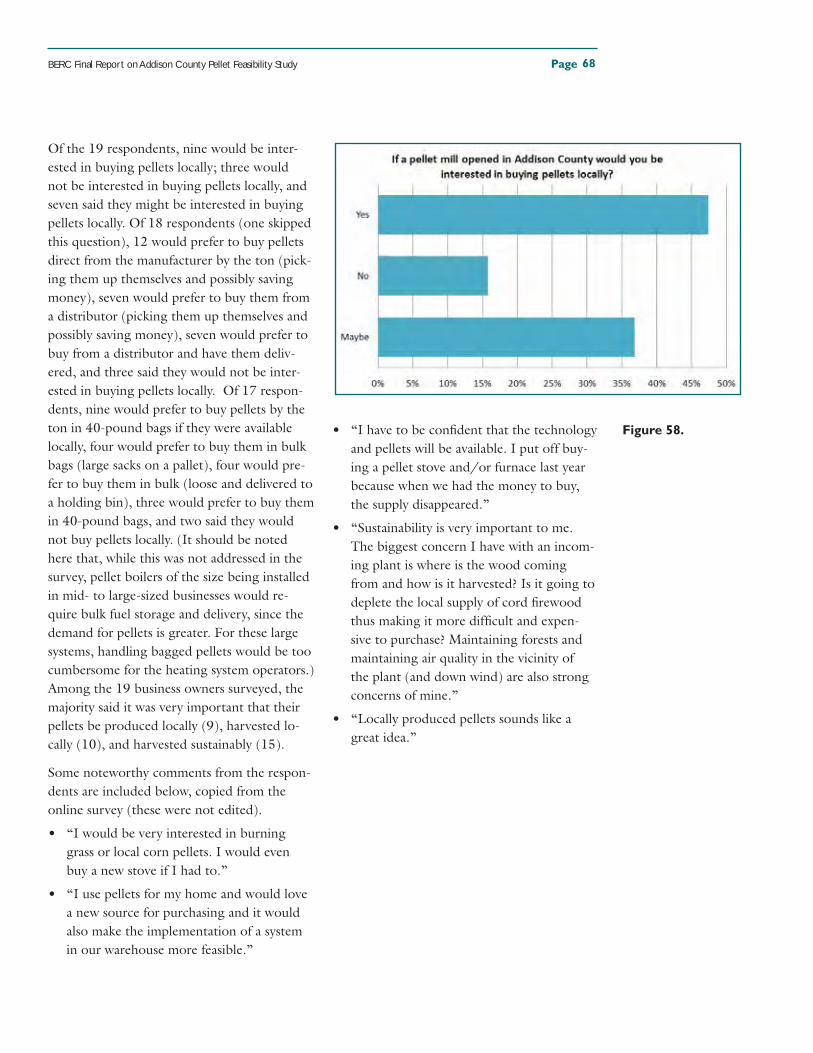
BERC Final Report on Addison County Pellet Feasibility Study Page
Of the 19 respondents, nine would be inter-
ested in buying pellets locally; three would
not be interested in buying pellets locally, and
seven said they might be interested in buying
pellets locally. Of 18 respondents (one skipped
this question), 12 would prefer to buy pellets
direct from the manufacturer by the ton (pick-
ing them up themselves and possibly saving
money), seven would prefer to buy them from
a distributor (picking them up themselves and
possibly saving money), seven would prefer to
buy from a distributor and have them deliv-
ered, and three said they would not be inter-
ested in buying pellets locally. Of 17 respon-
dents, nine would prefer to buy pellets by the
ton in 40-pound bags if they were available
locally, four would prefer to buy them in bulk
bags (large sacks on a pallet), four would pre-
fer to buy them in bulk (loose and delivered to
a holding bin), three would prefer to buy them
in 40-pound bags, and two said they would
not buy pellets locally. (It should be noted
here that, while this was not addressed in the
survey, pellet boilers of the size being installed
in mid- to large-sized businesses would re-
quire bulk fuel storage and delivery, since the
demand for pellets is greater. For these large
systems, handling bagged pellets would be too
cumbersome for the heating system operators.)
Among the 19 business owners surveyed, the
majority said it was very important that their
pellets be produced locally (9), harvested lo-
cally (10), and harvested sustainably (15).
Some noteworthy comments from the respon-
dents are included below, copied from the
online survey (these were not edited).
• “I would be very interested in burning
grass or local corn pellets. I would even
buy a new stove if I had to.”
• “I use pellets for my home and would love
a new source for purchasing and it would
also make the implementation of a system
in our warehouse more feasible.”
• “I have to be confi dent that the technology
and pellets will be available. I put off buy-
ing a pellet stove and/or furnace last year
because when we had the money to buy,
the supply disappeared.”
• “Sustainability is very important to me.
The biggest concern I have with an incom-
ing plant is where is the wood coming
from and how is it harvested? Is it going to
deplete the local supply of cord fi rewood
thus making it more diffi cult and expen-
sive to purchase? Maintaining forests and
maintaining air quality in the vicinity of
the plant (and down wind) are also strong
concerns of mine.”
• “Locally produced pellets sounds like a
great idea.”
Figure 58.
68
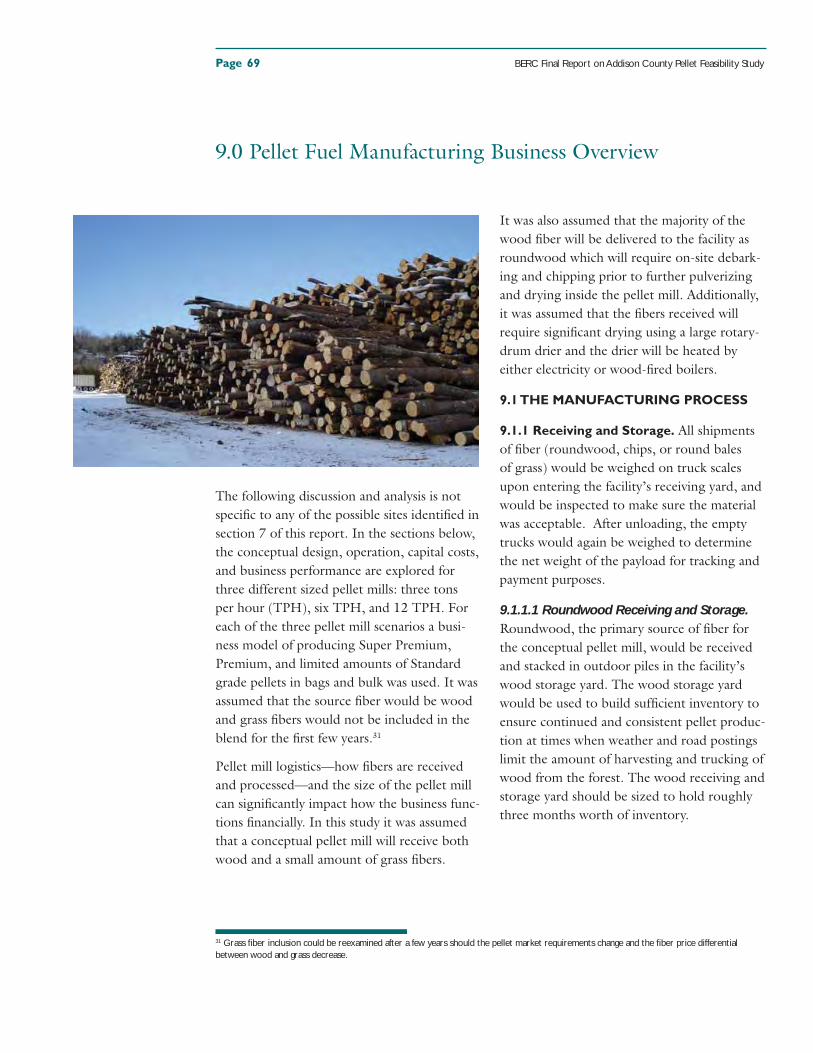
Page BERC Final Report on Addison County Pellet Feasibility Study
The following discussion and analysis is not
specifi c to any of the possible sites identifi ed in
section 7 of this report. In the sections below,
the conceptual design, operation, capital costs,
and business performance are explored for
three different sized pellet mills: three tons
per hour (TPH), six TPH, and 12 TPH. For
each of the three pellet mill scenarios a busi-
ness model of producing Super Premium,
Premium, and limited amounts of Standard
grade pellets in bags and bulk was used. It was
assumed that the source fi ber would be wood
and grass fi bers would not be included in the
blend for the fi rst few years.31
Pellet mill logistics—how fi bers are received
and processed—and the size of the pellet mill
can signifi cantly impact how the business func-
tions fi nancially. In this study it was assumed
that a conceptual pellet mill will receive both
wood and a small amount of grass fi bers.
It was also assumed that the majority of the
wood fi ber will be delivered to the facility as
roundwood which will require on-site debark-
ing and chipping prior to further pulverizing
and drying inside the pellet mill. Additionally,
it was assumed that the fi bers received will
require signifi cant drying using a large rotary-
drum drier and the drier will be heated by
either electricity or wood-fi red boilers.
9.1 THE MANUFACTURING PROCESS
9.1.1 Receiving and Storage. All shipments
of fi ber (roundwood, chips, or round bales
of grass) would be weighed on truck scales
upon entering the facility’s receiving yard, and
would be inspected to make sure the material
was acceptable. After unloading, the empty
trucks would again be weighed to determine
the net weight of the payload for tracking and
payment purposes.
9.1.1.1 Roundwood Receiving and Storage. Roundwood, the primary source of fi ber for
the conceptual pellet mill, would be received
and stacked in outdoor piles in the facility’s
wood storage yard. The wood storage yard
would be used to build suffi cient inventory to
ensure continued and consistent pellet produc-
tion at times when weather and road postings
limit the amount of harvesting and trucking of
wood from the forest. The wood receiving and
storage yard should be sized to hold roughly
three months worth of inventory.
9.0 Pellet Fuel Manufacturing Business Overview
31 Grass fi ber inclusion could be reexamined after a few years should the pellet market requirements change and the fi ber price differential between wood and grass decrease.
69
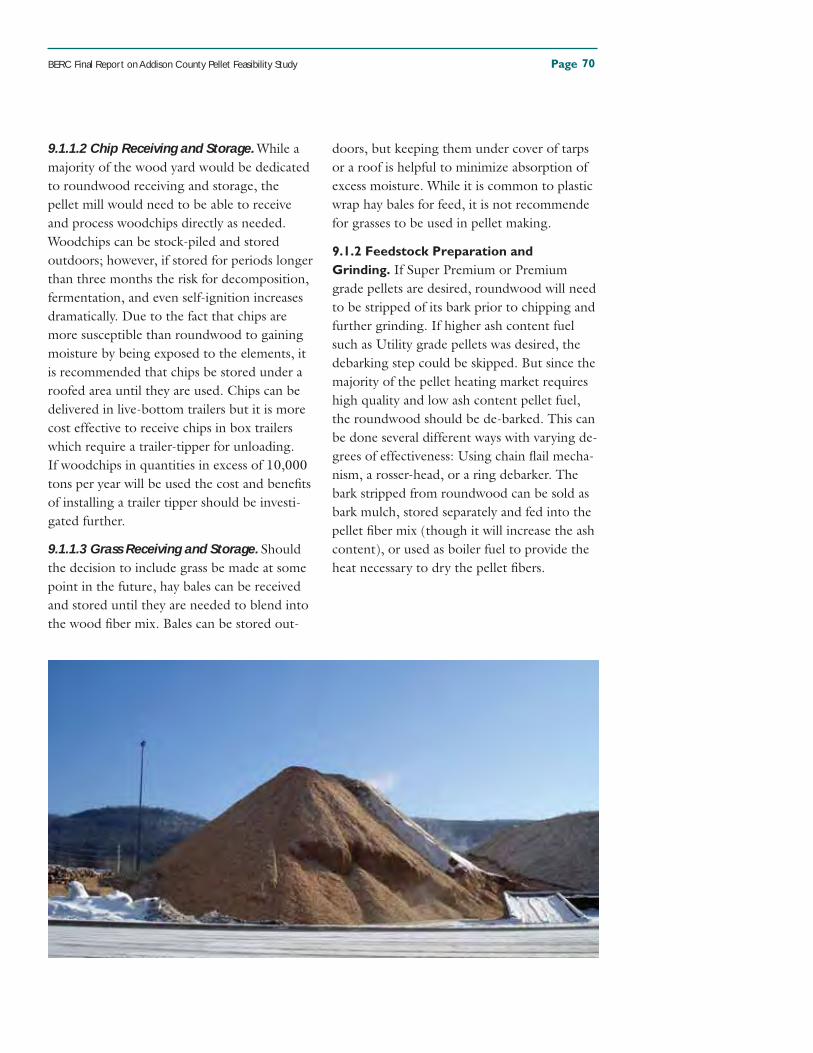
BERC Final Report on Addison County Pellet Feasibility Study Page
9.1.1.2 Chip Receiving and Storage. While a
majority of the wood yard would be dedicated
to roundwood receiving and storage, the
pellet mill would need to be able to receive
and process woodchips directly as needed.
Woodchips can be stock-piled and stored
outdoors; however, if stored for periods longer
than three months the risk for decomposition,
fermentation, and even self-ignition increases
dramatically. Due to the fact that chips are
more susceptible than roundwood to gaining
moisture by being exposed to the elements, it
is recommended that chips be stored under a
roofed area until they are used. Chips can be
delivered in live-bottom trailers but it is more
cost effective to receive chips in box trailers
which require a trailer-tipper for unloading.
If woodchips in quantities in excess of 10,000
tons per year will be used the cost and benefi ts
of installing a trailer tipper should be investi-
gated further.
9.1.1.3 Grass Receiving and Storage. Should
the decision to include grass be made at some
point in the future, hay bales can be received
and stored until they are needed to blend into
the wood fi ber mix. Bales can be stored out-
doors, but keeping them under cover of tarps
or a roof is helpful to minimize absorption of
excess moisture. While it is common to plastic
wrap hay bales for feed, it is not recommende
for grasses to be used in pellet making.
9.1.2 Feedstock Preparation and
Grinding. If Super Premium or Premium
grade pellets are desired, roundwood will need
to be stripped of its bark prior to chipping and
further grinding. If higher ash content fuel
such as Utility grade pellets was desired, the
debarking step could be skipped. But since the
majority of the pellet heating market requires
high quality and low ash content pellet fuel,
the roundwood should be de-barked. This can
be done several different ways with varying de-
grees of effectiveness: Using chain fl ail mecha-
nism, a rosser-head, or a ring debarker. The
bark stripped from roundwood can be sold as
bark mulch, stored separately and fed into the
pellet fi ber mix (though it will increase the ash
content), or used as boiler fuel to provide the
heat necessary to dry the pellet fi bers.
70
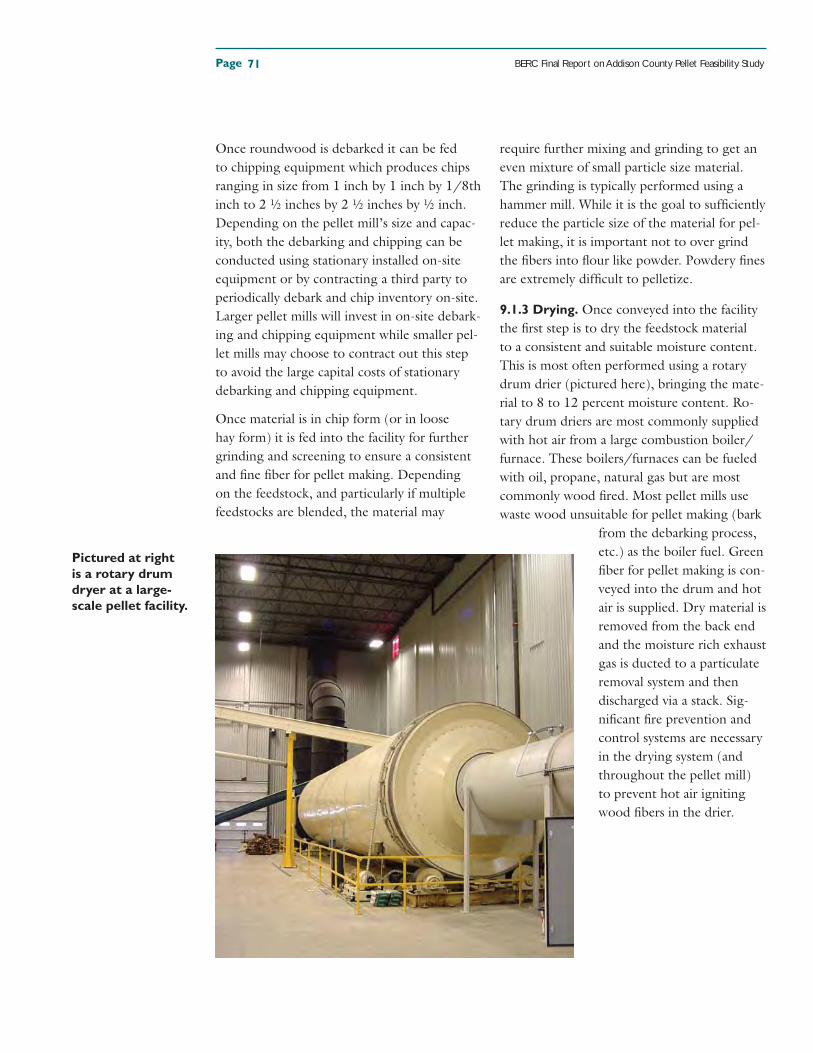
Page BERC Final Report on Addison County Pellet Feasibility Study
Once roundwood is debarked it can be fed
to chipping equipment which produces chips
ranging in size from 1 inch by 1 inch by 1/8th
inch to 2 ½ inches by 2 ½ inches by ½ inch.
Depending on the pellet mill’s size and capac-
ity, both the debarking and chipping can be
conducted using stationary installed on-site
equipment or by contracting a third party to
periodically debark and chip inventory on-site.
Larger pellet mills will invest in on-site debark-
ing and chipping equipment while smaller pel-
let mills may choose to contract out this step
to avoid the large capital costs of stationary
debarking and chipping equipment.
Once material is in chip form (or in loose
hay form) it is fed into the facility for further
grinding and screening to ensure a consistent
and fi ne fi ber for pellet making. Depending
on the feedstock, and particularly if multiple
feedstocks are blended, the material may
require further mixing and grinding to get an
even mixture of small particle size material.
The grinding is typically performed using a
hammer mill. While it is the goal to suffi ciently
reduce the particle size of the material for pel-
let making, it is important not to over grind
the fi bers into fl our like powder. Powdery fi nes
are extremely diffi cult to pelletize.
9.1.3 Drying. Once conveyed into the facility
the fi rst step is to dry the feedstock material
to a consistent and suitable moisture content.
This is most often performed using a rotary
drum drier (pictured here), bringing the mate-
rial to 8 to 12 percent moisture content. Ro-
tary drum driers are most commonly supplied
with hot air from a large combustion boiler/
furnace. These boilers/furnaces can be fueled
with oil, propane, natural gas but are most
commonly wood fi red. Most pellet mills use
waste wood unsuitable for pellet making (bark
from the debarking process,
etc.) as the boiler fuel. Green
fi ber for pellet making is con-
veyed into the drum and hot
air is supplied. Dry material is
removed from the back end
and the moisture rich exhaust
gas is ducted to a particulate
removal system and then
discharged via a stack. Sig-
nifi cant fi re prevention and
control systems are necessary
in the drying system (and
throughout the pellet mill)
to prevent hot air igniting
wood fi bers in the drier.
71
Pictured at right
is a rotary drum
dryer at a large-
scale pellet facility.
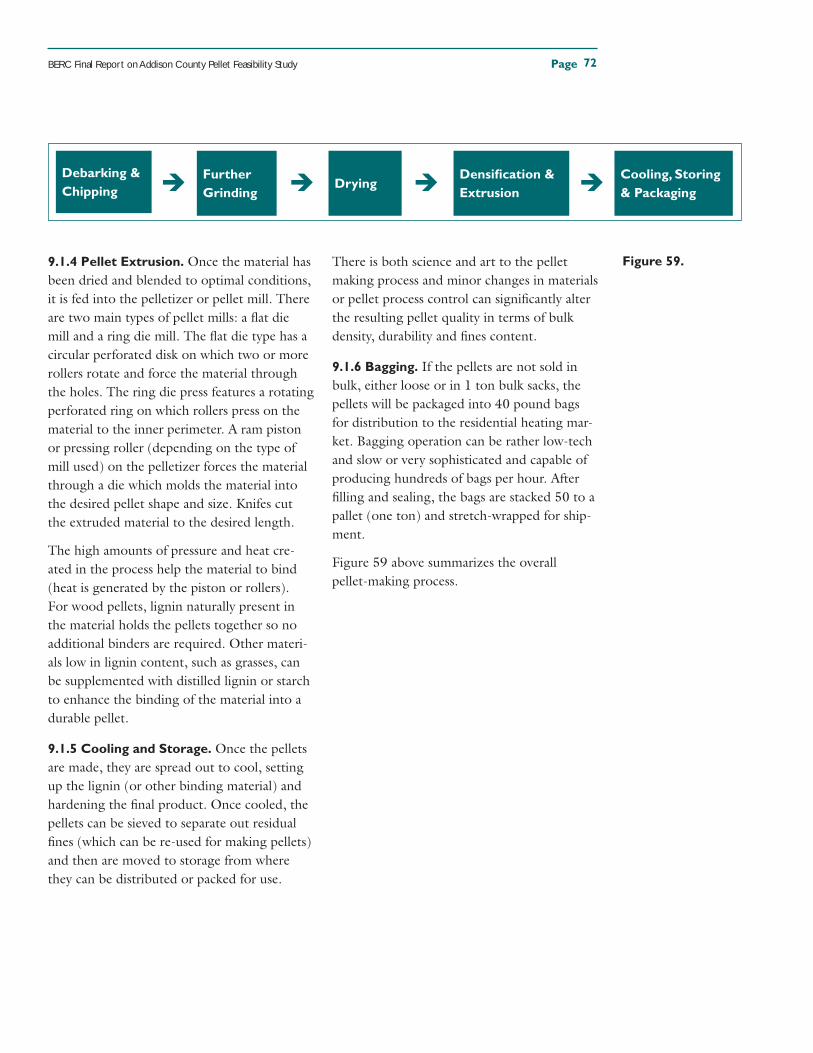
BERC Final Report on Addison County Pellet Feasibility Study Page
9.1.4 Pellet Extrusion. Once the material has
been dried and blended to optimal conditions,
it is fed into the pelletizer or pellet mill. There
are two main types of pellet mills: a fl at die
mill and a ring die mill. The fl at die type has a
circular perforated disk on which two or more
rollers rotate and force the material through
the holes. The ring die press features a rotating
perforated ring on which rollers press on the
material to the inner perimeter. A ram piston
or pressing roller (depending on the type of
mill used) on the pelletizer forces the material
through a die which molds the material into
the desired pellet shape and size. Knifes cut
the extruded material to the desired length.
The high amounts of pressure and heat cre-
ated in the process help the material to bind
(heat is generated by the piston or rollers).
For wood pellets, lignin naturally present in
the material holds the pellets together so no
additional binders are required. Other materi-
als low in lignin content, such as grasses, can
be supplemented with distilled lignin or starch
to enhance the binding of the material into a
durable pellet.
9.1.5 Cooling and Storage. Once the pellets
are made, they are spread out to cool, setting
up the lignin (or other binding material) and
hardening the fi nal product. Once cooled, the
pellets can be sieved to separate out residual
fi nes (which can be re-used for making pellets)
and then are moved to storage from where
they can be distributed or packed for use.
There is both science and art to the pellet
making process and minor changes in materials
or pellet process control can signifi cantly alter
the resulting pellet quality in terms of bulk
density, durability and fi nes content.
9.1.6 Bagging. If the pellets are not sold in
bulk, either loose or in 1 ton bulk sacks, the
pellets will be packaged into 40 pound bags
for distribution to the residential heating mar-
ket. Bagging operation can be rather low-tech
and slow or very sophisticated and capable of
producing hundreds of bags per hour. After
fi lling and sealing, the bags are stacked 50 to a
pallet (one ton) and stretch-wrapped for ship-
ment.
Figure 59 above summarizes the overall
pellet-making process.
Figure 59.
Debarking &
Chipping
Densifi cation &
Extrusion
Cooling, Storing
& Packaging
Further
GrindingDrying
72
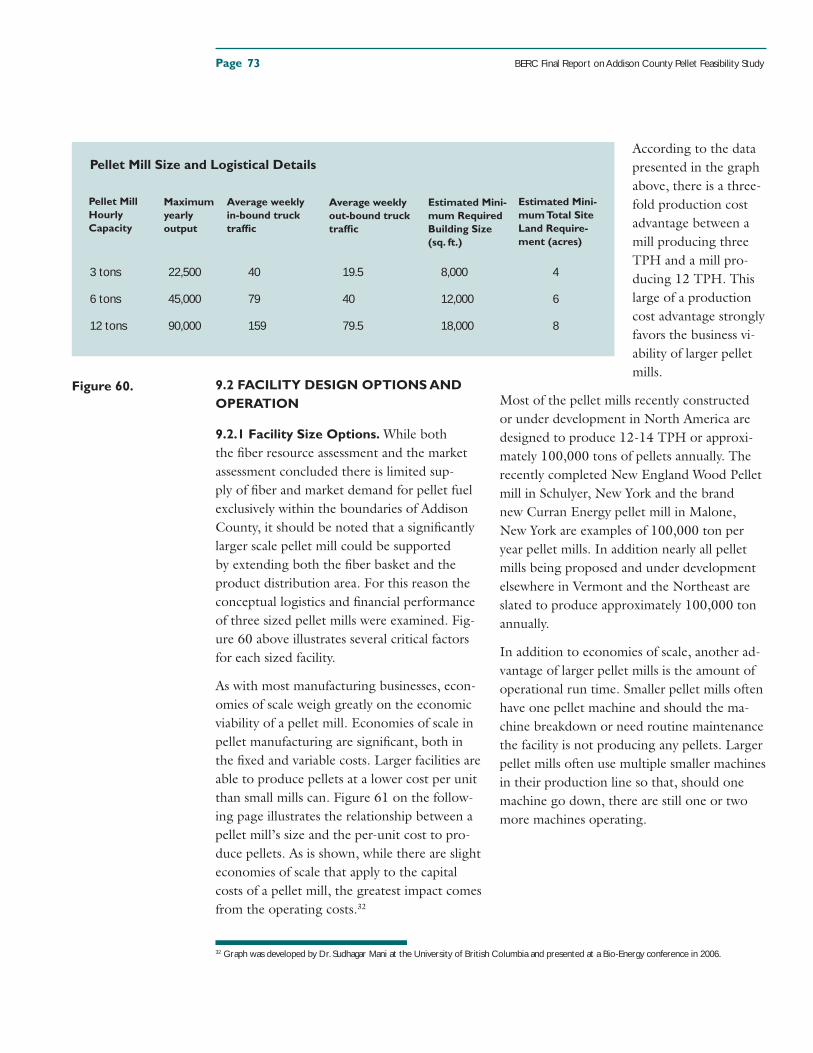
Page BERC Final Report on Addison County Pellet Feasibility Study
9.2 FACILITY DESIGN OPTIONS AND
OPERATION
9.2.1 Facility Size Options. While both
the fi ber resource assessment and the market
assessment concluded there is limited sup-
ply of fi ber and market demand for pellet fuel
exclusively within the boundaries of Addison
County, it should be noted that a signifi cantly
larger scale pellet mill could be supported
by extending both the fi ber basket and the
product distribution area. For this reason the
conceptual logistics and fi nancial performance
of three sized pellet mills were examined. Fig-
ure 60 above illustrates several critical factors
for each sized facility.
As with most manufacturing businesses, econ-
omies of scale weigh greatly on the economic
viability of a pellet mill. Economies of scale in
pellet manufacturing are signifi cant, both in
the fi xed and variable costs. Larger facilities are
able to produce pellets at a lower cost per unit
than small mills can. Figure 61 on the follow-
ing page illustrates the relationship between a
pellet mill’s size and the per-unit cost to pro-
duce pellets. As is shown, while there are slight
economies of scale that apply to the capital
costs of a pellet mill, the greatest impact comes
from the operating costs.32
According to the data
presented in the graph
above, there is a three-
fold production cost
advantage between a
mill producing three
TPH and a mill pro-
ducing 12 TPH. This
large of a production
cost advantage strongly
favors the business vi-
ability of larger pellet
mills.
Most of the pellet mills recently constructed
or under development in North America are
designed to produce 12-14 TPH or approxi-
mately 100,000 tons of pellets annually. The
recently completed New England Wood Pellet
mill in Schulyer, New York and the brand
new Curran Energy pellet mill in Malone,
New York are examples of 100,000 ton per
year pellet mills. In addition nearly all pellet
mills being proposed and under development
elsewhere in Vermont and the Northeast are
slated to produce approximately 100,000 ton
annually.
In addition to economies of scale, another ad-
vantage of larger pellet mills is the amount of
operational run time. Smaller pellet mills often
have one pellet machine and should the ma-
chine breakdown or need routine maintenance
the facility is not producing any pellets. Larger
pellet mills often use multiple smaller machines
in their production line so that, should one
machine go down, there are still one or two
more machines operating.
Figure 60.
32 Graph was developed by Dr. Sudhagar Mani at the University of British Columbia and presented at a Bio-Energy conference in 2006.
Pellet Mill Size and Logistical Details
3 tons 22,500 40 19.5 8,000 4
6 tons 45,000 79 40 12,000 6
12 tons 90,000 159 79.5 18,000 8
Estimated Mini-mum Total Site Land Require-ment (acres)
Pellet Mill Hourly Capacity
Maximum yearly output
Average weekly in-bound truck traffi c
Average weekly out-bound truck traffi c
Estimated Mini-mum Required Building Size (sq. ft.)
73
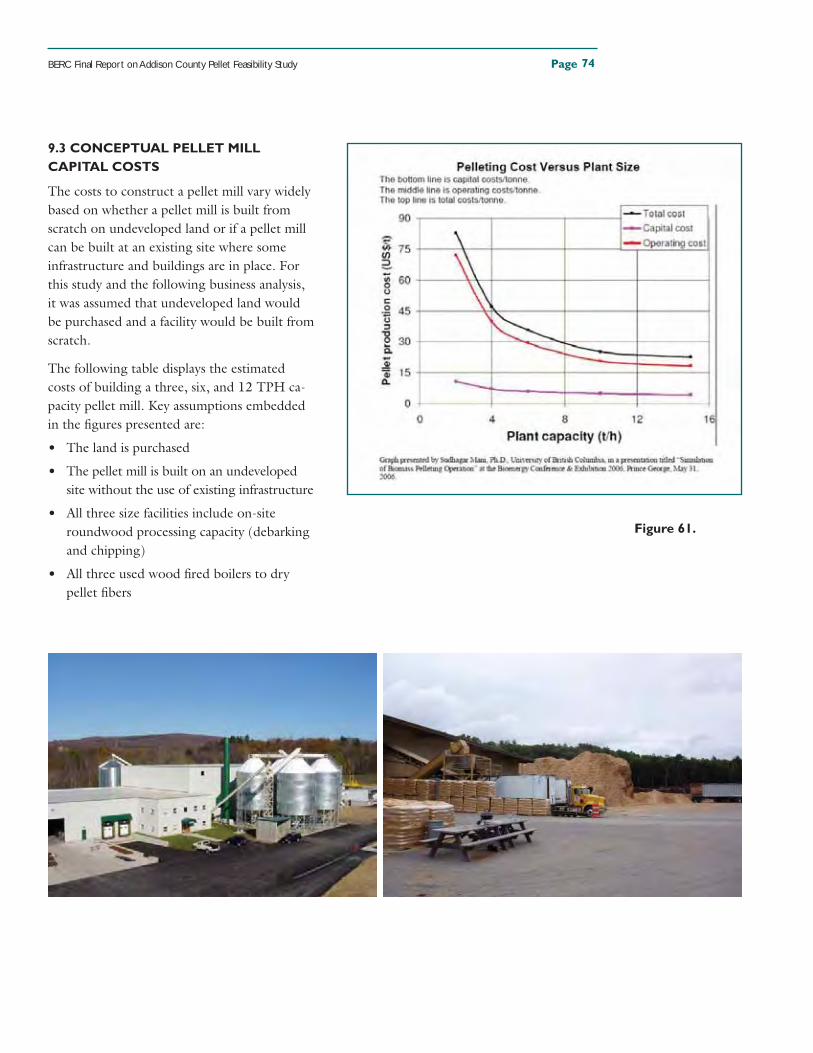
BERC Final Report on Addison County Pellet Feasibility Study Page
9.3 CONCEPTUAL PELLET MILL
CAPITAL COSTS
The costs to construct a pellet mill vary widely
based on whether a pellet mill is built from
scratch on undeveloped land or if a pellet mill
can be built at an existing site where some
infrastructure and buildings are in place. For
this study and the following business analysis,
it was assumed that undeveloped land would
be purchased and a facility would be built from
scratch.
The following table displays the estimated
costs of building a three, six, and 12 TPH ca-
pacity pellet mill. Key assumptions embedded
in the fi gures presented are:
• The land is purchased
• The pellet mill is built on an undeveloped
site without the use of existing infrastructure
• All three size facilities include on-site
roundwood processing capacity (debarking
and chipping)
• All three used wood fi red boilers to dry
pellet fi bers
Figure 61.
74
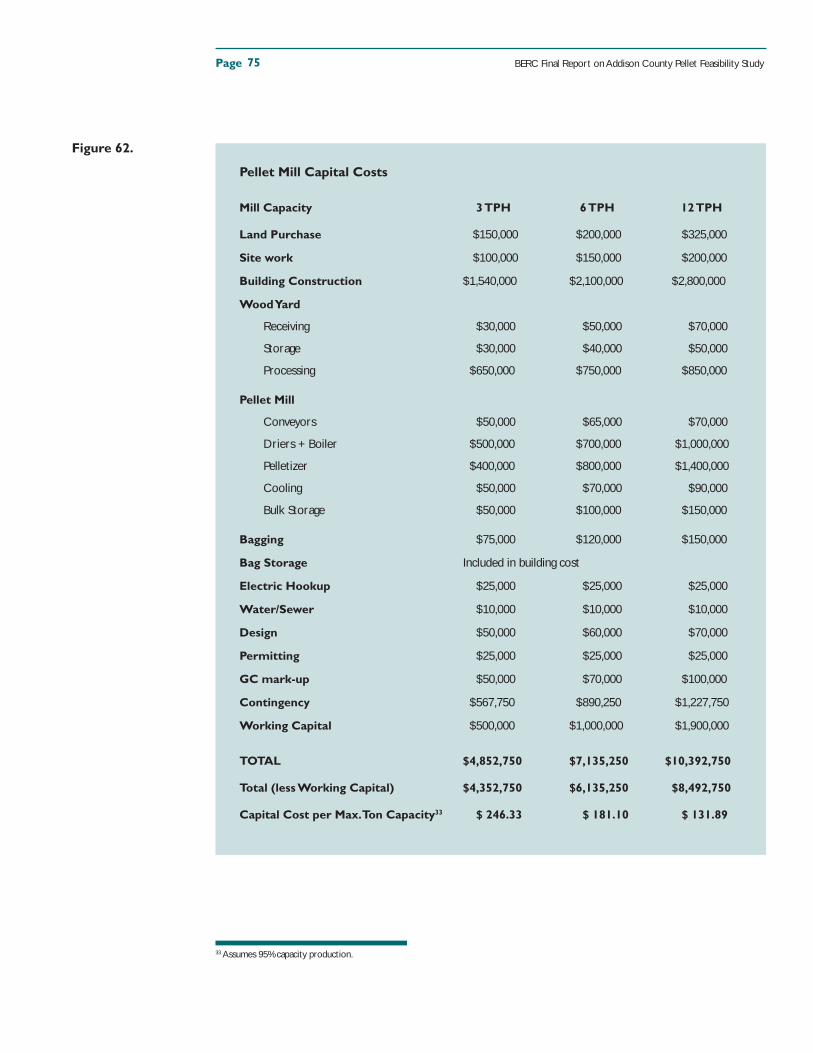
Page BERC Final Report on Addison County Pellet Feasibility Study
Pellet Mill Capital Costs
Mill Capacity 3 TPH 6 TPH 12 TPH
Land Purchase $150,000 $200,000 $325,000
Site work $100,000 $150,000 $200,000
Building Construction $1,540,000 $2,100,000 $2,800,000
Wood Yard
Receiving $30,000 $50,000 $70,000
Storage $30,000 $40,000 $50,000
Processing $650,000 $750,000 $850,000
Pellet Mill
Conveyors $50,000 $65,000 $70,000
Driers + Boiler $500,000 $700,000 $1,000,000
Pelletizer $400,000 $800,000 $1,400,000
Cooling $50,000 $70,000 $90,000
Bulk Storage $50,000 $100,000 $150,000
Bagging $75,000 $120,000 $150,000
Bag Storage Included in building cost
Electric Hookup $25,000 $25,000 $25,000
Water/Sewer $10,000 $10,000 $10,000
Design $50,000 $60,000 $70,000
Permitting $25,000 $25,000 $25,000
GC mark-up $50,000 $70,000 $100,000
Contingency $567,750 $890,250 $1,227,750
Working Capital $500,000 $1,000,000 $1,900,000
TOTAL $4,852,750 $7,135,250 $10,392,750
Total (less Working Capital) $4,352,750 $6,135,250 $8,492,750
Capital Cost per Max. Ton Capacity33 $ 246.33 $ 181.10 $ 131.89
Figure 62.
33 Assumes 95% capacity production.
75
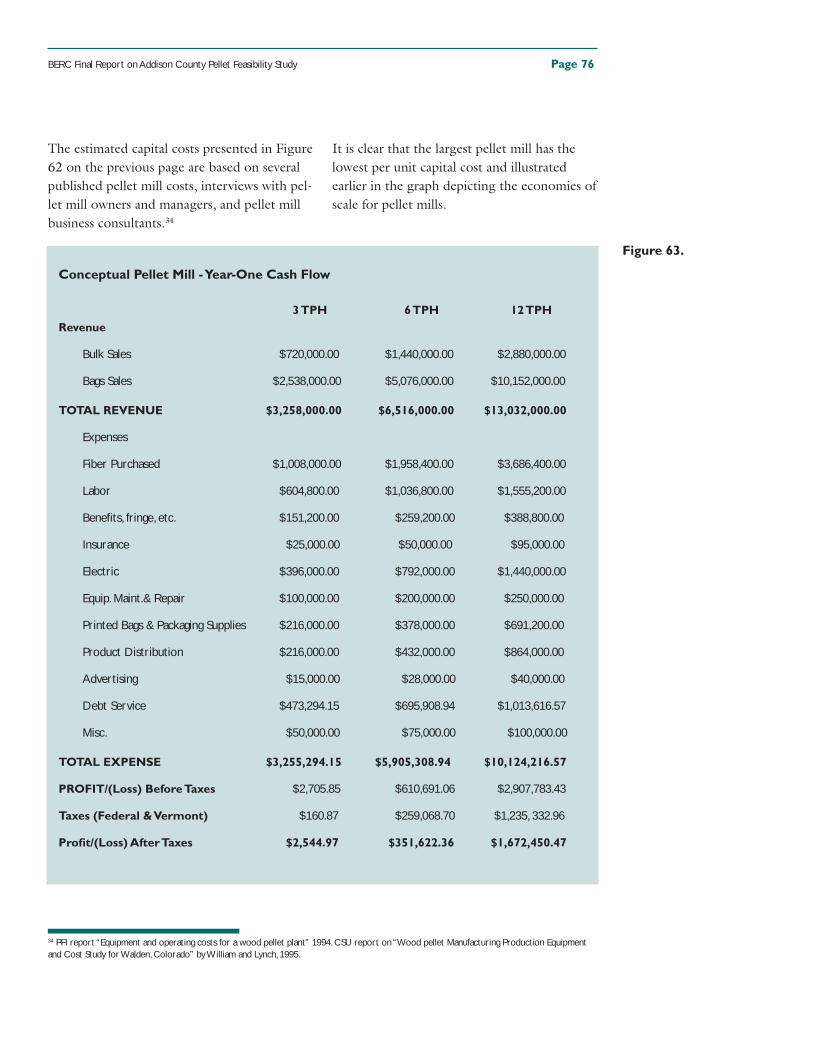
BERC Final Report on Addison County Pellet Feasibility Study Page
The estimated capital costs presented in Figure
62 on the previous page are based on several
published pellet mill costs, interviews with pel-
let mill owners and managers, and pellet mill
business consultants.34
It is clear that the largest pellet mill has the
lowest per unit capital cost and illustrated
earlier in the graph depicting the economies of
scale for pellet mills.
Conceptual Pellet Mill - Year-One Cash Flow
3 TPH 6 TPH 12 TPHRevenue
Bulk Sales $720,000.00 $1,440,000.00 $2,880,000.00
Bags Sales $2,538,000.00 $5,076,000.00 $10,152,000.00
TOTAL REVENUE $3,258,000.00 $6,516,000.00 $13,032,000.00
Expenses
Fiber Purchased $1,008,000.00 $1,958,400.00 $3,686,400.00
Labor $604,800.00 $1,036,800.00 $1,555,200.00
Benefi ts, fringe, etc. $151,200.00 $259,200.00 $388,800.00
Insurance $25,000.00 $50,000.00 $95,000.00
Electric $396,000.00 $792,000.00 $1,440,000.00
Equip. Maint.& Repair $100,000.00 $200,000.00 $250,000.00
Printed Bags & Packaging Supplies $216,000.00 $378,000.00 $691,200.00
Product Distribution $216,000.00 $432,000.00 $864,000.00
Advertising $15,000.00 $28,000.00 $40,000.00
Debt Service $473,294.15 $695,908.94 $1,013,616.57
Misc. $50,000.00 $75,000.00 $100,000.00
TOTAL EXPENSE $3,255,294.15 $5,905,308.94 $10,124,216.57
PROFIT/(Loss) Before Taxes $2,705.85 $610,691.06 $2,907,783.43
Taxes (Federal & Vermont) $160.87 $259,068.70 $1,235, 332.96
Profi t/(Loss) After Taxes $2,544.97 $351,622.36 $1,672,450.47
Figure 63.
34 PFI report “Equipment and operating costs for a wood pellet plant” 1994. CSU report on “Wood pellet Manufacturing Production Equipment and Cost Study for Walden, Colorado” by William and Lynch, 1995.
76
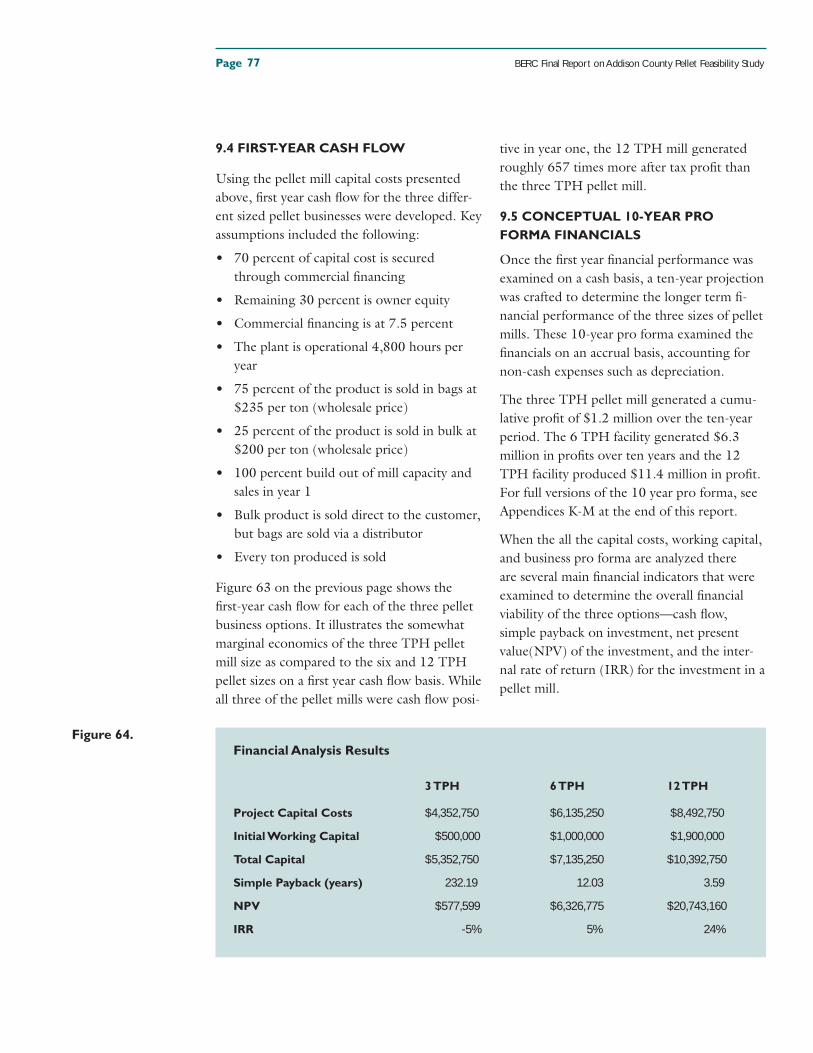
Page BERC Final Report on Addison County Pellet Feasibility Study
9.4 FIRST-YEAR CASH FLOW
Using the pellet mill capital costs presented
above, fi rst year cash fl ow for the three differ-
ent sized pellet businesses were developed. Key
assumptions included the following:
• 70 percent of capital cost is secured
through commercial fi nancing
• Remaining 30 percent is owner equity
• Commercial fi nancing is at 7.5 percent
• The plant is operational 4,800 hours per
year
• 75 percent of the product is sold in bags at
$235 per ton (wholesale price)
• 25 percent of the product is sold in bulk at
$200 per ton (wholesale price)
• 100 percent build out of mill capacity and
sales in year 1
• Bulk product is sold direct to the customer,
but bags are sold via a distributor
• Every ton produced is sold
Figure 63 on the previous page shows the
fi rst-year cash fl ow for each of the three pellet
business options. It illustrates the somewhat
marginal economics of the three TPH pellet
mill size as compared to the six and 12 TPH
pellet sizes on a fi rst year cash fl ow basis. While
all three of the pellet mills were cash fl ow posi-
tive in year one, the 12 TPH mill generated
roughly 657 times more after tax profi t than
the three TPH pellet mill.
9.5 CONCEPTUAL 10-YEAR PRO
FORMA FINANCIALS
Once the fi rst year fi nancial performance was
examined on a cash basis, a ten-year projection
was crafted to determine the longer term fi -
nancial performance of the three sizes of pellet
mills. These 10-year pro forma examined the
fi nancials on an accrual basis, accounting for
non-cash expenses such as depreciation.
The three TPH pellet mill generated a cumu-
lative profi t of $1.2 million over the ten-year
period. The 6 TPH facility generated $6.3
million in profi ts over ten years and the 12
TPH facility produced $11.4 million in profi t.
For full versions of the 10 year pro forma, see
Appendices K-M at the end of this report.
When the all the capital costs, working capital,
and business pro forma are analyzed there
are several main fi nancial indicators that were
examined to determine the overall fi nancial
viability of the three options—cash fl ow,
simple payback on investment, net present
value(NPV) of the investment, and the inter-
nal rate of return (IRR) for the investment in a
pellet mill.
Financial Analysis Results
3 TPH 6 TPH 12 TPH
Project Capital Costs $4,352,750 $6,135,250 $8,492,750
Initial Working Capital $500,000 $1,000,000 $1,900,000
Total Capital $5,352,750 $7,135,250 $10,392,750
Simple Payback (years) 232.19 12.03 3.59
NPV $577,599 $6,326,775 $20,743,160
IRR -5% 5% 24%
Figure 64.
77
BERC Final Report on Addison County Pellet Feasibility Study Page
The three TPH pellet mill option was cash
fl ow negative in the fi rst year but turning cash
fl ow positive in the second year and sustaining
continued revenue greater than expense for the
remainder of the ten year analysis period. Both
the six and twelve ton per hour pellet mill op-
tions proved cash fl ow positive in the fi rst year.
Simple payback (fi rst year profi t before taxes
divided by total capital invested) was calculated
for all three pellet mill size options and the
three ton per hour mill’s small profi t margin
would require over 200 years to pay back the
investment made in the mill. The six ton per
hour pellet mill size option generated a fi rst
year profi t margin suffi cient to pay back the
investment made in just over 12 years. The
twelve ton per hour pellet mill size option gen-
erated the largest profi t and the fastest payback
of less than four years. While simple payback
can be a helpful basic indicator of fi nancial
performance it is not sophisticated enough to
account for the changing annual performance
of a business. For this reason, both NPV and
IRR of the investment in a pellet business are
better metrics of fi nancial performance.
NPV is a very detailed fi nancial tool, that
measures the value of the invest performance
over the time fi nancial analysis time-period
(10 years) at today’s dollar value. The NPV of
all three pellet mill size options was calculated
and only the 12 TPH mill generated a NPV
greater than the total capital requirements.
IRR is based on NPV calculations but trans-
lates the fi nancial performance of an invest-
ment (like a pellet manufacturing business)
into a rate of interest earned on the invest-
ment. Most investors require a higher IRR on
the investment in a business than what they
could earn by investing their money in stocks,
bonds, and other possible investments. The
IRR of investing in a business with a high level
of risk needs to well exceed the rate of return
on lower risk investment opportunities.
The IRR for all three pellet mill size options
were calculated and only the twelve ton per
hour option generated a rate of return greater
than typical market rates of 7-9 percent.
While this analysis clearly leans toward the
larger pellet mill as the most fi nancially viable
option, it is extremely important to note that
if the cost to construct a pellet mill could be
lowered signifi cantly (such as co-locating at
an existing facility with some of the necessary
infrastructure in place) the economic indicators
would look dramatically better. The analysis
presented in this report was based on the cost
to construct a pellet mill on undeveloped land.
For example, if the 3 TPH pellet mill could be
built and launched for $3 million, the simple
payback would fall to just less than 30 years
and the IRR would increase to 4 percent. If
typical investors are looking for simple pay-
backs less than fi ve years and rates of return
better than market performance, the three
TPH size option is not viable even if the capital
costs could be trimmed down to $3 million.
9.6 PELLET FUEL MARKET
COMPETITION
According the Pellet Fuel Institute there are
currently over 80 established pellet mills oper-
ating in North America and producing in ex-
cess of 1.1 million tons annually. Not included
in this fi gure are the countless proposed pellet
mills—some of which will likely be built and
some of which will not proceed beyond the
planning stage. A quick survey of bagged pel-
let retailers in Vermont showed there are pel-
lets from New Hampshire, Maine, New York,
Pennsylvania, Colorado, British Columbia and
Quebec already being sold.
The following section reviews those existing and
proposed pellet mills within a reasonable distance
from Addison County. Some of these mills may
be in direct competition with a mill in Addison
County for feedstock as well as for pellet sales.
78
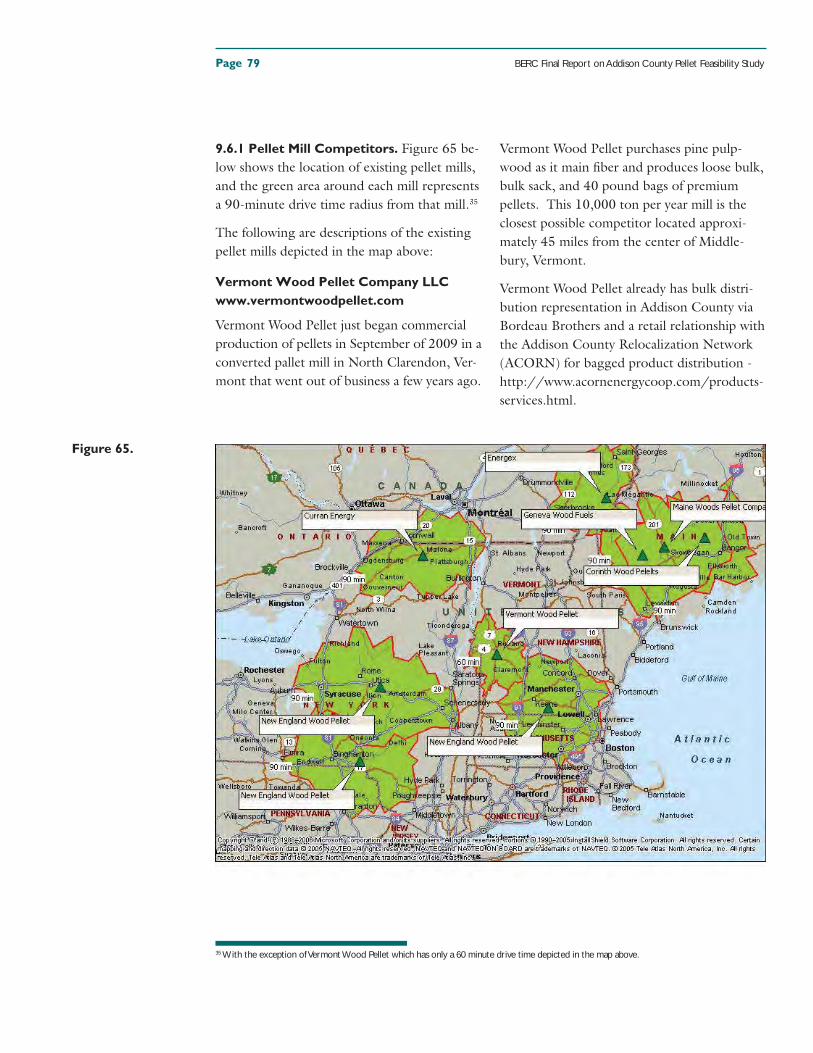
Page BERC Final Report on Addison County Pellet Feasibility Study
9.6.1 Pellet Mill Competitors. Figure 65 be-
low shows the location of existing pellet mills,
and the green area around each mill represents
a 90-minute drive time radius from that mill.35
The following are descriptions of the existing
pellet mills depicted in the map above:
Vermont Wood Pellet Company LLC
www.vermontwoodpellet.com
Vermont Wood Pellet just began commercial
production of pellets in September of 2009 in a
converted pallet mill in North Clarendon, Ver-
mont that went out of business a few years ago.
Vermont Wood Pellet purchases pine pulp-
wood as it main fi ber and produces loose bulk,
bulk sack, and 40 pound bags of premium
pellets. This 10,000 ton per year mill is the
closest possible competitor located approxi-
mately 45 miles from the center of Middle-
bury, Vermont.
Vermont Wood Pellet already has bulk distri-
bution representation in Addison County via
Bordeau Brothers and a retail relationship with
the Addison County Relocalization Network
(ACORN) for bagged product distribution -
http://www.acornenergycoop.com/products-
services.html.
Figure 65.
35 With the exception of Vermont Wood Pellet which has only a 60 minute drive time depicted in the map above.
79
BERC Final Report on Addison County Pellet Feasibility Study Page
Curran Renewable Energy LLC
www.curranpellets.com
Pat Curran, owner of Seaway Timber Harvest-
ing, has built and is nearing completion of a
new pellet mill located in Malone, New York.
This mill would produce 100,000 tons of
fi nished pellets annually and consume approxi-
mately 200,000 tons annually. It is expected
that Curran Energy will be operating at near
capacity in late 2009. Curran Energy uses pa-
per grade woodchips from its own substantial
in woods chipping operations that use fl ail-de-
barker chippers. This mill is approximately 130
miles from the center of Middlebury, Vermont.
New England Wood Pellet
www.pelletheat.com
New England Wood Pellet (NEWP) owns and
operates two existing pellet mills and has a third
under development. NEWP’s fl ag ship facility is
located in Jaffrey, New Hampshire, which is 130
miles from the center of Middlebury, Vermont.
Its recently completed second mill, located in
Schuyler, New York, is 170 miles away from
Middlebury. NEWP recently announced its
acquisition of Norbord’s Medium Density Fi-
berboard facility in Deposit, New York that will
be converted into a third pellet mill. It will be
located more than 200 miles away from Mid-
dlebury. In addition to the three pellet mills,
NEWP operates a pellet distribution center in
Palmer, Massachusetts where railcars of loose
pellets from British Columbia are off-loaded
and repackaged for the New England market.
Energex
www.energex.com
Energex operates two pellet mills in the re-
gion—the fi rst in Miffl intown, Pennsylvania
and the second in Lac-Megantic, Quebec. The
Quebec mill is 160 miles from the center of
Middlebury, Vermont and the Pennsylvania
mill is too far away to effectively compete with
a mill in Addison County.
Maine Woods Pellet Company
www.mainewoodspelletco.com
This recently completed pellet mill is located
in Athens, Maine. This pellet mill can produce
up to 100,000 tons of pellets annually and
distribute both bulk and bags.
Corinth Wood Pellets
www.corinthwoodpellets.com
Corinth Wood Pellets is another new pellet mill
in Central Maine that has just come on-line in
the last year. They produce hardwood pellets
and distribute bulk and bagged product.
The following are descriptions of known pro-
posals for new pellet mills in Vermont. While
these projects are currently under development
and are moving forward, there is no guarantee
they will be built.
Vermont Renewable Energy Company
LLC (Pellet Mill), Island Pond, Vermont
As of February 2009, a Newport, Vermont-
based couple has been planning to turn the
closed Ethan Allen furniture factory in Island
Pond into a wood pellet manufacturing plant.
Vermont Renewable Energy Company LLC
will produce 50,000 tons of wood pellets a
year with capacity to produce 100,000 tons
annually. If built, this mill would be 160 miles
from the center of Middlebury, Vermont.
International Wood Fuels
www.iwoodfuels.com
International Wood Fuels has recently begun
construction of a pellet mill located in Maine
but this company has been looking to establish
a pellet mill somewhere in Vermont. IWF had
been considering the possibility of locating
at the Old Burke Lumber site located in the
town of Sutton but is reportedly evaluating
other options at this time.
80
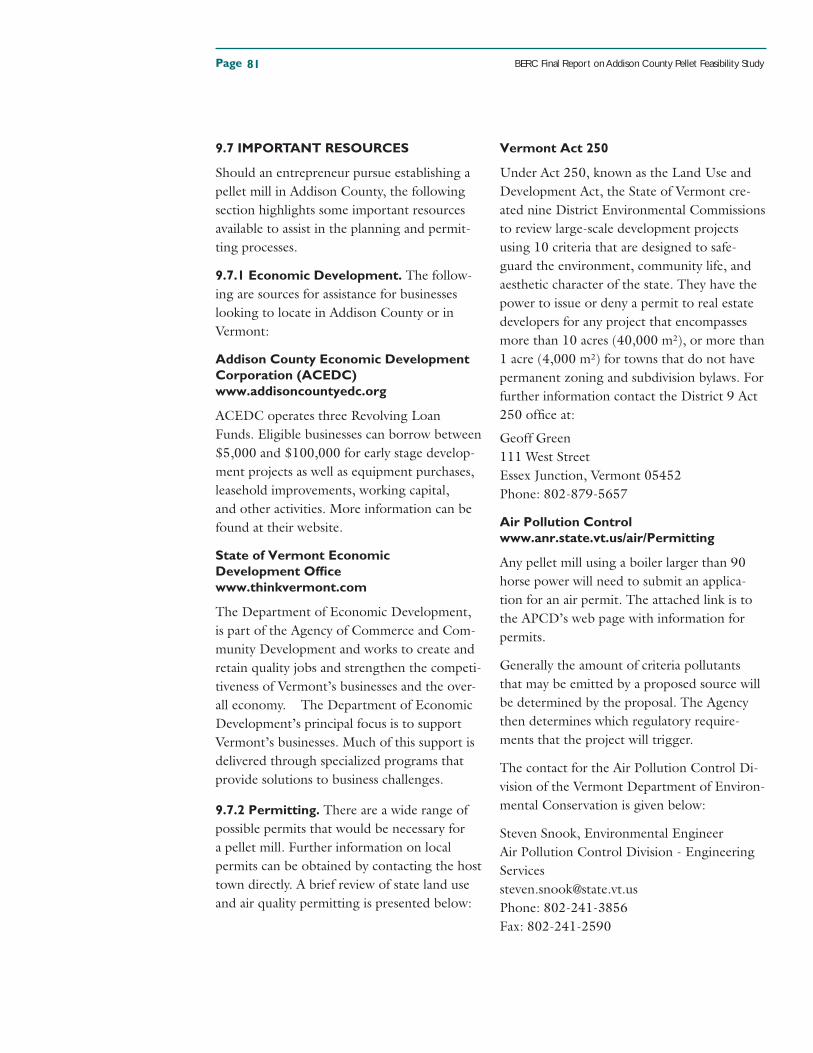
Page BERC Final Report on Addison County Pellet Feasibility Study
9.7 IMPORTANT RESOURCES
Should an entrepreneur pursue establishing a
pellet mill in Addison County, the following
section highlights some important resources
available to assist in the planning and permit-
ting processes.
9.7.1 Economic Development. The follow-
ing are sources for assistance for businesses
looking to locate in Addison County or in
Vermont:
Addison County Economic Development
Corporation (ACEDC)
www.addisoncountyedc.org
ACEDC operates three Revolving Loan
Funds. Eligible businesses can borrow between
$5,000 and $100,000 for early stage develop-
ment projects as well as equipment purchases,
leasehold improvements, working capital,
and other activities. More information can be
found at their website.
State of Vermont Economic
Development Offi ce
www.thinkvermont.com
The Department of Economic Development,
is part of the Agency of Commerce and Com-
munity Development and works to create and
retain quality jobs and strengthen the competi-
tiveness of Vermont’s businesses and the over-
all economy. The Department of Economic
Development’s principal focus is to support
Vermont’s businesses. Much of this support is
delivered through specialized programs that
provide solutions to business challenges.
9.7.2 Permitting. There are a wide range of
possible permits that would be necessary for
a pellet mill. Further information on local
permits can be obtained by contacting the host
town directly. A brief review of state land use
and air quality permitting is presented below:
Vermont Act 250
Under Act 250, known as the Land Use and
Development Act, the State of Vermont cre-
ated nine District Environmental Commissions
to review large-scale development projects
using 10 criteria that are designed to safe-
guard the environment, community life, and
aesthetic character of the state. They have the
power to issue or deny a permit to real estate
developers for any project that encompasses
more than 10 acres (40,000 m²), or more than
1 acre (4,000 m²) for towns that do not have
permanent zoning and subdivision bylaws. For
further information contact the District 9 Act
250 offi ce at:
Geoff Green
111 West Street
Essex Junction, Vermont 05452
Phone: 802-879-5657
Air Pollution Control
www.anr.state.vt.us/air/Permitting
Any pellet mill using a boiler larger than 90
horse power will need to submit an applica-
tion for an air permit. The attached link is to
the APCD’s web page with information for
permits.
Generally the amount of criteria pollutants
that may be emitted by a proposed source will
be determined by the proposal. The Agency
then determines which regulatory require-
ments that the project will trigger.
The contact for the Air Pollution Control Di-
vision of the Vermont Department of Environ-
mental Conservation is given below:
Steven Snook, Environmental Engineer
Air Pollution Control Division - Engineering
Services
Phone: 802-241-3856
Fax: 802-241-2590
81
BERC Final Report on Addison County Pellet Feasibility Study Page
Pellet heating is a growth industry where
demand for heating appliances and fuel has
been growing steadily for the decade. There is
a business opportunity to make pellet heat-
ing fuel in Vermont from Vermont resources
in effort to lower the current dependence on
imported heating fuels (oil, propane, and even
pellets).
There is virtually no supply of wood or
agricultural residues available for pellet fuel
making. Any fi ber would be sourced from har-
vested low grade wood or possibly from dedi-
cated energy crops such as grass. While there
is tremendous agricultural capacity to grow
grasses in Addison county, their viability as
pellet feedstock is limited. Wood fi ber would
be the primary fi ber input for a pellet making
business. When limiting factors such as access
and ownership are considered and current de-
mand for fi rewood are accounted for, there is
barely enough wood fi ber available in Addison
County to support a 3 TPH pellet mill. There
is ample supply of wood fi ber to build a 6 ton
per hour if the adjoining counties are included
in the fi ber basket.
There are several excellent possible pellet mill
locations in Addison County each one with its
own pros and cons.
There is currently insuffi cient market within
Addison County to support a 3 TPH facility.
With higher fossil heating fuel costs, more
market growth, and distribution to neighbor-
ing counties, Addison County could support a
6 TPH facility.
The economics of pellet fuel production
clearly favor larger facilities, but there are ways
in which a smaller pellet mill can be fi nancially
viable—namely reduction of the capital costs.
Figure 66 below summarizes the study
fi ndings.
10.0 Study Conclusions
Summary of Findings
Addison County Only Addison County + Rutland and Chittenden
3TPH 6TPH 12TPH 3TPH 6TPH 12TPH
Wood and Ag Fiber √ X X √ √ X
Site Locations √ √ √ √ √ √
Current Market X X X √ X X
Financial Feasibility ? ? √ ? ? √
Figure 66.
82

Page BERC Final Report on Addison County Pellet Feasibility Study
BERC Final Report on Addison County Pellet Feasibility Study Page
11.0 Appendices
Maps
A. Total Starting and Remaining Accessible Forestland
B. Total Starting and Remaining Functional Agricultural Land
C. Industrially and Commercially Zoned Areas in Addison County
D. Middlebury Industrial Park
E. Vermont Natural Agricultural Products – OMYA Quarry
F. Claire Lathrop Sawmill
G. A Johnson Company
H. White Pigment Mill – Phoenix Feed Mill
Online Market Surveys
I. Residential
J. Commercial
Ten-Year Pro Forma Financials
K. 3 TPH Mill
L. 6 TPH Mill
M. 12 TPH Mill
N. First-Year Cash Flow
Additional Resources
O. Pellet Mill Equipment Manufacturers
P. Pellet Dealers in Addison County
Addison County Pellet Addison County Pellet Feasibility StudyFeasibility Study

Page BERC Final Report on Addison County Pellet Feasibility Study
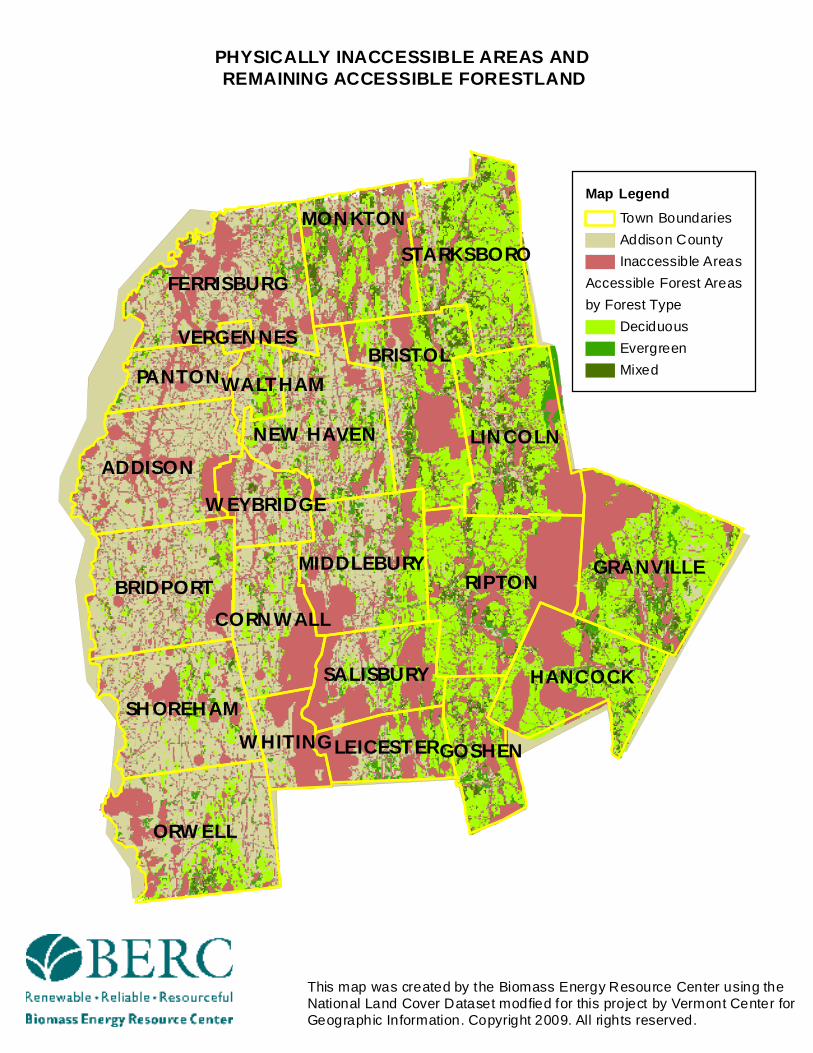
RIPTON
ORWELL
BRISTOL
LINCOLNADDISON
GRANVILLEBRIDPORT
FERRISBURG
SHOREHAMHANCOCK
NEW HAVEN
MONKTON
SALISBURY
LEICESTER
PANTON
STARKSBORO
MIDDLEBURY
GOSHEN
CORNWALL
WHITING
WEYBRIDGE
WALTHAM
VERGENNES
PHYSICALLY INACCESSIBLE AREAS AND REMAINING ACCESSIBLE FORESTLAND
Map LegendTown BoundariesAddison CountyInaccessible Areas
Accessible Forest Areasby Forest Type
DeciduousEvergreenMixed
This map was created by the Biomass Energy Resource Center using the National Land Cover Dataset modfied for this project by Vermont Center for Geographic Information. Copyright 2009. All rights reserved.
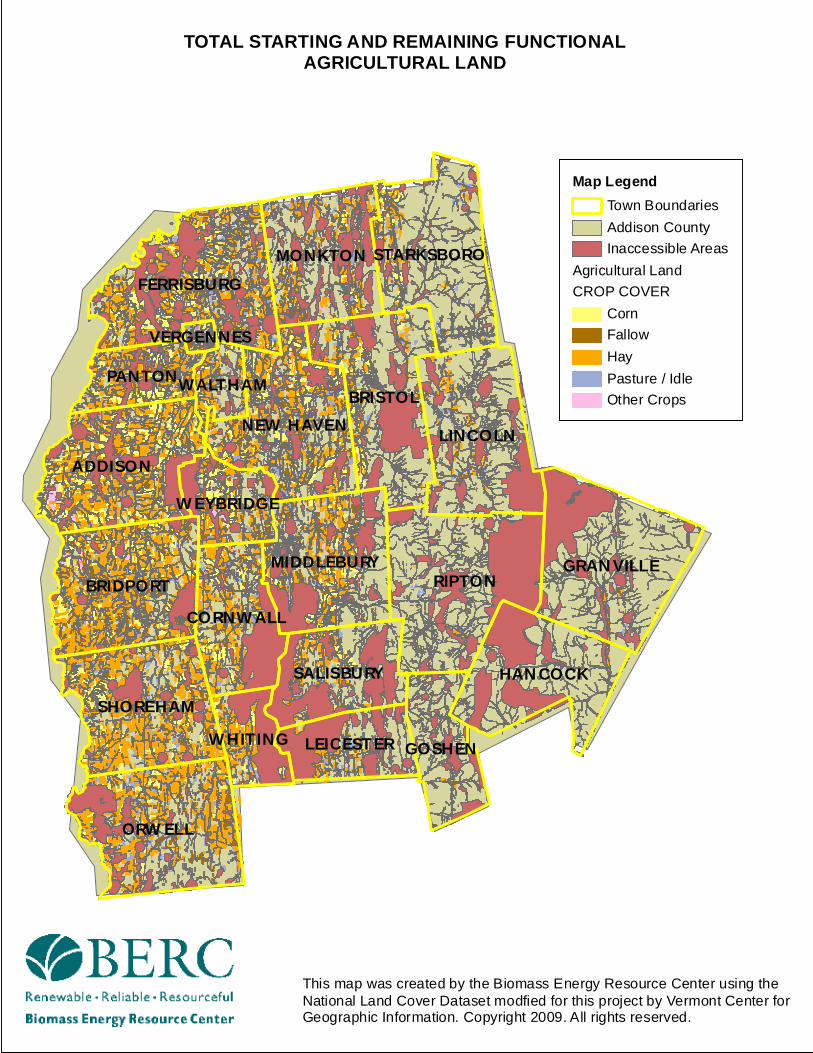
RIPTON
ORWELL
BRISTOLLINCOLN
ADDISON
GRANVILLEBRIDPORT
FERRISBURG
SHOREHAMHANCOCK
NEW HAVEN
MONKTON
MIDDLEBURY
SALISBURY
LEICESTER
PANTON
STARKSBORO
GOSHEN
CORNWALL
WHITING
WEYBRIDGE
WALTHAM
VERGENNES
TOTAL STARTING AND REMAINING FUNCTIONALAGRICULTURAL LAND
Map LegendTown BoundariesAddison CountyInaccessible Areas
Agricultural LandCROP COVER
CornFallowHayPasture / IdleOther Crops
This map was created by the Biomass Energy Resource Center using the National Land Cover Dataset modfied for this project by Vermont Center for Geographic Information. Copyright 2009. All rights reserved.
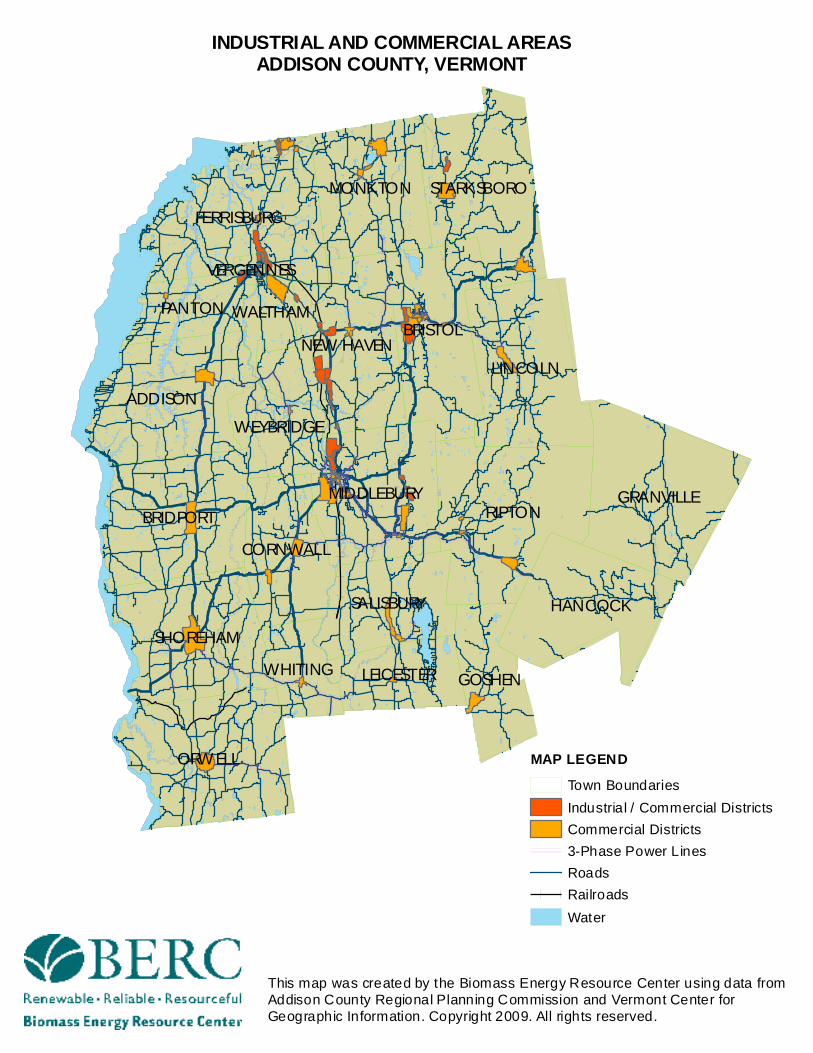
RIPTON
ORWELL
BRISTOL
LINCOLN
GRANVILLE
ADDISON
BRIDPORT
FERRISBURG
SHOREHAM
HANCOCK
NEW HAVEN
STARKSBOROMONKTON
MIDDLEBURY
SALISBURY
LEICESTER
PANTON
WEYBRIDGE
GOSHEN
CORNWALL
WHITING
WALTHAM
VERGENNES
MAP LEGENDTown BoundariesIndustrial / Commercial DistrictsCommercial Districts3-Phase Power LinesRoadsRailroadsWater
INDUSTRIAL AND COMMERCIAL AREASADDISON COUNTY, VERMONT
This map was created by the Biomass Energy Resource Center using data from Addison County Regional Planning Commission and Vermont Center for Geographic Information. Copyright 2009. All rights reserved.
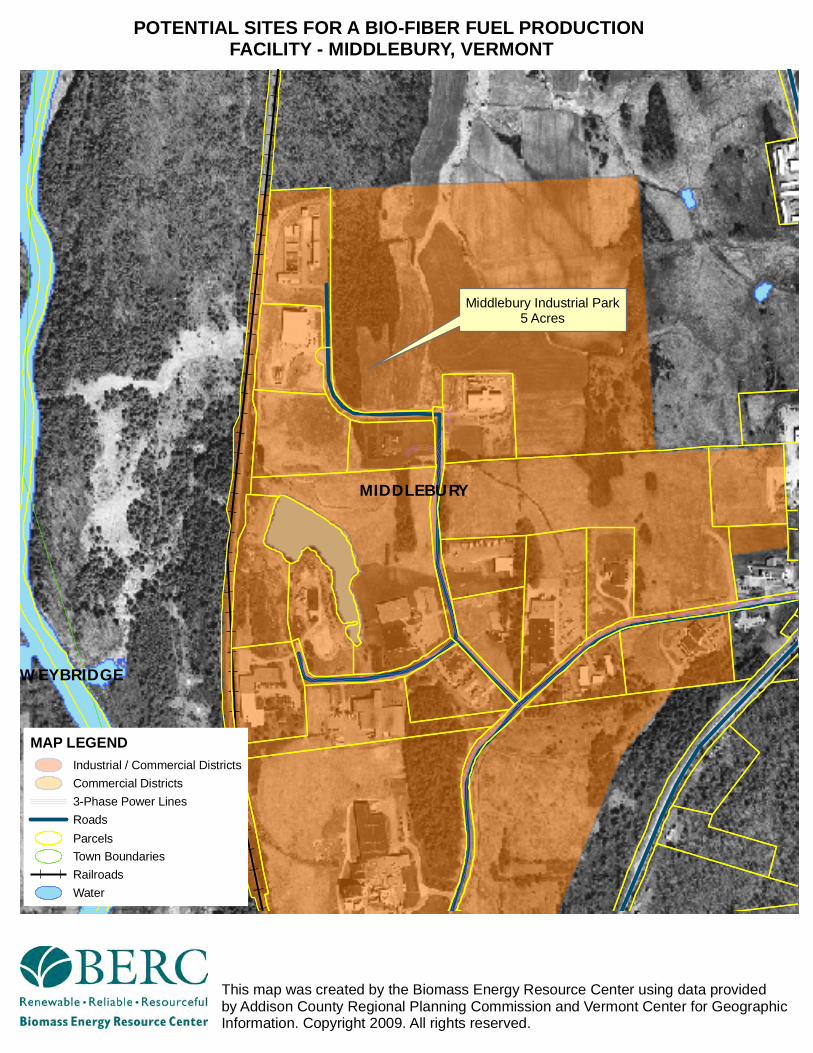
Middlebury Industrial Park5 Acres
MIDDLEBURY
WEYBRIDGE
MAP LEGENDIndustrial / Commercial DistrictsCommercial Districts3-Phase Power LinesRoadsParcelsTown BoundariesRailroadsWater
POTENTIAL SITES FOR A BIO-FIBER FUEL PRODUCTION FACILITY - MIDDLEBURY, VERMONT
This map was created by the Biomass Energy Resource Center using data provided by Addison County Regional Planning Commission and Vermont Center for Geographic Information. Copyright 2009. All rights reserved.
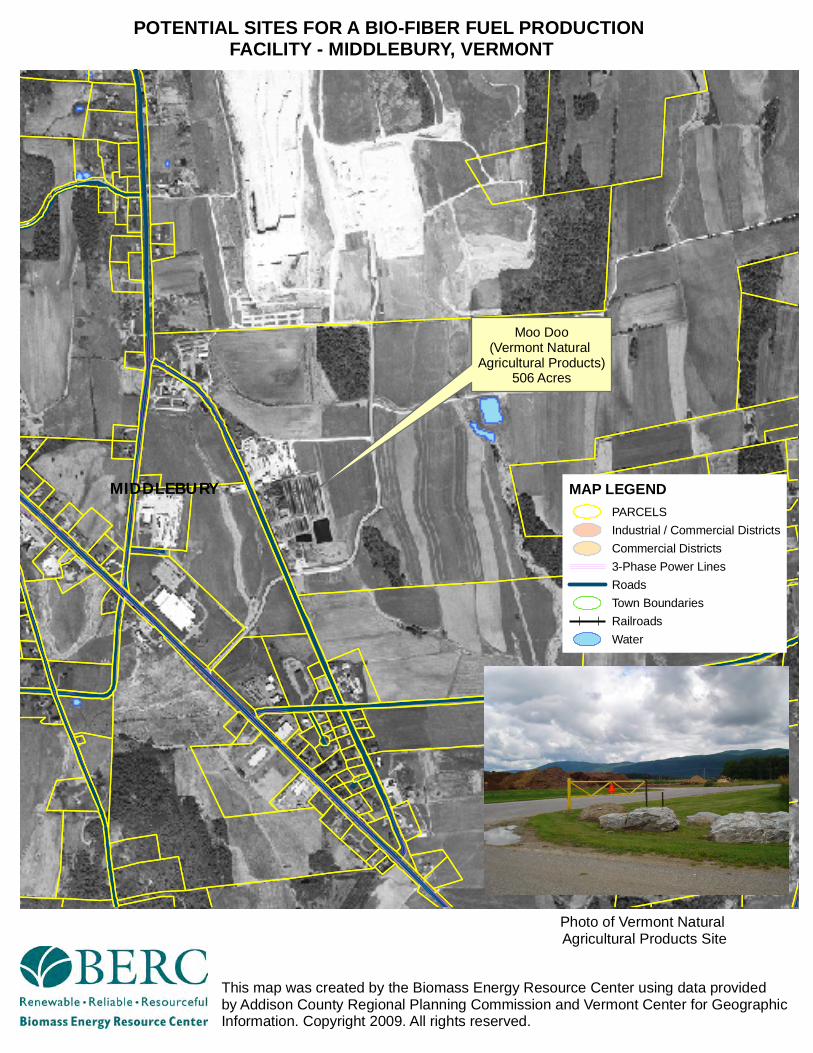
Moo Doo(Vermont Natural
Agricultural Products)506 Acres
MIDDLEBURY MAP LEGENDPARCELSIndustrial / Commercial DistrictsCommercial Districts3-Phase Power LinesRoadsTown BoundariesRailroadsWater
POTENTIAL SITES FOR A BIO-FIBER FUEL PRODUCTION FACILITY - MIDDLEBURY, VERMONT
This map was created by the Biomass Energy Resource Center using data provided by Addison County Regional Planning Commission and Vermont Center for Geographic Information. Copyright 2009. All rights reserved.
Photo of Vermont Natural Agricultural Products Site
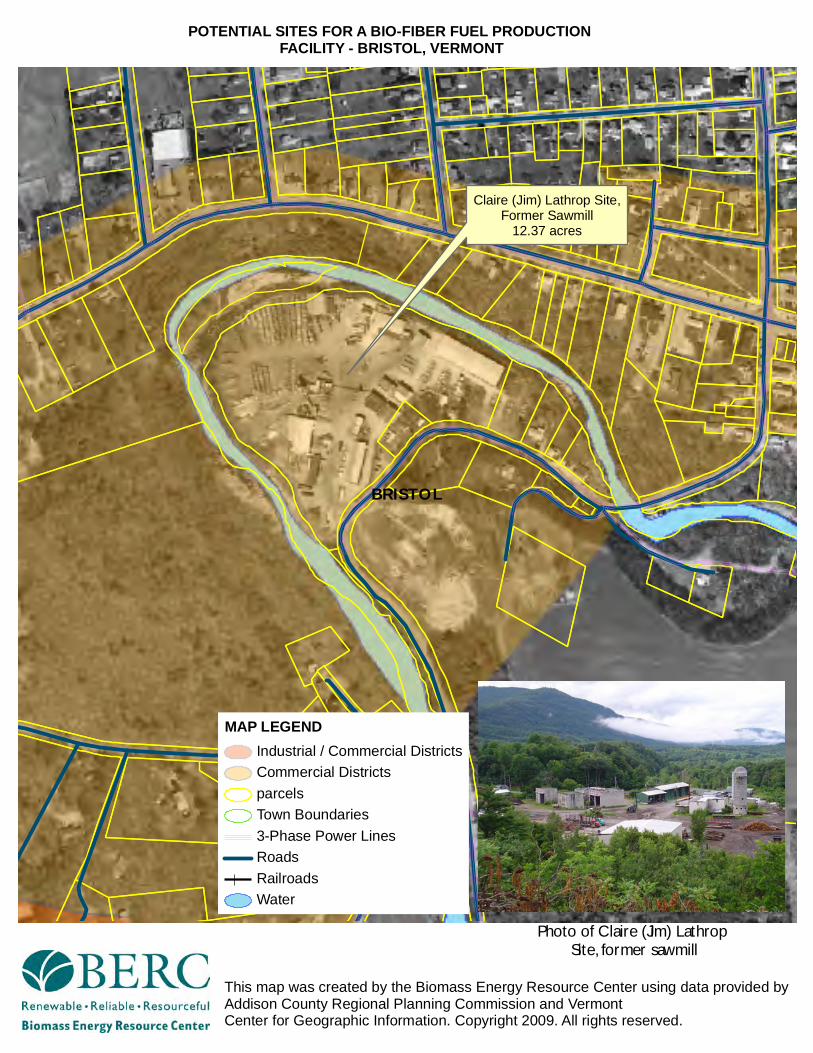
Claire (Jim) Lathrop Site,Former Sawmill
12.37 acres
BRISTOL
MAP LEGENDIndustrial / Commercial DistrictsCommercial DistrictsparcelsTown Boundaries3-Phase Power LinesRoadsRailroadsWater
POTENTIAL SITES FOR A BIO-FIBER FUEL PRODUCTION FACILITY - BRISTOL, VERMONT
This map was created by the Biomass Energy Resource Center using data provided by Addison County Regional Planning Commission and Vermont Center for Geographic Information. Copyright 2009. All rights reserved.
Photo of Claire (Jim) Lathrop Site, former sawmill
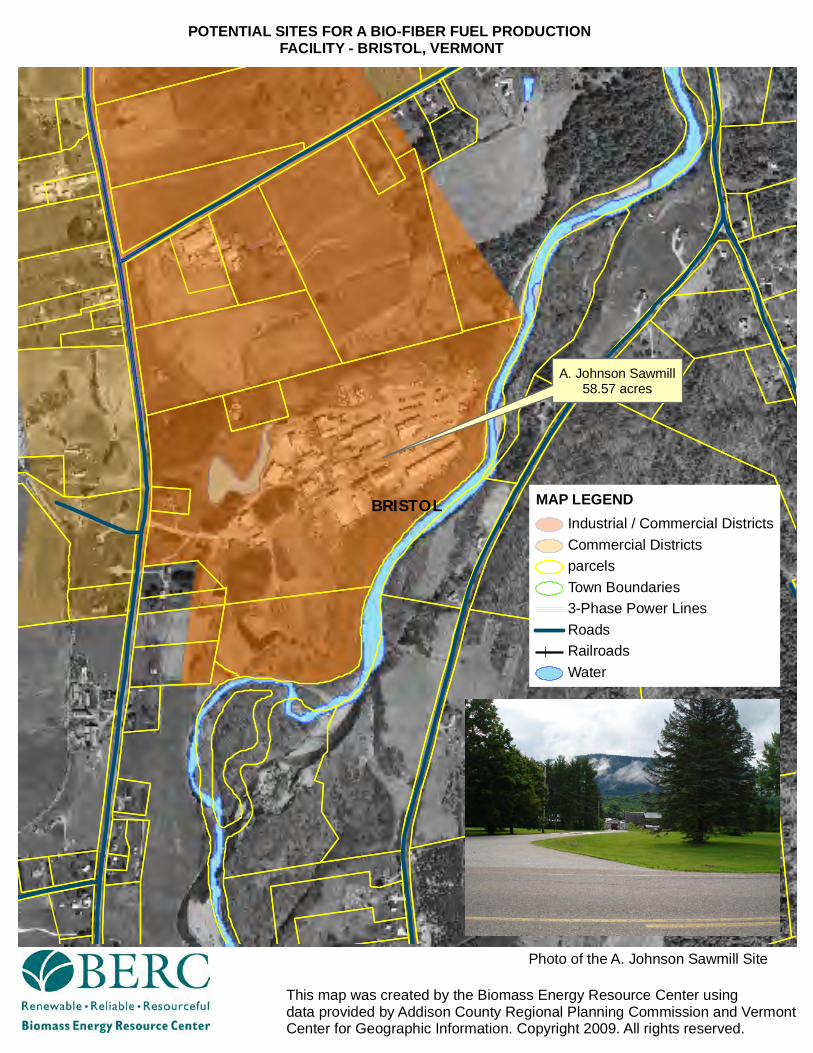
A. Johnson Sawmill58.57 acres
BRISTOL MAP LEGENDIndustrial / Commercial DistrictsCommercial DistrictsparcelsTown Boundaries3-Phase Power LinesRoadsRailroadsWater
POTENTIAL SITES FOR A BIO-FIBER FUEL PRODUCTION FACILITY - BRISTOL, VERMONT
This map was created by the Biomass Energy Resource Center using data provided by Addison County Regional Planning Commission and Vermont Center for Geographic Information. Copyright 2009. All rights reserved.
Photo of the A. Johnson Sawmill Site
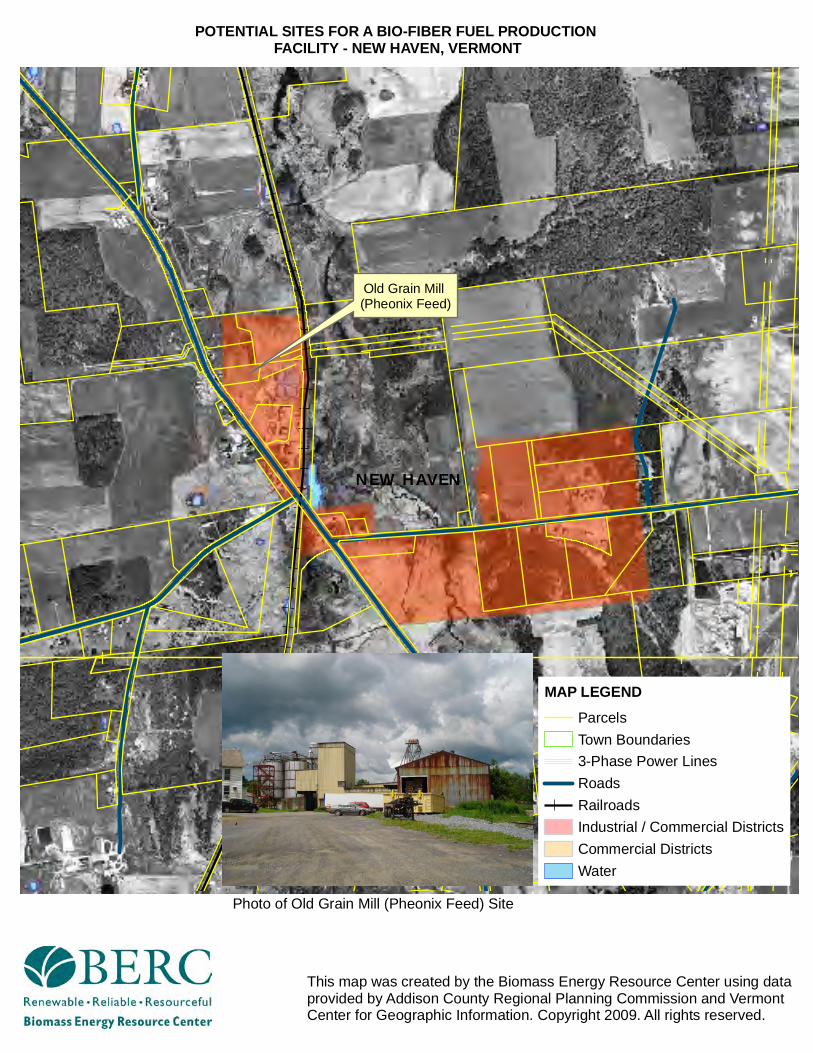
Old Grain Mill (Pheonix Feed)
NEW HAVEN
MAP LEGENDParcelsTown Boundaries3-Phase Power LinesRoadsRailroadsIndustrial / Commercial DistrictsCommercial DistrictsWater
POTENTIAL SITES FOR A BIO-FIBER FUEL PRODUCTION FACILITY - NEW HAVEN, VERMONT
This map was created by the Biomass Energy Resource Center using data provided by Addison County Regional Planning Commission and Vermont Center for Geographic Information. Copyright 2009. All rights reserved.
Photo of Old Grain Mill (Pheonix Feed) Site
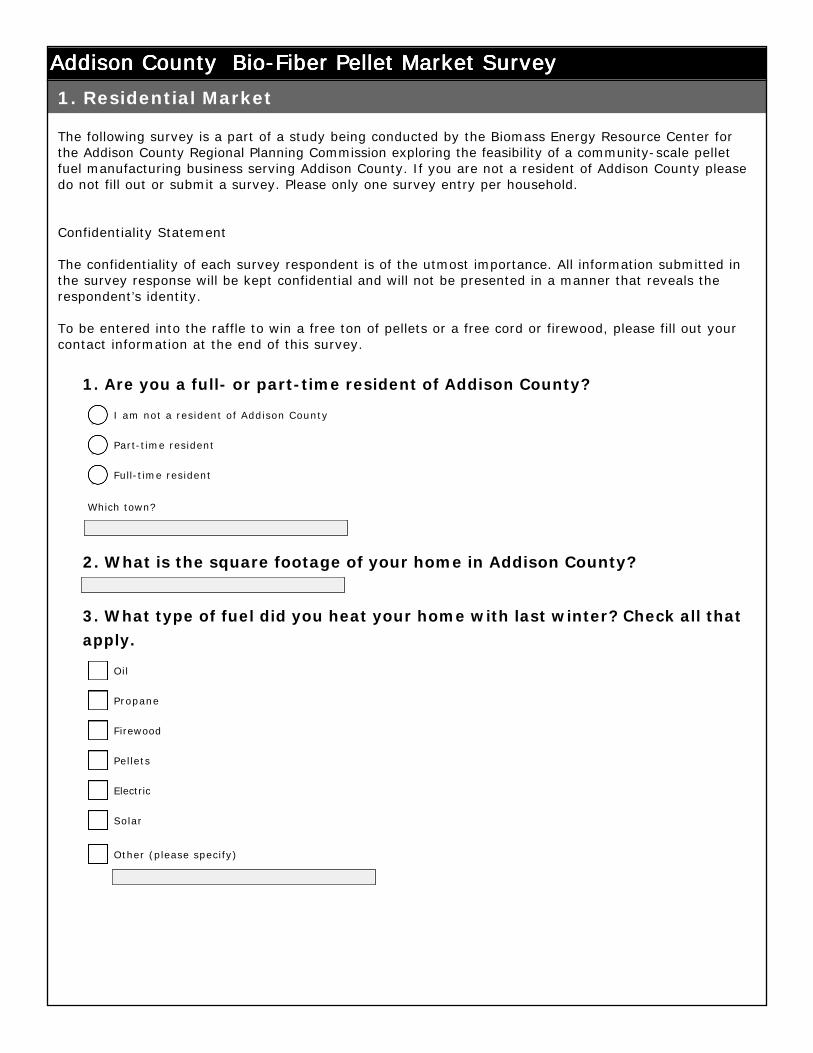
Addison County Bio-Fiber Pellet Market SurveyAddison County Bio-Fiber Pellet Market SurveyAddison County Bio-Fiber Pellet Market SurveyAddison County Bio-Fiber Pellet Market Survey
The following survey is a part of a study being conducted by the Biomass Energy Resource Center for the Addison County Regional Planning Commission exploring the feasibility of a community-scale pellet fuel manufacturing business serving Addison County. If you are not a resident of Addison County please do not fill out or submit a survey. Please only one survey entry per household.
Confidentiality Statement
The confidentiality of each survey respondent is of the utmost importance. All information submitted in the survey response will be kept confidential and will not be presented in a manner that reveals the respondent’s identity.
To be entered into the raffle to win a free ton of pellets or a free cord or firewood, please fill out your contact information at the end of this survey.
1. Are you a full- or part-time resident of Addison County?
2. What is the square footage of your home in Addison County?
3. What type of fuel did you heat your home with last winter? Check all that apply.
1. Residential Market
I am not a resident of Addison County
nmlkj
Part-time resident
nmlkj
Full-time resident
nmlkj
Which town?
Oil
gfedc
Propane
gfedc
Firewood
gfedc
Pellets
gfedc
Electric
gfedc
Solar
gfedc
Other (please specify)
gfedc
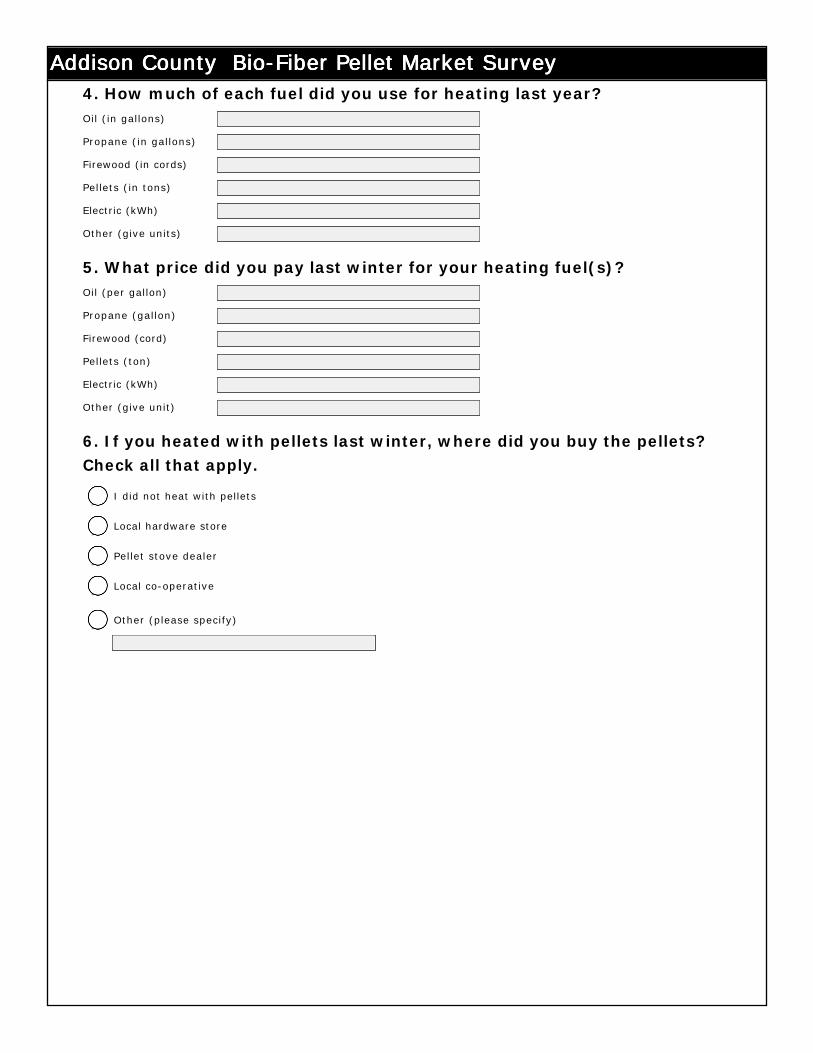
Addison County Bio-Fiber Pellet Market SurveyAddison County Bio-Fiber Pellet Market SurveyAddison County Bio-Fiber Pellet Market SurveyAddison County Bio-Fiber Pellet Market Survey4. How much of each fuel did you use for heating last year?
5. What price did you pay last winter for your heating fuel(s)?
6. If you heated with pellets last winter, where did you buy the pellets? Check all that apply.
Oil (in gallons)
Propane (in gallons)
Firewood (in cords)
Pellets (in tons)
Electric (kWh)
Other (give units)
Oil (per gallon)
Propane (gallon)
Firewood (cord)
Pellets (ton)
Electric (kWh)
Other (give unit)
I did not heat with pellets
nmlkj
Local hardware store
nmlkj
Pellet stove dealer
nmlkj
Local co-operative
nmlkj
Other (please specify)
nmlkj
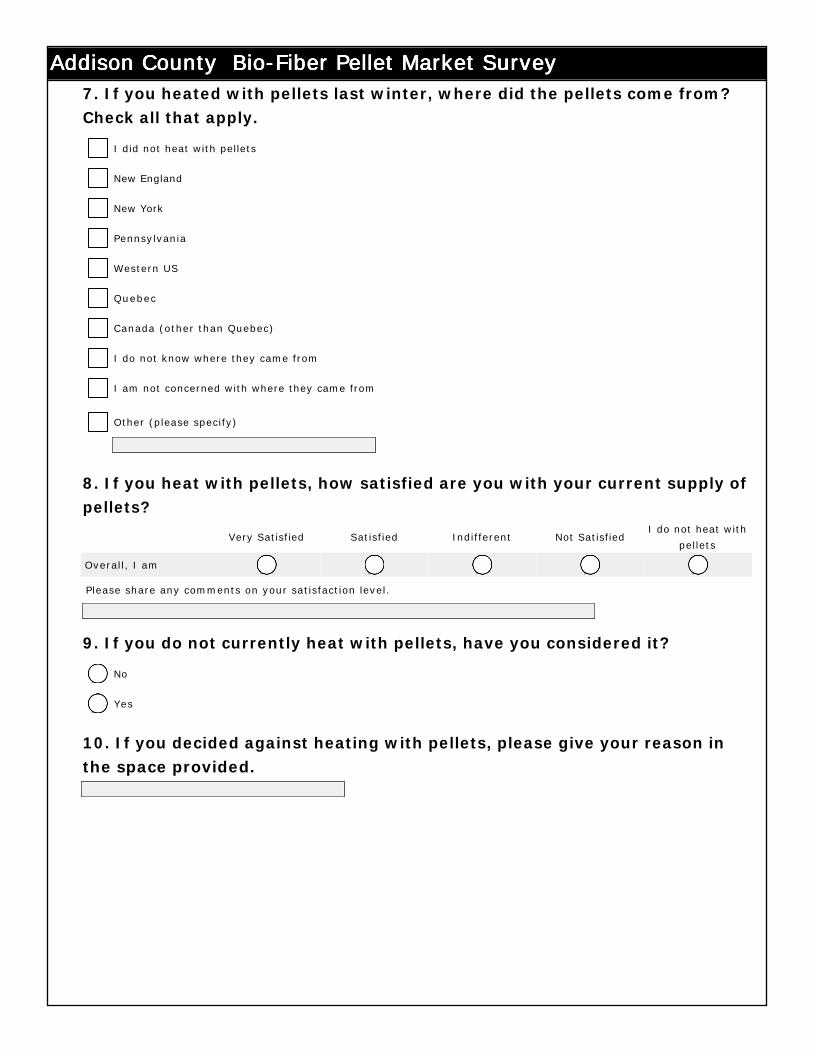
Addison County Bio-Fiber Pellet Market SurveyAddison County Bio-Fiber Pellet Market SurveyAddison County Bio-Fiber Pellet Market SurveyAddison County Bio-Fiber Pellet Market Survey7. If you heated with pellets last winter, where did the pellets come from? Check all that apply.
8. If you heat with pellets, how satisfied are you with your current supply of pellets?
9. If you do not currently heat with pellets, have you considered it?
10. If you decided against heating with pellets, please give your reason in the space provided.
Very Satisfied Satisfied Indifferent Not SatisfiedI do not heat with
pellets
Overall, I am nmlkj nmlkj nmlkj nmlkj nmlkj
I did not heat with pellets
gfedc
New England
gfedc
New York
gfedc
Pennsylvania
gfedc
Western US
gfedc
Quebec
gfedc
Canada (other than Quebec)
gfedc
I do not know where they came from
gfedc
I am not concerned with where they came from
gfedc
Other (please specify)
gfedc
Please share any comments on your satisfaction level.
No
nmlkj
Yes
nmlkj
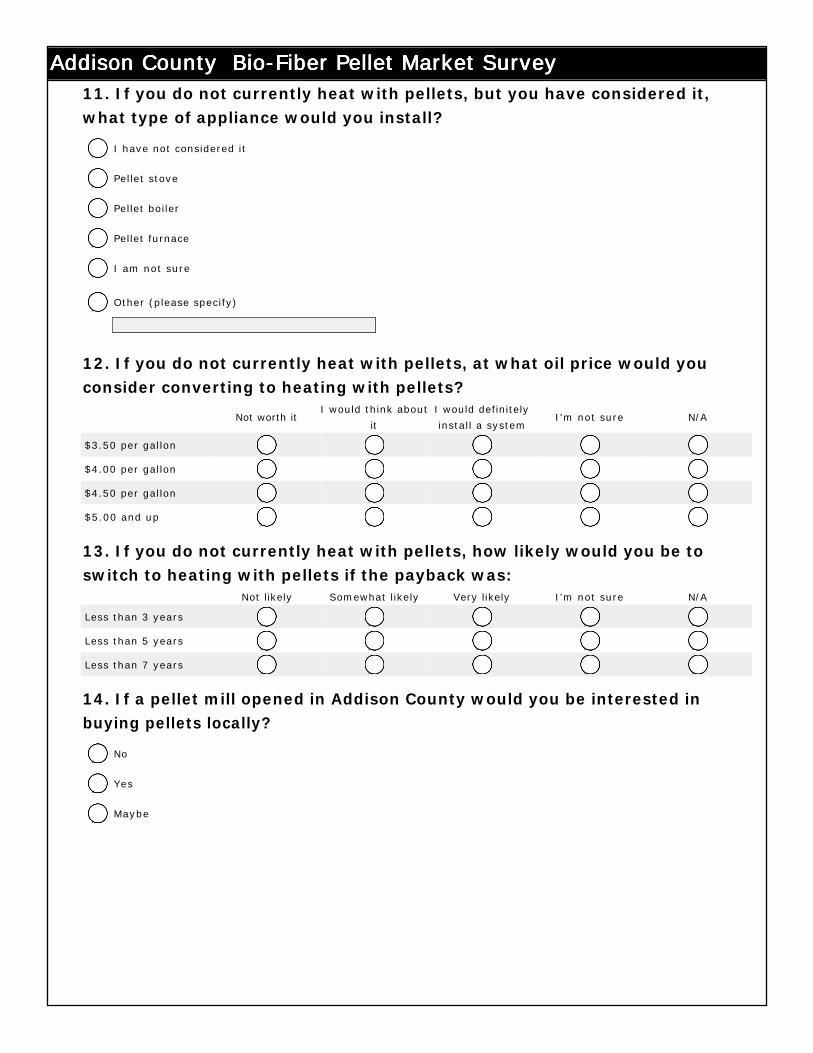
Addison County Bio-Fiber Pellet Market SurveyAddison County Bio-Fiber Pellet Market SurveyAddison County Bio-Fiber Pellet Market SurveyAddison County Bio-Fiber Pellet Market Survey11. If you do not currently heat with pellets, but you have considered it, what type of appliance would you install?
12. If you do not currently heat with pellets, at what oil price would you consider converting to heating with pellets?
13. If you do not currently heat with pellets, how likely would you be to switch to heating with pellets if the payback was:
14. If a pellet mill opened in Addison County would you be interested in buying pellets locally?
Not worth itI would think about
it
I would definitely
install a systemI'm not sure N/A
$3.50 per gallon nmlkj nmlkj nmlkj nmlkj nmlkj
$4.00 per gallon nmlkj nmlkj nmlkj nmlkj nmlkj
$4.50 per gallon nmlkj nmlkj nmlkj nmlkj nmlkj
$5.00 and up nmlkj nmlkj nmlkj nmlkj nmlkj
Not likely Somewhat likely Very likely I'm not sure N/A
Less than 3 years nmlkj nmlkj nmlkj nmlkj nmlkj
Less than 5 years nmlkj nmlkj nmlkj nmlkj nmlkj
Less than 7 years nmlkj nmlkj nmlkj nmlkj nmlkj
I have not considered it
nmlkj
Pellet stove
nmlkj
Pellet boiler
nmlkj
Pellet furnace
nmlkj
I am not sure
nmlkj
Other (please specify)
nmlkj
No
nmlkj
Yes
nmlkj
Maybe
nmlkj
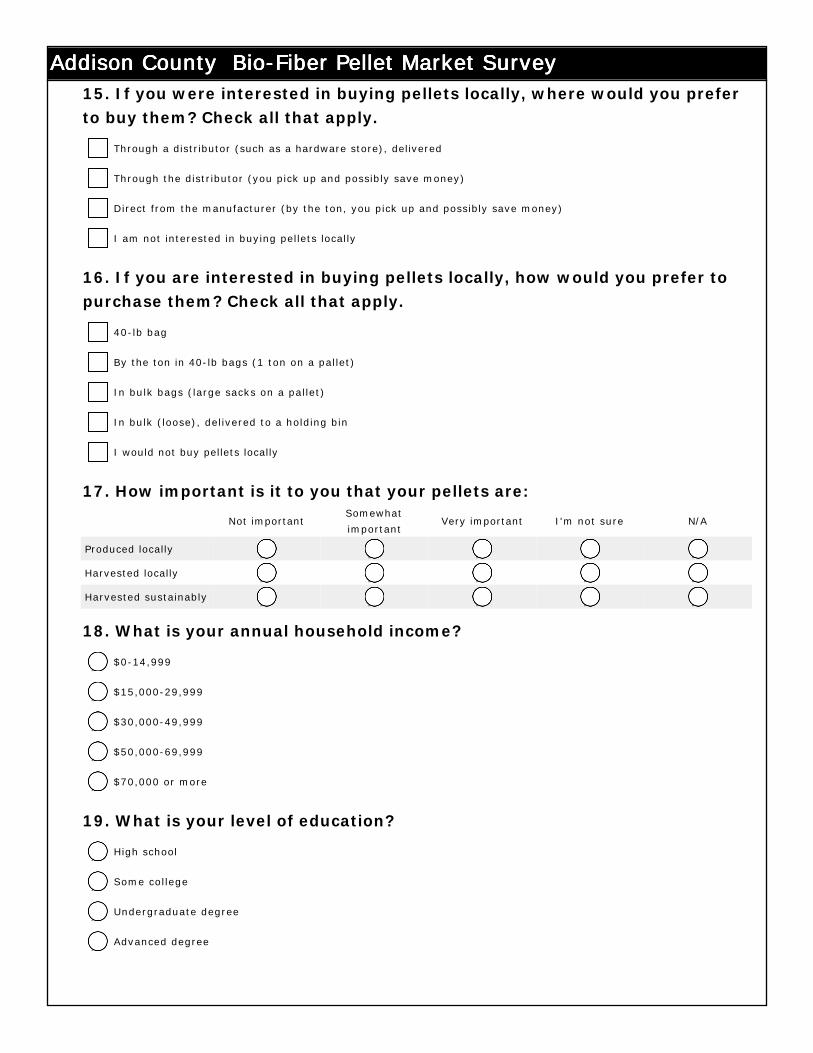
Addison County Bio-Fiber Pellet Market SurveyAddison County Bio-Fiber Pellet Market SurveyAddison County Bio-Fiber Pellet Market SurveyAddison County Bio-Fiber Pellet Market Survey15. If you were interested in buying pellets locally, where would you prefer to buy them? Check all that apply.
16. If you are interested in buying pellets locally, how would you prefer to purchase them? Check all that apply.
17. How important is it to you that your pellets are:
18. What is your annual household income?
19. What is your level of education?
Not importantSomewhat
importantVery important I'm not sure N/A
Produced locally nmlkj nmlkj nmlkj nmlkj nmlkj
Harvested locally nmlkj nmlkj nmlkj nmlkj nmlkj
Harvested sustainably nmlkj nmlkj nmlkj nmlkj nmlkj
Through a distributor (such as a hardware store), delivered
gfedc
Through the distributor (you pick up and possibly save money)
gfedc
Direct from the manufacturer (by the ton, you pick up and possibly save money)
gfedc
I am not interested in buying pellets locally
gfedc
40-lb bag
gfedc
By the ton in 40-lb bags (1 ton on a pallet)
gfedc
In bulk bags (large sacks on a pallet)
gfedc
In bulk (loose), delivered to a holding bin
gfedc
I would not buy pellets locally
gfedc
$0-14,999
nmlkj
$15,000-29,999
nmlkj
$30,000-49,999
nmlkj
$50,000-69,999
nmlkj
$70,000 or more
nmlkj
High school
nmlkj
Some college
nmlkj
Undergraduate degree
nmlkj
Advanced degree
nmlkj
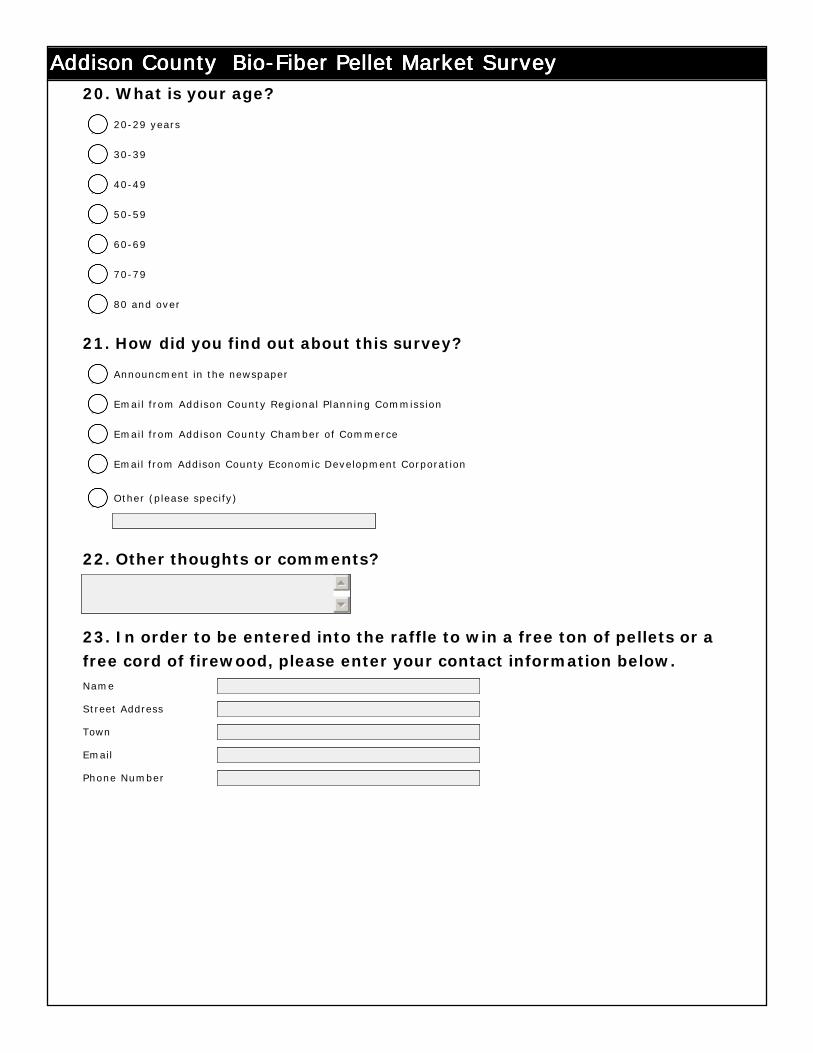
Addison County Bio-Fiber Pellet Market SurveyAddison County Bio-Fiber Pellet Market SurveyAddison County Bio-Fiber Pellet Market SurveyAddison County Bio-Fiber Pellet Market Survey20. What is your age?
21. How did you find out about this survey?
22. Other thoughts or comments?
23. In order to be entered into the raffle to win a free ton of pellets or a free cord of firewood, please enter your contact information below. Name
Street Address
Town
Phone Number
20-29 years
nmlkj
30-39
nmlkj
40-49
nmlkj
50-59
nmlkj
60-69
nmlkj
70-79
nmlkj
80 and over
nmlkj
Announcment in the newspaper
nmlkj
Email from Addison County Regional Planning Commission
nmlkj
Email from Addison County Chamber of Commerce
nmlkj
Email from Addison County Economic Development Corporation
nmlkj
Other (please specify)
nmlkj
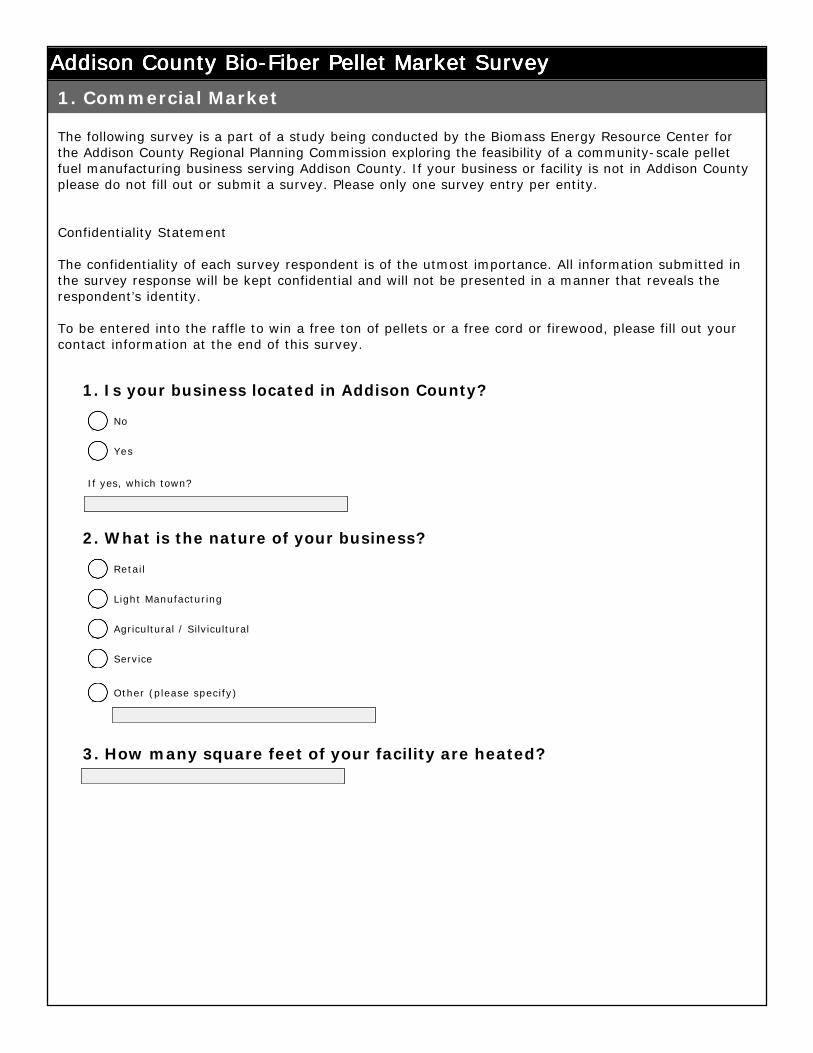
Addison County Bio-Fiber Pellet Market SurveyAddison County Bio-Fiber Pellet Market SurveyAddison County Bio-Fiber Pellet Market SurveyAddison County Bio-Fiber Pellet Market Survey
The following survey is a part of a study being conducted by the Biomass Energy Resource Center for the Addison County Regional Planning Commission exploring the feasibility of a community-scale pellet fuel manufacturing business serving Addison County. If your business or facility is not in Addison County please do not fill out or submit a survey. Please only one survey entry per entity.
Confidentiality Statement
The confidentiality of each survey respondent is of the utmost importance. All information submitted in the survey response will be kept confidential and will not be presented in a manner that reveals the respondent’s identity.
To be entered into the raffle to win a free ton of pellets or a free cord or firewood, please fill out your contact information at the end of this survey.
1. Is your business located in Addison County?
2. What is the nature of your business?
3. How many square feet of your facility are heated?
1. Commercial Market
No
nmlkj
Yes
nmlkj
If yes, which town?
Retail
nmlkj
Light Manufacturing
nmlkj
Agricultural / Silvicultural
nmlkj
Service
nmlkj
Other (please specify)
nmlkj

Addison County Bio-Fiber Pellet Market SurveyAddison County Bio-Fiber Pellet Market SurveyAddison County Bio-Fiber Pellet Market SurveyAddison County Bio-Fiber Pellet Market Survey4. Which type of fuel did you heat your facility with last winter? Check all that apply.
5. How much of each fuel did you use for heating last year?
6. What price did you pay last winter for your heating fuel(s)?
7. If you heated with pellets last winter, where did you buy the pellets?
Oil (in gallons)
Propane (in gallons)
Firewood (in cords)
Pellets (in tons)
Electric (kWh)
Other (give units)
Oil (per gallon)
Propane (gallon)
Firewood (cord)
Pellets (ton)
Electric (kWh)
Other (give unit)
Oil
gfedc
Propane
gfedc
Firewood
gfedc
Pellets
gfedc
Electric
gfedc
Solar
gfedc
Other (please specify)
gfedc
I did not heat with pellets
nmlkj
Local hardware store
nmlkj
Pellet stove dealer
nmlkj
Local co-operative
nmlkj
Other (please specify)
nmlkj
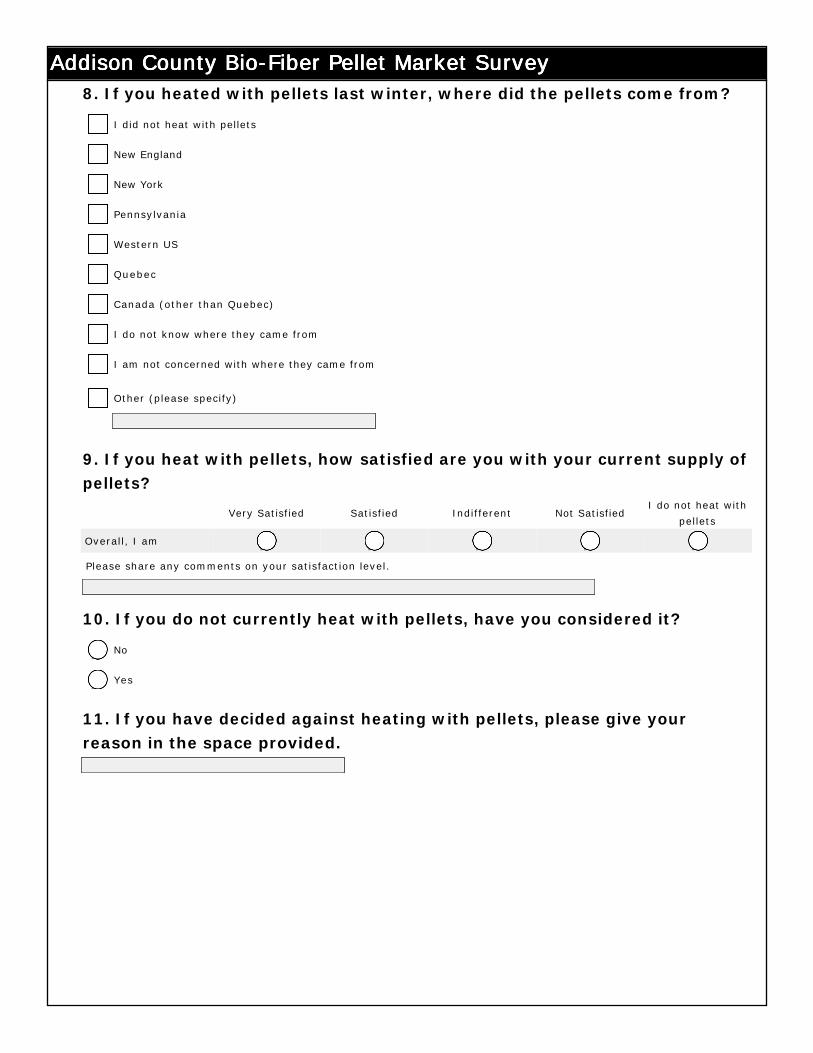
Addison County Bio-Fiber Pellet Market SurveyAddison County Bio-Fiber Pellet Market SurveyAddison County Bio-Fiber Pellet Market SurveyAddison County Bio-Fiber Pellet Market Survey8. If you heated with pellets last winter, where did the pellets come from?
9. If you heat with pellets, how satisfied are you with your current supply of pellets?
10. If you do not currently heat with pellets, have you considered it?
11. If you have decided against heating with pellets, please give your reason in the space provided.
Very Satisfied Satisfied Indifferent Not SatisfiedI do not heat with
pellets
Overall, I am nmlkj nmlkj nmlkj nmlkj nmlkj
I did not heat with pellets
gfedc
New England
gfedc
New York
gfedc
Pennsylvania
gfedc
Western US
gfedc
Quebec
gfedc
Canada (other than Quebec)
gfedc
I do not know where they came from
gfedc
I am not concerned with where they came from
gfedc
Other (please specify)
gfedc
Please share any comments on your satisfaction level.
No
nmlkj
Yes
nmlkj
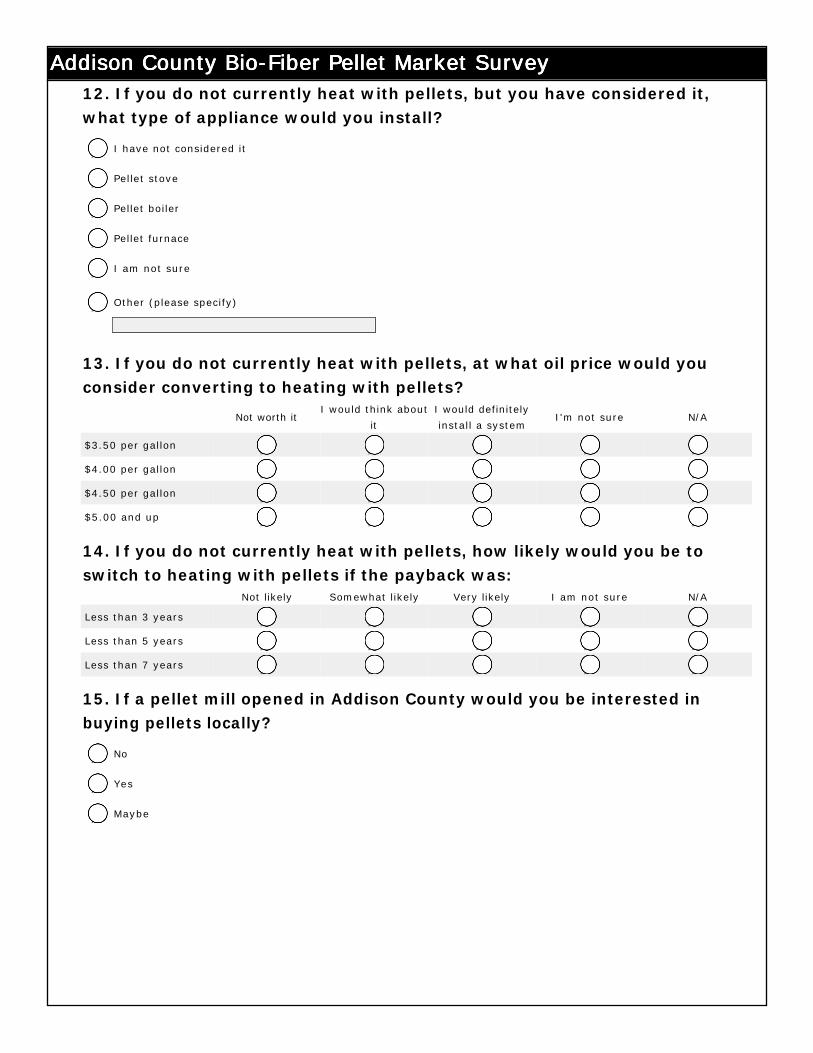
Addison County Bio-Fiber Pellet Market SurveyAddison County Bio-Fiber Pellet Market SurveyAddison County Bio-Fiber Pellet Market SurveyAddison County Bio-Fiber Pellet Market Survey12. If you do not currently heat with pellets, but you have considered it, what type of appliance would you install?
13. If you do not currently heat with pellets, at what oil price would you consider converting to heating with pellets?
14. If you do not currently heat with pellets, how likely would you be to switch to heating with pellets if the payback was:
15. If a pellet mill opened in Addison County would you be interested in buying pellets locally?
Not worth itI would think about
it
I would definitely
install a systemI'm not sure N/A
$3.50 per gallon nmlkj nmlkj nmlkj nmlkj nmlkj
$4.00 per gallon nmlkj nmlkj nmlkj nmlkj nmlkj
$4.50 per gallon nmlkj nmlkj nmlkj nmlkj nmlkj
$5.00 and up nmlkj nmlkj nmlkj nmlkj nmlkj
Not likely Somewhat likely Very likely I am not sure N/A
Less than 3 years nmlkj nmlkj nmlkj nmlkj nmlkj
Less than 5 years nmlkj nmlkj nmlkj nmlkj nmlkj
Less than 7 years nmlkj nmlkj nmlkj nmlkj nmlkj
I have not considered it
nmlkj
Pellet stove
nmlkj
Pellet boiler
nmlkj
Pellet furnace
nmlkj
I am not sure
nmlkj
Other (please specify)
nmlkj
No
nmlkj
Yes
nmlkj
Maybe
nmlkj
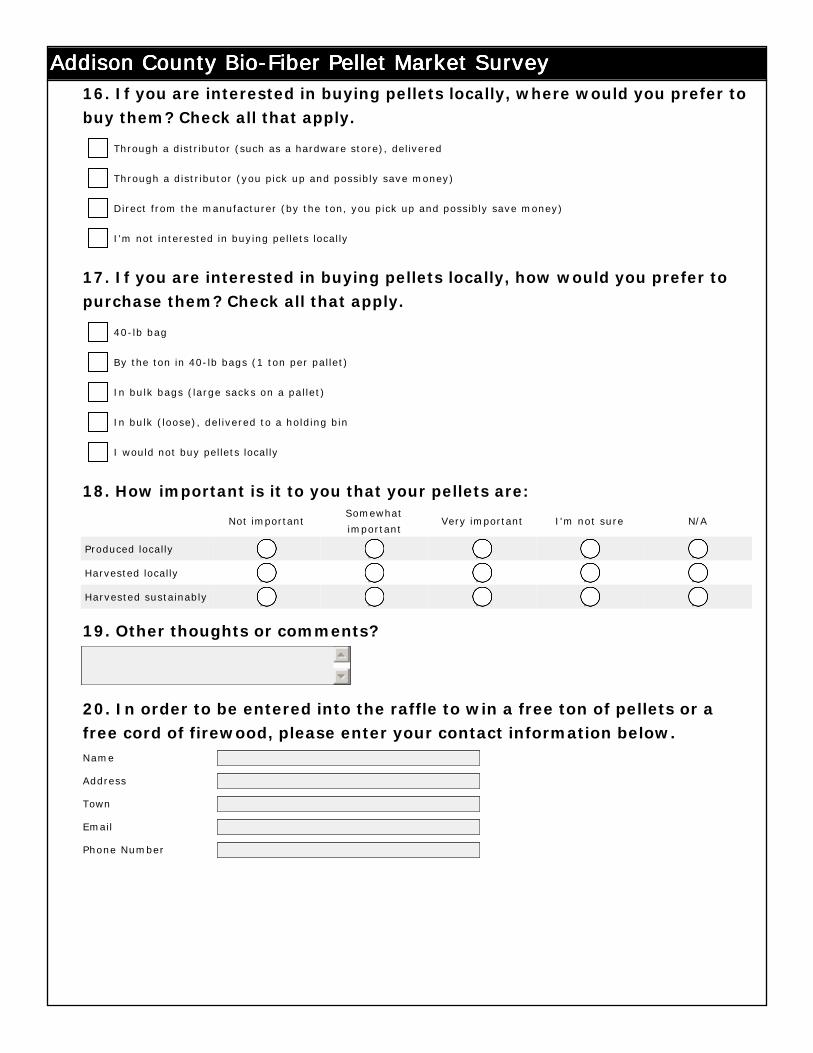
Addison County Bio-Fiber Pellet Market SurveyAddison County Bio-Fiber Pellet Market SurveyAddison County Bio-Fiber Pellet Market SurveyAddison County Bio-Fiber Pellet Market Survey16. If you are interested in buying pellets locally, where would you prefer to buy them? Check all that apply.
17. If you are interested in buying pellets locally, how would you prefer to purchase them? Check all that apply.
18. How important is it to you that your pellets are:
19. Other thoughts or comments?
20. In order to be entered into the raffle to win a free ton of pellets or a free cord of firewood, please enter your contact information below.
Not importantSomewhat
importantVery important I'm not sure N/A
Produced locally nmlkj nmlkj nmlkj nmlkj nmlkj
Harvested locally nmlkj nmlkj nmlkj nmlkj nmlkj
Harvested sustainably nmlkj nmlkj nmlkj nmlkj nmlkj
Name
Address
Town
Phone Number
Through a distributor (such as a hardware store), delivered
gfedc
Through a distributor (you pick up and possibly save money)
gfedc
Direct from the manufacturer (by the ton, you pick up and possibly save money)
gfedc
I'm not interested in buying pellets locally
gfedc
40-lb bag
gfedc
By the ton in 40-lb bags (1 ton per pallet)
gfedc
In bulk bags (large sacks on a pallet)
gfedc
In bulk (loose), delivered to a holding bin
gfedc
I would not buy pellets locally
gfedc
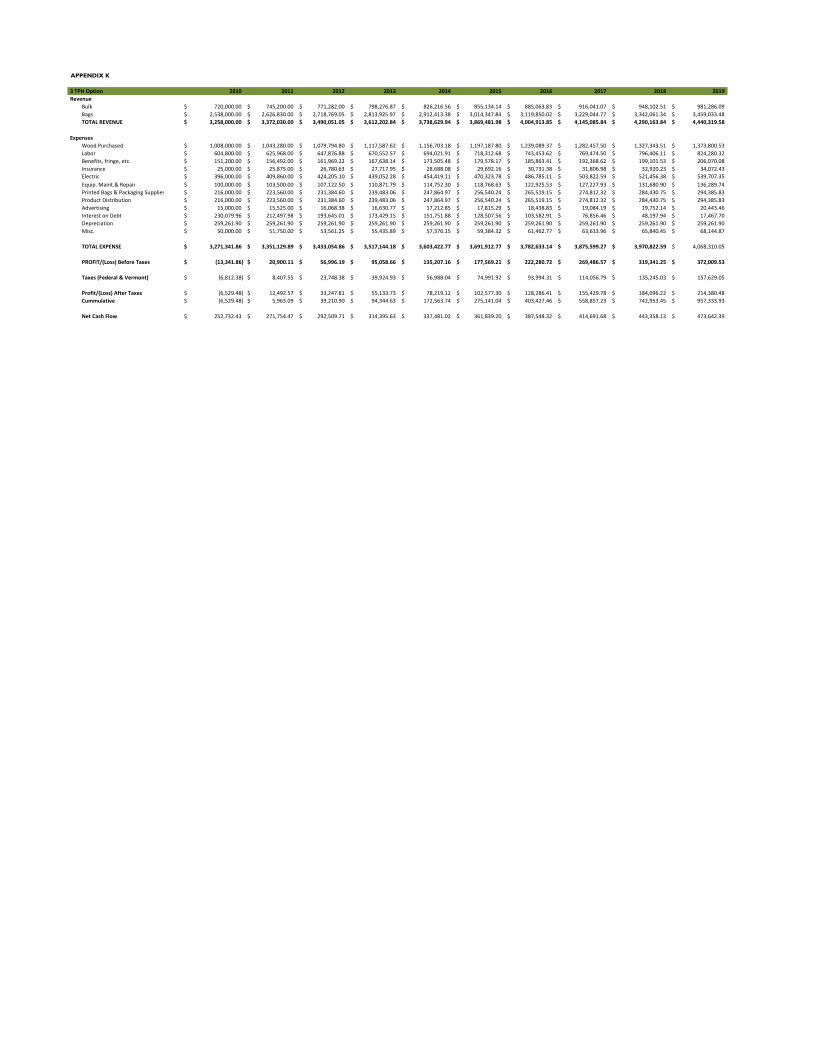
APPENDIX K
3 TPH Option 2010 2011 2012 2013 2014 2015 2016 2017 2018 2019Revenue
Bulk 720,000.00$ 745,200.00$ 771,282.00$ 798,276.87$ 826,216.56$ 855,134.14$ 885,063.83$ 916,041.07$ 948,102.51$ 981,286.09$ Bags 2,538,000.00$ 2,626,830.00$ 2,718,769.05$ 2,813,925.97$ 2,912,413.38$ 3,014,347.84$ 3,119,850.02$ 3,229,044.77$ 3,342,061.34$ 3,459,033.48$ TOTAL REVENUE 3,258,000.00$ 3,372,030.00$ 3,490,051.05$ 3,612,202.84$ 3,738,629.94$ 3,869,481.98$ 4,004,913.85$ 4,145,085.84$ 4,290,163.84$ 4,440,319.58$
ExpensesWood Purchased 1,008,000.00$ 1,043,280.00$ 1,079,794.80$ 1,117,587.62$ 1,156,703.18$ 1,197,187.80$ 1,239,089.37$ 1,282,457.50$ 1,327,343.51$ 1,373,800.53$ Labor 604,800.00$ 625,968.00$ 647,876.88$ 670,552.57$ 694,021.91$ 718,312.68$ 743,453.62$ 769,474.50$ 796,406.11$ 824,280.32$ Benefits, fringe, etc. 151,200.00$ 156,492.00$ 161,969.22$ 167,638.14$ 173,505.48$ 179,578.17$ 185,863.41$ 192,368.62$ 199,101.53$ 206,070.08$ Insurance 25,000.00$ 25,875.00$ 26,780.63$ 27,717.95$ 28,688.08$ 29,692.16$ 30,731.38$ 31,806.98$ 32,920.23$ 34,072.43$ Electric 396,000.00$ 409,860.00$ 424,205.10$ 439,052.28$ 454,419.11$ 470,323.78$ 486,785.11$ 503,822.59$ 521,456.38$ 539,707.35$ Equip. Maint.& Repair 100,000.00$ 103,500.00$ 107,122.50$ 110,871.79$ 114,752.30$ 118,768.63$ 122,925.53$ 127,227.93$ 131,680.90$ 136,289.74$ Printed Bags & Packaging Supplies 216,000.00$ 223,560.00$ 231,384.60$ 239,483.06$ 247,864.97$ 256,540.24$ 265,519.15$ 274,812.32$ 284,430.75$ 294,385.83$ Product Distribution 216,000.00$ 223,560.00$ 231,384.60$ 239,483.06$ 247,864.97$ 256,540.24$ 265,519.15$ 274,812.32$ 284,430.75$ 294,385.83$ Advertising 15,000.00$ 15,525.00$ 16,068.38$ 16,630.77$ 17,212.85$ 17,815.29$ 18,438.83$ 19,084.19$ 19,752.14$ 20,443.46$ Interest on Debt 230,079.96$ 212,497.98$ 193,645.01$ 173,429.15$ 151,751.88$ 128,507.56$ 103,582.91$ 76,856.46$ 48,197.94$ 17,467.70$ Depreciation 259,261.90$ 259,261.90$ 259,261.90$ 259,261.90$ 259,261.90$ 259,261.90$ 259,261.90$ 259,261.90$ 259,261.90$ 259,261.90$ Misc. 50,000.00$ 51,750.00$ 53,561.25$ 55,435.89$ 57,376.15$ 59,384.32$ 61,462.77$ 63,613.96$ 65,840.45$ 68,144.87$
TOTAL EXPENSE 3,271,341.86$ 3,351,129.89$ 3,433,054.86$ 3,517,144.18$ 3,603,422.77$ 3,691,912.77$ 3,782,633.14$ 3,875,599.27$ 3,970,822.59$ 4,068,310.05$
PROFIT/(Loss) Before Taxes (13,341.86)$ 20,900.11$ 56,996.19$ 95,058.66$ 135,207.16$ 177,569.21$ 222,280.72$ 269,486.57$ 319,341.25$ 372,009.53$
Taxes (Federal & Vermont) (6,812.38)$ 8,407.55$ 23,748.38$ 39,924.93$ 56,988.04$ 74,991.92$ 93,994.31$ 114,056.79$ 135,245.03$ 157,629.05$
Profit/(Loss) After Taxes (6,529.48)$ 12,492.57$ 33,247.81$ 55,133.73$ 78,219.12$ 102,577.30$ 128,286.41$ 155,429.78$ 184,096.22$ 214,380.48$ Cummulative (6,529.48)$ 5,963.09$ 39,210.90$ 94,344.63$ 172,563.74$ 275,141.04$ 403,427.46$ 558,857.23$ 742,953.45$ 957,333.93$
Net Cash Flow 252,732.43$ 271,754.47$ 292,509.71$ 314,395.63$ 337,481.02$ 361,839.20$ 387,548.32$ 414,691.68$ 443,358.13$ 473,642.39$
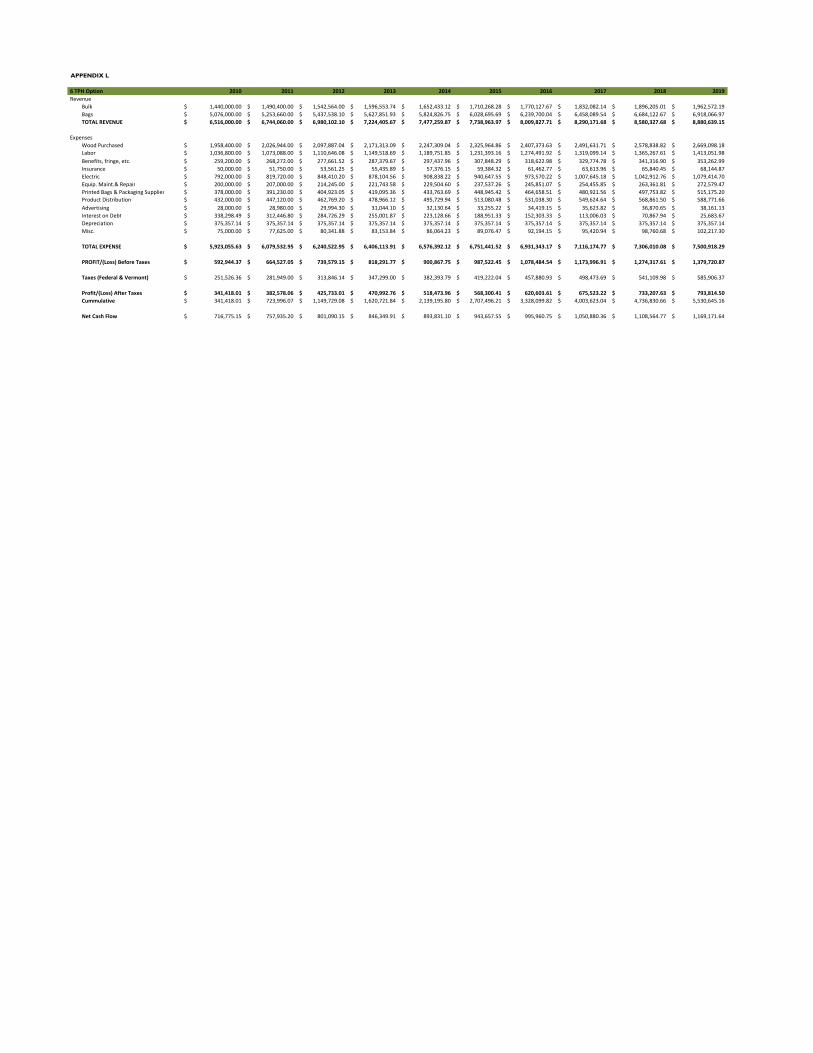
APPENDIX L
6 TPH Option 2010 2011 2012 2013 2014 2015 2016 2017 2018 2019Revenue
Bulk 1,440,000.00$ 1,490,400.00$ 1,542,564.00$ 1,596,553.74$ 1,652,433.12$ 1,710,268.28$ 1,770,127.67$ 1,832,082.14$ 1,896,205.01$ 1,962,572.19$ Bags 5,076,000.00$ 5,253,660.00$ 5,437,538.10$ 5,627,851.93$ 5,824,826.75$ 6,028,695.69$ 6,239,700.04$ 6,458,089.54$ 6,684,122.67$ 6,918,066.97$ TOTAL REVENUE 6,516,000.00$ 6,744,060.00$ 6,980,102.10$ 7,224,405.67$ 7,477,259.87$ 7,738,963.97$ 8,009,827.71$ 8,290,171.68$ 8,580,327.68$ 8,880,639.15$
ExpensesWood Purchased 1,958,400.00$ 2,026,944.00$ 2,097,887.04$ 2,171,313.09$ 2,247,309.04$ 2,325,964.86$ 2,407,373.63$ 2,491,631.71$ 2,578,838.82$ 2,669,098.18$ Labor 1,036,800.00$ 1,073,088.00$ 1,110,646.08$ 1,149,518.69$ 1,189,751.85$ 1,231,393.16$ 1,274,491.92$ 1,319,099.14$ 1,365,267.61$ 1,413,051.98$ Benefits, fringe, etc. 259,200.00$ 268,272.00$ 277,661.52$ 287,379.67$ 297,437.96$ 307,848.29$ 318,622.98$ 329,774.78$ 341,316.90$ 353,262.99$ Insurance 50,000.00$ 51,750.00$ 53,561.25$ 55,435.89$ 57,376.15$ 59,384.32$ 61,462.77$ 63,613.96$ 65,840.45$ 68,144.87$ Electric 792,000.00$ 819,720.00$ 848,410.20$ 878,104.56$ 908,838.22$ 940,647.55$ 973,570.22$ 1,007,645.18$ 1,042,912.76$ 1,079,414.70$ Equip. Maint.& Repair 200,000.00$ 207,000.00$ 214,245.00$ 221,743.58$ 229,504.60$ 237,537.26$ 245,851.07$ 254,455.85$ 263,361.81$ 272,579.47$ Printed Bags & Packaging Supplies 378,000.00$ 391,230.00$ 404,923.05$ 419,095.36$ 433,763.69$ 448,945.42$ 464,658.51$ 480,921.56$ 497,753.82$ 515,175.20$ Product Distribution 432,000.00$ 447,120.00$ 462,769.20$ 478,966.12$ 495,729.94$ 513,080.48$ 531,038.30$ 549,624.64$ 568,861.50$ 588,771.66$ Advertising 28,000.00$ 28,980.00$ 29,994.30$ 31,044.10$ 32,130.64$ 33,255.22$ 34,419.15$ 35,623.82$ 36,870.65$ 38,161.13$ Interest on Debt 338,298.49$ 312,446.80$ 284,726.29$ 255,001.87$ 223,128.66$ 188,951.33$ 152,303.33$ 113,006.03$ 70,867.94$ 25,683.67$ Depreciation 375,357.14$ 375,357.14$ 375,357.14$ 375,357.14$ 375,357.14$ 375,357.14$ 375,357.14$ 375,357.14$ 375,357.14$ 375,357.14$ Misc. 75,000.00$ 77,625.00$ 80,341.88$ 83,153.84$ 86,064.23$ 89,076.47$ 92,194.15$ 95,420.94$ 98,760.68$ 102,217.30$
TOTAL EXPENSE 5,923,055.63$ 6,079,532.95$ 6,240,522.95$ 6,406,113.91$ 6,576,392.12$ 6,751,441.52$ 6,931,343.17$ 7,116,174.77$ 7,306,010.08$ 7,500,918.29$
PROFIT/(Loss) Before Taxes 592,944.37$ 664,527.05$ 739,579.15$ 818,291.77$ 900,867.75$ 987,522.45$ 1,078,484.54$ 1,173,996.91$ 1,274,317.61$ 1,379,720.87$
Taxes (Federal & Vermont) 251,526.36$ 281,949.00$ 313,846.14$ 347,299.00$ 382,393.79$ 419,222.04$ 457,880.93$ 498,473.69$ 541,109.98$ 585,906.37$
Profit/(Loss) After Taxes 341,418.01$ 382,578.06$ 425,733.01$ 470,992.76$ 518,473.96$ 568,300.41$ 620,603.61$ 675,523.22$ 733,207.63$ 793,814.50$ Cummulative 341,418.01$ 723,996.07$ 1,149,729.08$ 1,620,721.84$ 2,139,195.80$ 2,707,496.21$ 3,328,099.82$ 4,003,623.04$ 4,736,830.66$ 5,530,645.16$
Net Cash Flow 716,775.15$ 757,935.20$ 801,090.15$ 846,349.91$ 893,831.10$ 943,657.55$ 995,960.75$ 1,050,880.36$ 1,108,564.77$ 1,169,171.64$
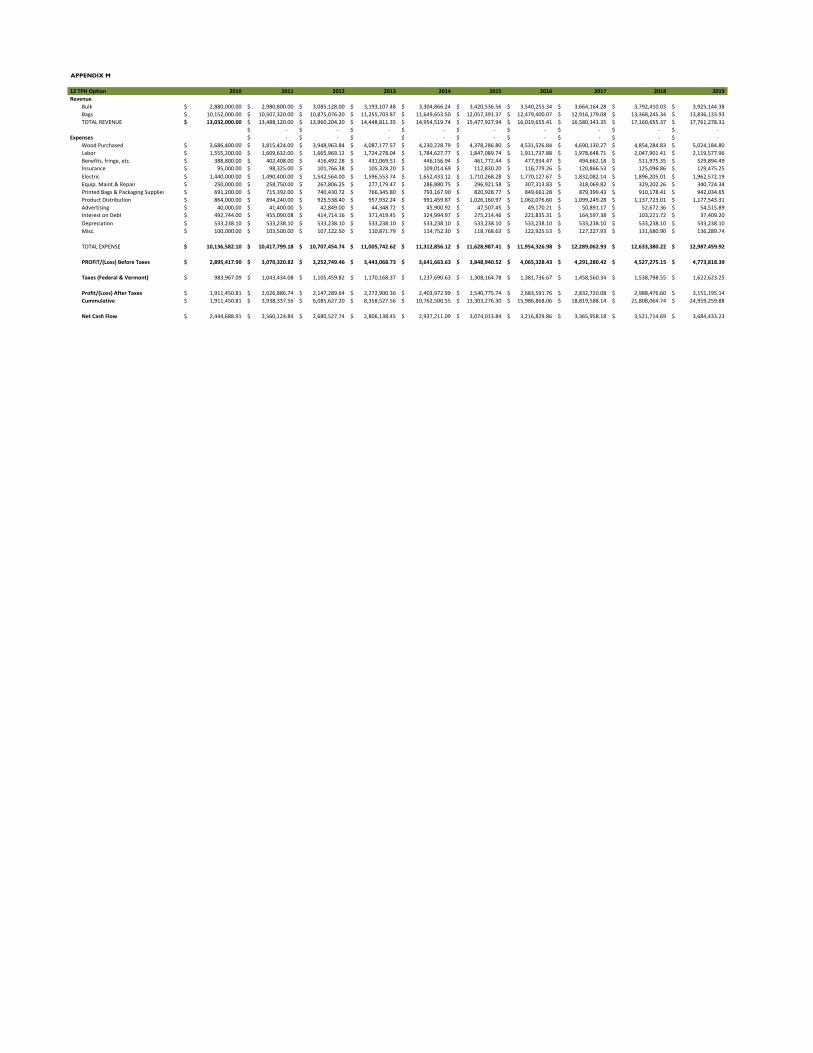
APPENDIX M
12 TPH Option 2010 2011 2012 2013 2014 2015 2016 2017 2018 2019Revenue
Bulk 2,880,000.00$ 2,980,800.00$ 3,085,128.00$ 3,193,107.48$ 3,304,866.24$ 3,420,536.56$ 3,540,255.34$ 3,664,164.28$ 3,792,410.03$ 3,925,144.38$ Bags 10,152,000.00$ 10,507,320.00$ 10,875,076.20$ 11,255,703.87$ 11,649,653.50$ 12,057,391.37$ 12,479,400.07$ 12,916,179.08$ 13,368,245.34$ 13,836,133.93$ TOTAL REVENUE 13,032,000.00$ 13,488,120.00$ 13,960,204.20$ 14,448,811.35$ 14,954,519.74$ 15,477,927.94$ 16,019,655.41$ 16,580,343.35$ 17,160,655.37$ 17,761,278.31$
‐$ ‐$ ‐$ ‐$ ‐$ ‐$ ‐$ ‐$ ‐$ Expenses ‐$ ‐$ ‐$ ‐$ ‐$ ‐$ ‐$ ‐$ ‐$
Wood Purchased 3,686,400.00$ 3,815,424.00$ 3,948,963.84$ 4,087,177.57$ 4,230,228.79$ 4,378,286.80$ 4,531,526.84$ 4,690,130.27$ 4,854,284.83$ 5,024,184.80$ Labor 1,555,200.00$ 1,609,632.00$ 1,665,969.12$ 1,724,278.04$ 1,784,627.77$ 1,847,089.74$ 1,911,737.88$ 1,978,648.71$ 2,047,901.41$ 2,119,577.96$ Benefits, fringe, etc. 388,800.00$ 402,408.00$ 416,492.28$ 431,069.51$ 446,156.94$ 461,772.44$ 477,934.47$ 494,662.18$ 511,975.35$ 529,894.49$ Insurance 95,000.00$ 98,325.00$ 101,766.38$ 105,328.20$ 109,014.69$ 112,830.20$ 116,779.26$ 120,866.53$ 125,096.86$ 129,475.25$ Electric 1,440,000.00$ 1,490,400.00$ 1,542,564.00$ 1,596,553.74$ 1,652,433.12$ 1,710,268.28$ 1,770,127.67$ 1,832,082.14$ 1,896,205.01$ 1,962,572.19$ Equip. Maint.& Repair 250,000.00$ 258,750.00$ 267,806.25$ 277,179.47$ 286,880.75$ 296,921.58$ 307,313.83$ 318,069.82$ 329,202.26$ 340,724.34$ Printed Bags & Packaging Supplies 691,200.00$ 715,392.00$ 740,430.72$ 766,345.80$ 793,167.90$ 820,928.77$ 849,661.28$ 879,399.43$ 910,178.41$ 942,034.65$ Product Distribution 864,000.00$ 894,240.00$ 925,538.40$ 957,932.24$ 991,459.87$ 1,026,160.97$ 1,062,076.60$ 1,099,249.28$ 1,137,723.01$ 1,177,543.31$ Advertising 40,000.00$ 41,400.00$ 42,849.00$ 44,348.72$ 45,900.92$ 47,507.45$ 49,170.21$ 50,891.17$ 52,672.36$ 54,515.89$ Interest on Debt 492,744.00$ 455,090.08$ 414,714.16$ 371,419.45$ 324,994.97$ 275,214.46$ 221,835.31$ 164,597.38$ 103,221.72$ 37,409.20$ Depreciation 533,238.10$ 533,238.10$ 533,238.10$ 533,238.10$ 533,238.10$ 533,238.10$ 533,238.10$ 533,238.10$ 533,238.10$ 533,238.10$ Misc. 100,000.00$ 103,500.00$ 107,122.50$ 110,871.79$ 114,752.30$ 118,768.63$ 122,925.53$ 127,227.93$ 131,680.90$ 136,289.74$
TOTAL EXPENSE 10,136,582.10$ 10,417,799.18$ 10,707,454.74$ 11,005,742.62$ 11,312,856.12$ 11,628,987.41$ 11,954,326.98$ 12,289,062.93$ 12,633,380.22$ 12,987,459.92$
PROFIT/(Loss) Before Taxes 2,895,417.90$ 3,070,320.82$ 3,252,749.46$ 3,443,068.73$ 3,641,663.63$ 3,848,940.52$ 4,065,328.43$ 4,291,280.42$ 4,527,275.15$ 4,773,818.39$
Taxes (Federal & Vermont) 983,967.09$ 1,043,434.08$ 1,105,459.82$ 1,170,168.37$ 1,237,690.63$ 1,308,164.78$ 1,381,736.67$ 1,458,560.34$ 1,538,798.55$ 1,622,623.25$
Profit/(Loss) After Taxes 1,911,450.81$ 2,026,886.74$ 2,147,289.64$ 2,272,900.36$ 2,403,972.99$ 2,540,775.74$ 2,683,591.76$ 2,832,720.08$ 2,988,476.60$ 3,151,195.14$ Cummulative 1,911,450.81$ 3,938,337.56$ 6,085,627.20$ 8,358,527.56$ 10,762,500.55$ 13,303,276.30$ 15,986,868.06$ 18,819,588.14$ 21,808,064.74$ 24,959,259.88$
Net Cash Flow 2,444,688.91$ 2,560,124.84$ 2,680,527.74$ 2,806,138.45$ 2,937,211.09$ 3,074,013.84$ 3,216,829.86$ 3,365,958.18$ 3,521,714.69$ 3,684,433.23$
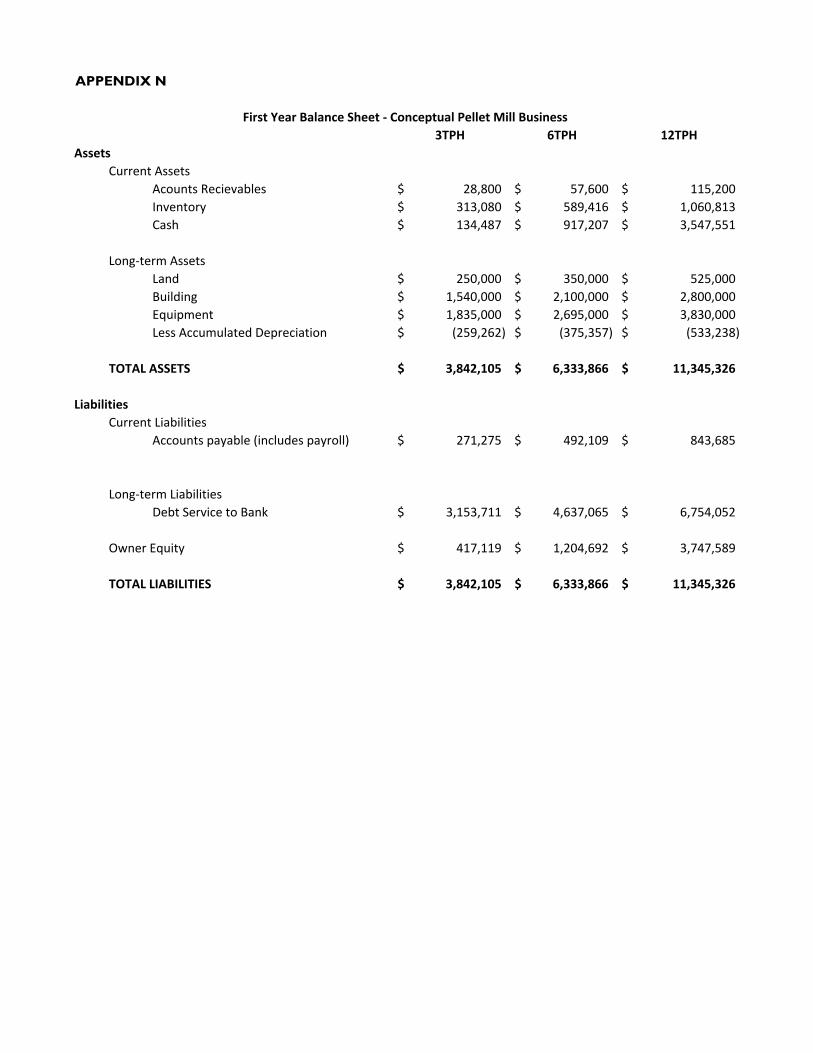
APPENDIX N
3TPH 6TPH 12TPHAssets
Current AssetsAcounts Recievables 28,800$ 57,600$ 115,200$ Inventory 313,080$ 589,416$ 1,060,813$ Cash 134,487$ 917,207$ 3,547,551$
Long‐term AssetsLand 250,000$ 350,000$ 525,000$ Building 1,540,000$ 2,100,000$ 2,800,000$ Equipment 1,835,000$ 2,695,000$ 3,830,000$ Less Accumulated Depreciation (259,262)$ (375,357)$ (533,238)$
TOTAL ASSETS 3,842,105$ 6,333,866$ 11,345,326$
LiabilitiesCurrent Liabilities
Accounts payable (includes payroll) 271,275$ 492,109$ 843,685$
Long‐term LiabilitiesDebt Service to Bank 3,153,711$ 4,637,065$ 6,754,052$
Owner Equity 417,119$ 1,204,692$ 3,747,589$
TOTAL LIABILITIES 3,842,105$ 6,333,866$ 11,345,326$
First Year Balance Sheet ‐ Conceptual Pellet Mill Business
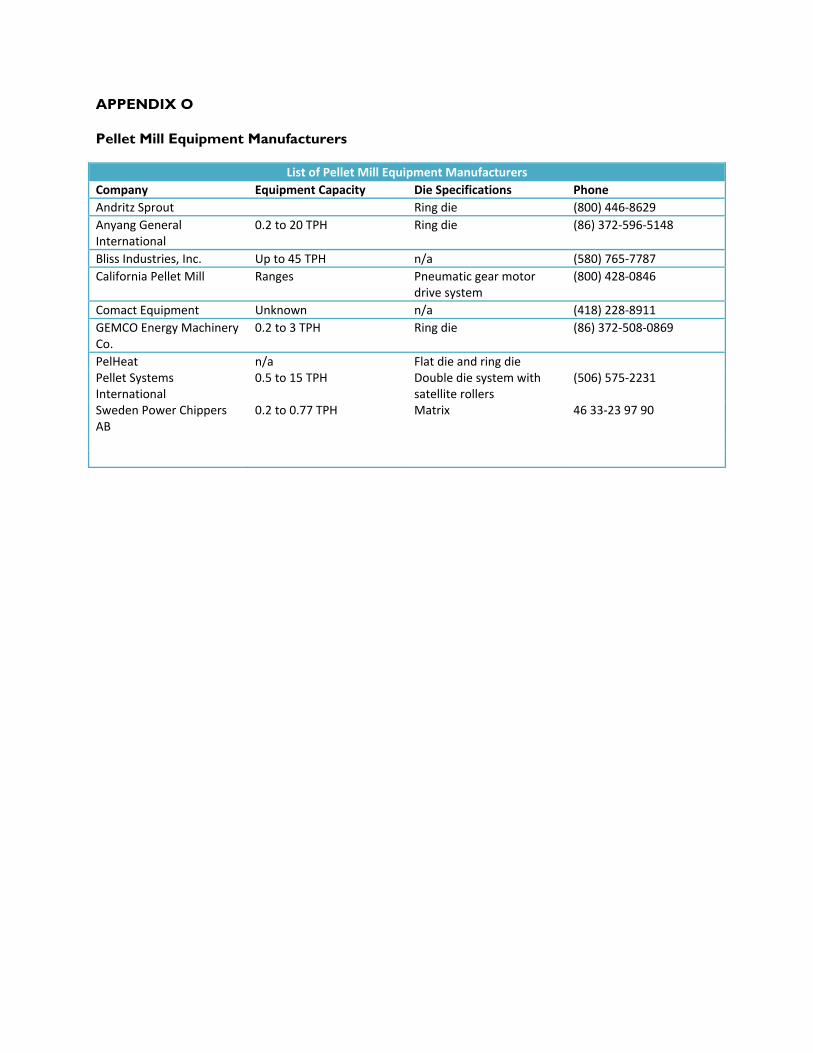
APPENDIX O Pellet Mill Equipment Manufacturers
List of Pellet Mill Equipment ManufacturersCompany Equipment Capacity Die Specifications Phone Andritz Sprout Ring die (800) 446‐8629Anyang General International
0.2 to 20 TPH Ring die (86) 372‐596‐5148
Bliss Industries, Inc. Up to 45 TPH n/a (580) 765‐7787California Pellet Mill Ranges Pneumatic gear motor
drive system (800) 428‐0846
Comact Equipment Unknown n/a (418) 228‐8911GEMCO Energy Machinery Co.
0.2 to 3 TPH Ring die (86) 372‐508‐0869
PelHeat n/a Flat die and ring die Pellet Systems International
0.5 to 15 TPH Double die system with satellite rollers
(506) 575‐2231
Sweden Power Chippers AB
0.2 to 0.77 TPH Matrix 46 33‐23 97 90
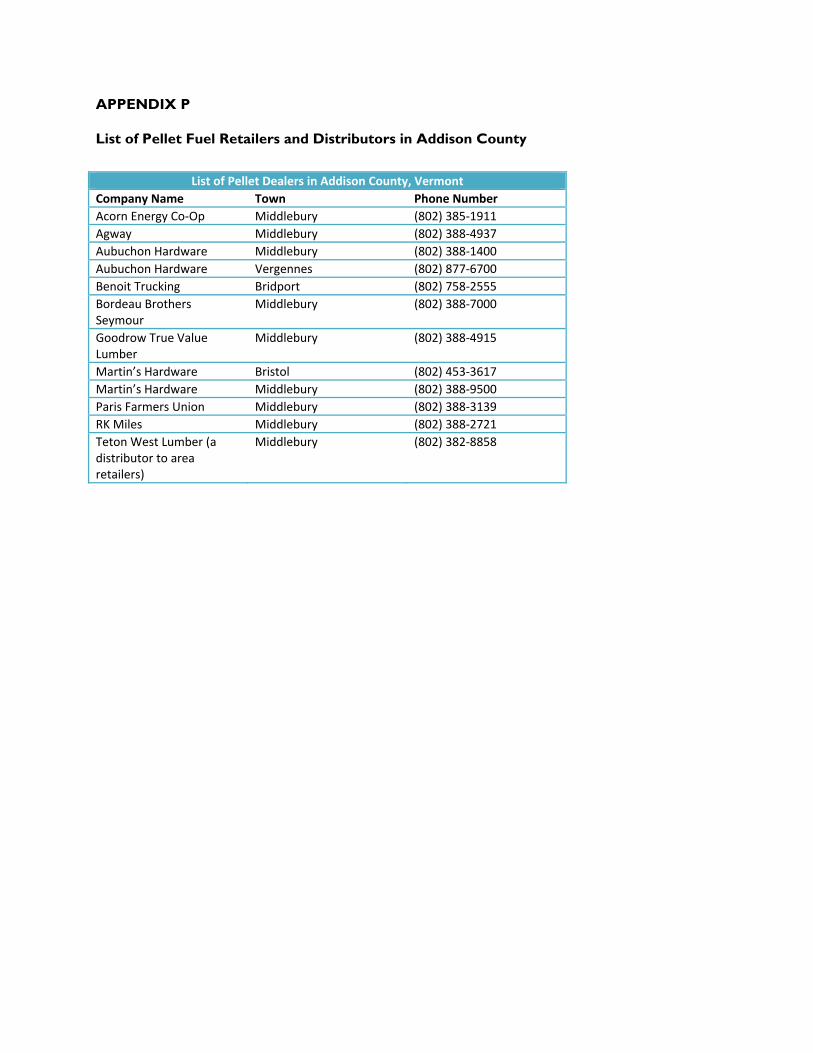
APPENDIX P List of Pellet Fuel Retailers and Distributors in Addison County
List of Pellet Dealers in Addison County, VermontCompany Name Town Phone NumberAcorn Energy Co‐Op Middlebury (802) 385‐1911Agway Middlebury (802) 388‐4937Aubuchon Hardware Middlebury (802) 388‐1400 Aubuchon Hardware Vergennes (802) 877‐6700 Benoit Trucking Bridport (802) 758‐2555Bordeau Brothers Seymour
Middlebury (802) 388‐7000
Goodrow True Value Lumber
Middlebury (802) 388‐4915
Martin’s Hardware Bristol (802) 453‐3617Martin’s Hardware Middlebury (802) 388‐9500Paris Farmers Union Middlebury (802) 388‐3139 RK Miles Middlebury (802) 388‐2721Teton West Lumber (a distributor to area retailers)
Middlebury (802) 382‐8858

BERC Final Report on Addison County Pellet Feasibility Study Page
PO Box 1611, Montpelier, VT 05601-1611
ph 802-223-7770 x121 • fax 802-223-7772
[email protected] • www.biomasscenter.org