Embed Size (px)
Citation preview
lable at ScienceDirect
Atmospheric Environment 89 (2014) 329e336
Contents lists avai
Atmospheric Environment
journal homepage: www.elsevier .com/locate/atmosenv
A visibility and total suspended dust relationship
M.C. Baddock a,*, C.L. Strong a, J.F. Leys b, S.K. Heidenreich b, E.K. Tews c, G.H. McTainsh a
aAtmospheric Environment Research Centre, Griffith School of Environment, Griffith University, Brisbane, Queensland 4111, AustraliabOffice of Environment and Heritage, Science Division, Gunnedah, New South Wales 2380, AustraliacAustralian Rivers Institute, Griffith School of Environment, Griffith University, Brisbane, Queensland 4111, Australia
h i g h l i g h t s
� An expression relating total suspended dust concentration to meteorology visibility.� Based on concentration-visibility observations made 10e100 km from eroding sources.� The new expression is most applicable to data from stations regional to wind erosion.
a r t i c l e i n f o
Article history:Received 27 September 2013Received in revised form13 February 2014Accepted 18 February 2014
Keywords:DuststormSandstormAir qualityPM10
AerosolsTSP
* Corresponding author.E-mail addresses: [email protected], m.
C. Baddock).
http://dx.doi.org/10.1016/j.atmosenv.2014.02.0381352-2310/� 2014 Published by Elsevier Ltd.
a b s t r a c t
This study reports findings on observed visibility reductions and associated concentrations of mineraldust from a detailed Australian case study. An understanding of the relationship between visibility anddust concentration is of considerable utility for wind erosion and aeolian dust research because it allowsvisibility data, which are available from thousands of weather observation stations worldwide, to beconverted into dust concentrations. Until now, this application of visibility data for wind erosion/duststudies has been constrained by the scarcity of direct measurements of co-incident dust concentrationand visibility measurements. While dust concentrations are available from high volume air samplers,these time-averaged data cannot be directly correlated with instantaneous visibility records frommeteorological observations. This study presents a newmethod for deriving instantaneous values of totalsuspended dust from time averaged (filter-based) samples, through reference to high resolution PM10
data. The development and testing of the model is presented here as well as a discussion of the derivedexpression in relation to other visibility-dust concentration predictive curves. The current study is sig-nificant because the visibility-dust concentration relationship produced is based on visibility observa-tions made 10e100 km from the dust sources. This distance from source makes the derived relationshipappropriate for a greater number of visibility recording stations than widely-used previous relationshipsbased on observations made directly at eroding sources. Testing of the new formula performance againstobserved total suspended dust concentrations demonstrates that the model predicts dust concentrationrelatively well (r2 ¼ 0.6) from visibility. When considered alongside previous studies, the new rela-tionship fits into the continuum of visibility-dust concentration outcomes existing for increasingdistance-from-source. This highlights the important influence that distance to source has on thevisibility-dust concentration relationship.
� 2014 Published by Elsevier Ltd.
1. Introduction
The visibility distance at the time of observation is a commonlyreported atmospheric variable inmeteorological data. The presenceof smoke, pollution, moisture and suspended mineral dust in theatmosphere can all result in a reduction in visibility. The impact
that dust has on visibility is a chief cause of the transport disrup-tions caused by these aeolian phenomena (Baddock et al., 2013;Tozer and Leys, 2013). For research into aeolian dust, the degreeof visibility reduction associated with dust-related weather codeshas provided fundamental information on the spatio-temporalcharacteristics of dust activity. Before the advent of satelliteremote sensing, visibility was the dominant variable used inmapping the distribution of wind erosion and dust activity (Orgilland Sehmel, 1976; Middleton et al., 1986; McTainsh and Pitblado,1987; Goudie and Middleton, 1992).
M.C. Baddock et al. / Atmospheric Environment 89 (2014) 329e336330
Visibility has been widely used in dust studies because thesebasic data are readily available from thousands of observationstations in theWorldMeteorological Organisation (WMO) network,and are often available for long time series. Values of the concen-tration of dust in the atmosphere however represent a more pro-cess relevant and precisely quantifiable measure of mineral dustloading than visibility. For instance, dust concentration is the formby which off-site air quality is measured and regulated, such as inmaximum concentration for dust particles of all sizes, TSD (TotalSuspended Dust), or size-selective e.g., PM10 (particles <10 mm)(e.g., Stetler and Saxton, 1996; Neff et al., 2013).
Estimates of dust concentration can be derived from visibilitymeasurements, and several empirical relationships that relateconcentration to visibility have previously been put forward (e.g.,Chepil and Woodruff, 1957; Patterson and Gillette, 1977; BenMohamed and Frangi, 1986; D’Almeida, 1986; Chung et al., 2003;Wang et al., 2008). Such visibility-based estimates of dust con-centration have numerous applications in; the mapping of winderosion (McTainsh et al., 2008; O’Loingsigh et al., 2014), the ‘groundtruthing’ of remote sensing (Wang and Christopher, 2003; Guoet al., 2009), air quality assessments (Ozer et al., 2006; Dagsson-Waldhauserova et al., 2013), the validation of dust activity model-ling (Shao et al., 2003, 2007), the estimation of peak loads of largedust storms (Raupach et al., 1994; Chung et al., 2003; McTainshet al., 2005; Leys et al., 2011) and for better understanding the ef-fects of suspended mineral aerosols on the radiative budget (e.g.,Sokolik et al., 2001; Satheesh and Moorthy, 2005).
The various empirical expressions that relate visibility and dustconcentration have been found to differ between studies (Pattersonand Gillette, 1977; Ben Mohamed and Frangi, 1986; Dayan et al.,2008; Shao et al., 2007; Wang et al., 2008). For such expressionsto be useful in dust-atmospheric studies, it is important that thisvariability be understood. Furthermore, so that accurate estimatesof dust concentration can be produced from visibility, it is alsoimportant that the most appropriate expression be applied for agiven visibility observation location. The need to understand therelationship between visibility and dust concentration as part ofwind erosion research has long been recognised (e.g., Ette andOlorode, 1988; Ackerman and Cox, 1989; Shao et al., 2003). Inparticular, two classic studies in the United States, those of Chepiland Woodruff (1957) and Patterson and Gillette (1977) usedempirical fits of observed data to describe the relationship
Cm ¼ A=Vg (1)
with
A ¼ CmV (2)
where Cm is total mass concentration, A is a term related to theeffects on extinction due to particle size distribution, g a constantand V is observed visibility. These studies demonstrate the suit-ability of the power relationship in describing the relationshipbetween visibility and dust concentration. Patterson and Gillette(1977) noted the variety in the values of constant terms put for-ward to relate concentration and visibility. They attributed the lackof a single applicable term to variations in dust particle size dis-tributions (PSD) between both dust events and study areas. PSDscan be highly variable between wind erosion episodes, and arecontrolled chiefly by source soil characteristics, wind erosivity andthe distance of observation point from the eroding source (El-Fandy, 1953; Chepil and Woodruff, 1957).
It is noteworthy that both the Chepil and Woodruff (1957) andPatterson and Gillette (1977) studies were based on visibility anddust concentration measurements made at, or very close to,
eroding sources. This constrains the application of their visibilityand dust concentration functions because worldwide, the mostreadily available source of visibility data is from WMO meteoro-logical stations which are impacted by dust, but are not locateddirectly at the eroding source. An expression describing the visi-bility and dust concentration relationship at a greater distance fromsource will therefore be more appropriate for these locations.Following terminology from the transport distance model of Tsoarand Pye (1987), dust within a few kilometres from its source can betermed local, while >10 km dust can be regarded as regional (seealso Cattle et al., 2009).
The aim of this study was to produce a relationship betweenvisibility and total suspended dust concentration for dust eventsobserved at a regional scale (10e100 km) from source. A newmethod is presented here for obtaining instantaneous dust con-centrations from time-averaged data, to allow their correlationwith instantaneous visibility observations.
2. Methods
2.1. Background to methods
Themost reliable source of near-surface dust concentration dataisfield sampling using active samplers, such as vacuumpump-baseddevices (e.g., Nickling andGillies,1993; Nickling et al.,1999), or fromnetworks of high volume samplers (HVS) (Leys et al., 2008). Suchequipment however is costly, labour intensive to operate and largelyimpractical for widespread spatial monitoring of dust, especially inremote areas. A more widely applicable approach for wind erosionmonitoring involves the use of DustTrak� (TSI, St. Paul, MN, USA)samplers (Leys et al., 2008). DustTrak instruments provide real timedust concentrations, but only for particulates with an aerodynamicsize of<10 mm (PM10). This size selectivity makes such instrumentssuitable for monitoring air pollution and the associated effects thatfine particles have on human health. While PM10 is being success-fully used for wind erosion mapping (e.g., Wang et al., 2008), winderosion events also entrain coarser particles than this size. As aresult, PM10 does not fully characterise all dust events, or describethe full size range of suspended particles contributing to atmo-spheric mass loadings (Tsoar and Pye, 1987; Lawrence and Neff,2009; Neff et al., 2013). It is preferable therefore for measurementsof dust concentration for a givendust event to be calculated fromtheentire range of particle sizes present.
High volume samplers (HVS) collect the total range of particlesin the air, but as the resultant dust concentration is time-integratedover the total sampling period for which the HVS was operating(generally 24 h), these time-averaged data have a poor relationshipwith time-averaged visibility. The focus of the current study is touse the high resolution time series of PM10 dust concentrationmeasured with a DustTrak (CDT) to calculate the equivalent totaldust concentration measured with a co-located HVS (CHVS) for apoint in time (CHVSi), which can then be correlated with the con-current visibility. The resultant relationship is referred to from hereon as the Visibility-Total Suspended Dust (V-TSD) model.
2.2. Site and sampling details
A HVS and a DustTrak instrument, operated by the New SouthWales Office of Environment and Heritage (OEH) and Griffith Uni-versity, provide two forms of dust concentration data at Buronga,New South Wales (34.17�S, 142.20�W). The HVS at this site con-stitutes the longest rural record of dust concentration in Australia,monitoring dust in the intensively cultivated Mallee region for over24 years (Leys et al., 2008). For dust events, the HVS collects the fullrange of suspended particles on glass fibre filter papers (Whatman
M.C. Baddock et al. / Atmospheric Environment 89 (2014) 329e336 331
GF/A with nominal pore size of 1.6 mm) using a sampling flow rateof about 0$7 m3 min�1. The record of HVS dust event concentrationdata from Buronga was examined for the years 2004e2007.
Determination of dust concentration from the HVS is in partgoverned by the duration that each filter sampled for. As filterchanging is a manual operation, the sampling time varied for eachfilter (20e75 h). This time period introduces the chance of multipledust events becoming sampled. In conjunction with the HVS filterdata, 5-min PM10 data from the DustTrak at Burongawere also usedin order to measure the timing and duration of the dust events.
The dust concentration data gathered at Buronga were corre-lated with visibility data from Mildura, Victoria as the nearestAustralian Bureau of Meteorology (BoM) station, located 12 km tothe south-west of Buronga. Visibility data from Mildura came fromtwo datasets; the regular 3-hourly synoptic observation (Vissynop)(excluding the midnight 0000 reading) and irregular A37 visibilityrecordings (VisA37), which have a 5e30-min frequency whenavailable. A37 reports augment the synoptic record and are typi-cally recorded during notable weather phenomena such as dustevents. Whilst it would have been preferable to have the concen-tration sampling sited at the same location as the BoM visibilityobservation, for practical reasons this was not possible. The siting ofinstruments and the observer in different locations creates somechallenges and these were taken into account by the method usedfor comparing visibility and dust concentration.
2.3. Deriving instantaneous dust concentration from HVS data
From the HVS filters obtained at Buronga during 2004e2007, atotal of 13 filters was used to create a high quality datasetcomprising 83 discrete dust concentrations. The selection criteriaproducing the 13 filters included: i) TSD load >100 mg/m3 and filterrun time between 18 and 30 h, ii) a continuous 5-min PM10 con-centration record existed for the HVS sampling period, iii) theavailability of high temporal resolution A37 visibility observationsfor the dust event and iv) wind direction during the event from thesouth west, to ensure that dust observed at Mildura was measuredat Buronga.
Given that the DustTrak is limited to recording the PM10 frac-tion, the ratio between PM10/TSD was determined for each dustevent in order to relate the high frequency PM10 concentration toTSD. Calculation of this ratio involves two assumptions; i) that thePM10 dust concentration time series is the same as the TSD timeseries, and the only difference between the measurements is theparticle size limitation of the PM10 measurements, ii) that the PM10to TSD ratio is constant over the HVS sample period t ¼ 0 to t ¼ T.Accepting these conditions, equation (3) defines how the PM10/TSDratio (a) relates the DustTrak and HVS concentrations
CDTt ¼ a*CHVt(3)
where CDTt is PM10 concentration from DustTrak, CHVtis TSD con-
centration from HVS, and a is the ratio between the two. This ratiowas determined for each HVS filter paper used, or in other words,for each dust event examined.
The total massm collected on the filter paper for any given timeinterval t ¼ 0 to t ¼ T is
m ¼Zt¼ T
t¼0
CHVt*dVdt
*dt: (4)
Because the volume of air flow passing through the filter can beregarded as a constant for each sampling event ( _V ¼ dV=dtÞ, re-arranging Equations (3) and (4) produces
m ¼_V*
Zt¼ T
C *dt: (5)
at¼0
DTt
From the total mass on the filter for the sampling period, thetotal air volume sampled, and the time-averaged PM10 concentra-tion of the DustTrak (CDTt ) for the same period, the value of a can bedetermined through
CDTt ¼ a*CHVt(6)
re-arranged to
a ¼ CDTtmHV=VHV
: (7)
As the object of the study was to relate visibility to dust con-centration, an instantaneous value of TSD concentration at time(CHVt
at time i) was required. For this, Equation (8) was applied
CHVi¼ CDTi
a: (8)
To obtain CHVi, first, the measured PM10 concentration CDTi was
obtained for iwhen an A37 visibility reading existed. One issuewiththe split-site sampling and the distance between Mildura andBuronga is the small time difference in the onset of dust betweenthe two locations (Fig. 1). As this effectively represents a time lagbetween the sites, the time differencewas calculated and applied tothe lagging station to ensure that A37 visibilities and PM10 datacorresponded with one another. For instance, in Fig. 1, the drop invisibility marking the event onset occurred at 18:13 at Mildura,when windspeed was 42 km/h and wind direction 220�. At Bur-onga, downwind of Mildura and to the NE, the peak PM10 con-centration was 11 min later, an acceptable time lag given theMildura wind data and the 12 km distance between the sites. PerEquation (8), the PM10 concentration at i was divided by the PM10/TSD ratio (a) to yield an instantaneous TSD concentration for thetime of the visibility reading.
2.4. Testing the V-TSD model
In order to validate the V-TSD expression, a comparison wasmade between values of dust concentration estimated from themodel and those directly measured by the HVS. From the HVS fil-ters obtained at Buronga during 2002 and 2003, a total of 22 filterswas used as a test database, with each one representing an indi-vidual dust event. The use of this time period, which was prior tothe years used to develop the V-TSDmodel, ensured the test datasetwas independent of that used to formulate the model. To incor-porate a range of dust concentrations in the testing (i.e., differentdust event intensities), of the 22 events, four filters were randomlychosen from events with CHVS > 300 mg/m3 to represent relativelyintense dust conditions, seven filters for moderate dust concen-tration (100e300 mg/m3) and eleven filters with <100 mg/m3.
For each test event, the Vissynop values during the HVS samplingperiod were used to determine visibility. Given that CHVS representsthe dust concentration over the extended period that the HVSsampled, multiple three-hourly Vissynop values existed for each dustevent. To account for this, the V-TSD modelled dust concentrationwas calculated for an event by substituting each visibility into theV-TSD model and thenweighting the result by the time period thatthe visibility represented. This was achieved throughmultiplicationof the estimated concentration by the time interval (e.g., 3 h). Thetime-weighted concentration values were summed and divided bytotal event duration to produce themodelled concentration (CVTSD).
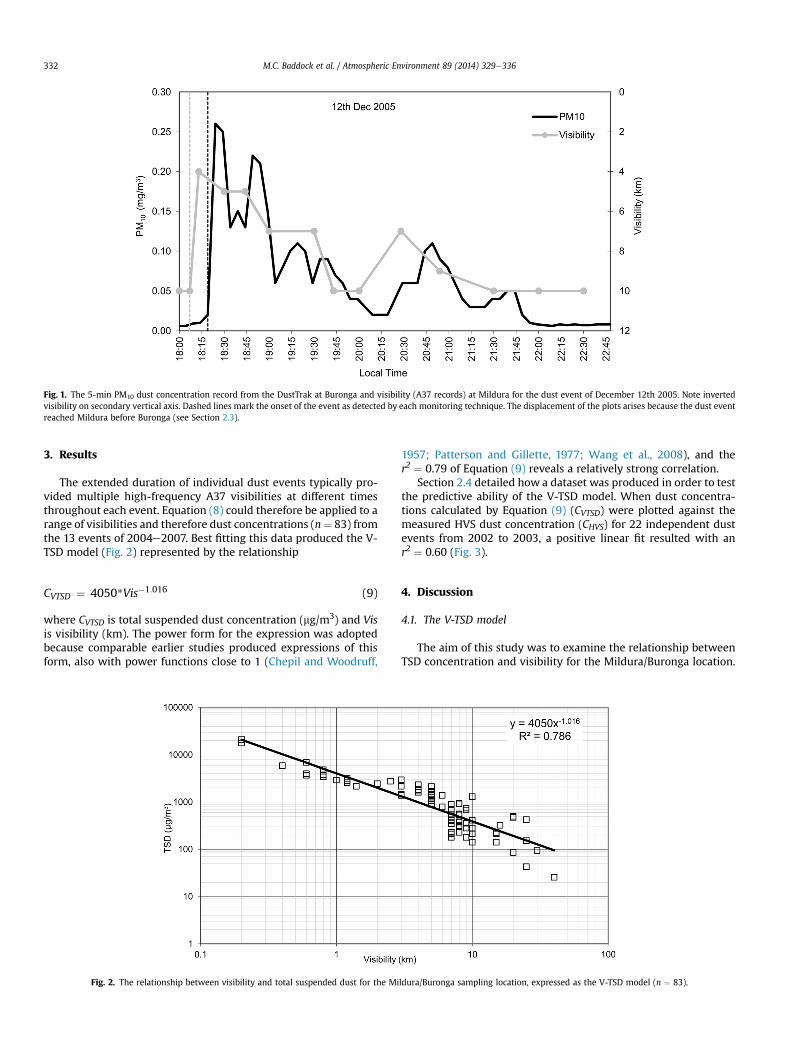
Fig. 1. The 5-min PM10 dust concentration record from the DustTrak at Buronga and visibility (A37 records) at Mildura for the dust event of December 12th 2005. Note invertedvisibility on secondary vertical axis. Dashed lines mark the onset of the event as detected by each monitoring technique. The displacement of the plots arises because the dust eventreached Mildura before Buronga (see Section 2.3).
M.C. Baddock et al. / Atmospheric Environment 89 (2014) 329e336332
3. Results
The extended duration of individual dust events typically pro-vided multiple high-frequency A37 visibilities at different timesthroughout each event. Equation (8) could therefore be applied to arange of visibilities and therefore dust concentrations (n¼ 83) fromthe 13 events of 2004e2007. Best fitting this data produced the V-TSD model (Fig. 2) represented by the relationship
CVTSD ¼ 4050*Vis�1:016 (9)
where CVTSD is total suspended dust concentration (mg/m3) and Visis visibility (km). The power form for the expression was adoptedbecause comparable earlier studies produced expressions of thisform, also with power functions close to 1 (Chepil and Woodruff,
Fig. 2. The relationship between visibility and total suspended dust for the Mi
1957; Patterson and Gillette, 1977; Wang et al., 2008), and ther2 ¼ 0.79 of Equation (9) reveals a relatively strong correlation.
Section 2.4 detailed how a dataset was produced in order to testthe predictive ability of the V-TSD model. When dust concentra-tions calculated by Equation (9) (CVTSD) were plotted against themeasured HVS dust concentration (CHVS) for 22 independent dustevents from 2002 to 2003, a positive linear fit resulted with anr2 ¼ 0.60 (Fig. 3).
4. Discussion
4.1. The V-TSD model
The aim of this study was to examine the relationship betweenTSD concentration and visibility for the Mildura/Buronga location.
ldura/Buronga sampling location, expressed as the V-TSD model (n ¼ 83).
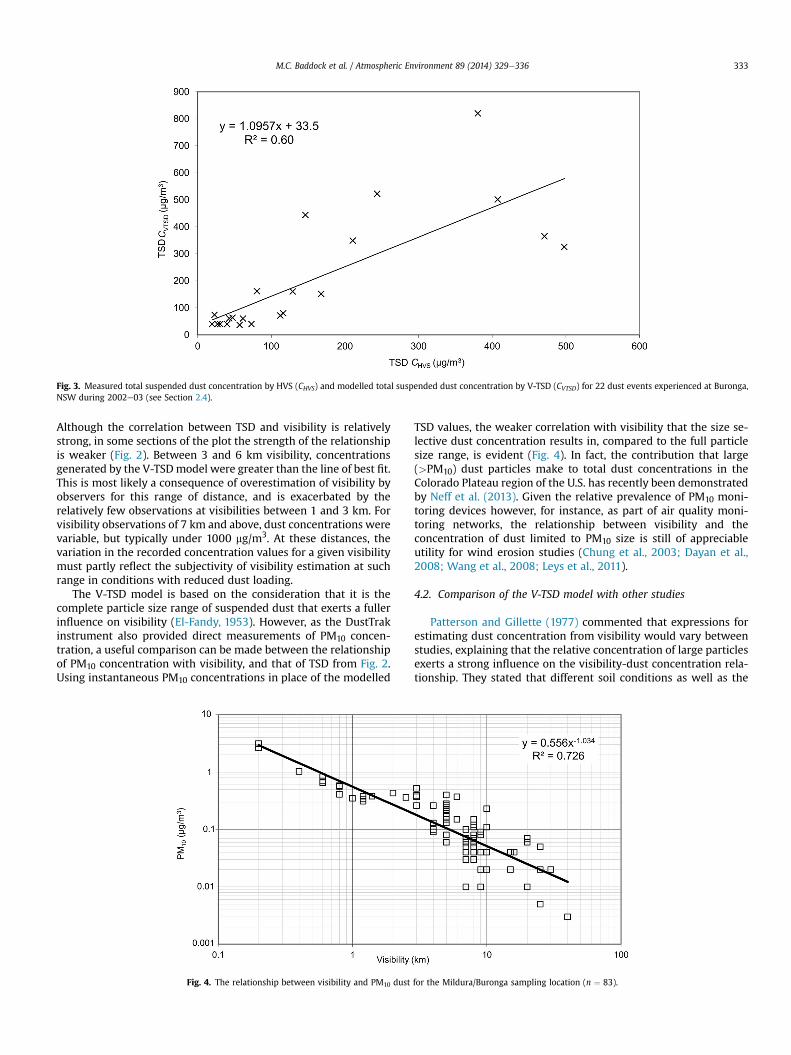
Fig. 3. Measured total suspended dust concentration by HVS (CHVS) and modelled total suspended dust concentration by V-TSD (CVTSD) for 22 dust events experienced at Buronga,NSW during 2002e03 (see Section 2.4).
M.C. Baddock et al. / Atmospheric Environment 89 (2014) 329e336 333
Although the correlation between TSD and visibility is relativelystrong, in some sections of the plot the strength of the relationshipis weaker (Fig. 2). Between 3 and 6 km visibility, concentrationsgenerated by the V-TSDmodel were greater than the line of best fit.This is most likely a consequence of overestimation of visibility byobservers for this range of distance, and is exacerbated by therelatively few observations at visibilities between 1 and 3 km. Forvisibility observations of 7 km and above, dust concentrations werevariable, but typically under 1000 mg/m3. At these distances, thevariation in the recorded concentration values for a given visibilitymust partly reflect the subjectivity of visibility estimation at suchrange in conditions with reduced dust loading.
The V-TSD model is based on the consideration that it is thecomplete particle size range of suspended dust that exerts a fullerinfluence on visibility (El-Fandy, 1953). However, as the DustTrakinstrument also provided direct measurements of PM10 concen-tration, a useful comparison can be made between the relationshipof PM10 concentration with visibility, and that of TSD from Fig. 2.Using instantaneous PM10 concentrations in place of the modelled
Fig. 4. The relationship between visibility and PM10 dust
TSD values, the weaker correlation with visibility that the size se-lective dust concentration results in, compared to the full particlesize range, is evident (Fig. 4). In fact, the contribution that large(>PM10) dust particles make to total dust concentrations in theColorado Plateau region of the U.S. has recently been demonstratedby Neff et al. (2013). Given the relative prevalence of PM10 moni-toring devices however, for instance, as part of air quality moni-toring networks, the relationship between visibility and theconcentration of dust limited to PM10 size is still of appreciableutility for wind erosion studies (Chung et al., 2003; Dayan et al.,2008; Wang et al., 2008; Leys et al., 2011).
4.2. Comparison of the V-TSD model with other studies
Patterson and Gillette (1977) commented that expressions forestimating dust concentration from visibility would vary betweenstudies, explaining that the relative concentration of large particlesexerts a strong influence on the visibility-dust concentration rela-tionship. They stated that different soil conditions as well as the
for the Mildura/Buronga sampling location (n ¼ 83).
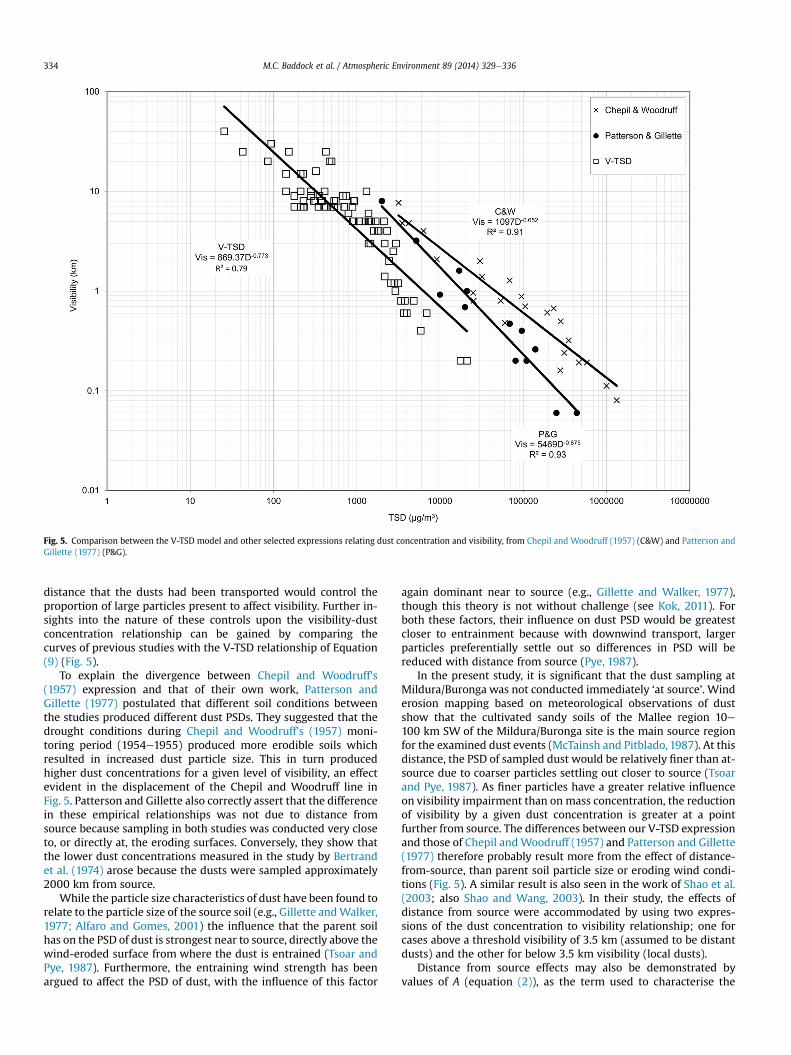
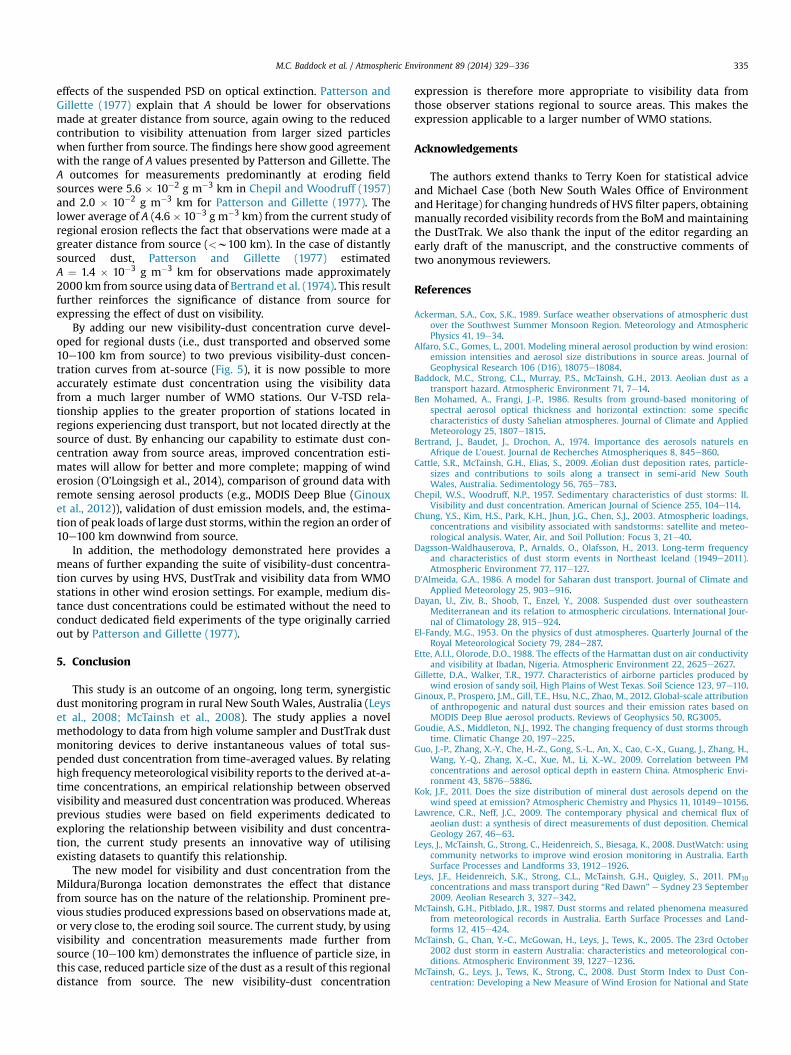
Fig. 5. Comparison between the V-TSD model and other selected expressions relating dust concentration and visibility, from Chepil and Woodruff (1957) (C&W) and Patterson andGillette (1977) (P&G).
M.C. Baddock et al. / Atmospheric Environment 89 (2014) 329e336334
distance that the dusts had been transported would control theproportion of large particles present to affect visibility. Further in-sights into the nature of these controls upon the visibility-dustconcentration relationship can be gained by comparing thecurves of previous studies with the V-TSD relationship of Equation(9) (Fig. 5).
To explain the divergence between Chepil and Woodruff’s(1957) expression and that of their own work, Patterson andGillette (1977) postulated that different soil conditions betweenthe studies produced different dust PSDs. They suggested that thedrought conditions during Chepil and Woodruff’s (1957) moni-toring period (1954e1955) produced more erodible soils whichresulted in increased dust particle size. This in turn producedhigher dust concentrations for a given level of visibility, an effectevident in the displacement of the Chepil and Woodruff line inFig. 5. Patterson and Gillette also correctly assert that the differencein these empirical relationships was not due to distance fromsource because sampling in both studies was conducted very closeto, or directly at, the eroding surfaces. Conversely, they show thatthe lower dust concentrations measured in the study by Bertrandet al. (1974) arose because the dusts were sampled approximately2000 km from source.
While the particle size characteristics of dust have been found torelate to the particle size of the source soil (e.g., Gillette andWalker,1977; Alfaro and Gomes, 2001) the influence that the parent soilhas on the PSD of dust is strongest near to source, directly above thewind-eroded surface from where the dust is entrained (Tsoar andPye, 1987). Furthermore, the entraining wind strength has beenargued to affect the PSD of dust, with the influence of this factor
again dominant near to source (e.g., Gillette and Walker, 1977),though this theory is not without challenge (see Kok, 2011). Forboth these factors, their influence on dust PSD would be greatestcloser to entrainment because with downwind transport, largerparticles preferentially settle out so differences in PSD will bereduced with distance from source (Pye, 1987).
In the present study, it is significant that the dust sampling atMildura/Buronga was not conducted immediately ‘at source’. Winderosion mapping based on meteorological observations of dustshow that the cultivated sandy soils of the Mallee region 10e100 km SW of the Mildura/Buronga site is the main source regionfor the examined dust events (McTainsh and Pitblado, 1987). At thisdistance, the PSD of sampled dust would be relatively finer than at-source due to coarser particles settling out closer to source (Tsoarand Pye, 1987). As finer particles have a greater relative influenceon visibility impairment than on mass concentration, the reductionof visibility by a given dust concentration is greater at a pointfurther from source. The differences between our V-TSD expressionand those of Chepil andWoodruff (1957) and Patterson and Gillette(1977) therefore probably result more from the effect of distance-from-source, than parent soil particle size or eroding wind condi-tions (Fig. 5). A similar result is also seen in the work of Shao et al.(2003; also Shao and Wang, 2003). In their study, the effects ofdistance from source were accommodated by using two expres-sions of the dust concentration to visibility relationship; one forcases above a threshold visibility of 3.5 km (assumed to be distantdusts) and the other for below 3.5 km visibility (local dusts).
Distance from source effects may also be demonstrated byvalues of A (equation (2)), as the term used to characterise the
M.C. Baddock et al. / Atmospheric Environment 89 (2014) 329e336 335
effects of the suspended PSD on optical extinction. Patterson andGillette (1977) explain that A should be lower for observationsmade at greater distance from source, again owing to the reducedcontribution to visibility attenuation from larger sized particleswhen further from source. The findings here show good agreementwith the range of A values presented by Patterson and Gillette. TheA outcomes for measurements predominantly at eroding fieldsources were 5.6 � 10�2 g m�3 km in Chepil and Woodruff (1957)and 2.0 � 10�2 g m�3 km for Patterson and Gillette (1977). Thelower average of A (4.6 � 10�3 g m�3 km) from the current study ofregional erosion reflects the fact that observations were made at agreater distance from source (<w100 km). In the case of distantlysourced dust, Patterson and Gillette (1977) estimatedA ¼ 1.4 � 10�3 g m�3 km for observations made approximately2000 km from source using data of Bertrand et al. (1974). This resultfurther reinforces the significance of distance from source forexpressing the effect of dust on visibility.
By adding our new visibility-dust concentration curve devel-oped for regional dusts (i.e., dust transported and observed some10e100 km from source) to two previous visibility-dust concen-tration curves from at-source (Fig. 5), it is now possible to moreaccurately estimate dust concentration using the visibility datafrom a much larger number of WMO stations. Our V-TSD rela-tionship applies to the greater proportion of stations located inregions experiencing dust transport, but not located directly at thesource of dust. By enhancing our capability to estimate dust con-centration away from source areas, improved concentration esti-mates will allow for better and more complete; mapping of winderosion (O’Loingsigh et al., 2014), comparison of ground data withremote sensing aerosol products (e.g., MODIS Deep Blue (Ginouxet al., 2012)), validation of dust emission models, and, the estima-tion of peak loads of large dust storms, within the region an order of10e100 km downwind from source.
In addition, the methodology demonstrated here provides ameans of further expanding the suite of visibility-dust concentra-tion curves by using HVS, DustTrak and visibility data from WMOstations in other wind erosion settings. For example, medium dis-tance dust concentrations could be estimated without the need toconduct dedicated field experiments of the type originally carriedout by Patterson and Gillette (1977).
5. Conclusion
This study is an outcome of an ongoing, long term, synergisticdust monitoring program in rural New SouthWales, Australia (Leyset al., 2008; McTainsh et al., 2008). The study applies a novelmethodology to data from high volume sampler and DustTrak dustmonitoring devices to derive instantaneous values of total sus-pended dust concentration from time-averaged values. By relatinghigh frequencymeteorological visibility reports to the derived at-a-time concentrations, an empirical relationship between observedvisibility and measured dust concentrationwas produced. Whereasprevious studies were based on field experiments dedicated toexploring the relationship between visibility and dust concentra-tion, the current study presents an innovative way of utilisingexisting datasets to quantify this relationship.
The new model for visibility and dust concentration from theMildura/Buronga location demonstrates the effect that distancefrom source has on the nature of the relationship. Prominent pre-vious studies produced expressions based on observations made at,or very close to, the eroding soil source. The current study, by usingvisibility and concentration measurements made further fromsource (10e100 km) demonstrates the influence of particle size, inthis case, reduced particle size of the dust as a result of this regionaldistance from source. The new visibility-dust concentration
expression is therefore more appropriate to visibility data fromthose observer stations regional to source areas. This makes theexpression applicable to a larger number of WMO stations.
Acknowledgements
The authors extend thanks to Terry Koen for statistical adviceand Michael Case (both New South Wales Office of Environmentand Heritage) for changing hundreds of HVS filter papers, obtainingmanually recorded visibility records from the BoM andmaintainingthe DustTrak. We also thank the input of the editor regarding anearly draft of the manuscript, and the constructive comments oftwo anonymous reviewers.
References
Ackerman, S.A., Cox, S.K., 1989. Surface weather observations of atmospheric dustover the Southwest Summer Monsoon Region. Meteorology and AtmosphericPhysics 41, 19e34.
Alfaro, S.C., Gomes, L., 2001. Modeling mineral aerosol production by wind erosion:emission intensities and aerosol size distributions in source areas. Journal ofGeophysical Research 106 (D16), 18075e18084.
Baddock, M.C., Strong, C.L., Murray, P.S., McTainsh, G.H., 2013. Aeolian dust as atransport hazard. Atmospheric Environment 71, 7e14.
Ben Mohamed, A., Frangi, J.-P., 1986. Results from ground-based monitoring ofspectral aerosol optical thickness and horizontal extinction: some specificcharacteristics of dusty Sahelian atmospheres. Journal of Climate and AppliedMeteorology 25, 1807e1815.
Bertrand, J., Baudet, J., Drochon, A., 1974. Importance des aerosols naturels enAfrique de L’ouest. Journal de Recherches Atmospheriques 8, 845e860.
Cattle, S.R., McTainsh, G.H., Elias, S., 2009. Æolian dust deposition rates, particle-sizes and contributions to soils along a transect in semi-arid New SouthWales, Australia. Sedimentology 56, 765e783.
Chepil, W.S., Woodruff, N.P., 1957. Sedimentary characteristics of dust storms: II.Visibility and dust concentration. American Journal of Science 255, 104e114.
Chung, Y.S., Kim, H.S., Park, K.H., Jhun, J.G., Chen, S.J., 2003. Atmospheric loadings,concentrations and visibility associated with sandstorms: satellite and meteo-rological analysis. Water, Air, and Soil Pollution: Focus 3, 21e40.
Dagsson-Waldhauserova, P., Arnalds, O., Olafsson, H., 2013. Long-term frequencyand characteristics of dust storm events in Northeast Iceland (1949e2011).Atmospheric Environment 77, 117e127.
D’Almeida, G.A., 1986. A model for Saharan dust transport. Journal of Climate andApplied Meteorology 25, 903e916.
Dayan, U., Ziv, B., Shoob, T., Enzel, Y., 2008. Suspended dust over southeasternMediterranean and its relation to atmospheric circulations. International Jour-nal of Climatology 28, 915e924.
El-Fandy, M.G., 1953. On the physics of dust atmospheres. Quarterly Journal of theRoyal Meteorological Society 79, 284e287.
Ette, A.I.I., Olorode, D.O., 1988. The effects of the Harmattan dust on air conductivityand visibility at Ibadan, Nigeria. Atmospheric Environment 22, 2625e2627.
Gillette, D.A., Walker, T.R., 1977. Characteristics of airborne particles produced bywind erosion of sandy soil, High Plains of West Texas. Soil Science 123, 97e110.
Ginoux, P., Prospero, J.M., Gill, T.E., Hsu, N.C., Zhao, M., 2012. Global-scale attributionof anthropogenic and natural dust sources and their emission rates based onMODIS Deep Blue aerosol products. Reviews of Geophysics 50, RG3005.
Goudie, A.S., Middleton, N.J., 1992. The changing frequency of dust storms throughtime. Climatic Change 20, 197e225.
Guo, J.-P., Zhang, X.-Y., Che, H.-Z., Gong, S.-L., An, X., Cao, C.-X., Guang, J., Zhang, H.,Wang, Y.-Q., Zhang, X.-C., Xue, M., Li, X.-W., 2009. Correlation between PMconcentrations and aerosol optical depth in eastern China. Atmospheric Envi-ronment 43, 5876e5886.
Kok, J.F., 2011. Does the size distribution of mineral dust aerosols depend on thewind speed at emission? Atmospheric Chemistry and Physics 11, 10149e10156.
Lawrence, C.R., Neff, J.C., 2009. The contemporary physical and chemical flux ofaeolian dust: a synthesis of direct measurements of dust deposition. ChemicalGeology 267, 46e63.
Leys, J., McTainsh, G., Strong, C., Heidenreich, S., Biesaga, K., 2008. DustWatch: usingcommunity networks to improve wind erosion monitoring in Australia. EarthSurface Processes and Landforms 33, 1912e1926.
Leys, J.F., Heidenreich, S.K., Strong, C.L., McTainsh, G.H., Quigley, S., 2011. PM10concentrations and mass transport during “Red Dawn” e Sydney 23 September2009. Aeolian Research 3, 327e342.
McTainsh, G.H., Pitblado, J.R., 1987. Dust storms and related phenomena measuredfrom meteorological records in Australia. Earth Surface Processes and Land-forms 12, 415e424.
McTainsh, G., Chan, Y.-C., McGowan, H., Leys, J., Tews, K., 2005. The 23rd October2002 dust storm in eastern Australia: characteristics and meteorological con-ditions. Atmospheric Environment 39, 1227e1236.
McTainsh, G., Leys, J., Tews, K., Strong, C., 2008. Dust Storm Index to Dust Con-centration: Developing a New Measure of Wind Erosion for National and State
M.C. Baddock et al. / Atmospheric Environment 89 (2014) 329e336336
Scale Monitoring. Final Report and User Guide. Griffith University, Brisbane,p. 32.
Middleton, N.J., Goudie, A.S., Wells, G.L., 1986. The frequency and source areas ofdust storms. In: Nickling, W.G. (Ed.), Aeolian Geomorphology. Allen & Unwin,Boston, pp. 237e259.
Neff, J.C., Reynolds, R.L., Munson, S.M., Fernandez, D., Belnap, J., 2013. The role ofdust storms in total atmospheric particle concentrations at two sites in thewestern U.S. Journal of Geophysical Research 118, 11201e11212.
Nickling, W.G., Gillies, J.A., 1993. Dust emission and transport in Mali, West Africa.Sedimentology 40, 859e868.
Nickling, W.G., McTainsh, G.H., Leys, J.E., 1999. Dust emissions from the ChannelCountry of western Queensland, Australia. Zeitschrift fur Geomorphologie N.F.116, 1e17.
O’Loingsigh, T., McTainsh, G.H., Tews, E.K., Strong, C.L., Leys, J.F., Shinkfield, P.,Tapper, N.J., 2014. The Dust Storm Index (DSI): a method for monitoringbroadscale wind erosion using meteorological records. Aeolian Research 12,29e40.
Orgill, M.M., Sehmel, G.A., 1976. Frequency and diurnal variations of dust storms inthe contiguous USA. Atmospheric Environment 10, 813e825.
Ozer, P., Laghdaf, M.B.O.M., Lemine, S.O.M., Gassani, J., 2006. Estimation of airquality degradation due to Saharan dust at Nouakchott, Mauritania, from hor-izontal visibility data. Water Air and Soil Pollution 178, 79e87.
Patterson, E.M., Gillette, D.A., 1977. Measurements of visibility vs mass of airbornesoil particles. Atmospheric Environment 11, 193e196.
Pye, K., 1987. Aeolian Dust and Dust Deposits. Academic Press, London.Raupach, M.R., McTainsh, G.H., Leys, J.F., 1994. Estimates of dust mass in recent
major dust storms. Australian Journal of Soil and Water Conservation 7, 20e24.
Satheesh, S.K., Moorthy, K.K., 2005. Radiative effects of natural aerosols. Atmo-spheric Environment 39, 2089e2110.
Shao, Y., Wang, J., 2003. A climatology of northeast Asian dust events. Meteor-ologische Zeitschrift 12, 187e196.
Shao, Y., Yang, Y., Wang, J., Song, Z., Leslie, L.M., Dong, C., Zhang, Z., Lin, Z., Kanai, Y.,Yabuki, S., Chun, Y., 2003. Northeastern Asian dust: real-time numerical pre-diction and validation. Journal of Geophysical Research 108 (D22), 4691.
Shao, Y., Leys, J.F., McTainsh, G.H., Tews, K., 2007. Numerical simulation of theOctober 2002 dust event in Australia. Journal of Geophysical Research 112,D08207.
Sokolik, I.N., Winker, D.M., Bergametti, G., Gillette, D.A., Carmichael, G.,Kaufman, Y.G., Gomes, L., Schuetz, L., Penner, J.E., 2001. Introduction to specialsection: outstanding problems in quantifying the radiative impacts of mineraldust. Journal of Geophysical Research 106, 18015e18027.
Stetler, L.E., Saxton, K.E., 1996. Wind erosion and PM10 emissions from agriculturalfields on the Columbia Plateau. Earth Surface Processes and Landforms 21, 673e685.
Tsoar, H., Pye, K., 1987. Dust transport and the question of desert loess formation.Sedimentology 34, 139e153.
Tozer, P.R., Leys, J., 2013. Dust storms e what do they really cost? The RangelandJournal 35, 131e142.
Wang, J., Christopher, S.A., 2003. Intercomparison between satellite-derived aerosoloptical thickness and PM2.5 mass: implications for air quality studies.Geophysical Research Letters 30, 2095.
Wang, Y.Q., Zhang, X.Y., Gong, S.L., Zhou, C.H., Hu, X.Q., Liu, H.L., Niu, T., Yang, Y.Q.,2008. Surface observation of sand and dust storm in East Asia and its appli-cation to CUACE/Dust. Atmospheric Chemistry and Physics 8, 545e553.