Embed Size (px)
Citation preview

Information and Software Technology 56 (2014) 408–437
Contents lists available at ScienceDirect
Information and Software Technology
journal homepage: www.elsevier .com/locate / infsof
A tool supporting root cause analysis for synchronous retrospectivesin distributed software teams
0950-5849/$ - see front matter � 2014 Elsevier B.V. All rights reserved.http://dx.doi.org/10.1016/j.infsof.2014.01.004
⇑ Corresponding author. Tel.: +358 407752781.E-mail addresses: [email protected] (T.O.A. Lehtinen), risto.virtanen@
aalto.fi (R. Virtanen), [email protected] (J.O. Viljanen), [email protected](M.V. Mäntylä), [email protected] (C. Lassenius).
Timo O.A. Lehtinen ⇑, Risto Virtanen, Juha O. Viljanen, Mika V. Mäntylä, Casper LasseniusDepartment of Computer Science and Engineering, Aalto University School of Science, P.O. Box 19210, FI-00076 Aalto, Finland
a r t i c l e i n f o a b s t r a c t
Article history:Received 7 June 2013Received in revised form 8 January 2014Accepted 9 January 2014Available online 17 January 2014
Keywords:ARCA-toolRoot cause analysisDistributed retrospectiveGlobal software engineering
Context: Root cause analysis (RCA) is a useful practice for software project retrospectives, and is typicallycarried out in synchronous collocated face-to-face meetings. Conducting RCA with distributed teams ischallenging, as face-to-face meetings are infeasible. Lack of adequate real-time tool support exacerbatesthis problem. Furthermore, there are no empirical studies on using RCA in synchronous retrospectives ofgeographically distributed teams.Objective: This paper presents a real-time cloud-based software tool (ARCA-tool) we developed to sup-port RCA in distributed teams and its initial empirical evaluation. The feasibility of using RCA with dis-tributed teams is also evaluated.Method: We compared our tool with 35 existing RCA software tools. We conducted field studies of fourdistributed agile software teams at two international software product companies. The teams conductedRCA collaboratively in synchronous retrospective meetings by using the tool we developed. We collectedthe data using observations, interviews and questionnaires.Results: Comparison revealed that none of the existing 35 tools matched all the features of our ARCA-tool.The team members found ARCA-tool to be an essential part of their distributed retrospectives. They con-sidered the software as efficient and very easy to learn and use. Additionally, the team members per-ceived RCA to be a vital part of the retrospectives. In contrast to the prior retrospective practices ofthe teams, the introduced RCA method was evaluated as efficient and easy to use.Conclusion: RCA is a useful practice in synchronous distributed retrospectives. However, it requires soft-ware tool support for enabling real-time view and co-creation of a cause-effect diagram. ARCA-tool sup-ports synchronous RCA, and includes support for logging problems and causes, problem prioritization,cause-effect diagramming, and logging of process improvement proposals. It enables conducting RCAin distributed retrospectives.
� 2014 Elsevier B.V. All rights reserved.
1. Introduction
Retrospectives, also known as post-mortems, are activitieswhere the team members share experiences about problems andtheir causes [1], analyzing a recently ended project and/or itera-tion. Root cause analysis (RCA) is a structured investigation of aproblem to detect which underlying causes need to be solved [2],and a useful practice for retrospectives [3–5]. Retrospectives aretypically conducted in face-to-face meetings, in which the teammembers first identify problems that occurred. Subsequently, theyconduct lightweight RCA by collaboratively creating a cause-effectdiagram visualizing the causes of problems [5].
Global software engineering, employing geographically distrib-uted teams, has become a standard way of operating in today’sbusiness [6]. This way of working creates new challenges relatedto geographical, temporal, cultural and organizational distance[7]. The use of distributed teams also creates a major challengefor conducting team retrospectives [8]. In previous work, we devel-oped a lightweight focus group based RCA method, ARCA, and eval-uated it in four industrial field studies using collocated teams [9].Even though the method was well liked, the companies pointedout the need to conduct RCA with their distributed teams. Litera-ture on distributed retrospectives identifies a similar need and dis-cusses the use of a combination of email, spreadsheets and anonline audio bridge to help facilitate the retrospectives [8]. How-ever, relying on such tools in focus group based synchronous RCAis not feasible, as organizing and interpreting a high number ofcauses using emails and spreadsheets would be highly difficult. In-stead, cause-effect diagrams [9] supporting real-time online envi-ronment should be used in distributed retrospectives.

T.O.A. Lehtinen et al. / Information and Software Technology 56 (2014) 408–437 409
There are many proprietary software tools for RCA.1 However,we have not succeeded in finding a web-based tool that fulfills theneeds of conducting lightweight RCA in synchronous distributedsoftware project retrospectives. First, the tool should make it possi-ble for RCA participants to co-create a cause-effect diagram [5,9],which stays in-sync between the sites. Second, the tool should allowthe development of process improvement ideas for the causes andmaintain links between the improvement ideas and the detectedcauses [10–14]. Third, the tool should make it possible to vote onthe most severe causes and best improvement ideas [9]. Fourth,the tool should also make it possible to capture and refine the find-ings of several retrospectives, in order to support organizationallearning and knowledge management [3]. To the authors’ bestknowledge2 the most frequently lacking feature of current softwaretools for RCA is the syncing mechanisms needed for simultaneousco-creation of cause-effect diagrams, see Table 1. There are toolsfor simultaneous graph drawing, e.g., Google Docs drawings [15],but these tools lack features to support RCA, e.g. automatically cap-turing and refining the findings of retrospectives.
Furthermore, to our knowledge, there are no empirical studieson the feasibility of using RCA in synchronous distributed retro-spectives. While there is ample evidence for the benefits of RCAto detect the causes of problems and make improvements in vari-ous contexts [9–13,16–21], the existing studies have been con-ducted in a face-to-face context. Thus, in order to contribute tothe existing studies, we developed an online tool for supportingsynchronous RCA in distributed software project retrospectivescalled ARCA-tool.3 It provides features for distributed RCA, ideadevelopment, and capturing the lessons learned in manyretrospectives.
The goals of this paper are to present ARCA-tool including its tech-nology and main features, and to provide an empirical evaluation ofthe tool and synchronous RCA in the context of industrial softwaredevelopment with agile teams. In order to evaluate the usefulnessof RCA and ARCA-tool, we used interviews, questionnaires, andobservations in the retrospectives of geographically distributedindustrial software teams, that followed the Scrum methodology[22]. Our research questions were:
RQ1: Is ARCA-tool perceived as useful in the distributed retrospec-tives of agile software teams?RQ2: Is ARCA-tool perceived as easy to use in the distributed retro-spectives of agile software teams?RQ3: Is RCA perceived as a good approach to use in the distributedretrospectives of agile software teams?
While the first two questions are related directly to ARCA-tool,we evaluate the RCA method, since the evaluators might have dif-ficulty separating the effect of the tool and the context in which itwas applied, i.e. the synchronous retrospective method used andthe company context. Naturally, ARCA-tool can be used withoutthe retrospective with the RCA method and vice versa.
The rest of the paper is structured in the following way. Section2 covers the related work and identifies a gap in research, which isthen filled by introducing ARCA-tool in Section 3. Section 4 ex-plains the field study method used to evaluate the tool in realindustrial contexts and the results of this evaluation are given inSection 5. Finally, Section 6 contains the discussion and Section 7provides conclusions and directions for further work.
1 http://open-tube.com/10-best-software-tools-to-conduct-root-cause-analysis-and-solve-complex-problems/.
2 Investigation of proprietary RCA tools is difficult as freely available information ofthe tools is limited.
3 http://wirca.soberit.hut.fi/prod/?language=en.
2. Related work
In this section, we introduce the concept of software project ret-rospectives and present problems related to conducting RCA withdistributed software teams. We also compare RCA software toolsthat we have found.
2.1. Software project retrospectives
The key for effective problem prevention is controlling thecauses of problems [23]. It is claimed that problems cannot besolved without solving their causes [9]. Retrospectives are onemeans to help identify and prevent the reoccurrence of problemsthat have occurred in prior projects [8,24–26].
In retrospectives, the team members share their experiencesabout problems and their causes [4,5,24]. Retrospectives enablelearning at the individual, team, and organizational level. At theindividual level, learning is based on shared experiences [27]. Thus,at the team level, learning is related to the shared experiencesamong the team members [27]. Furthermore, learning at the orga-nizational level requires knowledge management, i.e. the sharedexperiences are captured and refined, and thereafter distributedto the teams [3]. Therefore, the output of retrospectives must becaptured and refined.
A software project retrospective can be viewed as a step-by-step process [5,28]. In the first step, problems related to the pastproject, iteration, or milestone are identified. Thereafter, the partic-ipants collaboratively identify the causes of the problems by usingRCA. In RCA, the causes of problems are identified by constantlyasking ‘‘why’’ for every cause [9]. The causes are visualized byusing a cause-effect diagram, e.g., a fishbone diagram [5,14,19],or a directed graph [5,9]. The diagram represents the cause-and-ef-fect relationships between the causes of problems. It aims to assistthe participants to detect underlying causes for the problems. Afterthe cause-effect diagram is finalized, the participants detect theroot causes, defined as the underlying and controllable causes ofthe problem [9]. Process improvement ideas are then developedfor the selected root causes.
While the traditional use of retrospectives has been fraught withproblems [25], modern agile development processes, such as Scrum[22], have made the practice common in modern organizations. Assuch, Scrum or other agile development processes do not requirethe use of RCA as part of their retrospectives – however RCA canwell be used in Scrum retrospectives as a practice that helps addboth structure and provides additional value to the teams.
2.2. Root cause analysis and distributed retrospectives
The issue of distributed team members has been considered asthe greatest challenge that organizations face while conductingretrospectives [8]. Retrospectives should be lightweight [28] butunder the influence of budget constraints and time pressure, theyare rarely conducted [25]. While the project members are geo-graphically dispersed, arranging face-to-face retrospectives re-quires too much effort. Conducting face-to-face retrospectives insuch settings is often cumbersome. Distributed retrospectives areintroduced as substitutes for face-to-face retrospectives [8]. Suchretrospectives are typically conducted with the aid of an audio orvideo bridge [8]. Logically, in distributed software projects, con-ducting distributed retrospectives require less effort than conduct-ing them face-to-face due to decreased traveling time.
Conducting RCA in distributed retrospectives is difficult as it re-quires tools that are not yet mature enough. It has been claimedthat a combination of emails, spreadsheets, and an audio bridgeare enough to support distributed retrospectives [8]. However, in

Table 1Comparison of RCA software (for more details see Appendix A).
Software Technical featuresa RCA featuresa Costs
Client: browser/native
Real-timecollaboration
Cause-effectdiagram
Ideadevelopment
Voting Knowledgemanagement
ARCA-tool Browser Yes Graph Yes Yes Yes Free(MIT)
Google Docs drawings Browser Yes Graph Yes – – Free touse
TapRooT Enterprice ed. Both (Yes) Tree Yes – Yes FeeREASON Both – – Yes – Yes FeeXFRACAS Browser (Yes) – Yes – Yes FeeRCAT Software ? ? Tree ? ? Yes ?PathMaker Native Yes Tree Yes – Yes FeeCause link Native – Tree Yes – Yes FeeSolve ? ? Tree ? ? ? ?SIM� Native (Yes) Tree Yes ? Yes FeePROACT Native Yes Tree Yes ? Yes FeeCatalyst Native – – – – – Free
(GPL)Blackbox Native ? Tree (Yes) ? Yes FeeInvestigator 3 Native ? Tree Yes ? Yes FeeTrack Native – – – – Yes FeeCorrective Action Browser Yes – Yes – Yes FeeRealityCharting Both Yes Tree Yes Yes Yes FeeABS Cons. Root Cause Map ? Yes ? Yes ? Yes FeeRCA Software 5.1 Native – Tree – – – FeeThinkReliability Excel
TemplateNative – Tree Yes – – Free
Enablon IMS ? ? Tree Yes ? Yes FeeSmartdraw Native – Tree – – – FeeSet-Based Thinking Native – Graph Yes ? Yes FeePHRED (Browser) (Yes) Tree Yes ? Yes FeeBowTieXP Native – Tree (–) ? Yes FeeFMEA Software Native (–) Tree Yes – Yes FeeSystems2win Native – Graph – – – FeeiReliability Browser – Tree Yes – (–) FeeFMECA Software Native – Tree (–) (–) (Yes) FeeRapid Problem Isolation Native – Tree – – (Yes) FeeLassale [33] Native – Tree – – (–) ?CA Spectrum ? ? ? ? ? ? FeeRootCause ? – (–) Yes ? (Yes) FeeSpeechminer ? ? ? ? ? ? FeeRoot Cause Analyst (Native) ? (Tree) ? ? (–) FeeRCA GUI [35] Native – Tree Yes – Yes ?
a This feature is not available in the software tool, Yes = this feature is available in the software tool, (–) = it is likely that this feature is not available in the software tool, butwe were not able to verify that, (Yes) = it is likely that this feature is available in the software tool, but we were not able to verify that, ? = we were not able to find anyevidence on the occurrence of this feature, Fee = the software is subject to a fee, free (license) = the software is free, free to use = using the software is free.
410 T.O.A. Lehtinen et al. / Information and Software Technology 56 (2014) 408–437
software projects, conducting RCA with spreadsheets is difficult[9]. This is because of the high number of detected causes[9,11–13]. For example, in our previous work, four software prod-uct companies conducted two hour RCA workshops (similar to ret-rospectives) each and 80–135 causes of software project problemswere found in each workshop [9]. The causes were spread over var-ious process areas [29] and had complex cause-and-effect relation-ships to one another.
Several tools for distributed software development exist[30–32]. The tool types that are the most similar to ARCA-toolare collaborative modeling tools [30] that allow collaborative anddistributed software modeling. However, the main goal of thosetools is software design modeling, while our tool is focused onRCA cause-effect diagram modeling. Additionally, knowledge man-agement tools [30,31] include knowledge sharing features, whichARCA-tool also provides. Furthermore, our tool reduces – but doesnot replace – the need for the use of other communication tools,e.g., a chat, as the cause-effect diagram is constantly updated toall participants, which helps group awareness. Our tool also hassimilarity with virtual whiteboards, such as Google Docs drawings[15], but our tool has more specific features for cause-effect dia-gramming and the development of process improvement ideas.Additionally, none of the virtual whiteboards offers support for cap-
turing and refining the shared experiences from the retrospectivesof many teams. Based on the literature it seems that it would bepossible to combine the existing collaborative tools for performingthe same tasks as with our ARCA-tool. However, this would requireswitching between tools and require cumbersome copy-pasting(from the original cause-effect diagrams to some separate list ofprocess improvement targets and ideas) between different tools.
2.3. Comparison of root cause analysis software tools
Software tools that support RCA in synchronous distributed ret-rospectives are rare. We searched RCA software tools from Google,Sourceforge, Google Scholar, and Scopus. We found a total of 35tools and compared their features with ARCA-tool (see Section 3).
We searched for existing root cause analysis software in Googleusing two search strings:<‘‘root cause analysis software’’> and<‘‘root cause analysis software’’ free>. The first search string re-sulted in 404,000 estimated hits. Thus, it appears the topic is ofhigh interest. For both search strings, we included all softwaretools that we found from search result pages until there was asearch result page which did not extend the found tools any further(10 hits + adds of the search result page). The number of search re-sult pages was eight for the first and two for the second search

T.O.A. Lehtinen et al. / Information and Software Technology 56 (2014) 408–437 411
string. With this limitation, our search resulted in 24 unique toolsfor RCA. We applied this limitation in order to complete our searchwithin reasonable time.
Searching for the tools from Google also revealed two additionalwebsites that summarize software tools for RCA.4 We also includedthese tools in the evaluation. The websites revealed 17 different soft-ware tools for RCA. However, 8 tools were already found in Google.Thus, we were left with 33 unique tools for RCA.
We also searched the sourceforge.com database with searchstring ‘‘root cause analysis’’ and found one open source alternativethat claimed to support root cause analysis (DecisionTreeExpert).Unfortunately, there was no guidance on how to use the tool andwe were unable to see how the tool could be used for RCA, and thusexcluded it from the comparison.
Furthermore, we searched academic works from Google Scholarand Scopus with the search string ‘‘root cause analysis software’’.Google Scholar resulted in 58 articles and Scopus resulted in 37articles. For each article, we read its heading, abstract, key words,and skimmed the content of paper. If the article indicated that atool for RCA is introduced, we selected the article for further eval-uation. Six articles were selected from Google Scholar and threearticles were selected from Scopus. The selected articles werethereafter read. One article from Google Scholar [33] and two arti-cles from Scopus [34,35] introduced a software tool for RCA. Two ofthese articles introduced a tool that we had already found (Lassaleand REASON) from non-academic databases. Finally, we decided tomake a comparison to Google Docs drawings, an online collabora-tive graph drawing tool. Thus, we had 35 existing software toolsthat we compared with ARCA-tool.
We made our comparison based on the material freely availableto us. The sources of information included demonstration videos,free trial versions, marketing material and other available docu-mentation as the majority of the tools were proprietary.
The features that we compared cover seven aspects importantfor conducting synchronous distributed software project retro-spectives. We introduce these aspects below and present analyticalarguments for them based on our experience in conducting indus-trial RCA sessions [9] and prior literature on software project retro-spectives [4,5], and organizational learning systems [36]. Thecomparison is summarized in Table 1 while further details of thecomparison are in Appendix A.
First, we argue that web browser based software outperformsnative client software in the ease of adoption. The software teamsrarely have time to conduct retrospectives [25] and therefore theease of adoption is an important aspect. Native client software re-quires installation whereas web browser based software can beimmediately used. Furthermore, people can use web browserbased software with computers having a different operating sys-tem and hardware including tablets and smart phones. This isthe case unless the web browser based software requires pluginsthat only work on certain systems, e.g., the flash plugin. Web brow-ser based software can also be used from home computers thatmight not have the native client software pre-installed or mightlack the required licenses. Thus, web browser based clients makeorganizing retrospectives more lightweight and hassle free. Fourof the existing tools are used with a web browser, see Table 1.
Second, in order to conduct distributed synchronous retrospec-tives similarly to collocated retrospectives [4,5] the RCA softwaretool needs to support real-time collaboration among all partici-pants. This means that the RCA software outcome stays in sync be-tween the different sites. Additionally, all team members should beable to contribute to the analysis as it takes place. Therefore, all cli-
4 http://open-tube.com/10-best-software-tools-to-conduct-root-cause-analysis-and-solve-complex-problems http://www.rootcauselive.com/library/Software.htm.
ents need to have synchronous editing access to the analysis re-sults. We see that push–pull technology is needed to implementsuch requirements as it removes the need for clients to constantlyreload their view. Only six of the existing tools fully support real-time collaboration.
Third, co-creation of a cause-effect diagram is at the core of RCAin retrospectives, as introduced in [4,5,9]. Using the cause-effectdiagram helps the team members to understand and explain a com-plex problem in terms of its causes, sub-causes, and causal relation-ships. The majority of the RCA software tools enable creating thecause-effect diagram. Considering the structure of the cause-effectdiagram, only three of the existing tools support drawing a graph,while the majority of the tools support tree based cause-effect dia-grams. A graph structure has been claimed as more efficient forsoftware project retrospectives than the tree structure [5].
Fourth, RCA aims to develop process improvement ideas for thecauses of problems [9]. Thus, the RCA software tool should make itpossible to develop and link improvement ideas to the identifiedcauses of problems. Such features are supported by the majorityof the tools.
Fifth, it is important that the team members can vote on themost severe causes and best improvement ideas [9]. This is impor-tant if a high number of causes and improvement ideas are de-tected [9]. The team members can focus on the causes perceivedas the most severe. Similarly, they can decide collaboratively whichimprovement ideas should be implemented. Voting is supportedonly in one of the existing tools.
Sixth, the RCA software tool should support knowledge manage-ment, which is about creating ‘‘learning organization’’ [4]. Dingsøyrpresents that retrospectives are ‘‘a method for leveraging knowl-edge from the individual level to the organizational level’’ [4]. Leeet al. [36] present that organizational learning system should in-clude ‘‘global knowledge base’’ that combines ‘‘cognitive maps’’(cause-effect diagrams of experiences) created by individuals. Thus,the software tool should include the knowledge base which enablescombining the lessons learned from many retrospectives and teamsover the years. The majority of the tools support knowledge man-agement and allow accessing past RCA session results.
Seventh, we analyzed the costs of existing tools. One of the toolsis under an open source license, two are otherwise free to use,whereas the majority of the tools are subject to a fee.
To summarize, in contrast to the existing RCA software tools,only ARCA-tool covers all of the seven aspects discussed above.However, our analysis was limited as described at the beginningof this section and the evaluation of many tools was challengingdue to proprietary licenses and limited access to many commercialtools. Thus, it is possible that software tools with similar featuresas ARCA-tool exist. In any case, the results of our field study canbe used as evidence for the usefulness of any tool that implementsthese features. Furthermore, the comparison of these 35 prior RCAsoftware tools is the largest according to our knowledge.
3. ARCA-tool
This section provides an overview of ARCA-tool. We will discusshow the tool supports distributed retrospectives and the features itincludes.
3.1. Overview of ARCA-tool
ARCA-tool is designed to be used when conducting RCA in ret-rospectives. The tool is open-source (MIT license) and was devel-oped in two subsequent projects on the Aalto Universitysoftware capstone project course5 by 15 software engineering
5 https://noppa.aalto.fi/noppa/kurssi/t-76.4115/etusivu.

412 T.O.A. Lehtinen et al. / Information and Software Technology 56 (2014) 408–437
students. During the projects, the primary author of this paper actedas the customer and provided the tool requirements. ARCA-tool sup-ports the identification of problems and their causes by providingfeatures particularly suitable for the creation of cause-effect dia-grams in software project retrospectives. Among many useful fea-tures, the team members can develop process improvement ideasembedded in the detected causes and problems. The tool supportsconducting distributed retrospectives, and makes it possible to cap-ture and summarize the findings of a set of retrospectives.
ARCA-tool uses a client–server architecture with push-and-pulltechnology, i.e., the server and clients transmit and receive mes-sages from one another. The core of the tool is a cloud server.The cloud server ensures that all clients (web browsers) are up-to-date in real-time. This is important during distributed retro-spectives as the contribution of team members is immediately vis-ible to the other team members.
3.2. Key features of ARCA-tool
In ARCA-tool, a retrospective facilitator creates a retrospectiveand shares it with the team members. The team members can jointhe retrospective from their own computers through a TCP net-work connection. Thus, the retrospectives do not need to be con-ducted face-to-face. Additionally, ARCA-tool allows the teammembers to contribute to the retrospective ‘‘before’’ and ‘‘after’’the retrospective meeting. This is occasionally important as findinga common time is especially difficult in geographically dispersedprojects [8]. However, such approach does not make it possibleto ask clarifications about the detected problems from other teammembers. Then one can only see what the others have found.Respectively, the team members cannot contribute to the findingswhich are not yet detected. On the other hand, the team memberscan provide input for others or try to contribute to their findings.
The team members start the retrospective by listing problemsthat occurred during the unit of analysis, which typically is aniteration [5]. Thereafter, they select problems (which can be donethrough voting that is supported by the tool or by managerialdecision, see ‘‘Points’’ in Fig. 1), which are analyzed by usingRCA [5]. In order to support RCA, a cause-effect diagram is pro-vided. ARCA-tool uses a directed graph structure to model thecause-and-effect relationships (Fig. 1). Such a structure, a cause-effect diagram, has been found to be suitable for software projectretrospectives [5,9]. The team members can enter the problems,the causes of problems and related cause-and-effect relationshipsto the cause-effect diagram. The tool protects the anonymity ofteam members.
After the causes are entered, the team members can developprocess improvement ideas related to the causes. In ARCA-tool,the team members develop their process improvement ideasfor each cause separately. This increases the accuracy of the pro-cess improvement ideas as now they are cause specific correc-tive actions. Additionally, the ideas are visually embedded inthe causes. ARCA-tool colors the causes that have correctives ac-tions with a yellow color (see the cause ‘‘Lack of commitment’’in Fig. 1). Embedding is important as it keeps the cause-effectdiagram clean and simple. Naturally, for the evaluation of theprocess improvement ideas, the tool offers a separate view forbrowsing all or selected improvement suggestions as one list(see Fig. 2).
All key features of ARCA-tool are embedded in a radial menu(see Fig. 1). The radial menu is activated when a team memberselects a cause. Simultaneously, all causes that are directly con-nected with the cause are emphasized (see the edges connectedwith the cause ‘‘Project members do not meet enough’’ in Fig. 1).The key features are, starting from the one o’clock position, andproceeding in counterclockwise order.
� Thumb up = Vote for this cause.� Pencil = Edit this cause.� Trashcan = Delete this cause.� Light bulb = Create process improvement idea.� Arrow left = Link this cause to another existing cause.� + sign = Create a cause that is linked to this cause.� Ticket = Classify this cause.
3.3. Additional features of ARCA-tool
Voting is occasionally used in retrospectives to focus the atten-tion of the team members to specific problems or causes. Voting isalso used to indicate process improvement ideas the team mem-bers value the most [9]. In ARCA-tool, the team members can ‘‘like’’or ‘‘dislike’’ the causes and process improvement ideas (see the‘‘Points’’ and the thumbnail icon in the radial menu in Fig. 1).The amount of likes and dislikes is limited to ±1 for the team mem-bers while being unlimited for the retrospective facilitator. Thisway the causes and developed process improvement ideas can bevoted on by the team members and emphasized by the facilitator.
Classification of the causes of problems has been used to im-prove learning and to draw conclusions from detailed and high-vol-ume observations made during RCA, e.g. [10,12,13]. In ARCA-tool,the classification can be done during or after the causes are enteredin the cause-effect diagram. The tool provides two dimensions forclassifying the causes. The pre-existing classification dimensionsare the process areas and types of causes [29]. The process areas ex-press in which parts of the software process the causes occur,whereas the types of causes explain what the causes are. InARCA-tool, the team members can develop a retrospective specificclassification or utilize the classifications used in their prior retro-spectives. The tool also provides statistics about the classificationsmade during the retrospectives. For example, the team memberscan view the distributions of the detected causes (see Fig. 3). Theycan also view the distributions of liked causes, and causes that in-clude process improvement ideas. The team members can also viewthe cause-and-effect relationships between the process areas.
In order to support organizational learning, ARCA-tool providesfeatures for monitoring the output of retrospectives, i.e., the causesand process improvement ideas. The tool enables the analysis of anindividual retrospective as well as the combination of many retro-spectives. This can be highly useful while capturing and refining thelessons learned from many retrospectives. The team members canview the output of all retrospectives they have participated in.The status of the detected causes ( detected, elimination, won’t fix,fixed) and developed process improvement ideas (idea, will beimple-mented, implemented, rejected) can also be managed. Additionally,the tool provides information about the classified causes. For exam-ple, senior managers would like to know what process areas aremost often related to the problems analyzed in the retrospectives,see Fig. 3. They would also like to know what types of causes areusual in those process areas. In ARCA-tool, the cause-and-effectrelationships between the classifications can be automatically visu-alized for the selected retrospectives. Additionally, the tool pro-vides detailed statistics about the distributions of cause types inprocess areas. Furthermore, the team members can download a filewhich includes the detected causes and process improvement ideasfrom the monitored retrospectives. Thus, the team members canuse ARCA-tool to analyze the detailed issues processed in the priorretrospectives and communicate the lessons learned to others.
4. Field study methodology
For the empirical evaluation of ARCA-tool, we used a field studymethod [37] that allowed us to study the adoption and use of thetool in a real industrial setting. We observed and video recorded

Fig. 1. Screen view of ARCA-tool.
Fig. 2. Monitoring view of ARCA-tool showing the causes of Fig. 1 and their improvement ideas.
T.O.A. Lehtinen et al. / Information and Software Technology 56 (2014) 408–437 413
four retrospectives conducted by four teams in two companies.After the retrospectives, all participants completed a question-naire, and selected case participants were interviewed. Thus, wepresent a rich data set from four industrial software teams, butin contrast to a controlled experiment, we cannot present mean-ingful statistical comparisons, due to the low number of subjectsand the lack of a control group providing an independent baselinefor which we could compare our measures. This section presentsthe research method and context in more detail. The case compa-nies are introduced in Section 4.1 and the retrospective methodincluding the usage of ARCA-tool in Section 4.2. The data collectionand analysis methods are shown in Sections 4.3 and 4.4.
4.1. Case companies
The empirical part of this study was conducted in two softwareproduct companies, as summarized in Table 2. The rationale forthe selection of these two case sites was that together they formedan interesting research setting allowing us to evaluate an industri-ally relevant retrospective method and software tool in collocatedand distributed retrospectives. The similarities between the casesmade them more comparable whereas the dissimilarities allowed
us to evaluate the retrospective method and software tool in differ-ent case domains.
The retrospectives of both cases followed a similar retrospec-tive method and each retrospective was computer facilitated byARCA-tool. The cases were also similar considering the numberof retrospective participants, and effort used in the retrospectives.The roles of the case participants were also somewhat similar.Additionally, both cases were conducted in distributed agile soft-ware development organizations. Two important differences be-tween the cases were present. First, in Case 1, the usedretrospective method was their current method. Instead, the ret-rospective method was new in Case 2. Similarly, in Case 1,ARCA-tool was used in retrospectives previously. Instead, in Case2, it was introduced the first time. Second, the participants of Case1 were experienced with collocated retrospectives, which theyused in this study, too. Instead, the case participants in Case 2were experienced with distributed retrospectives and they fol-lowed that approach, respectively. Therefore, we characterizethe retrospectives of Case 1 as collocated whereas the retrospec-tive of Case 2 was distributed. The cases were also different con-sidering the company size and specific target problems analyzedin the retrospectives.

Fig. 3. Pie chart view of ARCA-tool presenting the distributions of classified causes shown in Fig. 1.
Table 2Summary of the company cases.
Case 1 Case 2
Case company Software company with >800 employees Software company with >100 employeesSW development
organizationAgile with >30 employees Agile with >70 employees
Case participants Product owners, scrum masters, architects, and developers.N = 3 + 5 + 3 = 11
Scrum master, architects and developers. N = 5
Evaluation perspective Evaluation of the current method and tool Evaluation of a new method and toolRetrospective(s) 3 � Collocated 1 � DistributedDistribution All persons in a meeting room in Finland 1 person in Romania + 2 in the office in Finland + 2 at
homeEffort used 1 h meeting + 3 � 1 h retrospective (3 teams) 1 h meeting + 1 h retrospective (1 team)Target problem(s) Expectations of product owners do not meet the output of scrum teams (1) Lack of pair programming
(2) Lack of merging the code(3) Lack of collaboration
Causes found (23) + (20) + (39) = 82 (20 + 24 + 15) = 59
414 T.O.A. Lehtinen et al. / Information and Software Technology 56 (2014) 408–437
4.1.1. Case 1Case 1 was conducted in a large-sized international software
product company with over 800 employees. The products arehighly complex software systems integrated into customized hard-ware provided by the company partners and to third party soft-ware modules. There are around 30 employees working for thecore product of the company. The rest of the employees work inlocalization, integration, customer services and sales. Our studycontext, the software development organization of the core prod-uct is divided into two development teams, which are geographi-cally distributed over several European countries.
The organization follows agile software development practices,based on the Scrum methodology [22]. The development work isdivided into sprints each lasting two weeks. In order to facilitate
continuous improvement, the Scrum teams conduct 60 min face-to-face retrospectives regularly. These are conducted at the sametime as the sprint demonstration and the planning of the upcomingsprint. The teams have found using RCA and ARCA-tool in the ret-rospectives to be useful. The retrospectives are conducted with thefollowing procedure. The team members start by listing positiveand negative experiences with ARCA-tool. Then they conductRCA for some of the voted negative experiences. During RCA, theteam members first list underlying causes to ARCA-tool. Then theydiscuss the findings and try to detect deeper level causes. Correc-tive actions are developed either during or after the retrospectivesfor the selected root causes. The problem of the current practicehas been the fact that the team members have been forced to travelto the same physical location regularly, a challenge for many team

Fig. 4. The retrospective method used in the study.
T.O.A. Lehtinen et al. / Information and Software Technology 56 (2014) 408–437 415
members. In order to reduce the need for travelling, distributedretrospectives have been considered as a substitute.
We conducted our field study in the context of three teams, twodistributed development teams, and one product owner team. Inboth development teams, members include approximately fivesoftware developers (software developers and architects) and onescrum master (team leader). The work of the teams is overseenby several product owners (business and product managers). Theproduct owner team had three members, all product owners, rep-resenting the needs of customers in different countries. Each prod-uct owner is responsible for steering the customer needs to bothdevelopment teams. The knowledge sharing between the develop-ment teams and product owners occurs mainly in the sprint plan-ning sessions. It is assumed that all needed information about thecustomer needs is communicated during the sessions. However,the developers can ask for the product owners to give clarificationsto the customer needs during the sprints.
We were invited to observe the retrospectives of these threeteams. The goal of the retrospectives was to analyze why theexpectations of the product owners did not meet the output ofthe development work. The goal was defined by two softwaredevelopment managers before the retrospectives (see Section 4.2).
4.1.2. Case 2Case 2 was conducted in a medium-sized international software
product company with over 100 employees. The company productsare large and complex software systems released four times a year.The software development organization includes approximately 70people. The development work is divided into seven teams, eachincluding about ten people. The team members are geographicallydistributed over several countries in Europa and Asia.
Like Case 1, the organization follows agile software developmentpractices, based upon the Scrum methodology [22] and the teamsconduct 60 min distributed retrospectives regularly. Unlike Case1, the duration of sprints varies between two and four weeks. Addi-tionally, the retrospectives are conducted in a distributed fashionusing an online audio and video bridge. In the retrospectives, prob-lems that have occurred are discussed, and process improvementideas are developed. The teams do not use RCA in their retrospec-tives. Instead, the team members discuss positive and negativeexperiences and try to figure out how to make improvements intheir development work activities. The retrospectives are occasion-ally summarized to the company’s intranet pages. The problems ofthe current practice include informal discussions resulting in unfo-cused discussions and dominating team members who have spokenover the others. Thus, the team members have considered alterna-tive practices, which may be more feasible for their needs.
Our field study was conducted in a context of one distributedsoftware team including the development roles of scrum master,software developers, and architects. We observed a distributed ret-rospective meeting, where the team members used ARCA-tool andthe retrospective method which we introduced to them. Three prob-lems were analyzed in the retrospective. The problems were identi-fied in a separate meeting, which was conducted by the teammembers before the retrospective (see Section 4.2). The first prob-lem was lack of pair programming, which the team membersthought was not used enough. The second problem was mergingthe code between different work branches. The merge status wasunclear, additionally; merging was not done often enough. The thirdproblem was lack of collaboration with other teams in the company.
4.2. Retrospective method used in the cases
Each of the retrospectives across both cases was initiated by aseparate meeting, where a high-level target problem for each retro-spective was defined. The separate meeting lasted approximately
1 h. The meeting was conducted by the company representativeswho wanted to give a specific goal for the retrospective. In Case 1,the representatives included a product owner and scrum master.In Case 2, the representatives included the scrum master and fewsoftware developers of the team. In the meeting, the representa-tives discussed about problems that had occurred in thedevelopment work. Based on the discussion, the representativesconcluded the goal of the retrospective, i.e., to explain one (Case1) or several (Case 2) high-level problems (see Table 2). Thereafter,the retrospective was arranged. The retrospective lasted approxi-mately 1 h, and it was facilitated by a company representative. Atthe beginning of each retrospective, the facilitator briefly intro-duced the specific goal of the retrospective for the participants. InCase 2, the facilitator also shortly introduced the retrospectivemethod and ARCA-tool. The used retrospective method is summa-rized in Fig. 4. ARCA-tool was used by all participants in every stepof the retrospective. Each retrospective resulted in a cause-effectdiagram emphasizing the most important root causes.
In Case 1, three retrospectives were conducted for a single prob-lem. The first two retrospectives were conducted with each devel-opment team having participants from all different roles of thedevelopment team including the scrum master, developers, andarchitects. The third one was conducted with the product owners.The facilitator in Case 1 was the scrum master of one developmentteam. The facilitator steered the retrospectives and led the imple-mentation. The retrospectives were conducted face-to-face at thesame physical location. Each retrospective was conducted by usingthe following procedure. First, the participants were given 5 min toenter problems related to the target problem in ARCA-tool. At thisstage, all participants used their own computers. During the next15 min, each participant explained the problems entered to thetool. The other participants simultaneously commented and dis-cussed the findings. Thereafter, the participants were given 5 minto enter underlying causes that explained the detected problems.This was also done simultaneously in ARCA-tool by all participants,working on their own computers. Then, during the next 15 min,each participant explained the underlying causes entered to thetool. The other participants commented on and discussed the find-ings. They also entered additional causes discovered during thediscussion. Furthermore, they used the tool to note if some causeexplained other causes. At the end of the retrospective, the partic-ipants held a summarizing discussion about the problems andcauses entered to the tool. They also voted on the most controllablecauses by using the liking feature of the tool.
In Case 2, one retrospective was conducted and it was facilitatedby the scrum master of the team who steered the retrospective andled the implementation. The retrospective was conducted as dis-tributed with geographically dispersed participants. The partici-pants included all roles of the development team (a scrum master,

416 T.O.A. Lehtinen et al. / Information and Software Technology 56 (2014) 408–437
software developers and architects) and they used ARCA-tool todocument and share their findings about problems and relatedcauses, working on their own computers in their own locations intwo European countries. Google+ was used as an audio and videobridge. Thus, the participants were able to discuss and see eachother. The retrospective followed the same outline as the one inCase 1, see Fig. 4.
4.3. Data collection
The feedback was collected from the case participants usinginterviews and questionnaires, see Appendix B and C. Additionally,we used observations combined with video recording. The inter-views were executed by the 2nd (Case 1) and 3rd (Case 2) author.The primary author observed the interviews. He wrote notes and en-sured that the questionnaires were filled in by the case participants.Additionally, the retrospectives were video recorded. Thus, we wereable to check if something was missing during the data analysis.
A total of 16 case participants filled in the questionnaires. In addi-tion, we interviewed eight participants. Our aim was to collect feed-back about the introduced retrospective method and usefulness andease of use of ARCA-tool. In Case 1, one participant from each retro-spective was interviewed. In Case 2, we interviewed all retrospectiveparticipants. Interviews at Case 1 were conducted face-to-face,whereas the interviews at Case 2 were conducted as distributed byusing online chat for three participants and face-to-face for two par-ticipants. The chat was used in interviews, because it was easier forthe interviewees being geographically dispersed. Furthermore, inthe questionnaires, the participants of Case 1 evaluated mostly theircurrent retrospective method as the introduced retrospective meth-od was very similar with it. In contrast, in Case 2, the participantscompared the introduced retrospective method with their currentmethods being different than the introduced one. The scale in thequestionnaires was a symmetric 5-point Likert scale.
4.4. Data analysis
Both cases were analyzed separately as the questions asked inthe questionnaires and interviews varied slightly between thecases. This was due to differences in the company context. Case 1had used RCA and ARCA-tool previously while Case 2 had not. Wetranscribed and coded the interviews accordingly. We calculatedthe means, standard deviations, and medians of the questionnaires.Finally, we summarized the interviews and questionnaires in orderto conclude whether the findings were similar between the cases.
We are aware of the controversy of presenting means from aLikert scale. If the interval between the Likert scale items cannotbe presumed equal, calculating means with standard deviationsis ‘‘inappropriate’’, as stated by Jamieson [38]. In our study, theinterval between the Likert scale items can be presumed equal asthe scale was symmetric and only the extreme values had a textualrepresentation. In Case 1, the scale was: 1 = very minor, 2, 3, 4,5 = very major, and in Case 2, the scale was: 1 = very low, 2, 3, 4,5 = very high. Furthermore, mean contains more information insmall samples, such as ours, than median, e.g., three responseswith values 5, 5, and 1 give the median of 5 but mean of 3.67.The latter is closer to the ‘‘truth’’ because the opinions were highlypolarized and the median would only represent the opinion of themiddle respondent.
5. Results
In this section, we present the field study results. Feedback fromARCA-tool (see Section 3) is presented in Section 5.1 and the feed-back from the retrospective method including the RCA method (see
Section 4.2) is summarized in Section 5.2. Furthermore, Table 3summarizes the feedback from the questionnaires, and Tables 4and 5 summarize the results from the interviews. The tables sepa-rate the results regarding the research questions. While RQ1 andRQ2 aim to evaluate ARCA- tool, RQ3 evaluates the retrospectivemethod.
5.1. ARCA-tool
To summarize, our results indicate that ARCA-tool increases thecost-efficiency of retrospectives and it is perceived as essential indistributed retrospectives. Additionally, the tool is perceived easyto use and learn. Therefore, we believe that the tool supports theprocess of the retrospective method (see Section 4.2) and helpsthe participants to conduct the tasks of retrospectives.
Regarding usefulness, the participants from both cases evalu-ated in questionnaires (see Table 3) that the tool helped to detectthe causes of problems. The participants in Case 1 also evaluatedthat the retrospective would be less efficient and more difficultwithout the tool. Respectively, in Case 2, the participants evaluatedthat the cost efficiency of the retrospective increased with ARCA-tool. Furthermore, the interview results from both cases (see Ta-bles 4 and 5) indicate that the tool is essential in distributed retro-spectives. Our results from Case 1 also indicate that when theretrospective is conducted face-to-face, the tool can be substitutedwith a whiteboard and postIT notes, but in that case the analysis isnot as efficient as it is with the tool. According to the interviews atCase 2, ARCA-tool should also be improved. It was said that the toolneeds slight improvements while the detected causes are orga-nized. Some participants perceived that currently the tool doesnot support the visualization of cause groups enough. Perhaps itwould be useful to organize similar causes into the same set ofcauses to be visually represented well on the cause-effect diagram.
Regarding ease of use, the participants from both cases evaluatedin questionnaires (see Table 3) that the tool is easy to use and learn.This indicates that ARCA-tool supports the process of retrospectiveas it helps the participants to conduct the tasks of retrospectiveseasier, i.e., to detect and analyze the causes of target problems(see Table 2). In Case 1, the ease of use and learning the tool wereboth evaluated with a very high value. In Case 2, the values werealso high, but less than in Case 1. We assume that this was becausethe tool was new to the participants of Case 2. Furthermore, also theinterviews indicate that the tool is easy to use (see Tables 4 and 5).The interviews at Case 1 indicate that the tool makes it easier tovisualize the detected causes. Respectively, the participants in Case2 claimed that the user experience is ‘‘intuitive’’ and the tool is ‘‘rel-atively easy to use’’. Furthermore, regarding the results from Case 2,there is no feature overload, but all essential features are included inthe tool. It was also noted that the difficulty of analysis correlateswith the number of causes of problems. The number of detectedcauses in the retrospectives was around 20–59 (see Table 2).
5.2. The retrospective method
Considering the results from the interviews, using RCA in retro-spectives was perceived as useful in both cases. This was due to thestructured approach that the retrospective method followed andthe in-depth analysis which improved collaboration.
In Case 1, the participants said that the structured approach ofthe RCA method helped to detect the causes of problems. In Case 2,the participants said that the structured approach of the RCA meth-od resulted in deeper understanding about the causes of problemswhich makes improvement to their current practices. Consideringthe questionnaires, the participants from both cases evaluated theeasiness to collect causes and detect root causes as high (see Table

Table 3Summary of questionnaires.
Case 1 Case 2 All teamsa
(Collocated) (Distributed)
ScrumT1 (N = 3) ScrumT2 (N = 5) Product Owners (N = 3) ScrumT3 (N = 5)
�x r ~x �x r ~x �x r ~x �x r ~x N �x r ~x
RQ1 Usefulness of ARCA-toolRetrospective efficiency without the tool 1.3 0.6 1 2.2 0.8 2 1.3 0.6 1 – – – 11 1.7 0.8 2Tool’s cost efficiency compared with previous practices – – – – – – – – – 4.0 1.0 4 5 4.0 1.0 4Assistance of the tool for cause detection 4.3 0.6 4 4.2 0.8 4 4.7 0.6 5 4.0 0.7 4 16 4.3 0.7 4Ability to detect the causes without the tool 3.3 0.6 3 3.2 0.4 3 3.0 1.0 3 3.2 0.4 3 16 3.2 0.5 3Retrospective ease of use without the tool 1.7 0.6 2 1.8 0.4 2 1.0 0 1 – – – 11 1.5 0.5 2
RQ2 Ease-of-use of ARCA-toolEasiness to collect causes 3.7 0.6 4 4.2 0.4 4 4.7 0.6 5 4.0 0.7 4 16 4.1 0.6 4Easiness to detect root causes 4.0 1.0 4 3.8 0.4 4 4.3 0.6 4 3.0 0.7 3 16 3.7 0.8 4Ease of use of the tool 5.0 0 5 4.6 0.5 5 5.0 0 5 4.0 0.7 4 16 4.6 0.6 5Learnability of the tool 4.7 0.6 5 4.6 0.5 5 5.0 0 5 4.0 1.0 4 16 4.5 0.7 5
RQ3 Retrospective methodPersonal contribution 4.0 0 4 3.8 1.1 4 3.3 0.6 3 3.2 0.4 3 16 3.6 0.7 4RCA cost efficiency compared with prior practices – – – – – – – – – 4.2 0.4 4 5 4.2 0.4 4RCA ease of use compared with prior practices – – – – – – – – – 4.4 0.5 4 5 4.4 0.5 4Correctness of detected causes 4.0 0 4 4.2 0.4 4 4.0 1.0 4 3.8 0.4 4 16 4.0 0.5 4Impact of the detected causes 3.7 0.6 4 3.6 1.1 4 4.7 0.6 4 3.8 0.8 4 16 3.9 0.9 4Openness in communication 3.0 1.0 3 4.4 0.5 4 5.0 0 5 4.8 0.4 5 16 4.4 0.9 5
a N = the number of respondents, �x = mean, r = standard deviation, ~x = median, Scale: 1 = very minor/low; 2, 3, 4, 5 = very major/high.
Table 4Summary of interviews in Case 1.
Question Summary Quotes from the interviews
Would we have found the sameproblems and causeswithout the tool? (RQ1–2)
Similar causes could have been detected also by using awhiteboard, as an example. However, ARCA-tool improves theefficiency of the analysis. In geographically distributed teams,ARCA-tool is essential
‘‘We could have detected the same causes by using a whiteboard,however, ARCA-tool made the analysis easier.’’ (person 1)‘‘The required effort by using the whiteboard would be higher’’(person 1)‘‘ARCA-tool improves the visualization of the detected causes.’’(person 2)‘‘ARCA-tool spares time when documenting the results.’’ (person 2)‘‘ARCA-tool is essential when some participants are geographicallydispersed.’’ (person 1)
Did this retrospective methodhelp us to find the causes ofthe problems? (RQ2–3)
The key to finding the causes was the RCA method. ARCA-toolhelped to visualize the causes of the problem. However, the toolitself was not perceived as the key to success
‘‘The RCA method helped to found these causes. ARCA-tool itself isnot the key to success, but the structured approach of the RCAmethod is.’’ (person 1)‘‘The tool made it easy to see the big picture related to the problemcauses. Each team member was additionally able to see what theother participants have detected.’’ (person 2)
Do you think that we found themost critical problems?(RQ3)
The most critical causes of the target problem were found ‘‘We did find the most important root causes’’ (person 1)‘‘We did find the most critical problems’’ (person 2)‘‘I think that we found most of the causes.’’ (person 3)
T.O.A. Lehtinen et al. / Information and Software Technology 56 (2014) 408–437 417
3). Furthermore, they evaluated that the correctness and impact ofthe detected causes was high.
The participants of Case 2 perceived that the RCA method im-proved collaboration. Additionally, they said that the RCA methodis easy to use and learn. They explained that the method is basedon ‘‘an intuitive and simple idea’’. The results from questionnairesare in line with these results. The openness in communication wasevaluated with high values in both cases (see Table 3). Additionally,the participants evaluated their personal contribution with highvalues.
6. Discussion
In this section, we answer the research questions and discussour findings and possible threats to the validity of this study.
6.1. Answering the research questions
RQ1: Is ARCA-tool perceived as useful in the distributed retrospec-tives of agile software teams? In Case 1, ARCA-tool had already been
found to be useful in collocated retrospectives. The tool was new tothe participants of Case 2, but they were experienced in conductingdistributed retrospectives. In order to answer this research ques-tion, we use the results from Case 2 and compare them to Case1. Regarding ARCA-tool we claim the following:
� The tool enables the team members to contribute to the retro-spective simultaneously. This improves the communication asthe team members can write simultaneously while speakingsimultaneously is not possible. This also reduces the risk thatthe participants forget some important comments if they arenot written down.� The cause-effect diagram structure provided by ARCA-tool
improves the way the findings are visualized. This encouragesthe team members to consider the findings in-depth, as pro-posed in Case 2 (see Table 5).
Our results support these claims. In both cases, the tool wasevaluated as efficient (see Table 3), but in the distributed retro-spective of Case 2 (see Table 5), the tool was characterized as

Table 5Summary of interviews in Case 2.
Question Summary Quotes from the interviews
In contrast to the company practices used to detectthe causes of problems, do you consider ARCA-tool as useful? (RQ1)
ARCA-tool improves the company practices. The toolimproves the analysis of the causes of problems and theirrelationships. Additionally, the tool is perceived as enjoyable
‘‘It works!’’ (person 4)‘‘The tool improves understanding about the causalrelationships between the problems, which Iconsider as useful.’’ (person 5)‘‘I found it very useful �and� fun to do. It certainly isa better practice than having an online videomeeting like we had in the past.’’ (person 6)‘‘The tool challenges the participants to consider thecauses of problems deeper.’’ (person 7)
Do you consider ARCA-tool as cost efficient whencompared with RCA which is conducted by usingpostIT notes or Google Docs drawings? (RQ1)
ARCA-tool works well with distributed teams. This isbecause of the online automation and features supportingorganizing the causes easily. In contrast to Google Docsdrawings, the tool should support the grouping of causes
‘‘In our case, the postIT notes do not work at all.This is because of the distributed team members.’’(person 4)‘‘In Google Docs drawings, a lot of time is spent toorganize the causes and their relationships’’(person 7)‘‘Grouping the detected causes with ARCA-tool iscurrently difficult.’’ (person 8)
Do you consider ARCA-tool as easy to use whencompared with RCA which is conducted by usingpostIT notes or Google Docs drawings? (RQ2)
ARCA-tool is learnable and intuitive. There is no featureoverload either. The layout automation improves usability.On the other hand, when the number of causes increases, thedifficulty of the analysis increases
‘‘The tool is relatively easy to use and much moreflexible than RCA which is conducted by using thepostIT notes.’’ (person 4)‘‘The user experience was intuitive.’’ (person 5)‘‘Layout automation is good.’’ (person 7)‘‘Outlining a high number of causes is somewhatdifficult.’’ (person 8)
In contrast to our process improvement practices,do you consider the RCA method as easy to use?(RQ3)
The RCA method fits the retrospectives well. It is learnable,simple, intuitive, and formal
‘‘After little practice it definitely helps us to improvethe efficiency of the work.’’ (person 4)‘‘The RCA method is not difficult to use.’’ (person 7)‘‘It is based on intuitive and simple idea’’ (person 5)‘‘Yes, because the RCA method is structural andstraight forward’’ (person 8)
In contrast to our process improvement practices,do you consider the RCA method as costefficient? (RQ3)
The RCA method improves current practices by providingdeeper analysis with its structural approach. It also improvesthe collaboration and conceptualization related to the causesof problems
‘‘The RCA method works.’’ (person 4)‘‘I think that the visualization of the causes isimportant.’’ (person 4)‘‘The method improved the discussions and helpedto consider the problem more deeply.’’ (person 5)
418 T.O.A. Lehtinen et al. / Information and Software Technology 56 (2014) 408–437
essential. Similar comments about distributed retrospectives werealso given in the interviews with the participants of Case 1. In Case1, ARCA-tool was used previously and the participants perceivedthat they would like to use the tool in their upcoming retrospec-tives too. Obviously, the tool was found to be useful in face-to-faceretrospectives. A comparison of the results from Case 2 to Case 1indicates that ARCA-tool is also useful in distributed retrospectives.In the distributed retrospective of Case 2, the tool was perceived asuseful when it was compared with the current practices (see Table3). Thus, regarding Case 2, ARCA-tool improves distributed retro-spectives where only audio and video bridges are used (see Section4.1.2).
Furthermore, in collocated retrospectives of Case 1, the partici-pants proposed that the tool made it possible to note what theother participants have found (see Table 4). It was also perceivedthat the visualization of the causes helped to outline the detectedcauses. In the distributed retrospective of Case 2, the participantsperceived that the visualization of the detected causes is importantand the tool helped to organize them (see Table 5). It was alsoclaimed that the tool improved the analysis of the causes of prob-lems and their relationships (see Table 5), probably one of the mainadvantages of RCA.
To summarize, it seems that ARCA-tool is perceived useful insynchronous distributed retrospectives of small agile softwareteams. Probably we still need to continue its development by mak-ing slight improvements to it (see Section 5.1). However, the toolimproves the contribution of participants and challenges them toconsider the findings in-depth.
RQ2: Is ARCA-tool perceived as easy to use in the distributed retro-spectives of agile software teams? Considering the ease of use, ARCA-
tool was designed to be used in distributed retrospectives [8].Additionally, we required that it enables conducting RCA [9]. Ouraim was not to develop software supporting all kinds of differentmodeling needs, e.g., making complex software models [30]. In-stead, we wanted to make a lightweight tool which is simple andeasy to use in a small group of individuals, i.e., less than ten partic-ipants use the tool in a synchronous retrospective collaboratively,as introduced in [9].
ARCA-tool was perceived as easy to use in both cases. The num-ber of participants was between three and five. In the collocatedretrospectives of Case 1, the participants perceived that the toolmade the analysis easier (see Table 4). In the distributed retrospec-tive of Case 2, the participants perceived that the tool is learnableand intuitive (see Table 5). They also appreciated that only the nec-essary features are included in the tool. Additionally, it was notedin Case 2 that the way the tool automates the cause-and-effectstructure improves its usability. Additionally, in the question-naires, the participants from both cases evaluated the ease of useand learnability of the tool as high (see Table 3). It seems thatthe participants of Case 1 evaluated the ease of use and learnabilitywith higher values than in Case 2. It is possible that this was due tothe fact that the tool was new to the participants of Case 2,whereas the participants of Case 1 were already familiar with it.It is also possible that in distributed retrospectives, the perceivedease of use decreases. The participants are geographically dis-persed, and therefore, asking assistance from others becomes moredifficult. However, we did not observe such problems in the dis-tributed retrospective of Case 2.
To summarize, it seems that using ARCA-tool in distributed ret-rospectives does not make a major difference to its ease-of-use in

T.O.A. Lehtinen et al. / Information and Software Technology 56 (2014) 408–437 419
collocated retrospectives. The participants learn using the toolwith a short introduction, and during the distributed retrospectivethey perceive that it is easy to use.
RQ3: Is RCA perceived as a good approach to use in the distributedretrospectives of agile software teams? Both cases resulted in a sim-ilar finding. RCA was perceived as a good approach for retrospec-tives. This conclusion is well in line with prior studies. Problemprevention requires controlling the causes that create the problem.RCA makes it possible to detect the causes of the problem system-atically and in-depth. In retrospectives [5,28], also with distributedsettings, RCA helps the team members to consider the causes oftheir problems. This is important in order to make improvementsin the team.
Case 1 has used RCA previously, which indicates that the caseorganization have already found such an approach as useful in col-located retrospectives. Instead, the RCA approach was new to theparticipants of Case 2, but they were experienced with distributedretrospectives. In order to answer this research question, we usethe results from Case 2 and compare them with Case 1.
Regarding the interviews at Case 1, the key for finding thecauses was the RCA method (see Table 4). The participants of Case1 also perceived that the most critical causes of the target problemwere found. Thus, the outcome of RCA was perceived accurate anduseful in the collocated retrospectives of Case 1. Similarly, it wasproposed in Case 2 that the structural approach of RCA improvestheir current practices by providing in-depth analysis. It was alsonoted that the RCA method improves the collaboration and con-ceptualization of the causes of problems. The participants of Case2 also evaluated in the questionnaires that the detected causeswere correct and their impact was ‘‘high’’ (see Table 3). Addition-ally, the participants of Case 2 evaluated that in contrast to theircurrent practices the RCA approach is cost-efficient and easy touse (see Table 3).
The core of RCA is the cause-effect diagram. Retrospectivesusing discussions only are concerned with the problem of it beingdifficult to remember all relevant findings and outline the findingsas a whole. Level of detail and the coverage of the discussions aredependent on human memory. Retrospectives using RCA do notsuffer the memory problem as the cause-effect diagram keepsthe attention on relevant causes, but simultaneously helps theteam members to remember the findings as they are registeredto the diagram. In synchronous distributed retrospectives, thismeans that the cause-effect diagram has to be simultaneouslyreachable by all distributed team members. Otherwise conductingcollaborative RCA would likely be difficult. In the distributed retro-spective of Case 2, the RCA method was characterized as learnable,simple, intuitive, and straightforward (see Table 5). The resultsfrom the questionnaires are in line with the results from the inter-views. The participants evaluated that the retrospective methodhelped to detect the causes of the target problems (see Table 3).
The retrospectives of Case 1 were collocated and the retrospec-tive of Case 2 was distributed. In both cases, ARCA-tool made thecause-effect diagram reachable for all participants. RCA workedwell in the collocated retrospective of Case 1 and in the distributedretrospective of Case 2. There were no major differences in theevaluations of the case participants between the cases either. Theempirical results from Case 2 are very similar with the results fromCase 1. Thus, to summarize, we conclude that the RCA worked wellin the synchronous distributed retrospective of Case 2. However, itrequired the tool for collaborative cause-effect diagramming.
6.2. Comparison to prior studies
Regarding the scrum methodology [22], retrospectives are valu-able and they should be conducted at the end of iterations. Our re-
sults are in line with this claim as both of our cases have usedretrospectives accordingly and found them useful. Furthermore,the prior studies [5,28] introduce RCA as a part of retrospectives.Our results consolidate the prior studies by indicating that RCA isan important part of the retrospectives of small agile teams. Theretrospective method used in this study is similar to the priormethod called ‘‘postmortem review’’ [4] that also includes the stepof RCA. Such method has been introduced as lightweight and use-ful for small software teams [5]. Respectively, Case 1 has used themethod previously and found it useful. Furthermore, consideringCase 2, their prior practices did not include RCA. They discussedpositive and negative experiences and they tried to figure outhow to make improvements in their development work activities,as recommended in the scrum methodology [22]. However, theydid not create cause-effect diagrams or otherwise registered thecausal structures of problems. The problems of the prior practicesincluded informal discussions resulting in unfocused discussionsand dominating team members who spoke over the others. WhenRCA was used in their distributed retrospective (see Section 4.2),the participants perceived that the method was better than theircurrent practices.
Prior work has also been conducted in the area of Group Sup-port System (GSS). GSSs are systems whose main aim is to helpindividuals to arrive at correct decision in meetings effectively.GSS systems, such as one presented in [39], include features fromthree dimensions: (1) ‘‘communication support,’’ (2) ‘‘processstructuring’’ and (3) ‘‘information processing’’ [40]. The featuresof communication support help in the information exchange be-tween the participants [40]. The features of process structuringkeep the meeting progressing according to the agenda [40]. Fur-thermore, the features of information processing provide accessto important information, and enable sharing, aggregating, struc-turing, and evaluating the information [40].
The retrospective method together with ARCA-tool fulfills thethree dimensions of GSS. Regarding the usefulness and ease-of-use of ARCA-tool, we hypothesize that the tool provides ‘‘commu-nication support’’ [40], especially in distributed retrospectives. Thetool improves the information exchange around the problems andtheir causes. Additionally, the tool includes the features of the par-allel communication, the anonymity of participants, and ‘‘groupmemory’’ [41]. Although our tool does not provide access to inter-nal or external databases, the tool does makes it possible to modelthe important knowledge of participants through cause-effect dia-grams, voting, cause classifications, and corrective actions. There-fore, we see that the tool also provides features for ‘‘informationprocessing’’ [40]. Finally, we hypothesize that the retrospectivemethod provides ‘‘process structure’’ [41] as it includes the rulesfor communication and process steps that are steered by a facilita-tor. ARCA-tool also records a cause-effect diagram that is a partialrecord of the meeting interaction and part of process support.
The prior approach for distributed retrospectives [8], using acombination of emails, spreadsheets, and an audio bridge, doesnot provide anonymity or parallel information exchange. Sendingemails between the participants is not an anonymous approachto exchange information. Furthermore, using spreadsheets doesnot provide parallel contribution to the outcome of retrospective.All individual spreadsheets need to be combined together. Addi-tionally, describing and analyzing cause-effect relationships withspreadsheets is difficult [9]. Therefore, the distributed retrospec-tives also require collaborative cause-effect diagrams. Thus, weconclude that the retrospective method combined with ARCA-toolmakes an improvement to the approach introduced in the priorwork [8]. RCA is an important part of retrospectives and ARCA-toolimproves them by providing communication support and informa-tion processing.

420 T.O.A. Lehtinen et al. / Information and Software Technology 56 (2014) 408–437
6.3. Evaluation of the research
This section discusses the validity of our empirical results usinga validation scheme presented by [42]. Furthermore, as our resultsare based on the social construction of case companies, we will alsouse the evaluation principles of Interpretive Field Studies [43] inthe validation scheme.
6.3.1. Construct validityConstruct validity reflects the extent to which the studied oper-
ational measures represent what is investigated according to theresearch questions [42]. The participants represented expertswhile considering the current practices used in the retrospectivesof their teams. Thus, we believe that they were able to comparethe introduced retrospective method with their current practices.Additionally, the participants covered most of the organizationmembers, i.e., the organization members of Case 1 and the teammembers of Case 2. Therefore, we believe that the research datawas not biased by a homogenous group of individuals. Instead, var-ious interpretations about the RCA approach and ARCA-tool werecaptured. This enabled us to draw out multiple interpretationsabout the study results, an important aspect for validity introducedin [43]. Using interviews and questionnaires were therefore rea-sonable data collection methods, which increases the constructvalidity [42]. However, our results are not based on the comparisonof the outputs between the previous and the introduced retrospec-tive method, as such information was not available for our pur-poses. Thus, even though the feedback from all case participantswas highly positive, it should be noted that these evaluations arebased on perceptions.
Separating the effect of RCA from the use of ARCA-tool was alsodifficult. In the interviews with both cases and in the questionnaireof Case 2, we asked the participants to evaluate the tool and RCAapproach separately. Instead, the questionnaire used in Case 1asked the participants to evaluate ARCA-tool and the output ofRCA thoroughly, but there were no questions about the RCA ap-proach itself. Thus, in Case 1, separating the evaluations of the toolfrom the evaluations of the RCA approach was difficult. It wasbased on the interviews only. Therefore, regarding the RCA ap-proach, we were not able to compare the questionnaire results be-tween the cases.
6.3.2. External validityExternal validity is concerned with whether it is possible to
generalize the findings of the study and to what extent they canbe generalized [42]. ‘‘Contextualization’’ has been presented asan important principle for generalizing the study results [43]. Bothcases varied and thus they evaluated RCA and ARCA-tool fromslightly different perspectives. This increases the external validity[42]. The participants of Case 1 were experienced with the usedretrospective method and ARCA-tool, but inexperienced on usingit in a geographically distributed setting. Instead, the participantsof Case 2 were experienced on conducting retrospectives in a geo-graphically distributed setting, but inexperienced in using the ret-rospective method and ARCA-tool. The feedback from both cases,however, was very similar. Naturally, the evaluations of the caseparticipants reflected the advances of the introduced retrospectivemethod in comparison with the current practices. If the companieswould have previously used the existing RCA software tools, per-haps, the feedback of ARCA-tool would have been different.
Furthermore, we had only two cases in which one fully investi-gated the intended research questions. All of the retrospectiveswere conducted at the team level and the number of case partici-pants in each retrospective was between three and five. Four teamswere studied. DeSanctis and Gallupe [44] present in the study ofgroup decision support systems that the ‘‘nature of technological
support’’ is dependent on three important aspects: ‘‘group size,’’‘‘membership proximity,’’ and ‘‘the task confronting the group’’.Our case contexts included only small groups, but the memberproximity covered both extremes ‘‘face-to-face’’ and ‘‘dispersed’’settings [44]. Furthermore, the tasks the groups confronted in-cluded analyses of problems faced at the agile software develop-ment organizations and teams. Thus, we cannot generalize ourfindings to organization wide distributed heavy-weight retrospec-tives using different RCA methods [9] and a higher number of par-ticipants. We can only conclude that our results are likely valid insimilar case contexts to ours, i.e., geographically dispersed smallagile software teams using retrospectives regularly in order to cre-ate continuous learning and improvements (see Section 4.1).
We cannot conclude that the distributed retrospectives canfully substitute the face-to-face retrospectives either. Buildingtrust in global software teams is crucial for success, which requiresfrequent communication, face-to-face meetings, and socialization[45]. The tool support for distributed retrospectives likely enablesconducting retrospectives more frequently, which we assumewould improve the communication. However, if the team mem-bers communicate on distributed settings only, then the risk fordecreased information exchange and feedback increases [45].
Finally, considering the uniqueness of ARCA-tool, the evaluationof the prior RCA tools in Section 2.3 was not complete due to anexcessive number of hits to our search strings in Google. However,we used five additional data sources. We studied all the tools listedin the two websites of ‘‘useful RCA tools’’. Additionally, wesearched for RCA tools in Sourceforge.com, but did not find anytools suitable for doing RCA. Finally, we searched for RCA tools inGoogle Scholar and Scopus. The data from these six sources re-sulted in 35 RCA tools that we compared with our ARCA-tool. Incontrast to ARCA-tool, none of the other tools matched all the se-ven aspects used in our comparison. However, it is still possiblethat a similar tool to our ARCA-tool exists. Nevertheless, accordingto the authors’ best knowledge our comparison of 35 RCA softwaretools is the largest one existing.
6.3.3. ReliabilityReliability is concerned with the extent to which data and anal-
ysis are dependent on a specific researcher [42]. Klein and Myers[43] state that the social tie between the researchers and partici-pants should be critically reflected in order to evaluate the validityof results. The retrospectives were conducted by the employees ofthe companies. Thus, it is possible that the case participants over-stated the goodness of the retrospective method in the question-naires and interviews as they conducted the method bythemselves. It is also possible that the social tie between theresearchers and participants biased the results. We controlled thisrisk by using triangulation in data collection [46] through observa-tions, video recording, questionnaires, and interviews which in-creases the reliability of our results. In the observations, we didnot note any practical issues during the retrospectives. Addition-ally, our observations indicate that the case participants truly likedthe used retrospective method.
Furthermore, considering the data analysis, there is a slight riskfor researcher bias which is a common problem in qualitative dataanalysis. While the number of interviews increases, summarizingthe results becomes challenging as people answer the same ques-tions differently. We controlled this risk by using questionnaires.Similar responses from the questionnaire forms make it unlikelythat researcher bias would have had large effect on the qualitativeresults. Additionally, our conclusions were based on both (1) theanalysis of individual parts of research data and (2) the analysisof all research data combined together, the key principle in Inter-pretive Field Research, called ‘‘Hermeneutic Circle’’ [43]. Our con-clusions are also in line with prior literature (see Section 2.1).

From
- Au
thor
Goo
gle�
,O
pen
-tu
be&
Roo
tC
ause
Live
onne
xtpa
ge)
T.O.A. Lehtinen et al. / Information and Software Technology 56 (2014) 408–437 421
The approach of RCA has already been introduced as valuable forretrospectives [5,28]. The prior literature did not ‘‘tell the story be-hind our results’’, a threat to validity introduced in [43], but consol-idate our findings. Our conclusions are explicitly derived from theresults (see Section 5), as can be seen in Section 6.1.
nd
ixA
.Raw
dat
ao
fR
CA
too
lco
mp
aris
on
twar
eC
lien
t:n
ativ
e/br
owse
rR
eal-
tim
eco
llab
orat
ion
Cau
se-e
ffec
tdi
agra
mId
eade
velo
pmen
tV
otin
gK
now
ledg
em
anag
emen
tC
osts
CA
tool
Bro
wse
rY
esY
es,g
raph
Yes
Yes
Yes
Free
(MIT
)ca
.sob
erit
.hu
t.fi
ogle
Doc
sD
raw
ing
Bro
wse
rY
esY
es,g
raph
Yes
Yes
No
Free
tou
seve
.goo
gle.
com
Var
iou
sdr
awin
gca
pabi
liti
esar
epr
ovid
ed,e
.g.,
shap
esw
ith
text
and
arro
ws.
Thes
eca
nbe
use
dto
crea
tea
CED
grap
h.
By
usi
ng
diff
eren
tsh
apes
for
cau
ses
and
idea
s.
By
usi
ng
shap
esw
ith
nu
mbe
rs.
Roo
TEn
terp
rice
ed.
Bot
h(Y
es)
Yes
,tre
eY
esN
oY
esFe
e (con
tinu
ed
7. Conclusions and future work
This paper proposed a real-time cloud-based tool for solving theproblem of being infeasible to conduct collocated retrospectives ingeographically distributed software teams [8]. ARCA-tool enablesconducting collocated and distributed retrospectives with RCA.The most important feature of the tool is the up-to-date real-timeview of the retrospective outcome. Additionally, the tool providesfeatures for the co-creation of cause-effect diagrams, the develop-ment of improvement ideas, the voting of the causes and improve-ment ideas, and support for organizational learning by allowingthe data exploration of past retrospectives. Finally, our analysisof 35 prior RCA tools showed that none of the prior tools had allthe main features of our ARCA-tool (see Section 2.3).
We evaluated the tool and RCA approach in industrial fieldstudies with four different teams in two different software compa-nies. Although our field study context differed (See Section 4.1), theresults are remarkably similar in both contexts. The results indi-cate that using ARCA-tool in the synchronous collocated and dis-tributed retrospectives of small agile software teams is usefuland easy. The tool was perceived as useful and highly easy to useand learn. It was claimed that the tool increases the efficiency ofretrospectives and helps to visualize the causes of problems. Addi-tionally, the field study evaluated the use of RCA in synchronousdistributed retrospectives. RCA was perceived as highly useful be-cause of its structural approach, which improves collaboration andprovides deeper analysis challenging the team members to con-sider the problems in-depth.
After this case study was conducted, both case organizationshave continued using the RCA approach with ARCA-tool in theirretrospectives. In addition, Case 1 substituted all of their collocatedretrospectives with distributed retrospectives. In the future, we areplanning to continue the development and evaluation of ARCA-tooland RCA as other companies have also expressed interest in them.During the first year after the release, ARCA-tool website6 has hadover 63,000 page views with 1357 unique visitors (63.5% are return-ing visitors) with an average visiting time of slightly less than 8 min.Our motivation for the development of ARCA-tool was academic, i.e.,to develop and evaluate an open source solution, which is freelyavailable for anyone who needs it. Obviously, ARCA-tool also hasbusiness potential through SAAS business models. However, repli-cating studies are needed. The tool and the RCA method should beevaluated with different case contexts including larger group sizesand various target problems. Prior literature on group decision sup-port systems [40,41,44] could help to evaluate the tool from variousimportant aspects. ARCA-tool was published under MIT license in or-der to enable replication studies and future business applications ofthe tool in a range of settings.
Acknowledgements
The authors would like to thank the companies participating inthe field studies and software engineering students implementingARCA-tool, in alphabetical order: Helin Anssi Matti, Hovi Roope,Jaanto Jari, Kekäle Mika, Kere Markus, Koistinen Joona, LaukkanenEero, Patana Jussi, Rihtniemi Pekka, Saarinen Jerome, SeveniusToni, Valjus Mikko, and Viitanen Jonne.
Ap
pe
Sof
AR
wir
Go
dri
Tap
6 http://wirca.soberit.hut.fi/.

Appendix A. (continued)
Software Client: native/browser Real-timecollaboration
Cause-effectdiagram
Idea development Voting Knowledgemanagement
Costs From
www.taproot.com Native software + IE7support (if activeXcomponents)
Likely not real-time,but accessible andeditable.
‘‘report incidents,analyze rootcauses, developcorrective actions,write and approvereports, track fixes,validate theeffectiveness of thefixes, and trendperformance’’
‘‘collaboration ofmultiple investigatorsat separate locationsover the net’’ AND‘‘the user has access toedit or view all Audit/Investigation data aswell as the ability tostatus CorrectiveActions. When anAudit/Investigation iscreated or edited theuser is provided the 7-Step Process Flowwhere the progress ofthe audit/investigationcan be tracked andeach technique can beviewed and edited’’
REASON Browser No No Yes No Yes Fee Google�#,Open-tube &RootCauseLive,Scopus
www.rootcause.com ‘‘reason 9 is an onlinebased software’’ AND
Individual investigator. Timeline isused instead.The wholeprocessresulting to theissue ismodeled. Manytimelines canbe created. The
‘‘preserve andcommunicate theknowledgelearned’’
422T.O
.A.Lehtinen
etal./Inform
ationand
Software
Technology56
(2014)408–
437

timelines resultto a causalmodel which isa tree of causesautomaticallycreated.
http://adsabs.harvard.edu/full/2002ESASP.486.369V
‘‘the software runs in aweb browser’’
‘‘enables you tomanage and trackyour correctiveaction plans andcommunicates thelessons learnedfrom your problemsolving activities’’
XFRACAS Browser (Yes) No Yes NO Yes Fee Open-tube &RootCause Live
www.reliasoft.com/xfracas/ ‘‘The system’s Web-based user interfaceallows for easy access,collaboration anddeployment throughoutmultiple sites, suppliersand dealers.’’
Support for real-timesystem is not explicitlyindicated, however,people can access tothe analysis fromvarious computers.
Trees or graphsare notprovided.‘‘XFRACASallows you to‘‘categorize theincident withthe Function >Failure > Effect> Cause thatwill ‘‘map’’ theevent to a newor existingFMEA’’
‘‘analysis andcorrective actionsoftware’’ AND
‘‘build a‘‘knowledge base’’of lessons learnedthat will beinstrumental tofuturetroubleshootingand developmentefforts’’
‘‘configureXFRACAS tosupport anyproblem resolutionmethodology, from4 to 8 steps, such asthe four step DCOVprocess, the fivestep Six SigmaDMAIC process orthe eight step 8D.’’
RCAT Software ? ? Yes, tree ? ? Yes ? Open-tube
(continued on next page)
T.O.A
.Lehtinenet
al./Information
andSoftw
areTechnology
56(2014)
408–437
423

Appendix A. (continued)
Software Client: native/browser Real-timecollaboration
Cause-effectdiagram
Idea development Voting Knowledgemanagement
Costs From
nsc.nasa.gov/RCAT/ ‘‘Create andedit a fault tree,Create and editan event andcausal factortree’’
‘‘perform anddocument rootcause analysis,identify correctiveactions, performtrending, andgenerate datausable in precursoranalysis andprobabilistic riskassessment’’
‘‘availablefree togovernmentAgenciesandcontractors’’
PathMaker Native YES Yes, tree‘‘PathMaker’scause andeffect diagram,or Ishikawadiagram toolhelps usersdiscover theroot causes ofproblems.’’
Yes No Yes Fee Open-tube &RootCause Live
www.pathmaker.com/pathmaker/pathhome.asp
The tool is nativesoftware, which requiresinstallation for each PC.
‘‘use the open flooroption to allow anyoneusing the samePathMaker project asyou to enter their ideaswith yours in realtime’’ AND ‘‘ This tool’sdesign, based on theclassic brainstormingmethod.., allows theteam recorder to keeppace with groupthinking. ‘‘
Ideas can beentered to the tool.
‘‘We usePathMaker for ourProcessImprovementProgram and haveimplemented anSPC programwhich has reducedour process cycletimes by 25-50%.Also use for ourorganizationalStrategic Planningprocess.’’ - JohnHeinrich
RealityCharting (Cause link) Native No Yes, tree Yes ‘‘identifyeffective solutions’’
No Yes Fee Google�#& Open-tube
www.sologic.com/rca-products-services/charting-software
Web-browser basedapplication only forreports. Native softwarefor analysis.
You need to share youranalysis by exporting afile. Manual updatingis required. Users needto click a button torefresh the content.
At the clientsoftware, a treediagram can becreated.
Solutions can beentered to the treediagram whichembeds the ideasin the causes.
‘‘Store RCAs anddata. Maintaincausalrelationships.Knowledgemanagement’’
424T.O
.A.Lehtinen
etal./Inform
ationand
Software
Technology56
(2014)408–
437

CED can be createdonly at the clientsoftware.
Solve ? ? Yes, tree ? ? ? ? Open-tube &RootCause Live
Gpw Computer Consulting, Inc.www.gpwcomputerconsulting.com/
solverootcauseanalysis.htmThe found link to the page does not
work.Additionally, the tool cannot be
found from Google.
SIM� software (tripod beta) Native (Yes) Yes, tree Yes ? Yes Fee Open-tube &RootCause Live
www.advisafe.com/software/incident-management/simr-simple-incident-analysis-method
‘‘incident analysis reportis automaticallygenerated by the SIM�
software, which can befurther edited in MS-Word’’
Support for real-timesystem is not explicitlyindicated. ‘‘theincident will beanalysed by the peoplewithin the departmentin which the incidenttook place’’
‘‘The programwill ask you toindicate whythe event couldtake place.After that, thesame questionwill berepeated 4more times, sothat theanalysis treecan indicate 5layers ofcausation.’’
‘‘The correctiveactions are aunique part of theSIM� analysis.’’
Provides a reportwhich can befurther edited inMS-Word.
PROACT Native (Yes) Yes, tree (Yes) ? Yes Fee Google�#,Open-tube &RootCause Live
www.reliability.com/industry/proact_templates.html
Native client installationis required.
Real-time capabilitiesare not explicitlystated. However, itseems that the toolprovides some teamwork features throughsharing andpermissions.
‘‘PROACT� RCAprovides the toolsfor the RCA analystto easily document,validate, report andtrack findings andrecommendations.’’
‘‘PROACTautomaticallybuilds yourknowledgemanagementdatabase ofcompletedanalyses creating
(continued on next page)
T.O.A
.Lehtinenet
al./Information
andSoftw
areTechnology
56(2014)
408–437
425

Appendix A. (continued)
Software Client: native/browser Real-timecollaboration
Cause-effectdiagram
Idea development Voting Knowledgemanagement
Costs From
your owncustomized andinterchangeabletemplates forfuture incidentinvestigations.’’
‘‘Robust Root CauseAnalysis Process forCollaboration,Trending, Streamlining& Standardization ofAnalyses’’ AND ‘‘TeamPermissions - Access,Read-Only, Delete’’
Investigation Catalyst Native No No (No) No No Free (GPL) Open-tube &RootCause Live
code.google.com/p/meslib/source/checkout
Native client Installationis required. The softwareworks only on mac.However, data entriescan be made with web-browsers. This requiresusing third partyservices. The entriesneed to be imported tothe system.
‘‘To use computers forremote data entry withWeb Browsers oncomputers withWindows, Linux orMac operatingsystems, contactStarline to set up aprivate server URL foryour password-protected project filesand designate an e-mail account to whichdata entered remotelywill be forwarded forimporting into Macproject work files.’’
MES worksheetmatrixes areused instead.
The system isintroduced as asolution foranalyzingproblems. This inturn helps to makeimprovements.However, makingthe improvementsis not introduced asa part of thesystem.
Single case reportsare provided,however, youcannot combinemany reportstogether.
‘‘A majordifferencebetween theMESinvestigationsystem andcurrent
426T.O
.A.Lehtinen
etal./Inform
ationand
Software
Technology56
(2014)408–
437

investigationparadigms isthat MES uses a‘‘process’’model ofphenomena,instead of a‘‘causation’’model.’’
Blackbox (tripod beta) Native ? Yes, tree (Yes) ? Yes Fee Google#& Open-tube�
www.advisafe.com/software/incident-management/blackbox
Native client installationis required.
Not explicitlystated.
Provides a reportincludingrecommendationsand causesdetected.
‘‘Blackboxautomaticallycreates a clear andstandardizedreport, including anincident report, acause tree andrecommendations’’
Investigator 3 (tripod beta) Native ? Yes, tree Yes ? Yes Fee Google#& Open-tube
http://www.advisafe.com/software/incident-management/investigator-3
Native client installationis required.
‘‘Investigator 3supports all thestages of theincidentinvestigationprocess, frominitially identifyingwhat happened,through theanalysis processand to writing therecommendations.’’
‘‘Investigator 3supports aperfectly editablenative Wordexport to makeyour report meetyour organizationsstandards.’’
Track (tripod beta) Native No No No No Yes Fee Open-tube
(continued on next page)
T.O.A
.Lehtinenet
al./Information
andSoftw
areTechnology
56(2014)
408–437
427

Appendix A. (continued)
Software Client: native/browser Real-timecollaboration
Cause-effectdiagram
Idea development Voting Knowledgemanagement
Costs From
www.advisafe.com/software/incident-management/track
Native client installationis required.
The tool isbased onquestionnairesaboutincidents.Questionnairesare followedwith ‘‘itfollows’’questions.
The softwareoutputs a trackincident reportwhich includes thedistributions ofcause types andactual causesorganized as astructural list.
Web-based Quality ManagementTool
Browser (works only inIE 6 or higher)
Yes No Yes No Yes Fee Google�#
www.qitconsulting.com/CorrectiveAction.htm
‘‘A web-based qualitysystem forManufacturing,Automotive, OEM/ODM,Food and Drug, andService industries’’
‘‘Collaboratingsuppliers,departments, anddivisions in globalscale’’ AND
Forms toconduct RCAare provided.The causes arenot organizeras CED.
‘‘Sharing andmonitoringimprovementactivities’’
‘‘Managing ALLtypes of corrective/preventive actionsand monitor actionprogress online’’
‘‘Real-time corrective/preventive trackingand reporting’’
RealityCharting� Software Both Yes Tree Yes Yes Yes Fee Google�#,Open-tube &RootCause Live
www.realitycharting.com/software
(Internet Explorer 7+standalone client formac and Windows)
‘‘The Track Changestool allows groups ofpeople to worktogether and shareconstructive inputwith the visiblenotification of anyaddition, deletion,reposition, or textchange of a cause.’’
‘‘The solutiongeneration processsystematicallymoves from causeto cause allowingyou to proposesolutions until eachcause has beenreviewed.’’
‘‘Theassessmentevaluateseach solutionagainst the 5defaultcriteria. Tochange adefaultcriteriasetting, selectthe relatedfield and typein your owncriteriaentry.’’
‘‘The Action ItemReport storesautomaticallygenerated actionitems fromevidence fields andcause pathendings.’’
ABS Consulting Root Cause Map™ ? Yes ? Yes ? Yes Fee Google�#& RootCause Live
428T.O
.A.Lehtinen
etal./Inform
ationand
Software
Technology56
(2014)408–
437

www.absconsulting.com/root-cause-analysis/root-cause-analysis-software.cfm
‘‘The web-basedsystem is designed tocapture, analyze andreport all adverseimpacts to yourorganization.’’ AND
‘‘CorrectiveActions/PreventiveActions (CAPA)Management’’
‘‘Centralizedsystem (multiplelanguagesupport)—Onelocation for allincidents, events,investigations,recommendations,root causes andaction items’’ AND
‘‘Real-time reportingand managementdashboards’’
‘‘Flexibleclassificationsystem—OSHA, EU,ABS Consulting orany otherstandards’’
ROOT-CAUSE-ANALYSIS-SOFTWARE5.1
Native No Tree No No No Fee Google�#
www.sqaki.com/17/ROOT-CAUSE-ANALYSIS/
Native client installationis required.
ThinkReliability Excel Template Native No Tree Yes No No Free (MSExcel)
Google�#
www.thinkreliability.com/excel-tools.aspx
MS Excel is required inorder to run thistemplate.
This is an excel sheetonly. Furthermore, itdoes not work inGoogle Drive and thusreal-time collaborationis not an option.
Enablon IMS ? ? Tree Yes ? Yes Fee Google�#www.enablon.com ‘‘Creation of
corrective andpreventive actionplans’’
‘‘Enablon IMSmeets all event(incidents,accidents, etc.)reporting,management andmonitoring needs,both for individualsites and the Groupas a whole.’’ AND‘‘Management &monitoring ofcorrective &preventive actionplans’’
(continued on next page)
T.O.A
.Lehtinenet
al./Information
andSoftw
areTechnology
56(2014)
408–437
429

Appendix A. (continued)
Software Client: native/browser Real-timecollaboration
Cause-effectdiagram
Idea development Voting Knowledgemanagement
Costs From
Smartdraw Native No Tree No No No Fee Google #http://www.smartdraw.com/ Requires to install
client softwareThis software is usedfrom one PC. The usercan export a file, whichcan be opened fromother PC.
Only ‘‘causes’’ canbe added to thediagram.
‘‘Onlycommentscan beadded’’
The software isonly for drawing,not for analysis ofmany drawings.
Set-Based Thinking Native No Graph Yes ? Yes Fee Google #http://www.targetedconvergence.
com/tcc-can-help/software-features/
Based on thescreenshots, the toolrequires to installclient software
A3 reports are used to‘‘collect together a setof visual models whichconcisely tell the storyof the ongoingdiscussion.’’
‘‘packages aredesigned tochart theparticularrelationshipthey areanalyzing justfine; butgenerally weneed to pulltogetheranalyses frommany differenttools of manydifferentrelations thatmust all beconsideredwhen making adecision’’
The correctiveactions are calledas ‘‘decisions’’. Thefeature list of thetool states that‘‘identify whatdecisions mustchange toimplement thoseremedies [ofcauses]’’
The tool is used tocombineknowledge fromvarious sources(e.g. individuals).This includesresults from rootcause analysis anddecisions made.
PHRED (Browser) (Yes) (Yes) Yes ? Yes Fee Google�
http://www.phredsolutions.com/customerfocus.html
‘‘PHRED is a web-basedproblem solving system.It makes it easy for you,your suppliers andcontract manufacturersto enter, edit andmanage problems.’’
‘‘Problem solvers,experts and managersshare a commonprocess andinformation’’
The causes aredetected byusing questionsonly. In theend, softwareprovides areport which isa tree baseddiagram.
‘‘PHRED takes youthrough outlining asolution andpresenting it foragreement, sign-offandimplementation.PHRED tracks themultipleimplementationactions.’’
The tool includes adatabase which isused to ‘‘ShareRoot Causeinformationbetween peopleand plants.’’ AND
430T.O
.A.Lehtinen
etal./Inform
ationand
Software
Technology56
(2014)408–
437

‘‘Standard reports,individuallydefined user queryreports,managementsummaries andcharts. Export theinformation intoExcel or PDF. Sendonly theinformation youwant to share withyour customersand suppliers.’’
BowTieXP Native No Tree (No) ? Yes Fee Google�
http://www.cgerisk.com/software/incident-analysis/incidentxp/rca
The screenshot of thetool reveals that thesoftware requires clientinstallation
There is noevidence that thetool is used tocreate correctiveactions. It seemsthat the tool is usedto detect cause-and-effects only.
The output of RCAcan be refined andstored.
‘‘Ongoing effortshall be made toexamine ways inwhich a similarimproved learningfrom incidents canbe realized bycorrelating RCAwith bowtieanalysis. One couldthink aboutclassification ofevents, andperhapscorrelation ofevents to barriersin the bowtiediagrams.’’
FMEA Software Native (No) Tree Yes No Yes Fee Google�
http://www.fmea.co.uk/APIS_FMEA_software.html
Requires clientinstallation in order tobe used.
Shares the informationthrough the web, butthe analysis isconducted on a singlePC.
The tool providesfeatures fordeveloping andregisteringcorrective actions.
‘‘procedure offocusing on whatcan go wrong,what possiblycould cause it and
(continued on next page)
T.O.A
.Lehtinenet
al./Information
andSoftw
areTechnology
56(2014)
408–437
431

Appendix A. (continued)
Software Client: native/browser Real-timecollaboration
Cause-effectdiagram
Idea development Voting Knowledgemanagement
Costs From
what are thepotential effects.Quantification ofthe risk, taking intoaccount thecurrent controls,then indicatesareas of weakness.It is widely used inmanufacturingindustries invarious phases ofthe product lifecycle. Failurecauses are anyerrors or defects inprocess, design, orpart, especiallyones that affect thecustomer.’’
Systems2win Native No Graph No No No Fee Google�#http://www.systems2win.com/
solutions/brainstorming.htmIs an Excel template. Is an Excel template
which is used tosubstitute whiteboardsin ‘‘brainstormingsessions’’
iReliability Root Cause Analysis Browser No Tree Yes No (No) Fee Google�
http://ireliability.com/product/root-cause-analysis/
The analysis isconducted on a singlePC.
Track and facilitateimplementationactivities
The existing RCAsare stored and theuser can view andrefine them.However, there isno evidence thatthe user can sharethe informationwith other users(e.g. organization’smembers)
FMECA Software Native No Tree (No) (No) (Yes) Fee Google�
http://www.itemsoft.com/fmeca.html?gclid=
Require clientinstallation
The analysis isconducted on a single
Thescreenshots
Nothing indicatesthat corrective
This feature is notexplicitly stated,
432T.O
.A.Lehtinen
etal./Inform
ationand
Software
Technology56
(2014)408–
437
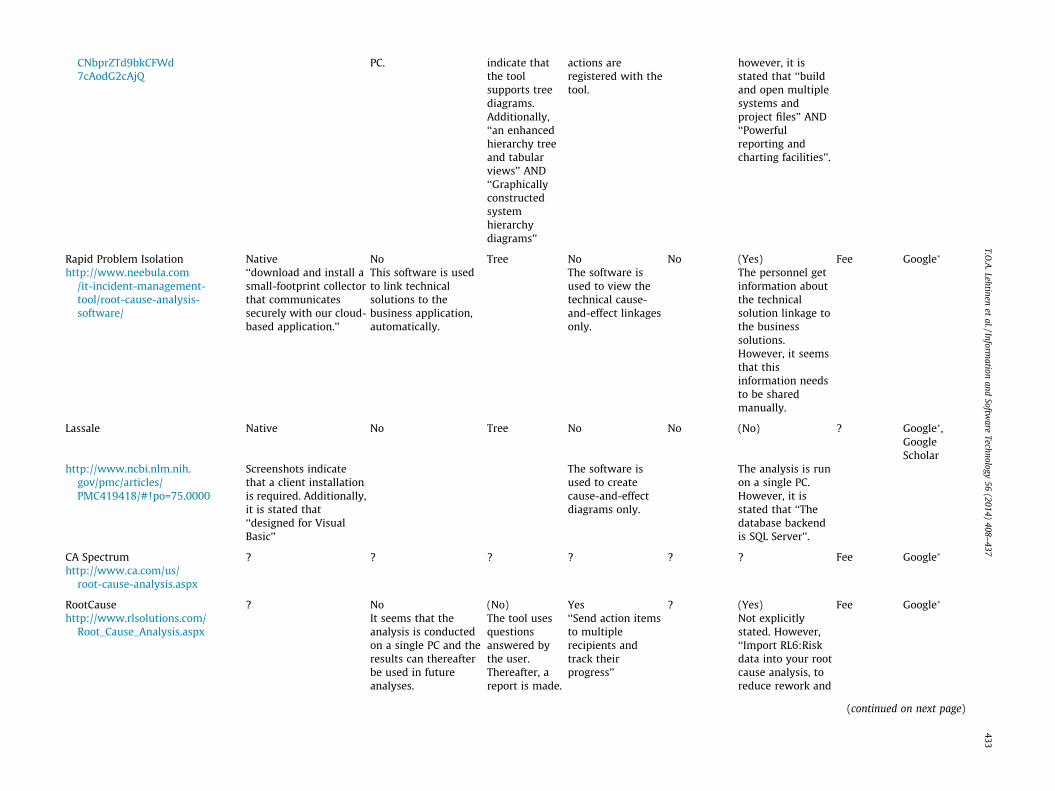
CNbprZTd9bkCFWd7cAodG2cAjQ
PC. indicate thatthe toolsupports treediagrams.Additionally,‘‘an enhancedhierarchy treeand tabularviews’’ AND
actions areregistered with thetool.
however, it isstated that ‘‘buildand open multiplesystems andproject files’’ AND‘‘Powerfulreporting andcharting facilities’’.
‘‘Graphicallyconstructedsystemhierarchydiagrams’’
Rapid Problem Isolation Native No Tree No No (Yes) Fee Google�
http://www.neebula.com/it-incident-management-tool/root-cause-analysis-software/
‘‘download and install asmall-footprint collectorthat communicatessecurely with our cloud-based application.’’
This software is usedto link technicalsolutions to thebusiness application,automatically.
The software isused to view thetechnical cause-and-effect linkagesonly.
The personnel getinformation aboutthe technicalsolution linkage tothe businesssolutions.However, it seemsthat thisinformation needsto be sharedmanually.
Lassale Native No Tree No No (No) ? Google�,GoogleScholar
http://www.ncbi.nlm.nih.gov/pmc/articles/PMC419418/#!po=75.0000
Screenshots indicatethat a client installationis required. Additionally,it is stated that‘‘designed for VisualBasic’’
The software isused to createcause-and-effectdiagrams only.
The analysis is runon a single PC.However, it isstated that ‘‘Thedatabase backendis SQL Server’’.
CA Spectrum ? ? ? ? ? ? Fee Google�
http://www.ca.com/us/root-cause-analysis.aspx
RootCause ? No (No) Yes ? (Yes) Fee Google�
http://www.rlsolutions.com/Root_Cause_Analysis.aspx
It seems that theanalysis is conductedon a single PC and theresults can thereafterbe used in futureanalyses.
The tool usesquestionsanswered bythe user.Thereafter, areport is made.
‘‘Send action itemsto multiplerecipients andtrack theirprogress’’
Not explicitlystated. However,‘‘Import RL6:Riskdata into your rootcause analysis, toreduce rework and
(continued on next page)
T.O.A
.Lehtinenet
al./Information
andSoftw
areTechnology
56(2014)
408–437
433
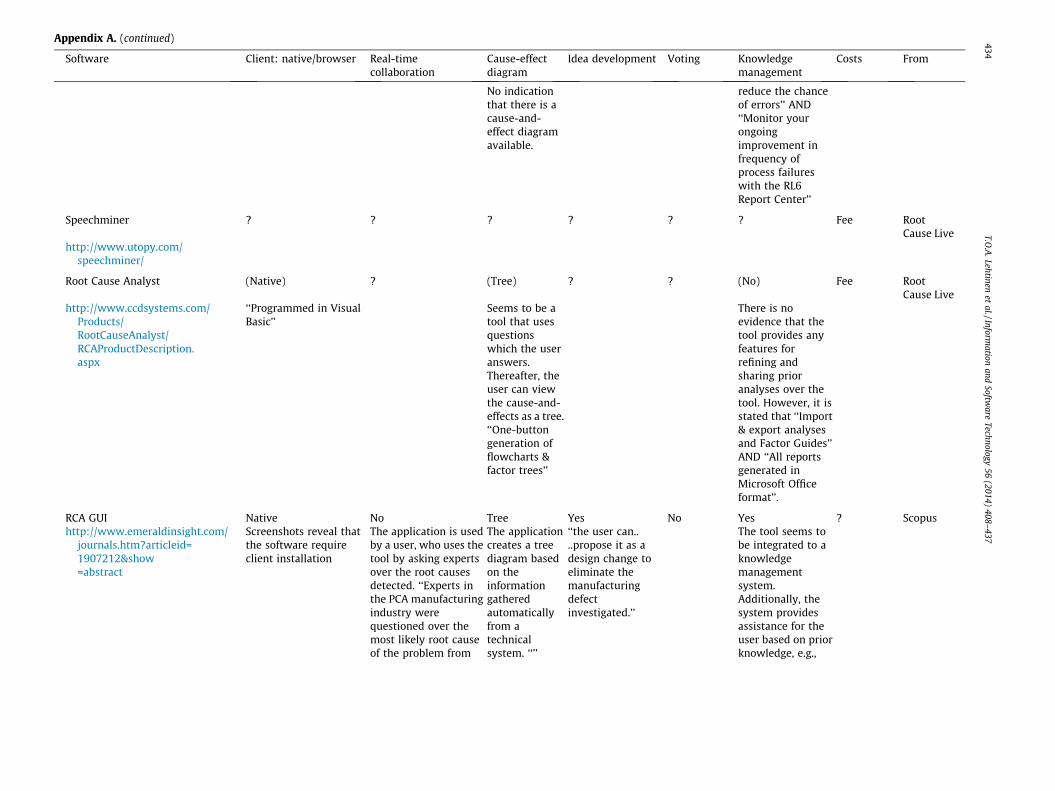
Appendix A. (continued)
Software Client: native/browser Real-timecollaboration
Cause-effectdiagram
Idea development Voting Knowledgemanagement
Costs From
No indicationthat there is acause-and-effect diagramavailable.
reduce the chanceof errors’’ AND‘‘Monitor yourongoingimprovement infrequency ofprocess failureswith the RL6Report Center’’
Speechminer ? ? ? ? ? ? Fee RootCause Live
http://www.utopy.com/speechminer/
Root Cause Analyst (Native) ? (Tree) ? ? (No) Fee RootCause Live
http://www.ccdsystems.com/Products/RootCauseAnalyst/RCAProductDescription.aspx
‘‘Programmed in VisualBasic’’
Seems to be atool that usesquestionswhich the useranswers.Thereafter, theuser can viewthe cause-and-effects as a tree.‘‘One-buttongeneration offlowcharts &factor trees’’
There is noevidence that thetool provides anyfeatures forrefining andsharing prioranalyses over thetool. However, it isstated that ‘‘Import& export analysesand Factor Guides’’AND ‘‘All reportsgenerated inMicrosoft Officeformat’’.
RCA GUI Native No Tree Yes No Yes ? Scopushttp://www.emeraldinsight.com/
journals.htm?articleid=1907212&show=abstract
Screenshots reveal thatthe software requireclient installation
The application is usedby a user, who uses thetool by asking expertsover the root causesdetected. ‘‘Experts inthe PCA manufacturingindustry werequestioned over themost likely root causeof the problem from
The applicationcreates a treediagram basedon theinformationgatheredautomaticallyfrom atechnicalsystem. ‘‘’’
‘‘the user can....propose it as adesign change toeliminate themanufacturingdefectinvestigated.’’
The tool seems tobe integrated to aknowledgemanagementsystem.Additionally, thesystem providesassistance for theuser based on priorknowledge, e.g.,
434T.O
.A.Lehtinen
etal./Inform
ationand
Software
Technology56
(2014)408–
437

thos
epr
ovid
edby
the
RC
Am
odu
le’’
‘‘th
eso
ftw
are
prov
ides
guid
ance
toth
eus
eron
the
inve
stig
atio
nof
ade
fect
base
don
prev
iou
skn
owle
dge
form
aliz
edin
the
form
ofin
tegr
ated
mod
els.
’’
No
=th
isfe
atu
reis
not
avai
labl
ein
the
soft
war
eto
ol,Y
es=
this
feat
ure
isav
aila
ble
inth
eso
ftw
are
tool
,(N
o)=
itis
like
lyth
atth
isfe
atu
reis
not
avai
labl
ein
the
soft
war
eto
ol,b
ut
we
wer
en
otab
leto
veri
fyth
at,(
Yes
)=
itis
like
lyth
atth
isfe
atu
reis
avai
labl
ein
the
soft
war
eto
ol,b
ut
we
wer
en
otab
leto
veri
fyth
at,?
=w
ew
ere
not
able
tofi
nd
any
evid
ence
onth
eoc
curr
ence
ofth
isfe
atu
re,F
ee=
the
soft
war
eis
subj
ect
toa
char
ge,F
ree
(lic
ense
)=
the
soft
war
eis
free
,Fre
eto
use
=u
sin
gth
eso
ftw
are
isfr
ee.
Goo
gle�
=Fo
un
dfr
omou
rG
oogl
ese
arch
‘‘roo
tca
use
anal
ysis
soft
war
e’’.
Goo
gle#
=Fo
un
dfr
omou
rG
oogl
ese
arch
‘‘roo
tca
use
anal
ysis
soft
war
e’’f
ree.
Ope
n-t
ube
=Fo
un
dfr
omh
ttp:
//op
en-t
ube
.com
/10-
best
-sof
twar
e-to
ols-
to-c
ondu
ct-r
oot-
cau
se-a
nal
ysis
-an
d-so
lve-
com
plex
-pro
blem
s/.
Roo
tC
ause
Live
=fo
un
dfr
omh
ttp:
//w
ww
.roo
tcau
seli
ve.c
om/l
ibra
ry/S
oftw
are.
htm
.Sc
opu
s=
fou
nd
from
scop
us.
com
.G
oogl
eSc
hol
ar=
fou
nd
from
Goo
gle
Sch
olar
.
T.O.A. Lehtinen et al. / Information and Software Technology 56 (2014) 408–437 435
Appendix B. Questionnaire used in Case 1
1. What is your title?2. Select the roles that describe your responsibility best
a. Managerb. Product Ownerc. Developerd. Something else, what?
3. How long have you worked in this role(s)?4. How long have you worked at the company?5. Target Problem
Give a value (1 = very minor, 2, 3, 4, 5 = very major) thatcorresponds the question best
a. Effort the company has used to try to prevent thetarget problem earlier
b. The internal impact of the target problem for thecompany
c. The external impact of the target problem for thecompany
d. The impact of the target problem for team’scommunication
6. Target problem causesGive a value (1 = very minor, 2, 3, 4, 5 = very major) that
corresponds the question besta. The correctness of the detected causesb. The correctness of the detected root causesc. Impact of resolving the found causes of the problems
7. Retrospective methodGive a value (1 = very minor, 2, 3, 4, 5 = very major) that
corresponds the question besta. The easiness to collect the causesb. The easiness to detect the root causesc. The easiness to organize the causesd. The easiness to detect the root causes of the target
probleme. My own contribution in the retrospectivef. The openness of the communication in the
retrospectiveGive a value (1 = absolutely NO, 2, 3, 4, 5 = absolutely YES)
that corresponds the question bestg. Is the ARCA tool easy?h. Is the ARCA tool learnable?i. Did the ARCA tool help in finding problems and causes?j. Would you have found the same causes without the
tool?k. Would the retrospective have been easier without the
tool?l. Would the retrospective have been more effective
without the tool?
Appendix C. Questionnaire used in Case 2
1. What is your title2. Select the roles that describe your responsibility best3. Target Problem
Give a value that corresponds the question best [1 = very low,2, 3, 4, 5 = very high]
a. Effort the company has used to try to prevent thetarget problem (or similar ones) earlier
(continued on next page)

436 T.O.A. Lehtinen et al. / Information and Software Technology 56 (2014) 408–437
b. Internal impact of the target problem for the company4. Target problem causes
a. Correctness of the detected causesb. Impact of resolving the found causes of the problems
5. Retrospective methodGive a value that corresponds the question best [1 = very low,
2, 3, 4, 5 = very high]a. Easiness to collect the causesb. Easiness to detect the root causesc. My own contribution in the RCA session wasd. Openness of the communication in the RCA session
wase. Compared to our team’s current process improvement
practices, do you find using the RCA method cost efficient?f. Compared to our team’s current process improvement
practices, do you find using the RCA method easy?g. Compared to our team’s previous practices to find
causes behind problems or issues, do you find using the RCAmethod useful?
h. The easiness to detect the causes of the target problemwas.
i. To solve the target problem, was detecting causes forthe target problem useful?
j. In contrast to the company’s practices, was the methodused to detect target problem causes useful?
k. Was it easy to detect the target problem causes?6. The ARCA tool
Give a value that corresponds the question best [1 = very low,2, 3, 4, 5 = very high]
a. Compared to an RCA session done by using post-itnotes, do you find using the online ARCA-tool cost efficient?
b. Compared to an RCA session done by using post-itnotes, do you find the online ARCA-tool easy to use?
c. Compared to our team’s previous processimprovement practices, do you find the online ARCA-tooluseful?
d. Is the online ARCA tool easy to use?e. Is the online ARCA tool easy to learn?f. Did the online ARCA tool help to find problem causes?g. Would we have found the same problem causes
without the tool?h. Was it difficult to organize the problem causes with
the online ARCA tool?i. In contrast to our company practices, is the online
ARCA tool cost efficient to detect process improvementtargets?
References
[1] K.C. Desouza, T. Dingsøyr, Y. Awazu, Experiences with conducting projectpostmortems: reports versus stories, Softw. Process Improve. Pract. 10 (2005)203–215.
[2] R.J. Latino, K.C. Latino (Eds.), Root Cause Analysis: Improving Performance forBottom-Line Results, 6000 Broken Sound Parkway NW, Suite 300 Boca Raton,FL 33487-2742, CRC Press, 2006.
[3] T. Dingsøyr, N.B. Moe, Ø. Nytrø, Augmenting experience reports withlightweight postmortem reviews, in: PROFES’01 Proceedings of the ThirdInternational Conference on Product Focused Software Process Improvement,2001, pp. 167–181.
[4] T. Dingsøyr, Postmortem reviews: purpose and approaches in softwareengineering, Inf. Softw. Technol. 47 (2005) 293–303.
[5] F.O. Bjørnson, A.I. Wang, E. Arisholm, Improving the effectiveness of root causeanalysis in post mortem analysis: a controlled experiment, Inf. Softw. Technol.51 (1) (2009) 150–161.
[6] J.D. Herbsleb, D. Moitra, Global software development, IEEE Softw. 18 (2001)16–20.
[7] T. Jaanu, M. Paasivaara, C. Lassenius, Near-synchronity and distance: instantmessaging as a medium for global software engineering, in: 2012 IEEE SeventhInternational Conference on Global Software Engineering, 2012, pp. 149–153.
[8] J. Terzakis, Virtual retrospectives for geographically dispersed software teams,IEEE Softw. 28 (2011) 12–15.
[9] T.O.A. Lehtinen, M.V. Mäntylä, J. Vanhanen, Development and evaluation of alightweight root cause analysis method (ARCA method) – field studies at foursoftware companies, Inf. Softw. Technol. 53 (10) (2011) 1045–1061.
[10] D.N. Card, Learning from our mistakes with defect causal analysis, IEEE Softw.15 (1) (1998) 56–63.
[11] M. Leszak, D.E. Perry, D. Stoll, A case study in root cause defect analysis, in:Proceedings of the 2000 International Conference on Software Engineering,2000, pp. 428–437.
[12] R.B. Grady, Software failure analysis for high-return process improvementdecisions, Hewlett-Packard J. 47 (4) (1996) 15–25.
[13] P. Jalote, N. Agrawal, Using defect analysis feedback for improving quality andproductivity in iterative software development, in: Proceedings of theInformation Science and Communications Technology (ICICT 2005), 2005,pp. 701–714.
[14] B. Andersen, T. Fagerhaug (Eds.), Root Cause Analysis: Simplified Tools andTechniques, Tony A. William American Society for Quality, Quality Press,United States, Milwaukee 53203, 2006.
[15] News and notes from the Google Drive and Docs teams, ‘‘Introducing GoogleDocs drawings’’, Docs Blog, 13th April 2010.
[16] M. Kalinowski, G.H. Travassos, D.N. Card, Towards a defect prevention basedprocess improvement approach, in: Proceedings of the 34th EUROMICROConference on Software Engineering and Advanced Applications, Parma, Italy,2008, pp. 199–206.
[17] R.G. Mays, Applications of defect prevention in software development, IEEE J.Sel. Areas Commun. 8 (1990) 164–168.
[18] M. Siekkinen, G. Urvoy-Keller, E.W. Biersack, D. Collange, A root cause analysistoolkit for TCP, Comput. Netw. (2008) 1846–1858.
[19] T. Stålhane, Root Cause Analysis and Gap Analysis – A Tale of Two Methods,EuroSPI 2004, Trondheim, Norway, 2004, pp. 150–160.
[20] I. Bhandari, M. Halliday, E. Tarver, D. Brown, J. Chaar, R. Chillarege, A case studyof software process improvement during development, IEEE Trans. Softw. Eng.19 (12) (1993) 1157–1170.
[21] Z.X. Jin, J. Hajdukiewicz, G. Ho, D. Chan, Y. Kow, Using root cause data analysisfor requirements and knowledge elicitation, in: International Conference onEngineering Psychology and Cognitive Ergonomics (HCII 2007), Berlin,Germany, 2007, pp. 79–88.
[22] K. Schwaber, J. Sutherland, Scrum Guide, Scrum Alliance, 2011.[23] J.J. Rooney, L.N. Vanden Heuvel, Root cause analysis for beginners, Qual. Prog.
37 (7) (2004) 45–53.[24] F.T. Anbari, E.G. Carayannis, R.J. Voetsch, Post-project reviews as a key project
management competence, Technovation 28 (2008) 633–643.[25] R.L. Glass, Project retrospectives, and why they never happen, IEEE Softw. 19
(2002) 111–112.[26] L. Williams, What agile teams think of agile principles, Commun. ACM 55
(2012) 71–76.[27] W.F. Boh, S.A. Slaughter, A.J. Espinosa, Learning from experience in software
development: a multilevel analysis, Manage. Sci. 53 (2007) 1315–1331.[28] T. Stålhane, T. Dingsøyr, G. Hanssen, N. Moe, Post mortem – an assessment of
two approaches, Emp. Methods Stud. Softw. Eng. (2003) 129–141.[29] T.O.A. Lehtinen, M.V. Mäntylä, What are problem causes of software projects?
Data of root cause analysis at four software companies, in: ESEM’11 Proc. ofthe 2011 International Symposium on Empirical Software Engineering andMeasurement, 2011, pp. 388–391.
[30] F. Lanubile, C. Ebert, R. Prikladnicki, A. Vizcaíno, Collaboration tools for globalsoftware engineering, IEEE Softw. 27 (2010) 52–55.
[31] M. Jiménez, M. Piattini, A. Vizcaíno, Challenges and improvements indistributed software development: a systematic review, Adv. Softw. Eng.2009 (2009) 3.
[32] F.Q. da Silva, C. Costa, A.C.C. França, R. Prikladinicki, Challenges and solutionsin distributed software development project management: a systematicliterature review, in: 2010 5th IEEE International Conference on GlobalSoftware Engineering (ICGSE), 2010, pp. 87–96.
[33] L. Williams, D. Grayson, J. Gosbee, Patient safety—incorporating drawingsoftware into root cause analysis software, J. Am. Med. Inform. Assoc. 9 (2002)S52–S53.
[34] W. Vantine, K. Benfield, D. Pritts, K. Ballard, Evaluating and incorporating newage software technology for identifying systemic root causes, in: Joint ESA-NASA Space-Flight Safety Conference, 2002, pp. 369.
[35] L. Huertas-Quintero, P. Conway, D. Segura-Velandia, A. West, Root causeanalysis support for quality improvement in electronics manufacturing,Assem. Autom. 31 (2011) 38–46.
[36] S. Lee, J.F. Courtney, R.M. O’Keefe, A system for organizational learning usingcognitive maps, Omega, Int. J. Manage. Sci. 20 (1992) 23–36.
[37] T.C. Lethbridge, S. Elliott Sim, J. Singer, Studying software engineers: datacollection techniques for software field studies, Emp. Softw. Eng. 10 (3) (2005)311–341.
[38] S. Jamieson, Likert scales: how to (ab) use them, Med. Educ. 38 (2004) 1217–1218.
[39] J.F. Nunamaker, A.R. Dennis, J.S. Valacich, D. Vogel, J.F. George, Electronicmeeting systems, Commun. ACM 34 (1991) 40–61.
[40] I. Zigurs, B.K. Buckland, A theory of task/technology fit and group supportsystems effectiveness, MIS Quarterly (1998) 313–334.
[41] A.R. Dennis, C.K. Tyran, D.R. Vogel, J.F. Nunamaker Jr., Group support systemsfor strategic planning, J. Manage. Inf. Syst. 14 (1997) 155–184.

T.O.A. Lehtinen et al. / Information and Software Technology 56 (2014) 408–437 437
[42] P. Runeson, M. Höst, Guidelines for conducting and reporting case studyresearch in software engineering, Emp. Softw. Eng. 14 (2008) 131–164.
[43] H.K. Klein, M.D. Myers, A set of principles for conducting and evaluatinginterpretive field studies in information systems, MIS Quarterly (1999) 67–93.
[44] G. DeSanctis, R.B. Gallupe, A foundation for the study of group decision supportsystems, Manage. Sci. 33 (1987) 5.
[45] N.B. Moe, D. Šmite, Understanding lacking trust in global software teams: amulti-case study, in: Product-Focused Software Process Improvement,Springer, 2007, pp. 20–34.
[46] T.D. Jick, Mixing qualitative and quantitative methods: triangulation in action,Adm. Sci. Q. 24 (1979) 602–611.