Embed Size (px)
Citation preview
July 2000 Bulletin Number 873
A Timber Resource Assessmentof Northwest Louisiana
Richard P. Vlosky and N. Paul Chance

2
Louisiana State University Agricultural CenterWilliam B. Richardson, Chancellor
Louisiana Agricultural Experiment StationR. Larry Rogers, Vice Chancellor and Director
The Louisiana Agricultural Experiment Station providesequal opportunities in programs and employment.
This research was made possible by grantsfrom the U.S. Department of Commerce,Economic Development Administration,
The Coordinating & Development Corporationin Shreveport, Louisiana,
and the Louisiana Agricultural Experiment Station.

3
1The authors are Associate Professor, Louisiana Forest Products Laboratory, School ofForestry, Wildlife, and Fisheries, Louisiana State University Agricultural Center, Baton Rouge,Louisiana; and President, Pro-Development Services, LLC., respectively.
A Timber Resource Assessmentof Northwest Louisiana
Richard P. Vlosky and N. Paul Chance
4
Table of Contents
Introduction .......................................................................................... 5
The Problem ......................................................................................... 6
Summary of Findings ......................................................................... 8
Why Conduct a Forest Resources Assessment? ............................. 9
Forest Types ........................................................................................ 16
Changes in Forestland Areas ........................................................... 18
Land Ownership Patterns ................................................................ 19
Timber Stand Size Class .................................................................... 20
Growing Stock Volumes ................................................................... 21
Changes in Growing Stock Volumes .............................................. 22
Hardwood Growing Stock Volumes ............................................... 24
Growing Stock Volume by Species - 1991 ...................................... 26
Sawtimber Volumes ........................................................................... 27
Growth/Removal Ratios by Ownership and Species Group ..... 31
Resources Assessment Summary.................................................... 33
References ........................................................................................... 34
5
IntroductionAn innovative approach has been developed at the Louisiana
Forest Products Laboratory to stimulate economic developmentand alleviate chronic long-term economic deterioration in ruralresource-based regions (Vlosky et al., 1998). Targeting the second-ary forest products industry as a driver for economic develop-ment, the methodology addresses a number of areas includingmarkets for value-added products, industry labor skill require-ments, training needs, sociological factors that affect or influencethe labor market and potential economic outcomes based onvarious industry development scenarios.
The methodology incorporates a holistic approach that em-phasizes long-term sustainable industry development. The goal isto develop the wood products industry while adding value toexisting resources, creating employment opportunities withtransferable skills and maintaining the stewardship of renewableresources in rural communities.
As is the case with most economic development efforts, forestsector strategies rely on either retention and expansion of existingcompanies or attracting new industrial investment. In addition,most industry development efforts focus on value-added second-ary processing (dimension products, furniture, flooring) ratherthan primary production (lumber and plywood) to retain andexpand jobs in rural areas. Value-added secondary wood process-ing offers opportunities for increased profitability through highermargins and greater profits. Employment is encouraged withlarger numbers of smaller local companies instead of a few largeprimary-processing plants. In addition, higher economic multipli-ers are realized in secondary manufacturing compared to primaryconversion (Syme and Duke 1991).
Making secondary wood products often offers opportunitiesthat primary processing does not normally offer. For example,secondary manufacturers can generally increase prices to makeup for lost profits when raw material costs rise. Secondary prod-ucts also earn higher profits by adding value and meeting specificcustomer needs. Secondary products can lead to better resourceuse also. Making specialty products instead of commodities
6
allows a company to take better take advantage of new markets.Secondary processing also allows a producer to respond quicklyto new trends, such as home remodeling-repair markets (Symeand Duke 1991).
In locales where jobs are in short supply, locally generatedsecondary forest products industry jobs that create transferableskills may offer a viable alternative to forced migration to main-tain or increase employment (Skog 1991). Further, secondaryforest products wages often exceed average wages of other jobs inrural areas, adding incentives for recruitment and developmentefforts aimed at secondary forest products industry companies(Skog 1991).
Many states and regions in the United States are diversifyingrural economic opportunities through forest resource basedindustry sector development. Kentucky, Maine, Oregon, Pennsyl-vania and Washington are taking advantage of forest resources toimprove economic conditions within their borders (Jones et al.,1989). In this study, industry development opportunities specificto northwest Louisiana were examined. This publication focuseson forest resources and implications for industry development inthis region.
The ProblemIn the wood products industry, Louisiana produces only $.97
of value-added product for every $1.00 of lumber created by thesawmills operating in the state. This compares to the southernaverage of $2.13 of value-added for $1.00 of sawmill productproduced. Improvement of industry competitiveness can increasepotential for jobs creation and resource use in the rural-basedforest products industry. To attain this potential, a wide variety ofissues must be addressed. For example, existing consumer mar-ket trends, location decision criteria, raw materials availabilityand applicability, labor force skills and training requirements,target market identification, recruitment and retention strategies,comparative advantages and effects on community stabilityshould all be considered as part of an economic developmentinitiative.
7
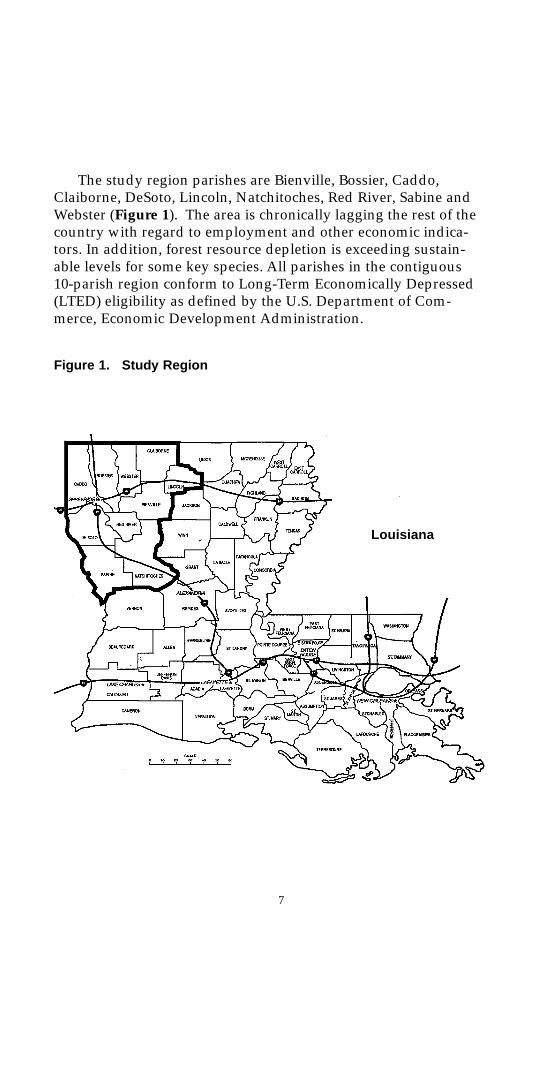
The study region parishes are Bienville, Bossier, Caddo,Claiborne, DeSoto, Lincoln, Natchitoches, Red River, Sabine andWebster (Figure 1). The area is chronically lagging the rest of thecountry with regard to employment and other economic indica-tors. In addition, forest resource depletion is exceeding sustain-able levels for some key species. All parishes in the contiguous10-parish region conform to Long-Term Economically Depressed(LTED) eligibility as defined by the U.S. Department of Com-merce, Economic Development Administration.
Figure 1. Study Region
Louisiana
8
Summary of FindingsRegional Forest Resources
1. The 10-parish study region represents 15.6 percent of theparishes of Louisiana, but timber lands in the regionaccount for about 3.6 million acres, or nearly 26 percent ofthe total 13.9 million acres of forested land in Louisiana.
2. Predominant species include 2.37 million acres of southernyellow pine and oak, 691,000 acres of upland hardwoodspecies such as oak, hickory and sweetgum and about535,000 acres of bottom-land species such as water oak,tupelo gum and cypress.
3. The data clearly indicate that the study region containssignificant quantities of quality commercial softwood andhardwood timber to support further development of thesecondary forest products industry.
4. Companies in the region produce a wide variety of prod-ucts from the resource base and distribute these productsaround the world. In addition to the use of raw materialsfrom within the region, these companies also import rawmaterials from adjacent states and parishes to manufac-ture products for industrial, commercial and end-usermarkets.
5. Most parishes in the region have seen increases in theirrespective volumes of forestland in the period between1984 and 1991. Sabine Parish is reported to have thegreatest volume of softwood, and Natchitoches Parishcontains the greatest volumes of hardwood species. Con-sidering softwoods and hardwoods combined,Natchitoches Parish has more timberland than any otherparish in the study region.
6. Volumes of cypress timber in the region, though signifi-cantly smaller than that of pine, have grown during thepast decade. This increase in standing cypress timber maywell represent a niche-specific opportunity for job creation.
9
7. A reduction in growth/removal ratios for the regionindicates that harvesting pressure is being placed on theresource.
8. Volume for all diameter size classes except pole timber hasincreased over the 1974-1984-1991 time periods. Thisfinding is important, given the conventional wisdom thatholds that private landowners are less likely to replantonce they have harvested the commercial timber on theirlands.
9. Future supplies of hardwood resources for value-addedsolid wood processing may be affected if the existinghardwood timber stands of immature trees are sold forchip and paper production.
10. Private non-forest industry landowners make up themajority of the land ownership structure in the region.This is a crucial factor because it could have significantimpact on the availability of raw materials, how and towhom these raw materials are sold and the amount anddistribution of regeneration of timber resources on theselands.
Why Conduct a Forest ResourcesAssessment?
The initial step in forest sector development is to discern thecurrent and potential availability of raw materials both at theforest resource and intermediate product levels. In this methodol-ogy, we examine more than 25 resource variables including foresttypes, timberland area by parish, ownership and stand size class,growing stock volume by species, sawtimber volume by grade,diameter class, and species and sawtimber growth/removal ratiosby species. In addition to resource data collection for the studyregion, comparable information is gathered for adjacent countieswithin 100 miles of the edge of the region. The reason for doingthis is that forest-based industry may be viable in an area even ifit is not considered a “wood basket.” Effective transportation andhaul distances from region manufacturing facilities are often up to150 miles.
10
The data that constitute the basis for the resources of themethodology were derived from numerous sources. In an appli-cation of the methodology in Louisiana, these sources includedthe 1984 and 1991 Forest Inventory Analyses (FIA) conducted bythe United States Forest Service (USFS). The FIA survey is a three-phase process that begins with the use of aerial photos of the areaof analysis. Forest-nonforest classification of land use is based onidentified points of about 230 acres each. This classification is thenadjusted through on the ground observations at sample locations.Field data are gathered for per-acre estimates in a grid with pointslocated at 3-mile intervals. The reader is advised to consultUSDA, Forest Service Resource Bulletin SO-165 1991 for a moredetailed discussion of the statistical methods for data collection.
In addition, the USFS bulletin series for forest statistics ofLouisiana published by the Southern Forest Experiment Station(Vissage et al., 1995; Rosson 1991), the 1992 Census of the UnitedStates (U.S. Census Bureau 1995), Forests of the South, SouthernForest Based Economic Development Council (Faulkner et al.,1995) and the Woods of Louisiana (Harding et al., 1995) were used.
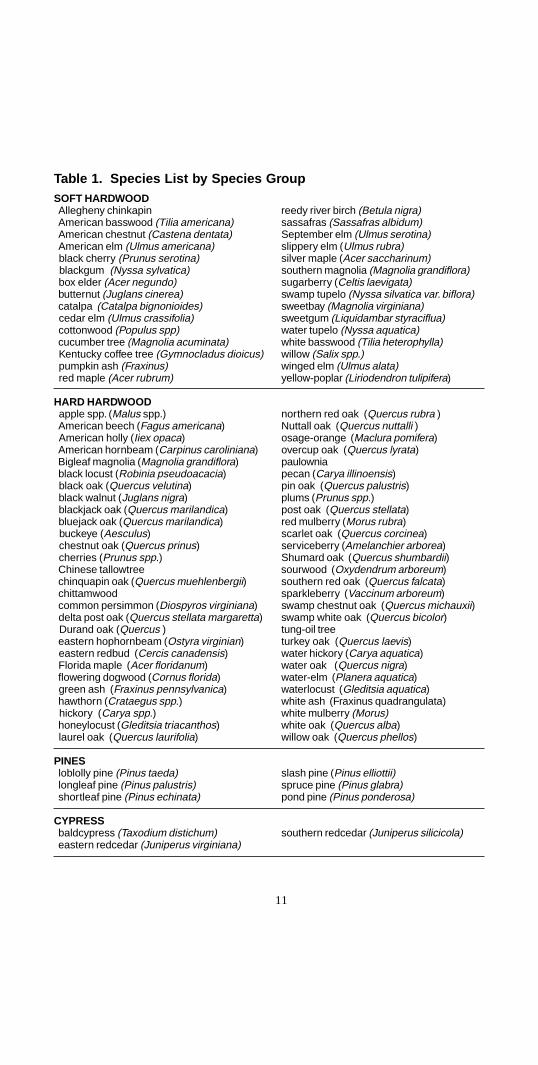
Throughout this section, in discussing growing stock andsawtimber volumes, there are references to species groups. Table1 defines the species included in each species group.
11
Table 1. Species List by Species GroupSOFT HARDWOOD Allegheny chinkapin reedy river birch (Betula nigra) American basswood (Tilia americana) sassafras (Sassafras albidum) American chestnut (Castena dentata) September elm (Ulmus serotina) American elm (Ulmus americana) slippery elm (Ulmus rubra) black cherry (Prunus serotina) silver maple (Acer saccharinum) blackgum (Nyssa sylvatica) southern magnolia (Magnolia grandiflora) box elder (Acer negundo) sugarberry (Celtis laevigata) butternut (Juglans cinerea) swamp tupelo (Nyssa silvatica var. biflora) catalpa (Catalpa bignonioides) sweetbay (Magnolia virginiana) cedar elm (Ulmus crassifolia) sweetgum (Liquidambar styraciflua) cottonwood (Populus spp) water tupelo (Nyssa aquatica) cucumber tree (Magnolia acuminata) white basswood (Tilia heterophylla) Kentucky coffee tree (Gymnocladus dioicus) willow (Salix spp.) pumpkin ash (Fraxinus) winged elm (Ulmus alata) red maple (Acer rubrum) yellow-poplar (Liriodendron tulipifera)
HARD HARDWOOD apple spp. (Malus spp.) northern red oak (Quercus rubra ) American beech (Fagus americana) Nuttall oak (Quercus nuttalli ) American holly (Iiex opaca) osage-orange (Maclura pomifera) American hornbeam (Carpinus caroliniana) overcup oak (Quercus lyrata) Bigleaf magnolia (Magnolia grandiflora) paulownia black locust (Robinia pseudoacacia) pecan (Carya illinoensis) black oak (Quercus velutina) pin oak (Quercus palustris) black walnut (Juglans nigra) plums (Prunus spp.) blackjack oak (Quercus marilandica) post oak (Quercus stellata) bluejack oak (Quercus marilandica) red mulberry (Morus rubra) buckeye (Aesculus) scarlet oak (Quercus corcinea) chestnut oak (Quercus prinus) serviceberry (Amelanchier arborea) cherries (Prunus spp.) Shumard oak (Quercus shumbardii) Chinese tallowtree sourwood (Oxydendrum arboreum) chinquapin oak (Quercus muehlenbergii) southern red oak (Quercus falcata) chittamwood sparkleberry (Vaccinum arboreum) common persimmon (Diospyros virginiana) swamp chestnut oak (Quercus michauxii) delta post oak (Quercus stellata margaretta) swamp white oak (Quercus bicolor) Durand oak (Quercus ) tung-oil tree eastern hophornbeam (Ostyra virginian) turkey oak (Quercus laevis) eastern redbud (Cercis canadensis) water hickory (Carya aquatica) Florida maple (Acer floridanum) water oak (Quercus nigra) flowering dogwood (Cornus florida) water-elm (Planera aquatica) green ash (Fraxinus pennsylvanica) waterlocust (Gleditsia aquatica) hawthorn (Crataegus spp.) white ash (Fraxinus quadrangulata) hickory (Carya spp.) white mulberry (Morus) honeylocust (Gleditsia triacanthos) white oak (Quercus alba) laurel oak (Quercus laurifolia) willow oak (Quercus phellos)
PINES loblolly pine (Pinus taeda) slash pine (Pinus elliottii) longleaf pine (Pinus palustris) spruce pine (Pinus glabra) shortleaf pine (Pinus echinata) pond pine (Pinus ponderosa)
CYPRESS baldcypress (Taxodium distichum) southern redcedar (Juniperus silicicola) eastern redcedar (Juniperus virginiana)
12
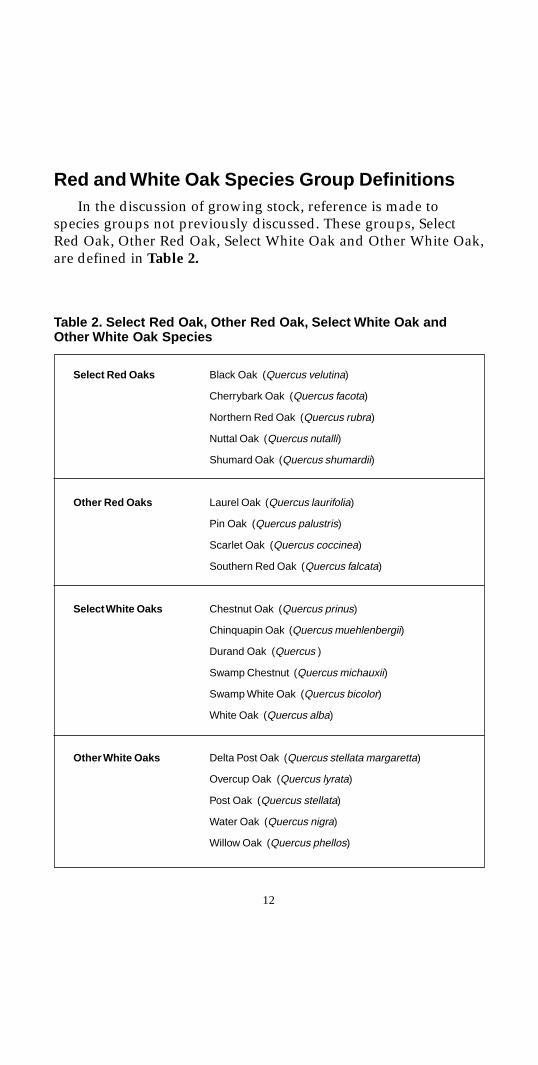
Red and White Oak Species Group DefinitionsIn the discussion of growing stock, reference is made to
species groups not previously discussed. These groups, SelectRed Oak, Other Red Oak, Select White Oak and Other White Oak,are defined in Table 2.
Table 2. Select Red Oak, Other Red Oak, Select White Oak andOther White Oak Species
Select Red Oaks Black Oak (Quercus velutina)
Cherrybark Oak (Quercus facota)
Northern Red Oak (Quercus rubra)
Nuttal Oak (Quercus nutalli)
Shumard Oak (Quercus shumardii)
Other Red Oaks Laurel Oak (Quercus laurifolia)
Pin Oak (Quercus palustris)
Scarlet Oak (Quercus coccinea)
Southern Red Oak (Quercus falcata)
Select White Oaks Chestnut Oak (Quercus prinus)
Chinquapin Oak (Quercus muehlenbergii)
Durand Oak (Quercus )
Swamp Chestnut (Quercus michauxii)
Swamp White Oak (Quercus bicolor)
White Oak (Quercus alba)
Other White Oaks Delta Post Oak (Quercus stellata margaretta)
Overcup Oak (Quercus lyrata)
Post Oak (Quercus stellata)
Water Oak (Quercus nigra)
Willow Oak (Quercus phellos)
13
Major Species in the RegionSouthern Yellow Pine Pinus sp. The most plentiful species
found in the region collectively are known as southern yellowpine. These species are used extensively in the production ofpaper and dimension construction materials. Because of increasedglobal demand in paper markets and restrictions on softwoodtimber harvesting in the Pacific Northwest, pressure has increasedon the South’s pine resources. This impact on virtually all of thepulpwood, sawtimber and pole timber softwood resources isreflected on the resources data in the region.
American beech Fagus grandifolia American beech grows inmixed hardwood bottomlands. It is a relatively low cost utilitywood used primarily in flooring, furniture, handles and pallets.
Ash Fraxinus sp. Because the smaller diameter classes areincreasing, commercial availability of the species should continuefor the foreseeable future. The wood from this species is used forcabinets, furniture, boxes, bats and handles (Harding and Smith1995).
Baldcypress Taxodium distichum v. distichum Decay resistanceis a characteristic for which cypress is renowned, but the sapwoodof this species lacks the decay resistance of the heartwood. Todevelop sufficient heartwood to be commercially importantwould require the trees to be allowed to grow to become very old.There is, however, a growing market for cypress chips, mulch andeconomically priced solid wood furniture made from this species.
Boxelder Acer negundo This bottomland species is usuallyfound in conjunction with other species and is used as other lowcost utility woods as firewood, in the production of turnings andsome carvings.
Cottonwood Populus deltoides This fast growing poplar isused in a number of applications including excelsior, boxes,pallets, caskets and upholstered furniture frames. Because of thewhite color of the wood and the length of the wood fiber, cotton-wood is used in the production of paper. This species is thesubject of significant research into short rotation fiber farming offast growing timber species for use in the pulp and paper indus-try. Such research may offer an opportunity for reversion of
14
unused or underused agricultural lands as global demand forpulp and paper increases.
Hickories and Pecans Carya sp. This species includes the truehickories and pecans. Both groups have been depleted since 1984and may not remain commercially significant. These species areused to produce handles, dowels, furniture, cabinets and sportinggoods (Harding and Smith 1995). It is likely these woods areharvested in conjunction with other species and represent inci-dental commercial opportunity.
Elm Ulmus sp. American elm (Ulmus americana) and wingedelm (Ulmus alata), which represent the soft elms, are used exten-sively to produce crates, furniture, boxes and pallets.
Sweetgum Liquidambar sp. Sweetgum is a utility woodabundant throughout the study region. Recently this species hasbeen in demand for millwork, furniture frames, chips, marshmatting, crossties and pallets. This fast growing, ubiquitoushardwood probably will continue to be in ample supply in theregion for the foreseeable future.
Red oaks Quercus sp. Red oaks comprise a number of speciesfound on a variety of sites. Upland sites produce cherrybark,shumard and northern red oak. Bottomland sites will producesouthern red oak or swamp red oak, water oak, obtusa oak,willow oak and others. Cherrybark and shumard are the mostvaluable of these species, but virtually all red oaks have readymarkets and consistent demand.
Depending on grade, color and mineral staining, there is awide price range as well as range of application for the wood ofthis species. Red oak wood is used in many applications fromfurniture and cabinetry to marsh matting and oriented strandboard. The wood is often kiln dried and processed into dimen-sion stock to be used for further value-added manufacturing andis available in lumber and veneer forms (Harding and Smith1995).
Sugarberry Celtis Laevagata Commonly called hackberry, thiswood is used in crates, pallets, furniture frames and inexpensivesolid wood furniture and is available in lumber and veneer forms(Harding and Smith 1995).
15
Sycamore Platanus occidentalis Sycamore is available in bothlumber and veneer (Harding and Smith 1995). Because of thescarcity of the resource, use in veneers may extend its commer-cially viable life.
Tupelo/blackgum Nyssa sp. These utility woods are of lim-ited commercial value to the region because of the limited quan-tity, difficulty of access to bottomland and flooded sites wherethey grow and the relative low value of the wood. The wood isused in boxes, pallets, baskets and inexpensive furniture andcabinets (Harding and Smith 1995).
Water hickory Carya aquatica This species is a bottomlandspecies frequently found on flooded sites. It is a low quality woodwith limited commercial value, primarily because of the wood’scharacteristics and the difficulty in logging. The larger trees arebeing logged, but the removal rate appears to be low. In relationto other bottomland utility woods, significant inventory is avail-able.
White oak Quercus sp. This valuable species grows in avariety of sites from upland areas to bottomlands. The species isvalued for its ability to contain liquids and as a valuable cabinetand furniture wood (Harding and Smith 1995).
Willow Salix sp. This bottomland species grows profuselyalong the banks of streams and rivers as well as other low-lyingareas in the region. Willow is a relatively low cost wood and isused much like other utility woods in crates, low cost furniture,excelsior and caskets.
Yellow-poplar Liriodendron tulipifera The wood from thisspecies is moderately expensive and is used in such applicationsas millwork, furniture, cabinets and caskets (Harding and Smith1995).
16
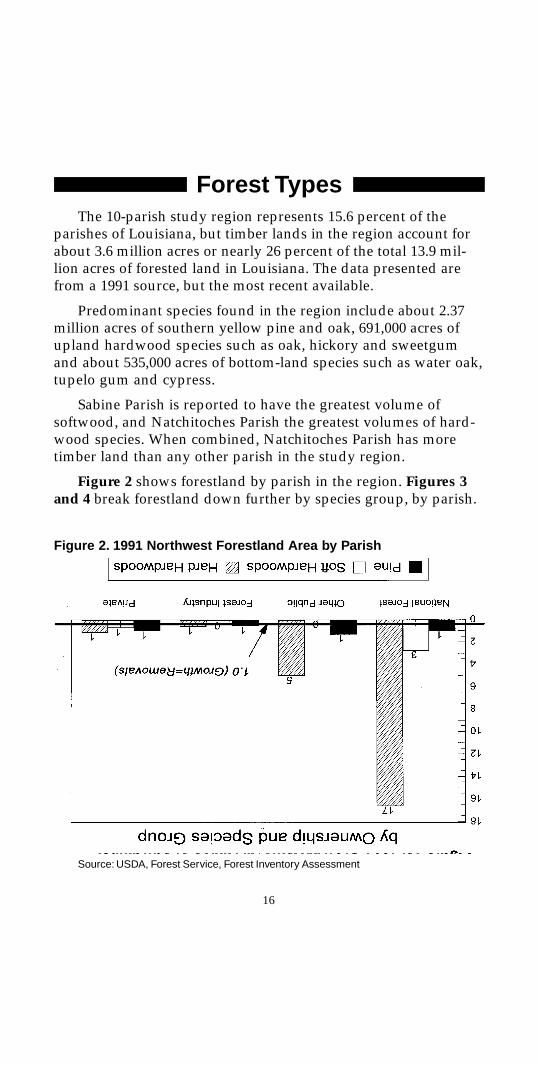
Forest TypesThe 10-parish study region represents 15.6 percent of the
parishes of Louisiana, but timber lands in the region account forabout 3.6 million acres or nearly 26 percent of the total 13.9 mil-lion acres of forested land in Louisiana. The data presented arefrom a 1991 source, but the most recent available.
Predominant species found in the region include about 2.37million acres of southern yellow pine and oak, 691,000 acres ofupland hardwood species such as oak, hickory and sweetgumand about 535,000 acres of bottom-land species such as water oak,tupelo gum and cypress.
Sabine Parish is reported to have the greatest volume ofsoftwood, and Natchitoches Parish the greatest volumes of hard-wood species. When combined, Natchitoches Parish has moretimber land than any other parish in the study region.
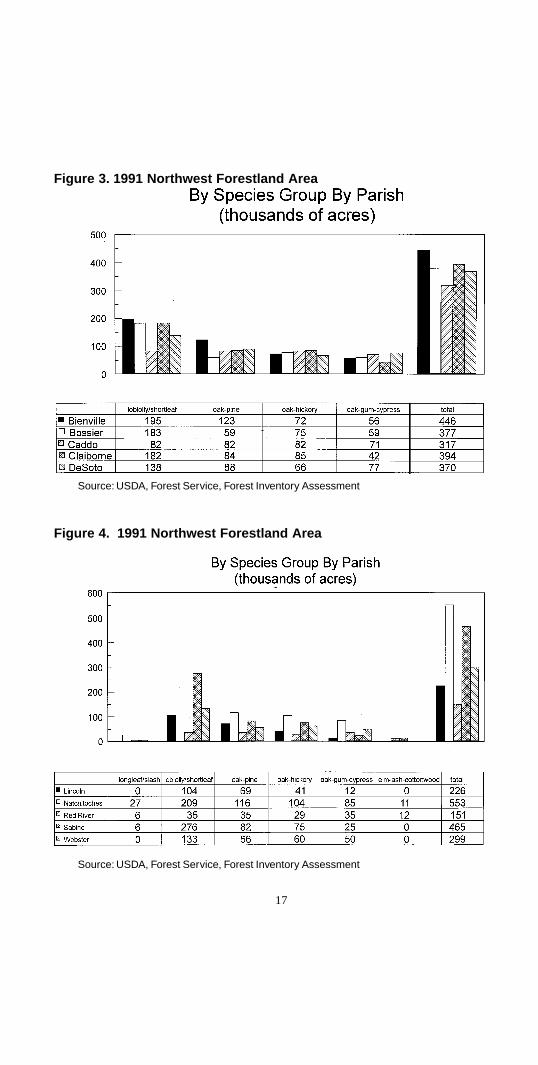
Figure 2 shows forestland by parish in the region. Figures 3and 4 break forestland down further by species group, by parish.
Figure 2. 1991 Northwest Forestland Area by Parish
Source: USDA, Forest Service, Forest Inventory Assessment
17
Figure 3. 1991 Northwest Forestland Area
Figure 4. 1991 Northwest Forestland Area
Source: USDA, Forest Service, Forest Inventory Assessment
Source: USDA, Forest Service, Forest Inventory Assessment
18
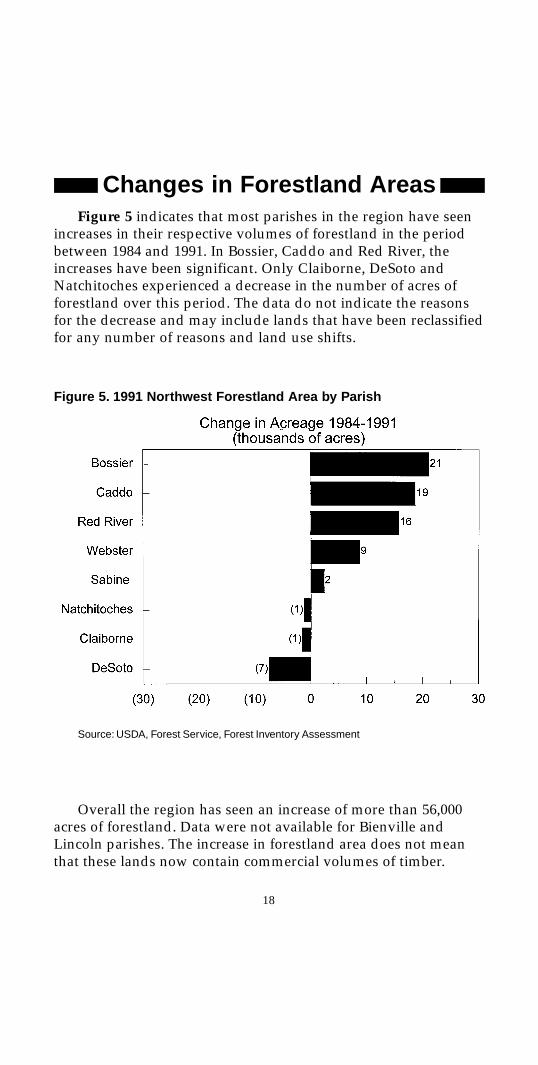
Changes in Forestland AreasFigure 5 indicates that most parishes in the region have seen
increases in their respective volumes of forestland in the periodbetween 1984 and 1991. In Bossier, Caddo and Red River, theincreases have been significant. Only Claiborne, DeSoto andNatchitoches experienced a decrease in the number of acres offorestland over this period. The data do not indicate the reasonsfor the decrease and may include lands that have been reclassifiedfor any number of reasons and land use shifts.
Figure 5. 1991 Northwest Forestland Area by Parish
Overall the region has seen an increase of more than 56,000acres of forestland. Data were not available for Bienville andLincoln parishes. The increase in forestland area does not meanthat these lands now contain commercial volumes of timber.
Source: USDA, Forest Service, Forest Inventory Assessment
19
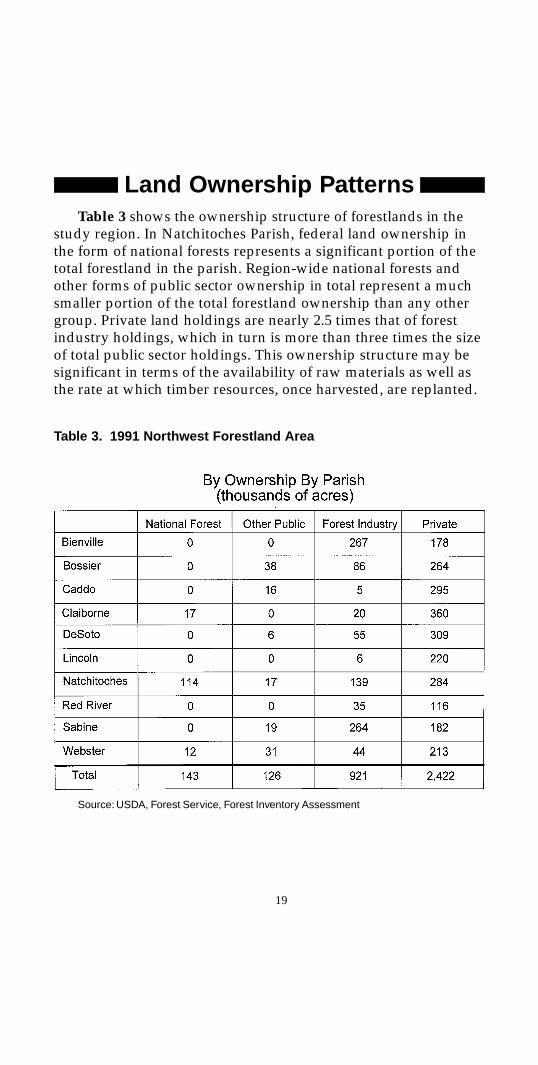
Land Ownership PatternsTable 3 shows the ownership structure of forestlands in the
study region. In Natchitoches Parish, federal land ownership inthe form of national forests represents a significant portion of thetotal forestland in the parish. Region-wide national forests andother forms of public sector ownership in total represent a muchsmaller portion of the total forestland ownership than any othergroup. Private land holdings are nearly 2.5 times that of forestindustry holdings, which in turn is more than three times the sizeof total public sector holdings. This ownership structure may besignificant in terms of the availability of raw materials as well asthe rate at which timber resources, once harvested, are replanted.
Table 3. 1991 Northwest Forestland Area
Source: USDA, Forest Service, Forest Inventory Assessment
20
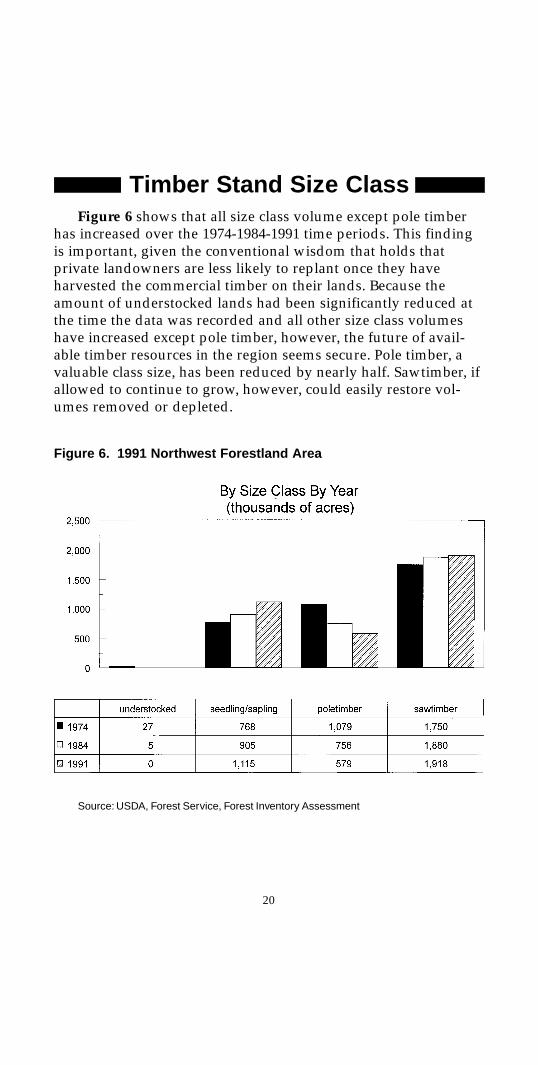
Timber Stand Size ClassFigure 6 shows that all size class volume except pole timber
has increased over the 1974-1984-1991 time periods. This findingis important, given the conventional wisdom that holds thatprivate landowners are less likely to replant once they haveharvested the commercial timber on their lands. Because theamount of understocked lands had been significantly reduced atthe time the data was recorded and all other size class volumeshave increased except pole timber, however, the future of avail-able timber resources in the region seems secure. Pole timber, avaluable class size, has been reduced by nearly half. Sawtimber, ifallowed to continue to grow, however, could easily restore vol-umes removed or depleted.
Figure 6. 1991 Northwest Forestland Area
Source: USDA, Forest Service, Forest Inventory Assessment
21
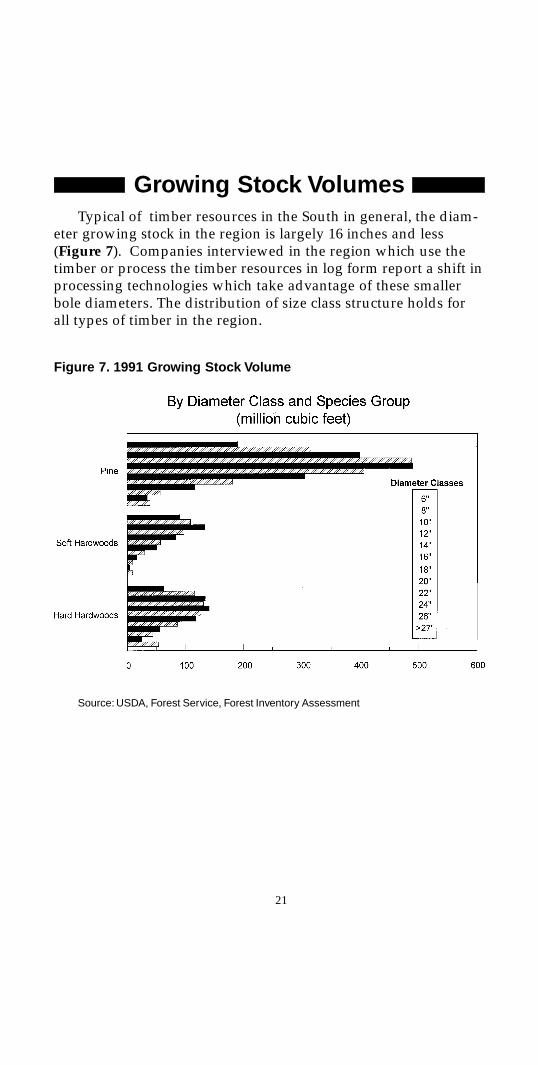
Growing Stock VolumesTypical of timber resources in the South in general, the diam-
eter growing stock in the region is largely 16 inches and less(Figure 7). Companies interviewed in the region which use thetimber or process the timber resources in log form report a shift inprocessing technologies which take advantage of these smallerbole diameters. The distribution of size class structure holds forall types of timber in the region.
Figure 7. 1991 Growing Stock Volume
Source: USDA, Forest Service, Forest Inventory Assessment
22
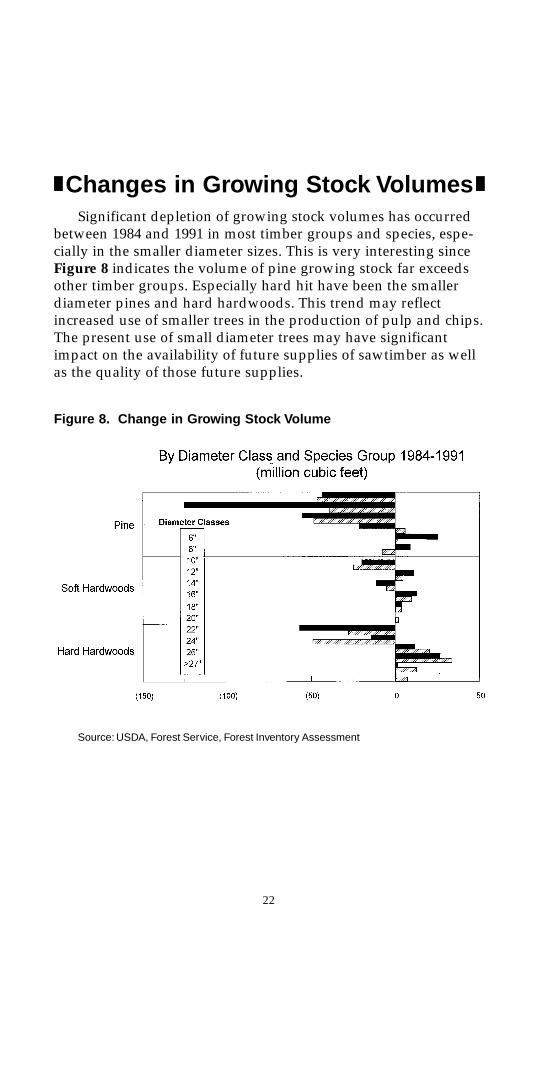
Changes in Growing Stock VolumesSignificant depletion of growing stock volumes has occurred
between 1984 and 1991 in most timber groups and species, espe-cially in the smaller diameter sizes. This is very interesting sinceFigure 8 indicates the volume of pine growing stock far exceedsother timber groups. Especially hard hit have been the smallerdiameter pines and hard hardwoods. This trend may reflectincreased use of smaller trees in the production of pulp and chips.The present use of small diameter trees may have significantimpact on the availability of future supplies of sawtimber as wellas the quality of those future supplies.
Figure 8. Change in Growing Stock Volume
Source: USDA, Forest Service, Forest Inventory Assessment

23
Figure 9 provides further evidence of the depletion of smalldiameter softwood resources from 1984 through 1991. Virtually allsize classification volumes have been reduced. The current rate ofharvesting is reported by most companies interviewed to con-tinue for the foreseeable future. These managers all felt therewould be ample supplies of materials, yet no concrete evidence ofthis was offered by anyone interviewed. Interestingly, one largeproducer of veneered panel products in the region has recentlyclosed down one operation, citing competition for scarce re-sources as the reason for closing the plant. The same company,however, has announced the closed plant will be used in anothersecondary processing application.
Figure 9. Change in PINE Growing Stock Volume
Source: USDA, Forest Service, Forest Inventory Assessment
24
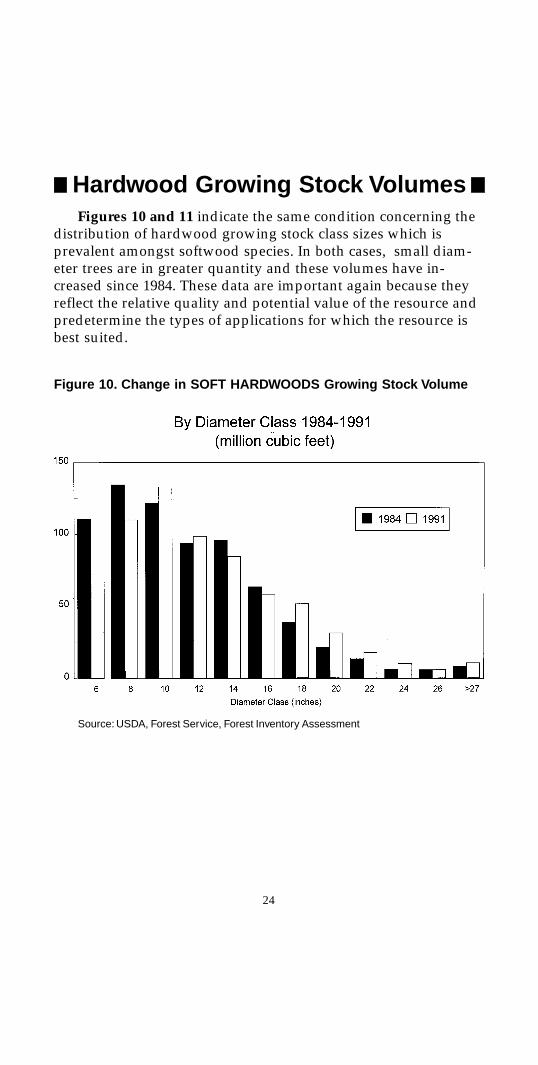
Hardwood Growing Stock VolumesFigures 10 and 11 indicate the same condition concerning the
distribution of hardwood growing stock class sizes which isprevalent amongst softwood species. In both cases, small diam-eter trees are in greater quantity and these volumes have in-creased since 1984. These data are important again because theyreflect the relative quality and potential value of the resource andpredetermine the types of applications for which the resource isbest suited.
Figure 10. Change in SOFT HARDWOODS Growing Stock Volume
Source: USDA, Forest Service, Forest Inventory Assessment
25
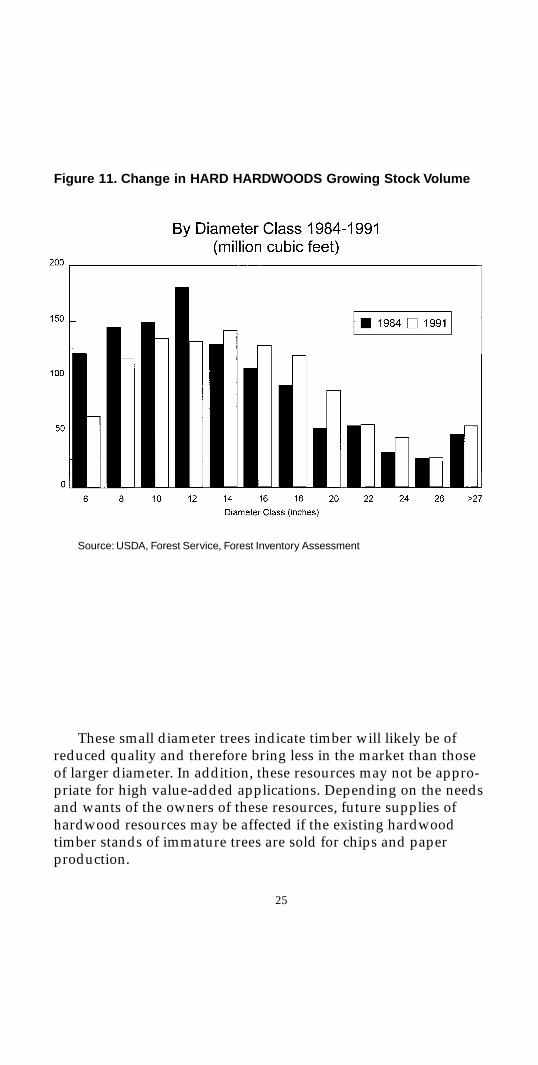
Figure 11. Change in HARD HARDWOODS Growing Stock Volume
These small diameter trees indicate timber will likely be ofreduced quality and therefore bring less in the market than thoseof larger diameter. In addition, these resources may not be appro-priate for high value-added applications. Depending on the needsand wants of the owners of these resources, future supplies ofhardwood resources may be affected if the existing hardwoodtimber stands of immature trees are sold for chips and paperproduction.
Source: USDA, Forest Service, Forest Inventory Assessment
26
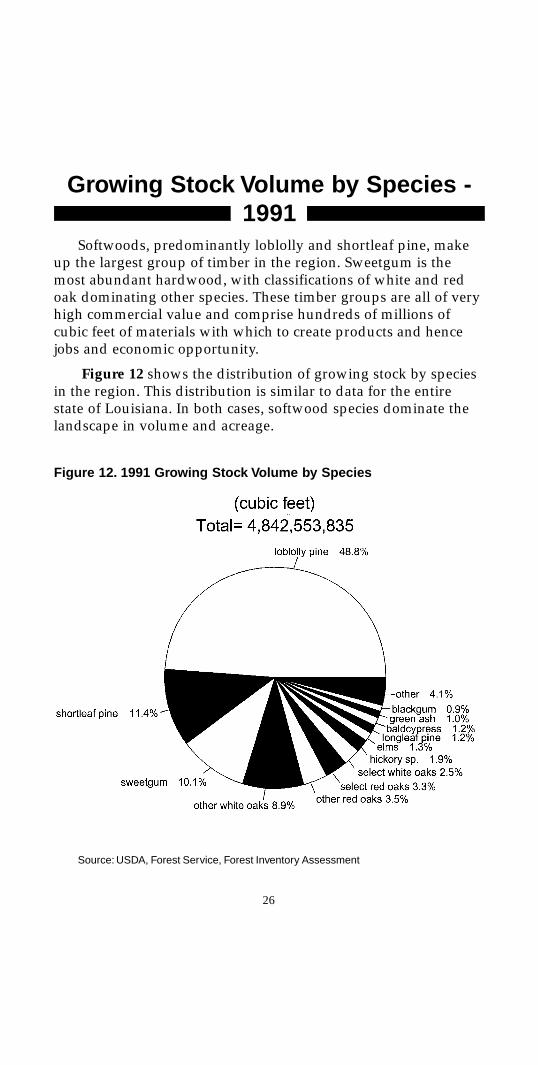
Growing Stock Volume by Species -1991
Softwoods, predominantly loblolly and shortleaf pine, makeup the largest group of timber in the region. Sweetgum is themost abundant hardwood, with classifications of white and redoak dominating other species. These timber groups are all of veryhigh commercial value and comprise hundreds of millions ofcubic feet of materials with which to create products and hencejobs and economic opportunity.
Figure 12 shows the distribution of growing stock by speciesin the region. This distribution is similar to data for the entirestate of Louisiana. In both cases, softwood species dominate thelandscape in volume and acreage.
Figure 12. 1991 Growing Stock Volume by Species
Source: USDA, Forest Service, Forest Inventory Assessment
27
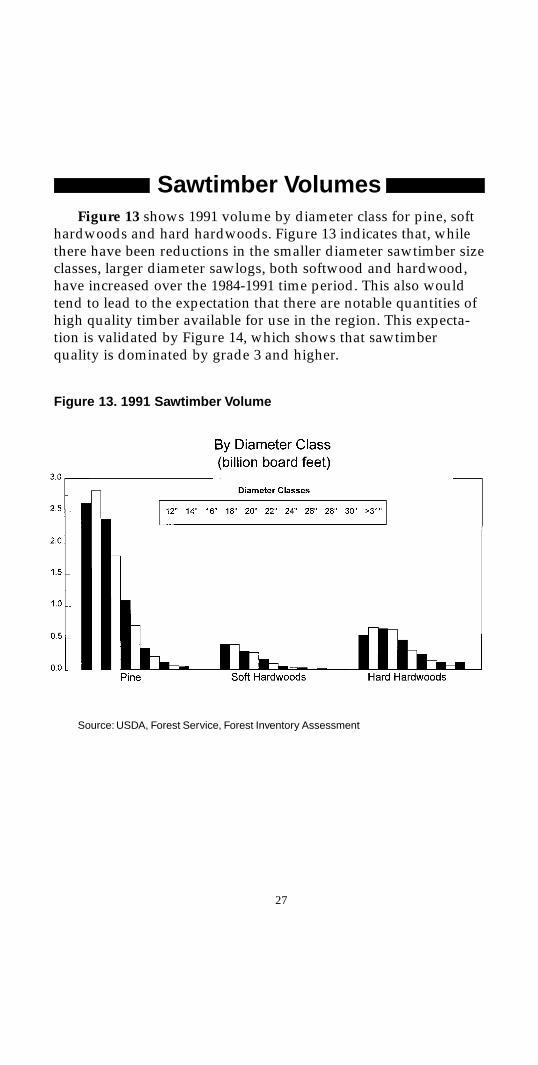
Sawtimber VolumesFigure 13 shows 1991 volume by diameter class for pine, soft
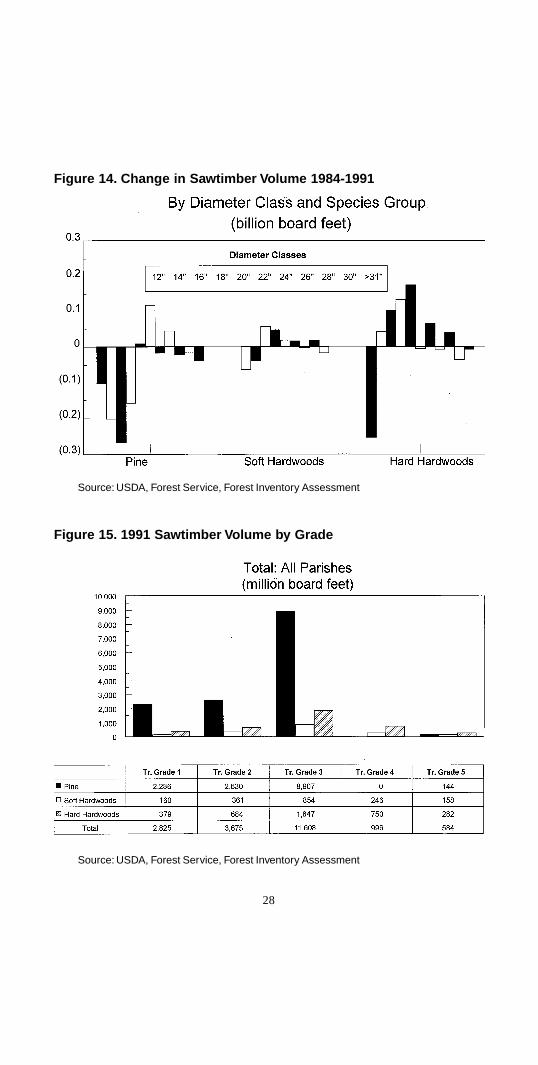
hardwoods and hard hardwoods. Figure 13 indicates that, whilethere have been reductions in the smaller diameter sawtimber sizeclasses, larger diameter sawlogs, both softwood and hardwood,have increased over the 1984-1991 time period. This also wouldtend to lead to the expectation that there are notable quantities ofhigh quality timber available for use in the region. This expecta-tion is validated by Figure 14, which shows that sawtimberquality is dominated by grade 3 and higher.
Figure 13. 1991 Sawtimber Volume
Source: USDA, Forest Service, Forest Inventory Assessment
28
Figure 14. Change in Sawtimber Volume 1984-1991
Figure 15. 1991 Sawtimber Volume by Grade
Source: USDA, Forest Service, Forest Inventory Assessment
Source: USDA, Forest Service, Forest Inventory Assessment
29
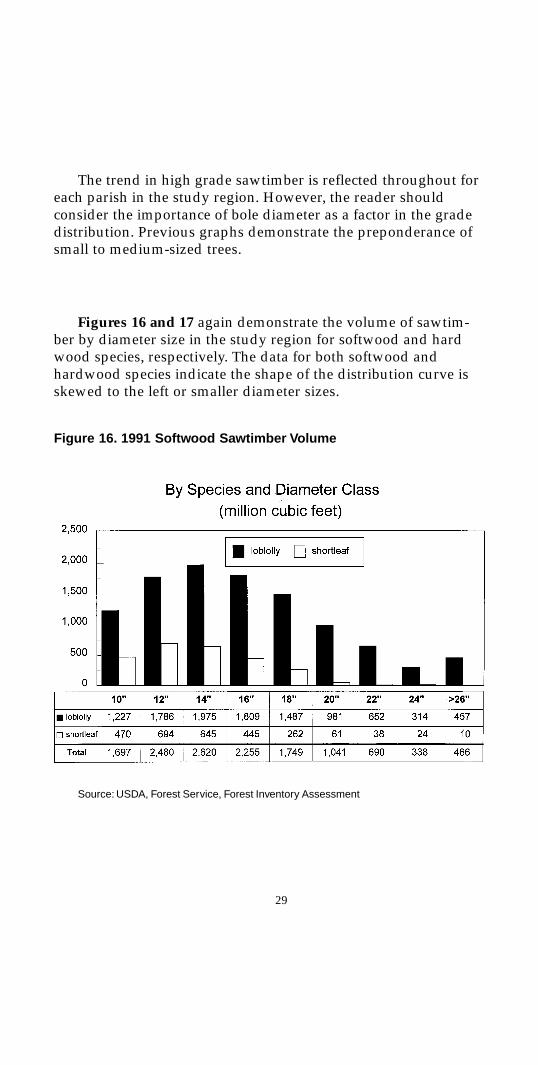
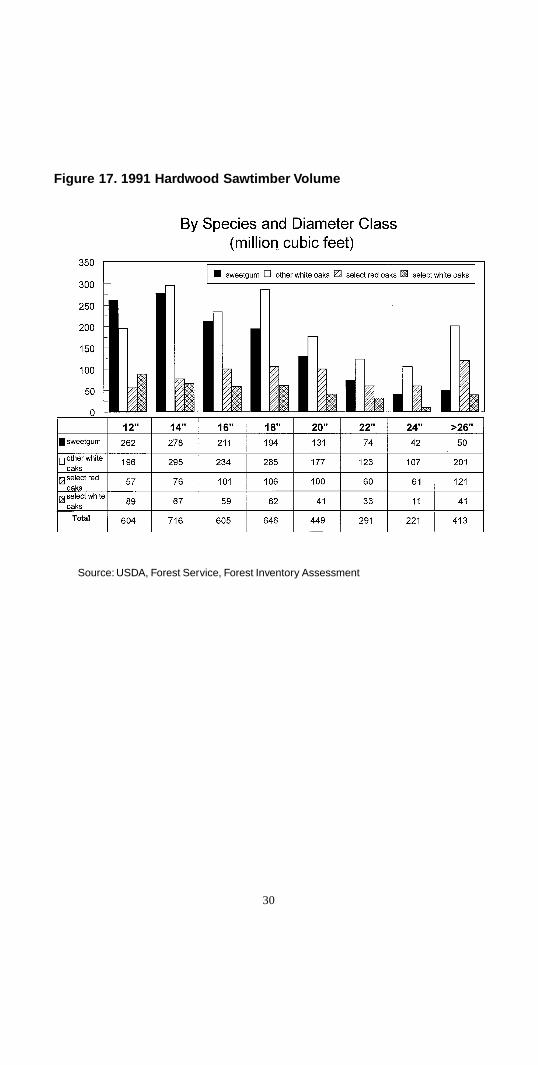
Figures 16 and 17 again demonstrate the volume of sawtim-ber by diameter size in the study region for softwood and hardwood species, respectively. The data for both softwood andhardwood species indicate the shape of the distribution curve isskewed to the left or smaller diameter sizes.
Figure 16. 1991 Softwood Sawtimber Volume
The trend in high grade sawtimber is reflected throughout foreach parish in the study region. However, the reader shouldconsider the importance of bole diameter as a factor in the gradedistribution. Previous graphs demonstrate the preponderance ofsmall to medium-sized trees.
Source: USDA, Forest Service, Forest Inventory Assessment
30
Figure 17. 1991 Hardwood Sawtimber Volume
Source: USDA, Forest Service, Forest Inventory Assessment
31
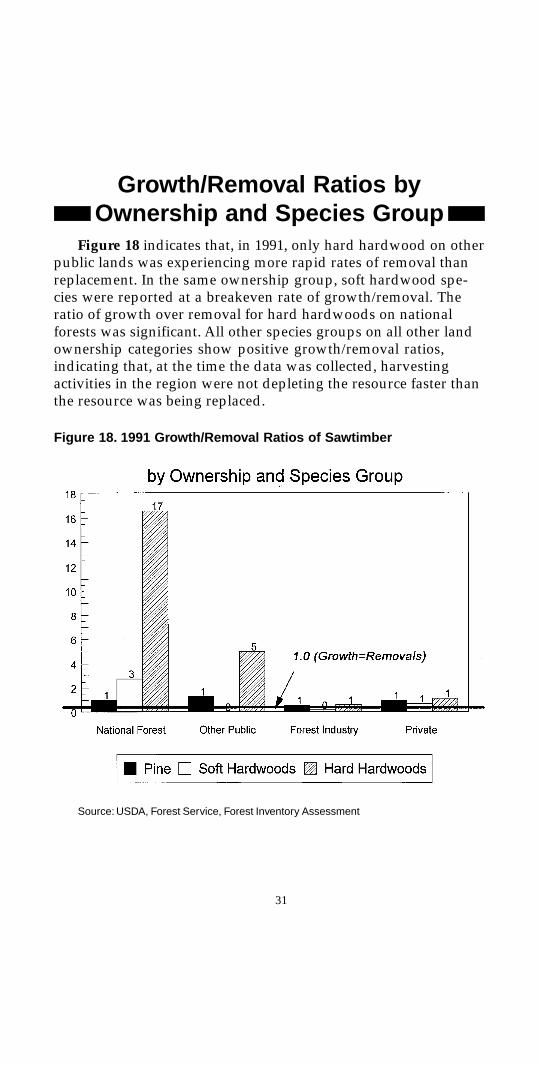
Figure 18. 1991 Growth/Removal Ratios of Sawtimber
Growth/Removal Ratios byOwnership and Species Group
Figure 18 indicates that, in 1991, only hard hardwood on otherpublic lands was experiencing more rapid rates of removal thanreplacement. In the same ownership group, soft hardwood spe-cies were reported at a breakeven rate of growth/removal. Theratio of growth over removal for hard hardwoods on nationalforests was significant. All other species groups on all other landownership categories show positive growth/removal ratios,indicating that, at the time the data was collected, harvestingactivities in the region were not depleting the resource faster thanthe resource was being replaced.
Source: USDA, Forest Service, Forest Inventory Assessment
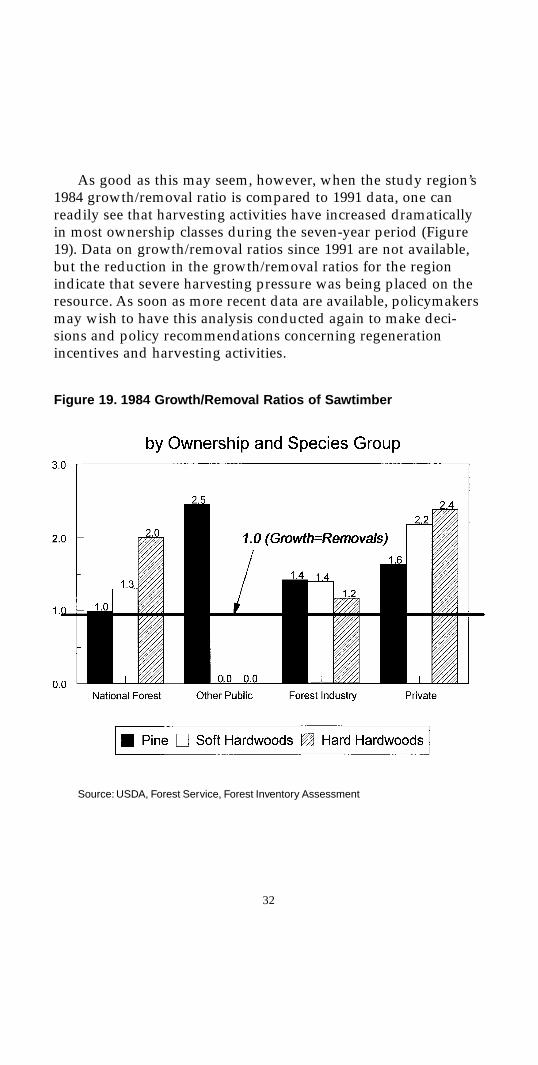
32
As good as this may seem, however, when the study region’s1984 growth/removal ratio is compared to 1991 data, one canreadily see that harvesting activities have increased dramaticallyin most ownership classes during the seven-year period (Figure19). Data on growth/removal ratios since 1991 are not available,but the reduction in the growth/removal ratios for the regionindicate that severe harvesting pressure was being placed on theresource. As soon as more recent data are available, policymakersmay wish to have this analysis conducted again to make deci-sions and policy recommendations concerning regenerationincentives and harvesting activities.
Figure 19. 1984 Growth/Removal Ratios of Sawtimber
Source: USDA, Forest Service, Forest Inventory Assessment
33
Resources Assessment SummaryThe data indicate a wide variety of raw materials in the region
and significant commercial quantities. The distribution of treesizes is heavily skewed to smaller diameter trees, indicating thattimber processing industries in the region must implementtechnologies that can use small diameter trees. Many companyrepresentatives participating in this study indicated that there is atrend in the industry toward that end.
Private non-forest industry landowners make up most of theland ownership structure in the region. This is a crucial factor,because it could have significant impact on the availability of rawmaterials, how and to whom these raw materials are sold, and theamount and distribution of regeneration of timber resources onthese lands.
The data clearly indicate the study region contains significantquantities of commercial softwood and hardwood timber of suchquantity and quality as to represent an important economicdevelopment opportunity and ample supplies for further devel-opment of the secondary forest products industry.
Companies in the region produce a wide variety of productsfrom the resource base and distribute these products around theworld. In addition to using raw materials from within the region,these companies also import raw materials from adjacent statesand parishes to manufacture products for industrial, commercial,and end user markets.
34
ReferencesFaulkner, Gary, Jim Gober, Jim Hyland, Ken Muehlenfeld, Steve
Nix, Pat Waldrop and DeWayne Weldon, 1995. Forestsof the South. Southern Forest Based EconomicDevelopment Council. June.
Harding, O. Victor and W. Ramsay Smith, 1995. Woods ofLouisiana. Louisiana Cooperative Extension Service,Louisiana Forest Products Laboratory, Louisiana StateUniversity Agricultural Center, Baton Rouge, La.
Jones, Stephen B. and Mary Carol Koester.1989. Evaluation ofState and Interstate Programs to Encourage ForestResource Based Economic Development, College ofForestry, Pennsylvania State University. UniversityPark, Pa.
LeJuene, Cyril, 1995. Associate State Forester. PersonalCommunication. Louisiana Department of Agricultureand Forestry.
Quarterly Report of Forest Products, 1985 - 1994. LouisianaDepartment of Agriculture and Forestry.
Rosson, James F. Jr. 1995. Forest Resources of Louisiana, 1991.USDA Forest Service. Resource Bulletin SO-192.Southern Forest Experiment Station. New Orleans, La.
Skog, Kenneth. 1991. Supporting Rural Wood Industry ThroughTimber Utilization Research. Research Paper FPL-RP-506. U.S. Department of Agriculture, Forest Service,Forest Products Laboratory, Madison, Wisc.
Syme, John H. and Charles R. Duke. 1991. Forest ProductsResearch Initiative for Abbeville and McCormickCounties in South Carolina. Final Report to theSavannah Valley Authority. Clemson University.December.
35
U.S. Census Bureau, U.S. Dept. of Commerce, 1995. 1992 Censusof Manufacturers. MA24T - Lumber Production andMill Stock. August.
USDA. Forest Service. 1991. Resource Bulletin SO-165.Washington, DC.
USDA. Forest Service. 1991. Forest Inventory Analysis (FIA).Washington, DC.
USDA. Forest Service. 1984. Forest Inventory Analysis (FIA).Washington, DC.
Vissage, John S., Patrick E. Miller and Andrew J. Hartsell. 1992.Forest Statistics for Louisiana Parishes-1991. USDAForest Service. Resource Bulletin SO-168. SouthernForest Experiment Station. New Orleans, La.
Vlosky, Richard, N. Paul Chance, Pamela Monroe, David Hughesand Lydia Blalock. 1998. “An Integrated Market-BasedModel for Value-Added Solid Wood Products SectorEconomic Development.” Forest Products Journal.48(11/12): 29-35.
36
Louisiana Agricultural Experiment StationLSU Agricultural CenterP.O. Box 25055Baton Rouge, LA 70894-5055
Non-profit Org.U.S. Postage
PAIDPermit No. 733
Baton Rouge, LA
Richard P. Vlosky, Ph.D.Associate ProfessorForest Products MarketingSchool of Forestry, Wildlife, and FisheriesLouisiana State University Agricultural CenterBaton Rouge, LA 70803-6202
N. Paul ChancePresidentPro-Development Services, LLCLoranger, LA 70446