Embed Size (px)
Citation preview

A Sustainable Chesapeake
BETTER MODELS FOR CONSERVATION
Edited by David G. Burke and Joel E. Dunn
THE CONSERVATION FUND
The case study you have downloaded is highlighted below. Other case studies from this Chapter of A Sustainable Chesapeake: Better Models for Conservation can be individually downloaded. The editors
encourage readers to explore the entire Chapter to understand the context and sustainability principles
involved with this and other featured case studies. The full publication contains 6 Chapters in total:
Climate Change Solutions, Stream Restoration, Green Infrastructure, Incentive Driven Conservation,
Watershed Protection and Stewardship.
A Sustainable Chesapeake: Better Models for Conservation | Editors—David G. Burke and Joel E. Dunn | The Conservation Fund, 2010
CHAPTER CLIMATE CHANGE SOLUTIONS
Introduction. . . . . . . . . . . . . . . . . . . . . . . . . . . . . . . . . . . . . . . . . . . . . . . . . . . . . . . . . . . . . . . . . . . . . . . . . . . . 2
Sea Level Rise:.Maryland’s.Model.for.Adapting.to.Change. . . . . . . . . . . . . . . . . . . . . . . . . . . . . . . . . . . 3.
By Zoë P. Johnson
A Carbon Footprint Analysis and Forest Carbon Sequestration Pilot Program . . . . . . . . . . . . . . . 13.
Climate.Leadership.by.the.Maryland.Department.of.Natural.Resources.
By Zoë P. Johnson, Rich Norling and David A. Palange
A Climate Change Challenge. . . . . . . . . . . . . . . . . . . . . . . . . . . . . . . . . . . . . . . . . . . . . . . . . . . . . . . . . . . . 21.
Focusing.Public.Attention.on.Sea.Level.Rise.and.Storm.Surge.Threats.in.the.Chesapeake.Bay.
By Joel E. Dunn
1
A Sustainable Chesapeake: Better Models for Conservation 21
A C
lim
At
e C
hA
ng
e C
hA
ll
en
ge
C
limate C
han
ge S
olution
s
5
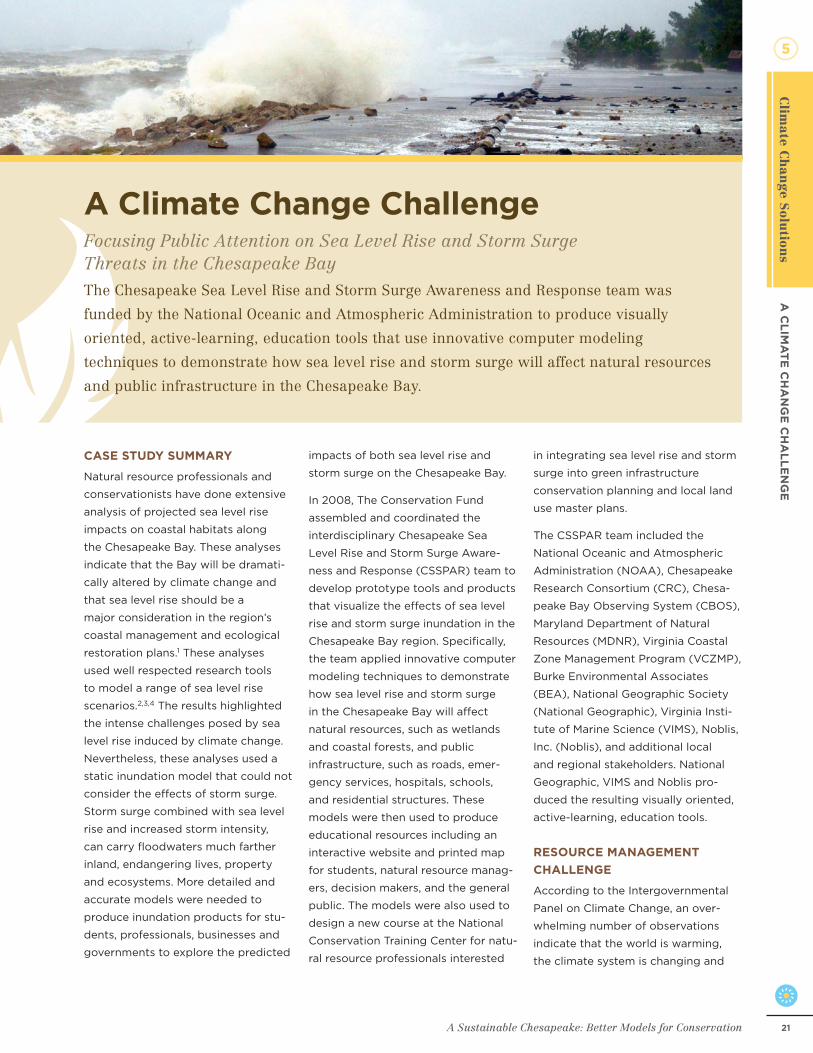
A Climate Change Challenge Focusing Public Attention on Sea Level Rise and Storm Surge Threats in the Chesapeake BayThe Chesapeake Sea Level Rise and Storm Surge Awareness and Response team was
funded by the National Oceanic and Atmospheric Administration to produce visually
oriented, active-learning, education tools that use innovative computer modeling
techniques to demonstrate how sea level rise and storm surge will affect natural resources
and public infrastructure in the Chesapeake Bay.
CAse study summAry
Natural resource professionals and
conservationists have done extensive
analysis of projected sea level rise
impacts on coastal habitats along
the Chesapeake Bay. These analyses
indicate that the Bay will be dramati-
cally altered by climate change and
that sea level rise should be a
major consideration in the region’s
coastal management and ecological
restoration plans.1 These analyses
used well respected research tools
to model a range of sea level rise
scenarios.2,3,4 The results highlighted
the intense challenges posed by sea
level rise induced by climate change.
Nevertheless, these analyses used a
static inundation model that could not
consider the effects of storm surge.
Storm surge combined with sea level
rise and increased storm intensity,
can carry floodwaters much farther
inland, endangering lives, property
and ecosystems. More detailed and
accurate models were needed to
produce inundation products for stu-
dents, professionals, businesses and
governments to explore the predicted
impacts of both sea level rise and
storm surge on the Chesapeake Bay.
In 2008, The Conservation Fund
assembled and coordinated the
interdisciplinary Chesapeake Sea
Level Rise and Storm Surge Aware-
ness and Response (CSSPAR) team to
develop prototype tools and products
that visualize the effects of sea level
rise and storm surge inundation in the
Chesapeake Bay region. Specifically,
the team applied innovative computer
modeling techniques to demonstrate
how sea level rise and storm surge
in the Chesapeake Bay will affect
natural resources, such as wetlands
and coastal forests, and public
infrastructure, such as roads, emer-
gency services, hospitals, schools,
and residential structures. These
models were then used to produce
educational resources including an
interactive website and printed map
for students, natural resource manag-
ers, decision makers, and the general
public. The models were also used to
design a new course at the National
Conservation Training Center for natu-
ral resource professionals interested
in integrating sea level rise and storm
surge into green infrastructure
conservation planning and local land
use master plans.
The CSSPAR team included the
National Oceanic and Atmospheric
Administration (NOAA), Chesapeake
Research Consortium (CRC), Chesa-
peake Bay Observing System (CBOS),
Maryland Department of Natural
Resources (MDNR), Virginia Coastal
Zone Management Program (VCZMP),
Burke Environmental Associates
(BEA), National Geographic Society
(National Geographic), Virginia Insti-
tute of Marine Science (VIMS), Noblis,
Inc. (Noblis), and additional local
and regional stakeholders. National
Geographic, VIMS and Noblis pro-
duced the resulting visually oriented,
active-learning, education tools.
resourCe mAnAgement
ChAllenge
According to the Intergovernmental
Panel on Climate Change, an over-
whelming number of observations
indicate that the world is warming,
the climate system is changing and

A Sustainable Chesapeake: Better Models for Conservation22
Bayside homes in Bowleys Quarters are surrounded by water the day after Hurricane Isabel. The six-foot storm surge generated by Hurricane Isabel caused extensive damage in this east Baltimore County community.
that these changes will be unstop-
pable for decades.5 In the ocean in
particular, changes are occurring in
global ocean heat content, salinity,
sea level, thermal expansion, water
mass evolution and biogeochemical
parameters.6 Sea level rise and storm
surge pose particularly significant
threats to the ecological health
of our nation’s estuaries, such as
Chesapeake Bay, and the economy
and safety of the surrounding com-
munities. Although there has been
coverage of sea level rise and storm
surge in the press, the knowledge
has not been available to the general
public in a tangible form that allows
for exploration of the topic, under
various plausible scenarios, to make it
more realistic for people.
The Chesapeake Bay region is one
of the most vulnerable areas in the
nation to sea level rise, trailing only
parts of Louisiana, Florida, Texas and
North Carolina in national assess-
ments.7,8,9 Several recent studies have
indicated that sea level is predicted
to rise steadily along the East coast
in the coming decades.10,11,12,13 Coinci-
dentally, the land of the Chesapeake
Bay region is also subsiding due to
rebound from the previous glacial
period, which increases the relative
rate of sea level rise. The effects of
sea level rise induced by climate
change include shoreline erosion,
coastal flooding, salt water intru-
sion of freshwater resources, and
inundation of some coastal areas. The
Chesapeake Bay has 11,684 miles of
coastline along its main body of water
and tidal tributaries, which suggests
the Bay has a large area at risk.
Relative sea level in the Bay has
risen approximately one foot in
the last century, nearly twice the
global average.14 An analysis by the
Scientific and Technical Workgroup of
the Maryland Commission on Climate
Change indicates that sea level
could rise from 0.6 to 1.3 feet (0.18
to 0.39 meters) by the middle of this
century. The analysis also states that
accelerated melting could produce a
relative sea level rise at the end of the
century from 2.7 feet (0.82 meters),
under a lower emissions scenario, to
3.4 feet (1.03 meters) under a higher
emissions scenario.15 Given the current
and predicted rates of sea level rise,
low-lying areas, such as islands,
coastal wetlands and beaches, will be
dominated by open water by 2050.16,17
Flooding from tropical storms, hur-
ricanes and nor’easters, poses a much
more immediate threat to the Bay’s
human and natural infrastructure,
particularly because these storms are
often accompanied by a storm surge.
Storm surge can devastate entire
communities, just as Katrina’s storm
surge destroyed New Orleans,18 espe-
cially if it occurs at high tide.19 Storm
surge has been a significant concern
for the Chesapeake Bay region and
was first modeled for Norfolk, Wash-
ington, and Baltimore by the United
States Army Corps of Engineers in
1959.20 The size of a storm surge
depends on atmospheric forcing,
storm path, and an area’s bathymetry
and water body shape and size.21
More recent models suggested that a
category 4 hurricane could produce
storm surges as high as 18 or 20 feet
in Baltimore at high tide.22 In 2003,
Hurricane Isabel produced a large and
memorable storm surge in the Bay,
which significantly raised the public’s
awareness of the phenomenon. With
rising levels of greenhouse gases
in the atmosphere and continued
warming, the Chesapeake Bay region
may face more powerful storms in
the future depending upon the storm
tracks.23
Climate change has become an
important topic of discussion
throughout our society, and the pub-
lic, particularly younger generations,
want to know how climate change
A Sustainable Chesapeake: Better Models for Conservation 23
A C
lim
At
e C
hA
ng
e C
hA
ll
en
ge
C
limate C
han
ge S
olution
s
5
will affect their lives and the world
around them. Although the states of
Maryland and Virginia have developed
strategies for reducing the region’s
vulnerability to climate change,24,25
the general public remains fairly
unaware of the significant potential
impacts of sea level rise and storm
surge on coastal areas. The CSSPAR
team identified a need to produce
visually oriented, education tools
that go beyond simply reading about
the phenomenon in a textbook or
in the newspaper and includes an
opportunity for active learning.
ConservAtion vision
Communities around the Chesapeake
are just beginning the process
of determining how to adapt to
projected sea level rise increases
and more severe storm surge events.
The impact of climate change on the
Chesapeake Bay is widely recognized
to be significant by institutions and
government. Members of the CSSPAR
team felt there were few reliable
and easily accessible educational
resources and training opportunities
available for students, profession-
als, businesses and government to
explore the phenomena. In response,
the CSSPAR project was created
to increase public awareness and
provide tools for vulnerability assess-
ment that will enhance community
resilience to sea level rise, storm surge
and inundation, and other biological
and physical challenges of climate
change in the Chesapeake Bay region.
implementAtion resourCes
The Conservation Fund received
a $298,000 grant from the NOAA
Climate Program Office’s Sectoral
Applications Research Program
(SARP) on behalf of the CSSPAR
team. SARP is a program designed
to support the dissemination and
exchange of climate-related research
findings critical for understanding and
addressing resource management
challenges. This funding was used by
The Conservation Fund to manage
the project and coordinate the work
of several partners. Key contractor
efforts included the work of VIMS to
produce models and land inundation
data; Noblis to convert the data into
visualizations; and National Geo-
graphic to design and produce a map
and website. The funding was also
used by The Conservation Fund to
design and conduct a climate related
green infrastructure training course.
The Conservation Fund received
an $8000 grant from the Bancroft
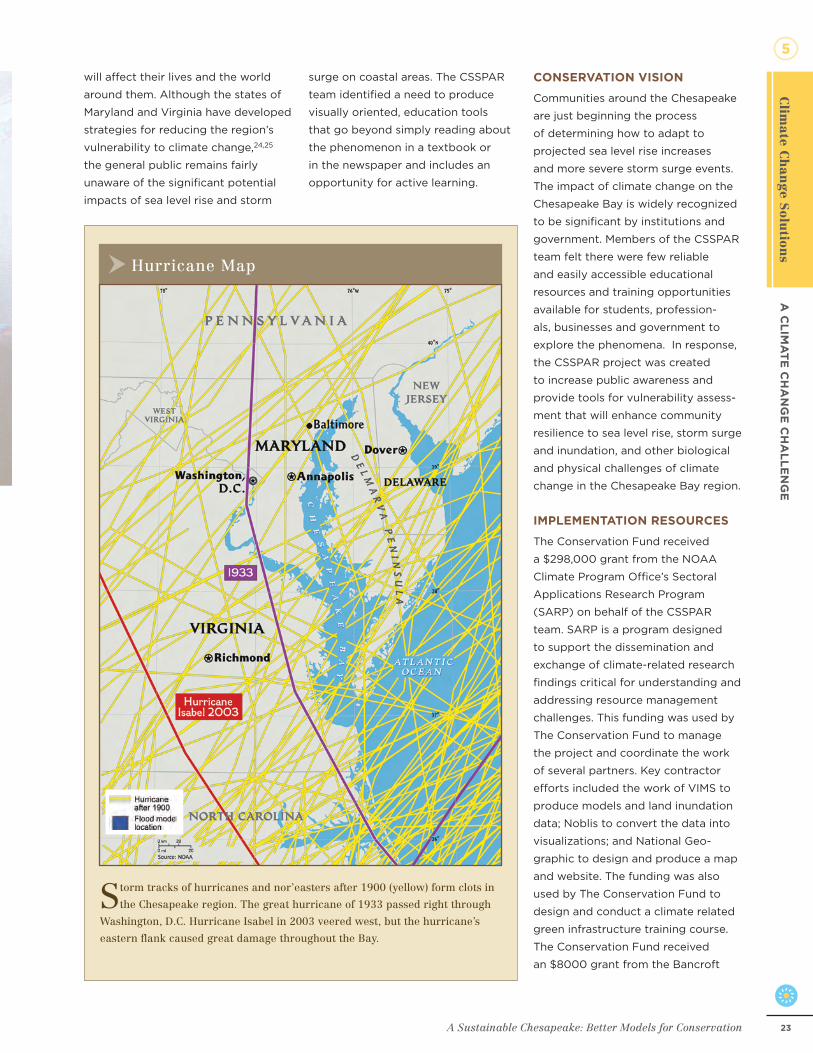
Hurricane Map
Storm tracks of hurricanes and nor’easters after 1900 (yellow) form clots in
the Chesapeake region. The great hurricane of 1933 passed right through
Washington, D.C. Hurricane Isabel in 2003 veered west, but the hurricane’s
eastern flank caused great damage throughout the Bay.

A Sustainable Chesapeake: Better Models for Conservation24
Foundation to print 25,000 copies of
the map, which will be distributed to
public high schools in Maryland and
Virginia.
ConservAtion strAtegy
The CSSPAR team felt that an
effective way to improve public
understanding of sea level rise and
storm surge was through visual
imagery and information on maps,
websites and course material for use
by the general public, planners, emer-
gency managers and policy makers.
Specific deliverables identified by the
team included: a double sided foldout
map with Bay-wide sea level rise
impacts on one side and area specific
storm surge impacts on the other
side; an interactive website where the
user can control environmental condi-
tions and storm path and intensity;
and a course where government man-
agers and planner will be trained how
to use accurate spatial information
to develop conservation strategies in
light of sea level rise and storm surge
projections.
These objectives required scientific
models capable of producing visu-
alizations of sea level rise and storm
surge that are accurate, reliable, and
show flood predictions for hurricanes
and nor’easters. Scientists had
previously produced ground breaking
models, such as the Sea Level Rise
Affecting Marshes Model (SLAMM)
and the Sea, Lake and Overland
Surges from Hurricanes (SLOSH), but
the CSSPAR team determined that
they needed higher resolution models
to produce more visually oriented
products capable of animating storm
surge and inundation at a spatial
scale of less than a city block for
the various audiences in need of the
information.
The CSSPAR team used the
Chesapeake Inundation Prediction
System (CIPS) to model the impact
of various storm surge and sea level
rise scenarios on three distinct areas
of the Chesapeake Bay. CIPS is a com-
puter modeling system that uses high
resolution atmospheric and hydro-
Upper Tidal Potomac River, Washington, D.C.
Chesapeake Inundation Prediction System (CIPS) model showing areas of DC that were inundated during Hurricane Isabel and those that would be inundated under another Isabel-like storm under various sea level rise scenarios.

A Sustainable Chesapeake: Better Models for Conservation 25
A C
lim
At
e C
hA
ng
e C
hA
ll
en
ge
C
limate C
han
ge S
olution
s
5
dynamic models; highly accurate
light detection and ranging (LIDAR)
data for fine scale topographic and
elevation references; and emerging
GIS techniques to produce flooding
forecasts for tropical cyclones and
nor’easters in the Chesapeake Bay.
CIPS was originated by organizations
involved with the Chesapeake Bay
Observing System (CBOS) to visual-
ize expected on-land storm surge
inundation along the Chesapeake Bay
and its tributaries.26 CIPS predicts
the combined effect of storm surge,
tide, and river flow inundation. The
inundation model was developed by
scientists at VIMS who build detailed
three-dimensional simulations of
storm surge and inundation.27,28,29
The output from the VIMS model is
then used by scientists at Noblis who
transform the data into GIS-based
visualizations to show water moving
onto the land and to produce fine-
scale inundation forecasts for the
Bay.30
While most scientists are confident
that sea level will rise over the next
century, the rate of relative sea level
rise varies geographically and will
be significantly affected by current
and future global greenhouse gas
emissions to the atmosphere. A high
emissions scenario, one in which
global emissions continue to increase
unabated, could result in additional
melting of glaciers, further expan-
sion of the ocean, and a change in
ocean currents, such as slowing the
North Atlantic conveyor belt, all of
which influence sea levels. For the
purpose of analytical comparison
and illustration, the CSSPAR team
chose to model four sea level rise
scenarios: 0.5, 1.0, 1.5, and 2.0 meters.
This allowed for interpretation and
consideration of some of the lower
and higher emission scenarios.
The Chesapeake region has a long
recorded history of being affected
by hurricanes and nor’easters.31
Nevertheless, the unnamed hurricane
of 1933 and hurricane Isabel of 2003
really stand out in the minds of sci-
entists. Both of these storms caused
Hampton Roads, Virginia Beach, VA
Chesapeake Inundation Prediction System (CIPS) model showing areas of Virginia Beach, including high priority green infrastructure, that were inundated during Hurricane Isabel and those that would be inundated under another Isabel-like storm given various sea level rise scenarios.

A Sustainable Chesapeake: Better Models for Conservation26
substantial damage to the region due
to high winds and storm surge. The
CSSPAR team used CIPS to model the
impact of these storms under the four
sea level rise scenarios listed above,
so that one can examine the impact
of a hurricane to the land in a world
where sea level is higher. The results
provide important visual insight to
the effects of future storm events
and a foundation for consideration of
mitigation approaches that could be
evaluated in future work to minimize
these impacts.
VIMS and Noblis used their innovative
modeling techniques to develop data
and visualizations for scenarios in
three distinct areas of the Chesapeake
Bay including:
upper tidal potomac river:h Home
to our Nation’s capital, this area
is heavily populated and contains
significant cultural resources in
low elevation areas, such as the
National Mall and associated
monuments.
hampton roads: h Hurricane storm
surge presents a significant hazard
to this highly populated region,32
which has numerous important
military installations and sev-
eral economically-critical cities for
ocean commerce.
lower eastern shore of maryland: h
Rich in wildlife, this area has
freshwater impoundments, brackish
tidal wetlands, open fields, and
mixed evergreen and deciduous
forests. This area is home to the
Blackwater National Wildlife
Refuge, sometimes referred to as
the “Everglades of the North,” and
also has the lowest elevation land
in the Bay watershed, particularly in
Dorchester County.
results
interpretive products and tools
for education: National Geographic
brought together all of the work of
the CSSPAR team and produced
visually oriented, active-learning,
education tools. National Geo-
graphic is world-renowned for their
commitment to increasing and
diffusing geographic knowledge while
promoting the conservation of the
world’s cultural, historical, and natural
resources. Their visual products have
captured the public imagination for
over 100 years – significantly influenc-
ing our cultural values and public
policies through straightforward and
effective, education.
PrintedhMap: National Geographic
and the CSSPAR team produced a
visually stunning double-sided printed
map highlighting the impacts of rising
sea level and storm surge on the
Chesapeake Bay and its surrounding
lands. The map includes text that
details: the evidence of sea level rise
and the potential impacts it will have
on natural infrastructure, built infra-
structure, and wildlife; the impacts
of potential storm surge on the three
focal areas in the Bay, and; the need
for society to prepare for and adapt
to the predicted changes. These maps
are being distributed to schools and
public officials around the Bay.
WebhResource: National Geographic
and the CSSPAR team produced
an enhanced Chesapeake Bay web
resource, with a map viewer at its
heart, summarizing potential impacts
of climate change and presenting
map layers charting sea level rise and
potential storm surge extents for the
three focal areas described above
(visit www.chesapeakeadaptation.
org). The website covers the four
major themes presented on the
printed maps and provides the user
with the means to inspect the broader
concepts using two main tools: photo-
story galleries and dynamic mapping
services.
High winds and floodwaters
brought by hurricane
Isabel caused extensive flooding
to numerous classrooms,
dormitories, athletic facilities and
main roads throughout the U.S.
Naval Academy in Annapolis,
Maryland. Hurricane Isabel,
which cost the Navy nearly $130
million in damage in the Mid-
Atlantic region, was a Category 2
storm when it made landfall near
Cape Hatteras, North Carolina,
several hundred miles south of
Annapolis.

A Sustainable Chesapeake: Better Models for Conservation 27
A C
lim
At
e C
hA
ng
e C
hA
ll
en
ge
C
limate C
han
ge S
olution
s
5
Each theme includes photo-story
galleries, presented as sets of icons
on the map, which highlight specific
points of interest related to climate
change. The dynamic mapping
services allow the user to explore
the history of hurricanes and tropical
storms in the Chesapeake Bay region,
and their impact on the natural and
built environment. The site provides
an expanded comparison of the
unnamed 1933 storm and Hurricane
Isabel of 2003, and using the sea level
rise and storm surge data models
and high resolution satellite imagery,
visualizes the potential impact of
hurricane storm surge on the three
focal areas of the Bay under various
sea level rise scenarios. The website
is the first up close and personal
look for the public at the threat to
institutions, homes, schools and other
infrastructure from projected impacts
of climate change in the Bay.
ProfessionalhTraining:hAlthough the
predicted impacts of sea level rise
and storm surge pose a severe threat
to businesses, homes and natural
and cultural landscapes, there isn’t
a safe environment for individuals
from concerned disciplines and
government sectors to explore this
difficult topic. In April of 2010, The
Conservation Fund will conduct a 2.5
day course on green infrastructure
and climate change. The course will
allow planners and decision makers
to examine the projected impacts of
sea level rise and storm surge on the
Chesapeake Bay region and its green
infrastructure. Through hands-on
class projects using data layers for
two coastal communities, and lectures
from cutting edge experts and on-
the-ground practitioners, participants
will learn and experience first-hand
the challenges of deciding what to
protect and how to protect it in the
face of rising waters and increased
storm events.
Course Objectives:
Describe green infrastructure h
concepts and principles;
Explore techniques for planning h
and designing green infrastructure
networks at the statewide, regional,
and local levels;
Identify the potential impacts of h
climate change on coastal commu-
nities and effective communication
strategies for conveying those
impacts; and
Discover how green infrastructure h
can be used to facilitate adaptation
and mitigation of potential climate
change impacts.
The course will be a collaborative
learning experience applicable to
who are engaged in land use planning
and management. The Conservation
Fund designed the course with the
assistance of several government enti-
ties in the Chesapeake Bay that have
already begun planning processes to
address the implications of sea level
rise and storm surge on their jurisdic-
tion, including the State of Maryland,
the Northern Virginia Planning District
Commission, the Hampton Roads
Planning District Commission and
NOAA.
The map, website and course will
raise awareness of climate change
throughout the Chesapeake and pro-
vide people with the inspiration and
tools needed to begin addressing this
major environmental challenge. The
overall intent is to expose the public
to the intense and complex potential
realities of these phenomena, making
it more real than theory. Children and
The National Geographic Society produced a printed map and a website (www.chesapeakeadaptation.org), which are new tools for students, planners and the general public to explore sea level rise and storm surge impacts in the Chesapeake Bay.

A Sustainable Chesapeake: Better Models for Conservation28
young adults are perhaps the most
important demographic reached
by these materials. After all, they
will be the ones grappling with the
most severe impacts and this may
be their first true exploration of the
topic, which will give these leaders of
tomorrow an advantage when they
are faced with the difficult decisions
to retreat, adapt or defend our coastal
areas.
Keys to suCCess
effective communication about cli-h
mate change. In general, scientists,
emergency managers, planners
and natural resource professionals
agree that sea level rise and storm
surge will have a significant impact
on the Chesapeake Bay. While
some may argue about the extent
of sea level rise or the frequency of
storms, few professionals deny that
the ocean is rising and that storm
intensity is increasing. Information
about the topic, particularly in
low-lying areas like the Chesapeake
Bay, needs to be presented in a
way that both professionals and the
general public can understand.
scientific innovation and partner-h
ship. Scientists at VIMS developed
highly advanced models capable of
predicting storm surge and inunda-
tion throughout the Bay much more
accurately than previous models.
The scientists partnered with Noblis
and National Geographic, who had
the special skills and experience
needed to make attractive visual-
izations of the VIMS model data.
strong partner reputation. h All of
the organizations and government
agencies involved in this project
had excellent reputations, but part-
nership with National Geographic
provided a globally recognized and
trusted lead brand.
state government support and h
information. Maryland and Virginia
provided valuable data and knowl-
edge on sea level rise and storm
surge. Partnership with the states
provided the project with strong
support and leveraged resources.
Funding from the noAA climate h
program. This project was made
possible through a grant The
Conservation Fund received from
NOAA’s climate program office.
Lower Eastern Shore, Dorchester County, MD
Chesapeake Inundation Prediction System model showing areas of Dorchester County, MD, including Blackwater National Wildlife Refuge, that were inundated during Hurricane Isabel and those that would be inundated under another Isabel-like storm given various sea level rise scenarios.

A Sustainable Chesapeake: Better Models for Conservation 29
A C
lim
At
e C
hA
ng
e C
hA
ll
en
ge
C
limate C
han
ge S
olution
s
5
photos And Figures
Page 21: Photo, Michael Pendergrass,
US Navy, Wikimedia Commons
Page 22: Photo, Crystal Payton, FEMA,
Wikimedia Commons
Page 23, 27: Figures, National
Geographic Society
Page 24, 25, 28: Figures, Barry
Stamey, Noblis, Inc.
Page 26: Photo, U.S. Navy, Wikimedia
Commons
reFerenCes
1,4,17Glick, P., J. Clough and B. Nunley.
2009. Sea-Level Rise and Coastal
Habitats in the Chesapeake Bay
Region. National Wildlife Federation,
Reston, VA. Available online at: http://
www.nwf.org/sealevelrise/chesapeake.
cfm.
2,16Larsen, C., I. Clark, G. Guntensper-
gen, D. Cahoon, V. Caruso, C. Hupp
and T. Yanosky. 2004. The Blackwater
NWR Inundation Model. Rising Sea
Level on a Low-Lying Coast: Land Use
Planning for Wetlands. U. S. Geologi-
cal Survey. Open file report 04-1302.
3Johnson, Z., R. Barlow, I. Clark, C.
Larsen and K. Miller. 2006. Worcester
County Sea Level Rise Inundation
Model. Maryland Department of
Natural Resources, Annapolis, MD.
Publication No.14-982006-166.
5IPCC. 2007. Summary for Policy-
makers. In: Solomon, S., D. Qin, M.
Manning, Z. Chen, M. Marquis, K. B.
Averyt, M. Tignor and H. L. Miller
(editors). Climate Change 2007: The
Physical Science Basis. Contribution of
Working Group I to the Fourth Assess-
ment Report of the Intergovernmental
Panel on Climate Change. Cambridge
University Press, Cambridge, United
Kingdom and New York, NY, USA.
6Bindoff, N. L., J. Willebrand, V. Artale,
A, Cazenave, J. Gregory, S. Gulev, K.
Hanawa, C. Le Quéré, S. Levitus, Y.
Nojiri, C. K. Shum, L. D. Talley and A.
Unnikrishnan. 2007. Observations:
Oceanic climate change and sea level.
In: Solomon, S., D. Qin, M. Manning,
Z. Chen, M. Marquis, K. B. Averyt,
M. Tignor and H. L. Miller (editors).
Climate Change 2007: The Physical
Science Basis. Contribution of Work-
ing Group I to the Fourth Assessment
Report of the Intergovernmental
Panel on Climate Change. Cambridge
University Press, Cambridge, United
Kingdom and New York, NY, USA.
7Titus, J. G. and M. Greene. 1989. An
overview of the nationwide impacts
of sea level rise. In: Environmental
Protection Agency. Potential Impact
of Global Climate Change on the
United States. Appendix B: Sea Level
Rise. U.S. Environmental Protection
Agency, Washington D.C. Publication
No. 230-05-89-052.
8Titus, J. G., R. A. Park, S. Letherman,
R. Weggel, M. S. Greene, M. Treehan,
S. Brown, C. Gaunt and G. Yohe. 1991.
Greenhouse effect and sea level rise:
The cost of holding back in the sea.
Coastal Management. 19(3):171-204.
9Titus J. G. and C. Richman. 2000.
Maps of lands vulnerable to sea level
rise: Modeled elevations along the
U.S. Atlantic and Gulf Coasts. Climate
Research. 18:205-228.
10Kempa, A., B. Hortona, D. Corbett,
S. Culverb, R. Edwards and O. van
de Plasschee. 2009. The relative
utility of foraminifera and diatoms
for reconstructing late Holocene sea-
level change in North Carolina, USA.
Quaternary Research. 71(1):9-21.
11Shuang-Ye W., R. Najjar and J.
Siewert. 2009. Potential impacts of
sea-level rise on the mid- and Upper-
Atlantic region of the United States.
Climatic Change. 95:121–138.
12Nash, S. 2008. Wetlands, icecaps,
unease: Sea-level rise and Mid-
Atlantic shorelines. BioScience.
58(10):919–923.
13Katsman, C., W Hazeleger, S.
Drijfhout, G. Jan van Oldenborgh and
G. Burgers. 2008. Climate scenarios
of sea level rise for the northeast
Atlantic Ocean: A study including the
effects of ocean dynamics and gravity
changes induced by ice melt. Climate
Change. 91(3-4):351-374.
14,15,23Boesch, D. F. (editor). 2008.
Global Warming and the Free State:
Comprehensive Assessment of
Climate Change Impacts in Maryland.
Report of the Scientific and Technical
Working Group of the Maryland Com-
mission on Climate Change. University
of Maryland Center for Environmental
Science, Cambridge, Maryland.
18Rosenfeld, J. 2005. The mourning
after Katrina. Bulletin of the American
Meteorological Society. 86:1555-1566.
19Glahn, B., A.Taylor, N. Kurkowski and
W. A. Shaffer. 2009. The role of the
SLOSH model in National Weather
Service storm surge forecasting.
National Weather Digest. 33(1):3-13
20Bretschneider, C. 1959. Hurricane
surge predictions for the Chesapeake
Bay. Army Corp of Engineers, Beach
Erosion Board, Office of the Chief of
Engineers. pp. 50 + appendicies.
21,26,30Stamey, B., Wang, H. V. and M.
Koterba. 2007. Predicting the next
storm surge flood. Sea Technology.
August, 10-15.
22Roylance, F. D. 2006. Perfect Storm,
Awful Floods: New Models Show
20-ft. Surge Possible, Far Above
Isabel’s. Baltimore Sun (April 30,
2006). Baltimore, MD.
24Maryland Commission on Climate
Change. 2008. Maryland Climate
Action Plan. Maryland Department
of Environment, Baltimore, Maryland.
Available online at: http://www.mde.
state.md.us/air/climatechange/index.
asp.

A Sustainable Chesapeake: Better Models for Conservation30
For more inFormAtion project Contacts Joel Dunn Coordinator, Sustainable Chesapeake Program The Conservation Fund Annapolis, MD 21403 Phone: (443) 482-2826 | Email: [email protected]
Barry Stamey Director, Strategic Collaboration Noblis, Inc. 3150 Fairview Park Drive Falls Church, VA 22042 Phone: (703) 610-1652 | Email: [email protected]
High resolution products are available for specific climate change and sea level rise planning from Noblis and the Chesapeake Inundation Predictions System partners. Please contact Barry Stamey for more information.
i
25Bryant, P. 2008. Governor’s Commis-
sion on Climate Change. Final Report:
A Climate Change Action Plan. Avail-
able online at: http://www.deq.virginia.
gov/info/climatechange.html.
27Wang H. V., J. Cho, J. Shen, and Y. P.
Wang. 2004. What has been learned
about storm surge dynamics from
Hurricane Isabel model simulations?
Hurricane Isabel in Perspective Con-
ference, November, 2004, Baltimore,
MD.
28Shen, J., Gong, W., and H. V. Wang.
2006. Water level response to 1999
hurricane Floyd in the Chesapeake
Bay. Continental Shelf Research.
26:2484-2502.
29Shen, J., Wang, H., Sisson, M., and W.
Gong. 2006. Storm tide simulation in
the Chesapeake Bay using an unstruc-
tured grid model. Estuarine, Coastal
and Shelf Science. 68(1-2):1-16.
31NOAA. 2010. Historical Hurricane
Tracks. NOAA Coastal Services Cen-
ter, Charleston, SC. Available online
at: http://csc-s-maps-q.csc.noaa.gov/
hurricanes/.
32Kleinosky, L. R., B. Yarnalw and A.
Fisher. 2007. Vulnerability of Hampton
Roads, Virginia to storm-surge
flooding and sea-level rise. Natural
Hazards. 40:43–70.
Endnote
Financial assistance for this Sector
Applications Research Program
project was provided by the Climate
Program Office of the U.S. Depart-
ment of Commerce, National Oceanic
and Atmospheric Administration
(NOAA) pursuant to NOAA Award
No. NA08OAR4310723. Technical
assistance was provided by the NOAA
Chesapeake Bay Program Office,
Annapolis, Maryland. The statements,
findings, conclusions, and recommen-
dations are those of the Chesapeake
Sea Level and Storm Surge Public
Awareness and Response research
partners and do not necessar-
ily reflect the views of NOAA, U.S.
Department of Commerce, or the U.S.
Government. U.S. DEPARTMENT OF COMMERCE
NATI
ONA
LOC
EA
NICAND ATMOSPHERIC ADMINISTRATIO
N