Embed Size (px)
Citation preview
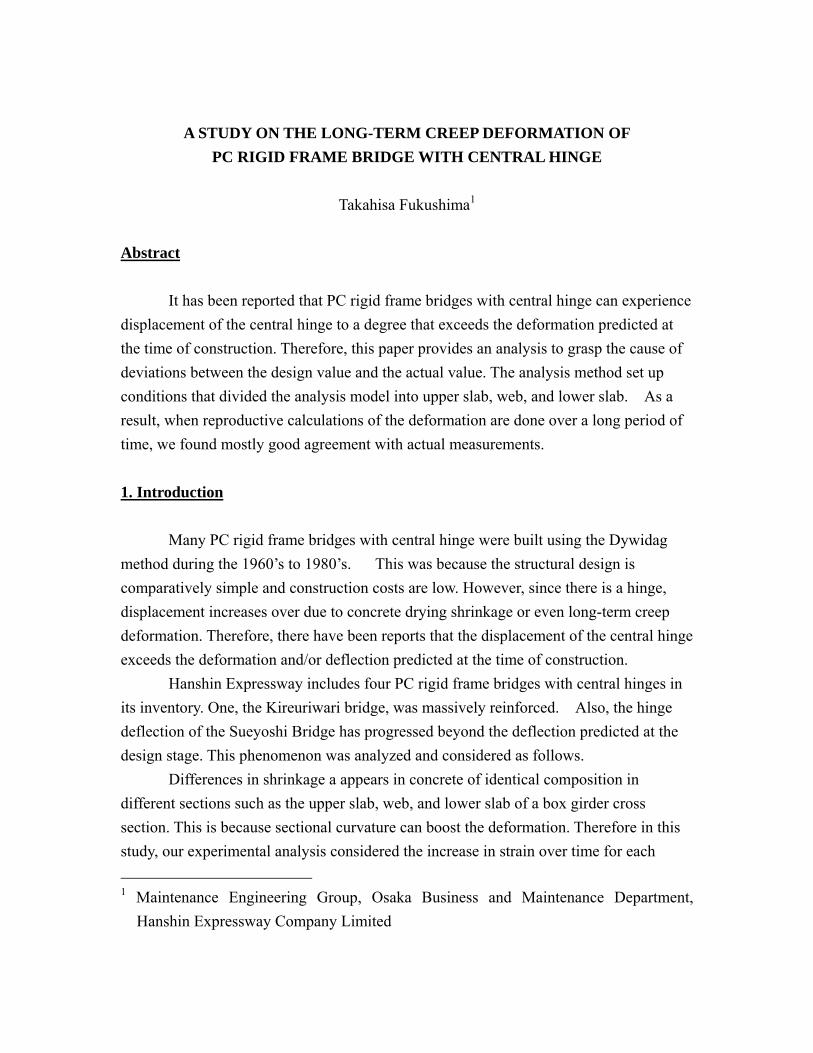
A STUDY ON THE LONG-TERM CREEP DEFORMATION OF
PC RIGID FRAME BRIDGE WITH CENTRAL HINGE
Takahisa Fukushima1
Abstract
It has been reported that PC rigid frame bridges with central hinge can experience
displacement of the central hinge to a degree that exceeds the deformation predicted at
the time of construction. Therefore, this paper provides an analysis to grasp the cause of
deviations between the design value and the actual value. The analysis method set up
conditions that divided the analysis model into upper slab, web, and lower slab. As a
result, when reproductive calculations of the deformation are done over a long period of
time, we found mostly good agreement with actual measurements.
1. Introduction
Many PC rigid frame bridges with central hinge were built using the Dywidag
method during the 1960’s to 1980’s. This was because the structural design is
comparatively simple and construction costs are low. However, since there is a hinge,
displacement increases over due to concrete drying shrinkage or even long-term creep
deformation. Therefore, there have been reports that the displacement of the central hinge
exceeds the deformation and/or deflection predicted at the time of construction.
Hanshin Expressway includes four PC rigid frame bridges with central hinges in
its inventory. One, the Kireuriwari bridge, was massively reinforced. Also, the hinge
deflection of the Sueyoshi Bridge has progressed beyond the deflection predicted at the
design stage. This phenomenon was analyzed and considered as follows.
Differences in shrinkage a appears in concrete of identical composition in
different sections such as the upper slab, web, and lower slab of a box girder cross
section. This is because sectional curvature can boost the deformation. Therefore in this
study, our experimental analysis considered the increase in strain over time for each
1 Maintenance Engineering Group, Osaka Business and Maintenance Department,
Hanshin Expressway Company Limited
factor of cross-section size, cross-section shape, relative humidity, reinforcing bar and
difference in intensity of restraint with PC steel used for upper slab, web, and lower slab.
As a result, we found that the deflection value is actually larger than what was predicted
in the design. In doing this, we gathered basic data to contribute to future maintenance
management.
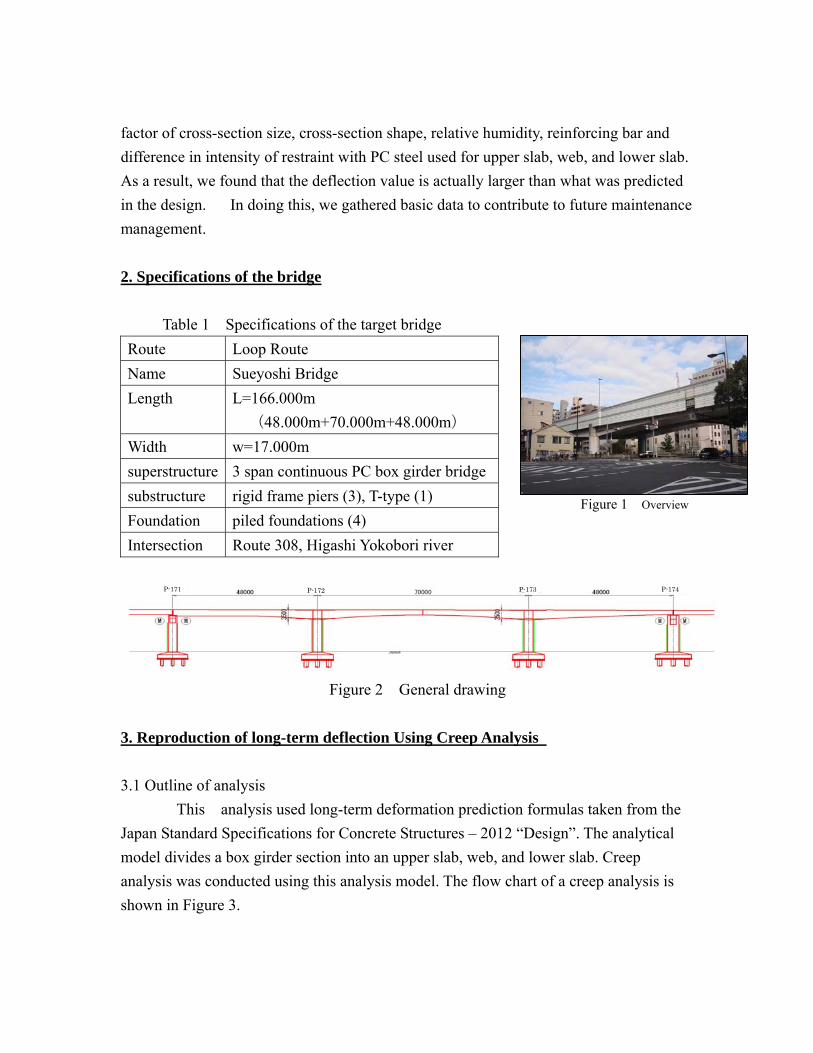
2. Specifications of the bridge
Table 1 Specifications of the target bridge
Route Loop Route
Name Sueyoshi Bridge
Length L=166.000m
(48.000m+70.000m+48.000m)
Width w=17.000m
superstructure 3 span continuous PC box girder bridge
substructure rigid frame piers (3), T-type (1)
Foundation piled foundations (4)
Intersection Route 308, Higashi Yokobori river
Figure 2 General drawing
3. Reproduction of long-term deflection Using Creep Analysis
3.1 Outline of analysis
This analysis used long-term deformation prediction formulas taken from the
Japan Standard Specifications for Concrete Structures – 2012 “Design”. The analytical
model divides a box girder section into an upper slab, web, and lower slab. Creep
analysis was conducted using this analysis model. The flow chart of a creep analysis is
shown in Figure 3.
P-171 P-172 P-173 P-174
Figure 1 Overview
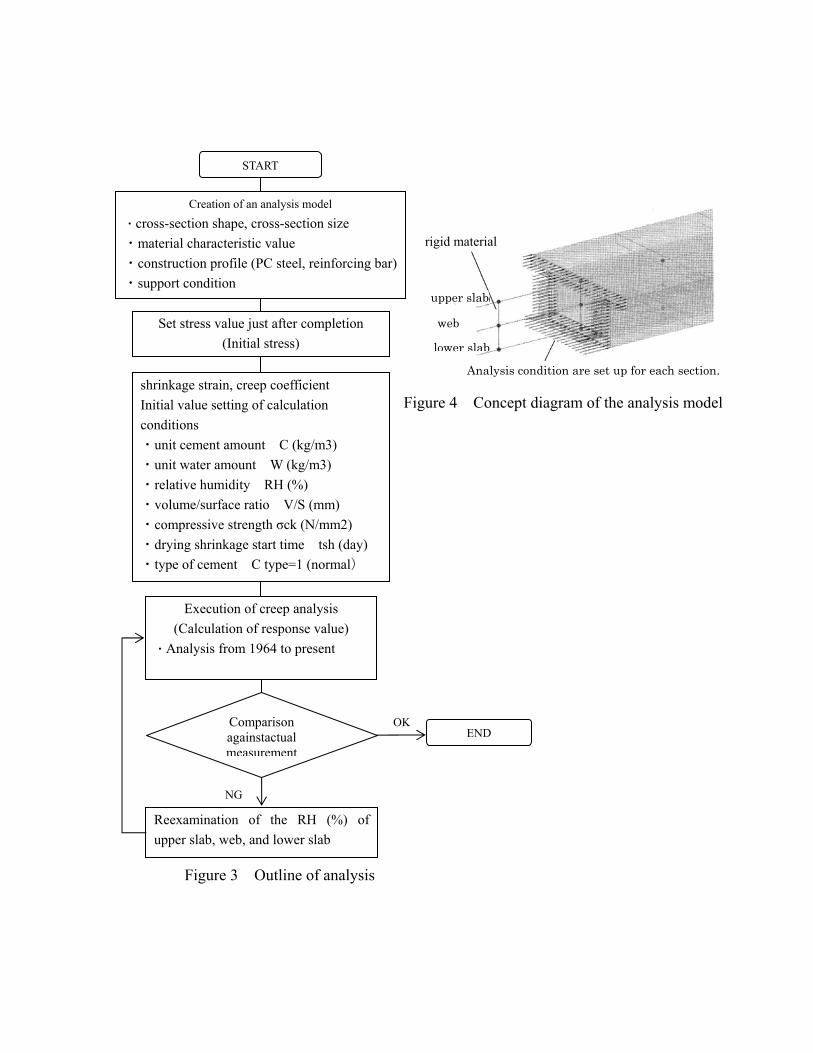
Figure 3 Outline of analysis
START
Creation of an analysis model
・cross-section shape, cross-section size
・material characteristic value
・construction profile (PC steel, reinforcing bar)
・support condition
Set stress value just after completion
(Initial stress)
shrinkage strain, creep coefficient
Initial value setting of calculation
conditions
・unit cement amount C (kg/m3)
・unit water amount W (kg/m3)
・relative humidity RH (%)
・volume/surface ratio V/S (mm)
・compressive strength σck (N/mm2)
・drying shrinkage start time tsh (day)
・type of cement C type=1 (normal)
Execution of creep analysis
(Calculation of response value)
・Analysis from 1964 to present
Comparison againstactual measurement
Reexamination of the RH (%) of
upper slab, web, and lower slab
END
NG
OK
Figure 4 Concept diagram of the analysis model
upper slab
lower slab
web
rigid material
Analysis condition are set up for each section.
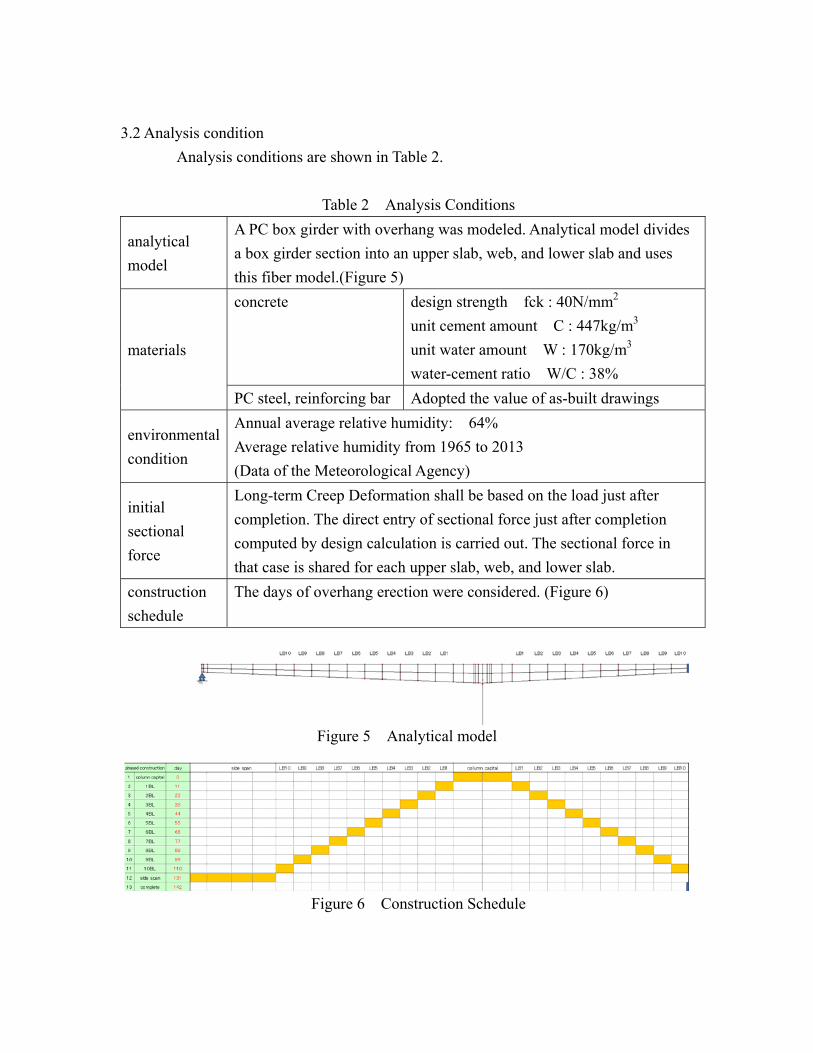
3.2 Analysis condition
Analysis conditions are shown in Table 2.
Table 2 Analysis Conditions
analytical
model
A PC box girder with overhang was modeled. Analytical model divides
a box girder section into an upper slab, web, and lower slab and uses
this fiber model.(Figure 5)
materials
concrete design strength fck : 40N/mm2
unit cement amount C : 447kg/m3
unit water amount W : 170kg/m3
water-cement ratio W/C : 38%
PC steel, reinforcing bar Adopted the value of as-built drawings
environmental
condition
Annual average relative humidity: 64%
Average relative humidity from 1965 to 2013
(Data of the Meteorological Agency)
initial
sectional
force
Long-term Creep Deformation shall be based on the load just after
completion. The direct entry of sectional force just after completion
computed by design calculation is carried out. The sectional force in
that case is shared for each upper slab, web, and lower slab.
construction
schedule
The days of overhang erection were considered. (Figure 6)
Figure 5 Analytical model
Figure 6 Construction Schedule

3.3 Long-term deformation prediction formula
This analysis targets a calculation of long-term creep deformation. Therefore,
we defined the creep coefficient and drying shrinkage progress curve for calculating the
long-term creep deformation.
3.3.1 Creep coefficient
Creep factor is calculated by the following formula. (Standard Specifications For
Concrete Structures – 2012 “Design”5.2.9 is applied)
∅ t, t′4 1 100 350
12 ′ ′ ∙ log ′ 1 ∙ 10 6 ∙ ′
(formula-1)
t:material age of the concrete at time of focus (day)
t’:material age of the concrete at time of loading (day)
W:unit water amount (kg/m3)(W≦175kg/m3)
RH:relative humidity (%)(50≦RH≦80%)
fc’(t’):compressive strength (N/mm2) at the age of t’(day)
3.3.2 Drying shrinkage strain
Shrinkage strain at the age of t(day) using the following formula.
εs′ , 0 ′ , (formula-2)
ε’ds(t,t0):drying shrinkage strain (×10-6) at the age of t’(day)
ε’as(t,ts):shrinkage strain of the concrete of a seal state from a concrete setting time to t
3.4 Creep analytical method
This analytical method evaluations allow consideration of relief from creep to
the stress which occurs for every interval. It also considers the includes one by one, the
influence of the stress fluctuation with the change of properties of matter, drying
shrinkage or curing history, temperature history to calculation. To compute stress and
strain is σ(ti+1/2) and ε(ti+1/2) at the time of ti+1/2. Therefore, this yields the following
formula.

12
12
12 1 ∅ 1
2,
12
12 1 ∅ 1
2,
1
1
ε 12
(formula-3)
In this analysis, creep analysis used formula-3.
3.5 Analysis result
3.5.1 Shrinkage strain and creeping coefficient
The change of a value to the progress day of shrinkage strain and creeping
coefficient is shown in Figure 7 and 8. The shrinkage strain has a larger ratio for large
volume/surface than for the small ratio. Creeping coefficient becomes equivalent by all
the components. This is because changes in the relative humidity is the same for all
materials.
Figure 7 Shrinkage strain
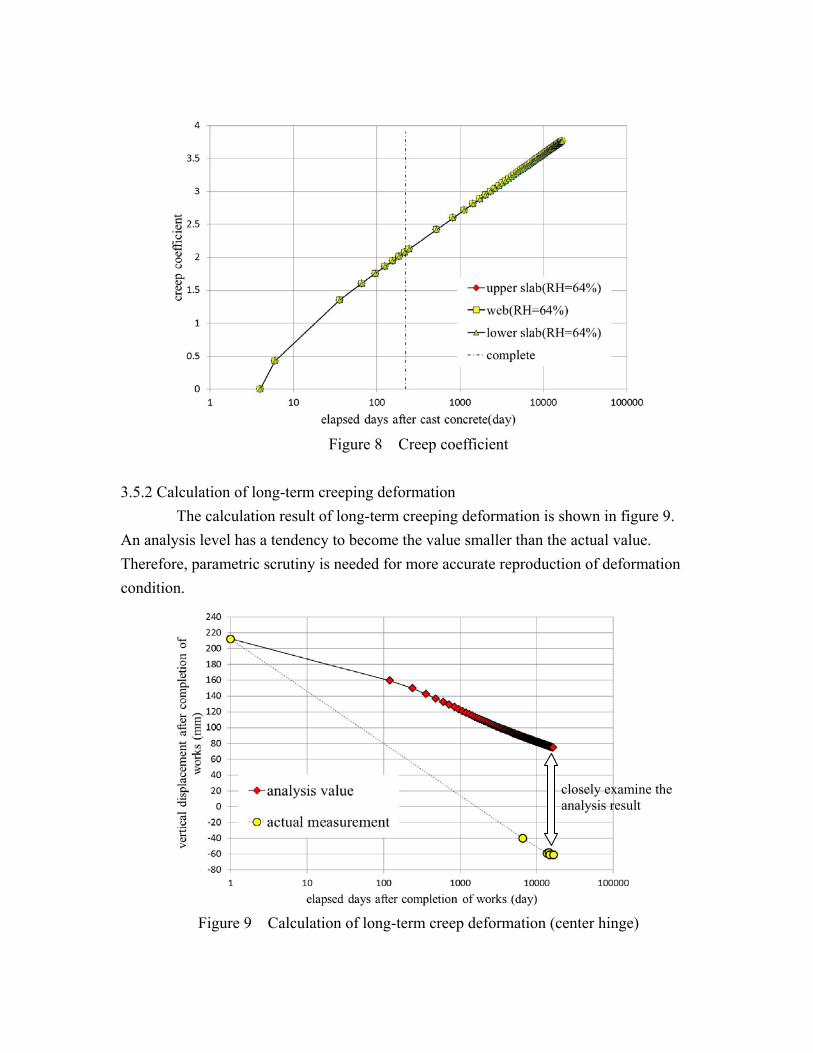
Figure 8 Creep coefficient
3.5.2 Calculation of long-term creeping deformation
The calculation result of long-term creeping deformation is shown in figure 9.
An analysis level has a tendency to become the value smaller than the actual value.
Therefore, parametric scrutiny is needed for more accurate reproduction of deformation
condition.
Figure 9 Calculation of long-term creep deformation (center hinge)
closely examine the analysis result

4. Reproduction of the long-term deflection by the creeping analysis
4.1 How to reproduce
The variable points of analysis conditions is shown in Table 3.
Table 3 How to reproduce
creep
coefficient
upper slab : It takes into consideration that moisture supply by rain
water is performed.
relative humidity : at 95%. … analysis condition (1)
drying
shrinkage
strain
According to the Standard Specifications For Concrete Structures –
2012, "In order to set contraction by dryness to 0, relative humidity is
set up to 95%." … analysis condition(2)
However, in the Specifications for Highway Bridges, εs0 becomes
about +5×10⁻⁵ with 95% of relative humidity. Therefore, drying
shrinkage strain in consideration of the moisture supply by rain water
is taken as 20% of drying shrinkage strain progress at 64% of relative
humidity (design level). … analysis condition(3) (Table 4)
post dead load Noise barrier and inspection way were built in 1994.
volume/surface
ratio
Pavement and bridge surface waterproofing were given to the upper
slab. Therefore, the set up notes that only the underneath surface of
upper slab is exposed to the air. … analysis condition (4)
Table 4 Value of εso by the environmental condition
(Specifications for Highway Bridges table-2.2.3)
environmental condition
εs0
In the water -10×10-5
RH 90% +10×10-5
RH 70% +25×10-5
RH 40% +50×10-5
4.2 Analysis result
4.2.1 Shrinkage strain and creep coefficient
The change of a value to the progress day of shrinkage strain and creep
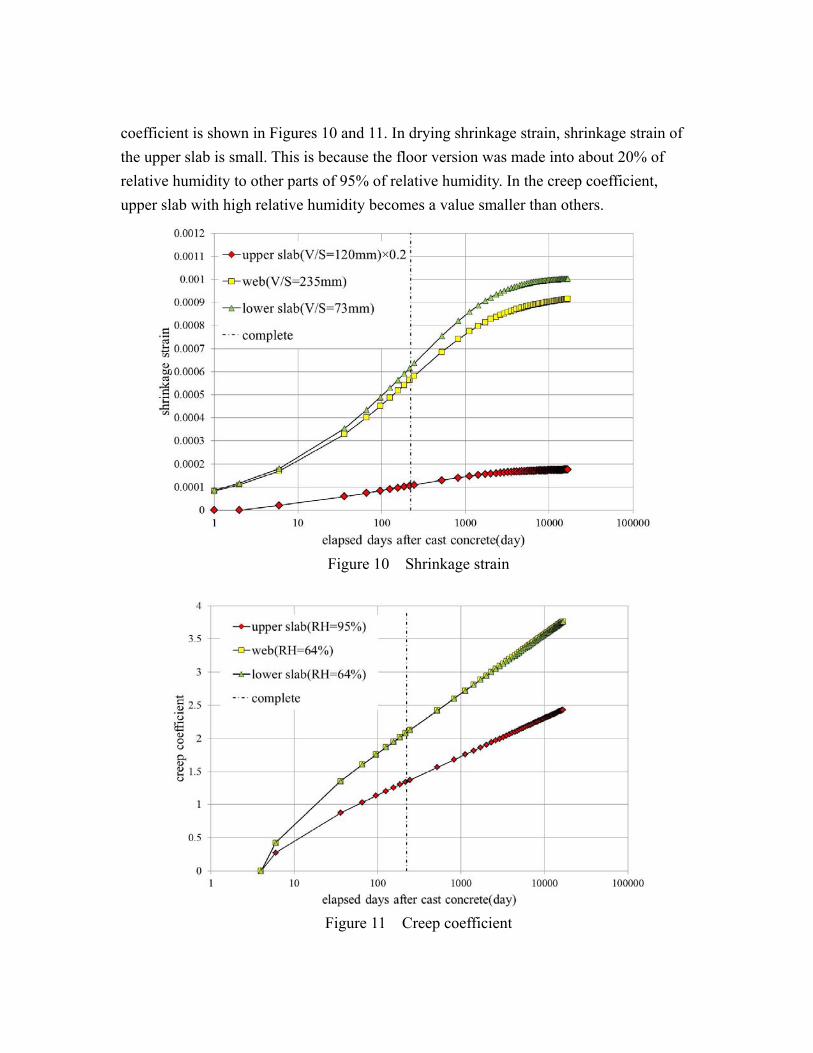
coefficient is shown in Figures 10 and 11. In drying shrinkage strain, shrinkage strain of
the upper slab is small. This is because the floor version was made into about 20% of
relative humidity to other parts of 95% of relative humidity. In the creep coefficient,
upper slab with high relative humidity becomes a value smaller than others.
Figure 10 Shrinkage strain
Figure 11 Creep coefficient
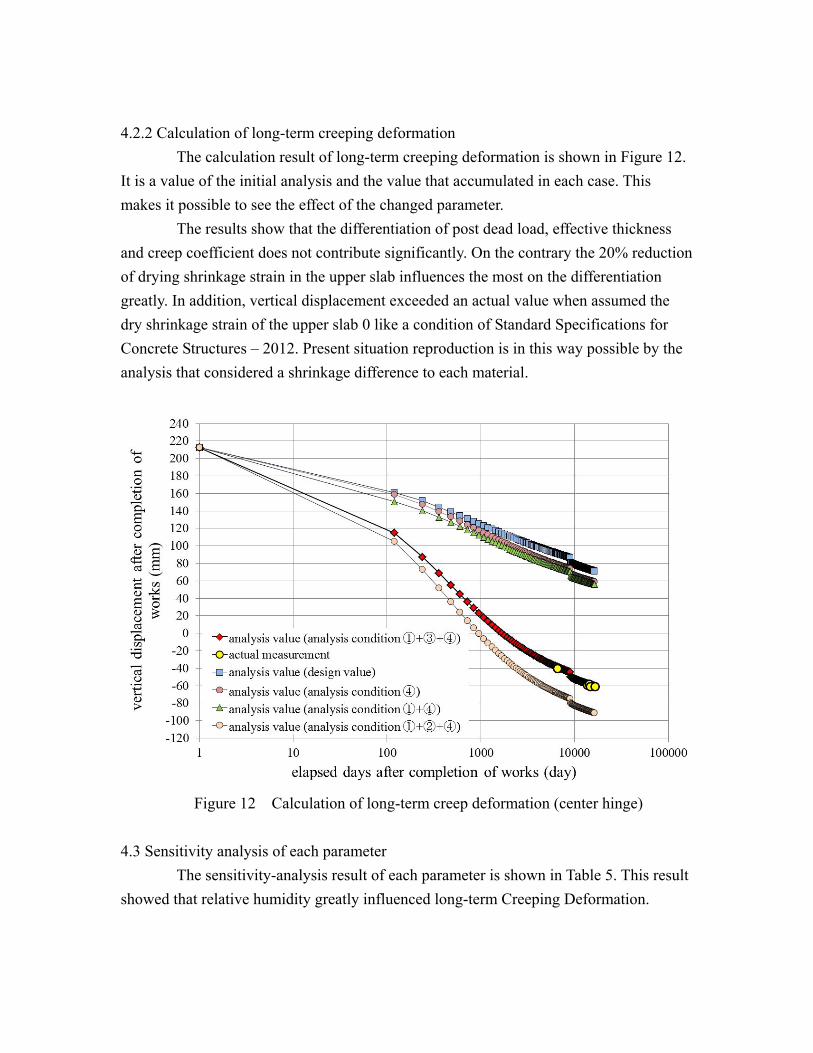
4.2.2 Calculation of long-term creeping deformation
The calculation result of long-term creeping deformation is shown in Figure 12.
It is a value of the initial analysis and the value that accumulated in each case. This
makes it possible to see the effect of the changed parameter.
The results show that the differentiation of post dead load, effective thickness
and creep coefficient does not contribute significantly. On the contrary the 20% reduction
of drying shrinkage strain in the upper slab influences the most on the differentiation
greatly. In addition, vertical displacement exceeded an actual value when assumed the
dry shrinkage strain of the upper slab 0 like a condition of Standard Specifications for
Concrete Structures – 2012. Present situation reproduction is in this way possible by the
analysis that considered a shrinkage difference to each material.
Figure 12 Calculation of long-term creep deformation (center hinge)
4.3 Sensitivity analysis of each parameter
The sensitivity-analysis result of each parameter is shown in Table 5. This result
showed that relative humidity greatly influenced long-term Creeping Deformation.
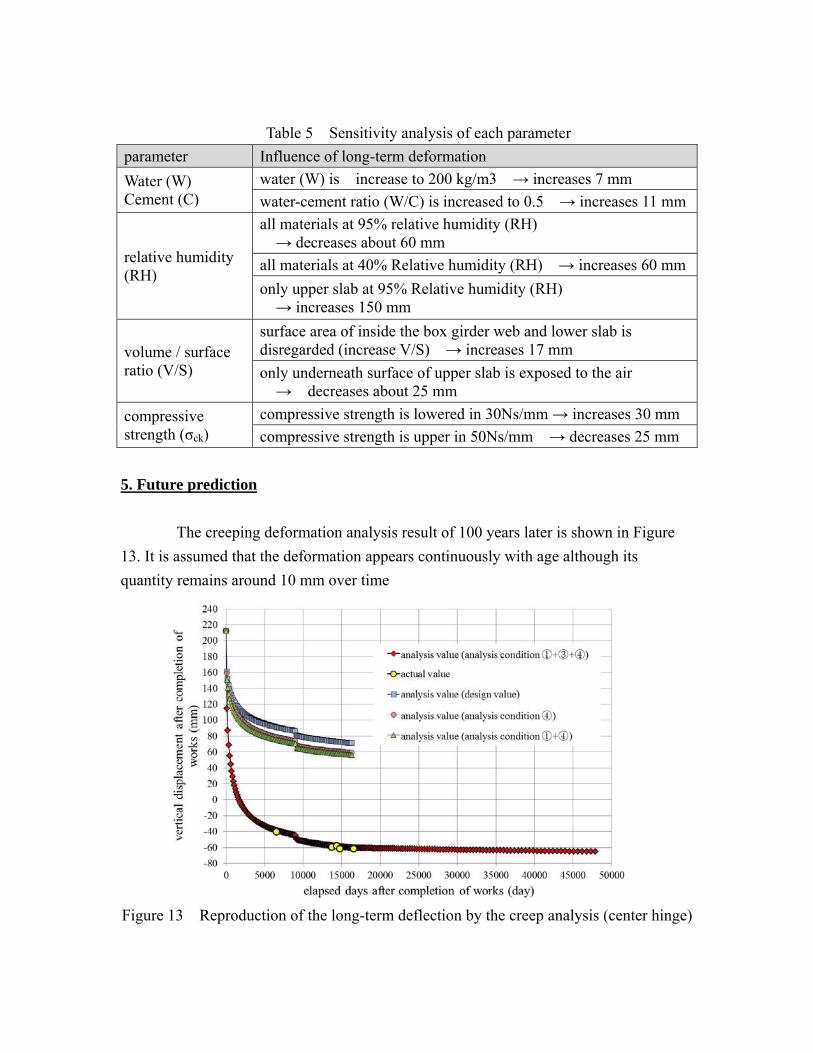
Table 5 Sensitivity analysis of each parameter
parameter Influence of long-term deformation
Water (W) Cement (C)
water (W) is increase to 200 kg/m3 → increases 7 mm
water-cement ratio (W/C) is increased to 0.5 → increases 11 mm
relative humidity (RH)
all materials at 95% relative humidity (RH) → decreases about 60 mm
all materials at 40% Relative humidity (RH) → increases 60 mm
only upper slab at 95% Relative humidity (RH) → increases 150 mm
volume / surface ratio (V/S)
surface area of inside the box girder web and lower slab is disregarded (increase V/S) → increases 17 mm
only underneath surface of upper slab is exposed to the air → decreases about 25 mm
compressive strength (σck)
compressive strength is lowered in 30Ns/mm → increases 30 mm
compressive strength is upper in 50Ns/mm → decreases 25 mm
5. Future prediction
The creeping deformation analysis result of 100 years later is shown in Figure
13. It is assumed that the deformation appears continuously with age although its
quantity remains around 10 mm over time
Figure 13 Reproduction of the long-term deflection by the creep analysis (center hinge)

6. Conclusion
Creep analysis conducted with new knowledge was performed on the Sueyoshi
bridge. When reproductive calculations of the deformation were carried out for long
period of time, we confirmed mostly good agreement with actual measurement findings.
・The deformation continues if long-term deformation prediction formula is used based
on Standard Specifications for Concrete Structures – 2012 “Design” from prediction
relation used conventionally over an extended period .
・The Analysis model divided box girder sections into an upper slab, web, and lower
slab. The deformation in agreement with the actual measurement by the analysis which
considered material specific shrinkage differences.
・Pavement and bridge surface waterproofing are applied on the upper slab. Therefore,
the upper slab is different from the web and lower slab in environmental condition. By
considering relative humidity and volume/surface ratio, the analytical value can obtain
the result which is mostly in agreement with an actual measurement.
・In reproduction of the long-term deflection by the creeping analysis , relative humidity
(RH) is a dominant factor. Therefore, the accuracy of the relative humidity of each
component is important.
・The deformation will continue for the next 100 years and the quantity of the
deformation will be around 10mm.