Embed Size (px)
Citation preview

A STUDY ON EMPLOYEE’S JOB SATISFACTION IN SALEM STEEL
PLANT, SALEM
Dr.G.VENKATESAN 1 Dr.R.RAMESH
2
1 Professor & Head, Department of Management Studies, Jayalakshmi Institute of technology
Thoppur, Dharmapuri -636352. 2 Assistant Professor, Department of Management Studies, Jayalakshmi Institute of technology
Thoppur, Dharmapuri -636352.
ABSTRACT
The project work entitled “A Study on Employees Job Satisfaction In Salem Steel Plant,
Salem” is to study the various factors that are concerned with attitude of the employees. The study
focused on analyzing job satisfaction in level in the organization. The analysis is mainly based on the
primary data, through the survey method. For the study has taken a sample size 110 respondents at
convenience sampling method from the total population. The Study gives Employees opinion about
job satisfaction, opportunity, attitude, stress, leadership, working environment, nature of work,
incentive policy, bonus system, promotional opportunities and increments. The study has used simple
percentage analysis, chi-square And ANOVA used. The study has given suggestions to improve the
motivational factors. In order to increase productivity, Through this organizational objectives can be
easily achieved. Overall company is satisfactory in job.
Introduction
Job satisfaction is a set of unfavorable feeling with employees view their jobs, were
specifically the nature of job they do. The quality of supervision, they receive co-workers pay and
perfect promotional avenues. Job satisfaction affects job performance and absenteeism. Highs job
satisfaction in to high work performance, less employee turnover and less absenteeism.
Determinants of Job Satisfaction
All individuals do not drive the same degree of satisfaction through they perform the same job
in the same environment and at the same time individuals variable which affects job satisfaction let us
see the what there factors are
Individual Factors
Individuals have certain expectation from their job. If the expectations are need from the job.
They feel satisfied. There expectations are based on.
Level of education
Age
Other factors
INTERCONTINENTAL JOURNAL OF HUMAN RESOURCE RESEARCH REVIEWISSN: 2320-9704 - ONLINE ISSN:2347-1662 - PRINT IMPACT FACTOR:1.615VOLUME 4, ISSUE 7, JULY 2016
www.icmrr.org 66 [email protected]
Effects of Job Satisfaction
Job satisfaction has a variety of effects. These may be seen in the context of an
Individual physical or mental health
Productivity
Absenteeism
The various other factors also will determine the job satisfaction,
Age
Time
Intelligence
Education
Personality
Skills
Responsibility
Employee’s attitude
Ventilation
Hours of work
About The Industry
STEEL AUTHORITY OF INDIA LIMITED is the largest producer with a turnover of
45,556Cr.during 2007-08. It operates and owns five integrated steel plants at Bhili, Bokaro, Rourkela
and Burnpur and three specialty steel plants at Salem, Durgapur and Bhadravati.
A subsidiary at Chandrapur produces Ferro alloys. STEEL AUTHORITY produces 14.6MT
of hot melt, 13.5MT of saleable steel in 2006-07.SAIL planned to produce 25MT of crude steel and
saleable steel by 2010.
Ranked amongst the top ten public sector companies in India in terms of turnover, the
company is the most amongst the leading producer of iron ore. The company's captive mines fulfill its
entire iron ore requirements. STEEL AUTHORITY countrywide marketing network comprises 37
branches sales office, 55 stockyards and over 1200 authorized dealers. this helps in marketing the
products in all most all districts of the country, sail manufactures and sells a broad range of steel
products of including HOT and COLD rolled steel and coils galvanized sheets , electric sheets ,
structural, railway products plates, bars and rods, stainless steel and other alloy steels.
STEEL AUTHORITY wide ranges of long and flat steel products are much in demand in the
domestic as well the international market. This vital responsibility is carried out by STEEL
AUTHORITY own Central Marketing organization (CMO) and the international trade division
STEEL AUTHORITY the integrated company comprises the following units / subsidiaries:
Bhilai steel plant, Bhilai, Chhattisgarh
Bokaro steel plant, Bokaro, Jharkhand
Durgapur steel plant, Durgapur, west Bengal
INTERCONTINENTAL JOURNAL OF HUMAN RESOURCE RESEARCH REVIEWISSN: 2320-9704 - ONLINE ISSN:2347-1662 - PRINT IMPACT FACTOR:1.615VOLUME 4, ISSUE 7, JULY 2016
www.icmrr.org 67 [email protected]

Rourkela steel plant, Rourkela, Orissa
Alloy Steel Plant, Durgapur, West Bengal
SALEM STEEL PLANT, Salem, Tamilnadu
Visveswarayya iron and steel plant, Bhadravathi, Karnataka
IISCO steel plant, Burnpur, west Bengal
Central marketing organization, Kolkata, west Bengal
Research & Development centre for iron and steel, Ranchi
A RICH HERITAGE
The Precursor
STEEL AUTHORITY traces its origin to the formative years of an emerging nation - India.
After independence the builders of modern India worked with a vision - to lay the infrastructure for
rapid industrialization of the country. The steel sector was to propel the economic growth. Hindustan
Steel Private Limited was set up on January19, 1954.
Expanding Horizon (1959-1973)
Hindustan Steel (HSL) was initially designed to manage only one plant that was coming up at
Rourkela. For Bhilai and Durgapur Steel Plants, the preliminary work was done by the Iron and Steel
Ministry. From April 1957, the supervision and control of these two steel plants were also transferred
to Hindustan Steel. The registered office was originally in New Delhi. It moved to Calcutta in July
1956, and ultimately to Ranchi in December 1959.
The 1 MT phases of Bhilai and Rourkela Steel Plants were completed by the end of
December 1961. The 1 MT phase of Durgapur Steel Plant was completed in January 1962 after
commissioning of the Wheel and Axle plant. The crude steel production of HSL went up from .158
MT (1959-60) to 1.6 MT. A new steel company, Bokaro Steel Limited, was incorporated in January
1964 to construct and operate the steel plant at Bokaro. The second phase of Bhilai Steel Plant was
completed in September 1967 after commissioning of the Wire Rod Mill. The last unit of the 1.8 MT
phase of Rourkela - the Tandem Mill - was commissioned in February 1968, and the 1.6 MT stage of
Durgapur Steel Plant was completed in August 1969 after commissioning of the Furnace in SMS.
Thus, with the completion of the 2.5 MT stage at Bhilai, 1.8 MT at Rourkela and 1.6 MT at Durgapur,
the total crude steel production capacity of HSL was raised to 3.7 MT in 1968-69 and subsequently to
4MT in 1972-73.
CREDO
We build lasting relationships with customer based on trust and mutual benefit
We uphold highest ethical standards in conduct of our business
We create and nurture a culture that supports flexibility, learning and is proactive to change
We chart a challenge career for employees with opportunity for advancement and rewards.
We value the opportunity and responsibility to meaningful difference in people's lives.
Profile of Salem Steel Plant
Salem steel plant was a long cherished dream by the government of India to setup an
integrated special steel plant at Salem in the state of Tamilnadu for production of sheets and strips of
electronically. Stainless and mild steel on the basis of sound techno-economic considerations
INTERCONTINENTAL JOURNAL OF HUMAN RESOURCE RESEARCH REVIEWISSN: 2320-9704 - ONLINE ISSN:2347-1662 - PRINT IMPACT FACTOR:1.615VOLUME 4, ISSUE 7, JULY 2016
www.icmrr.org 68 [email protected]
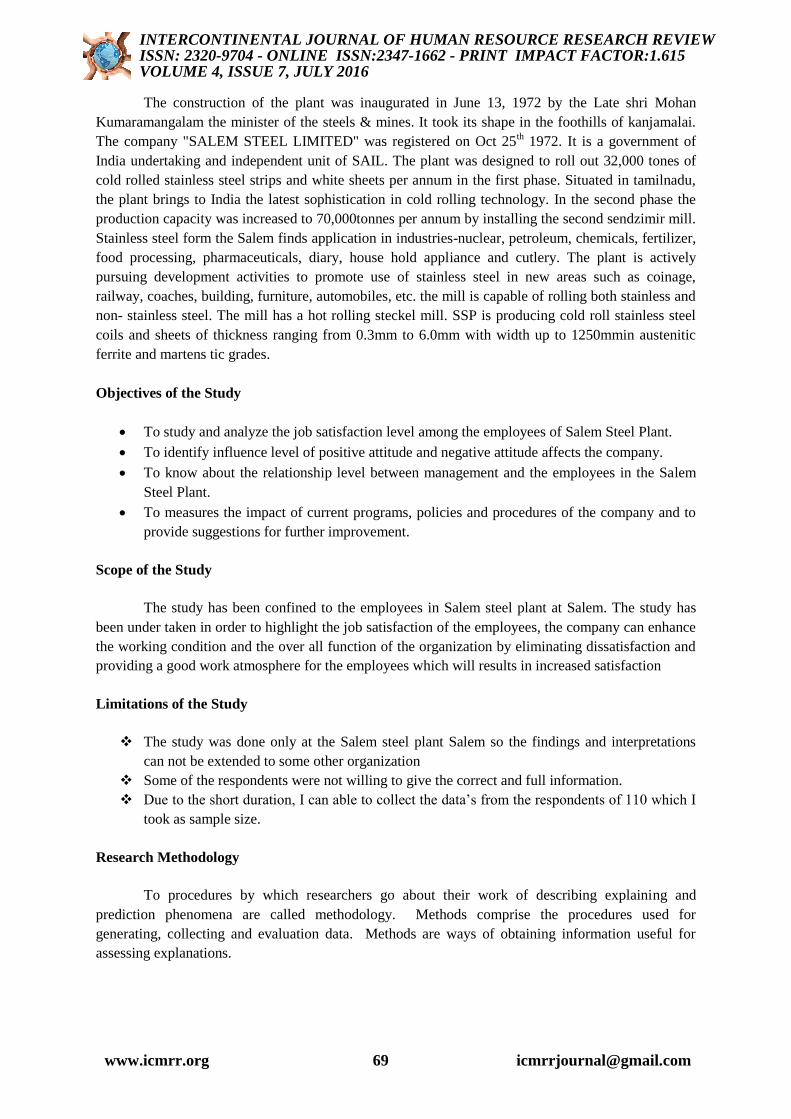
The construction of the plant was inaugurated in June 13, 1972 by the Late shri Mohan
Kumaramangalam the minister of the steels & mines. It took its shape in the foothills of kanjamalai.
The company "SALEM STEEL LIMITED" was registered on Oct 25th 1972. It is a government of
India undertaking and independent unit of SAIL. The plant was designed to roll out 32,000 tones of
cold rolled stainless steel strips and white sheets per annum in the first phase. Situated in tamilnadu,
the plant brings to India the latest sophistication in cold rolling technology. In the second phase the
production capacity was increased to 70,000tonnes per annum by installing the second sendzimir mill.
Stainless steel form the Salem finds application in industries-nuclear, petroleum, chemicals, fertilizer,
food processing, pharmaceuticals, diary, house hold appliance and cutlery. The plant is actively
pursuing development activities to promote use of stainless steel in new areas such as coinage,
railway, coaches, building, furniture, automobiles, etc. the mill is capable of rolling both stainless and
non- stainless steel. The mill has a hot rolling steckel mill. SSP is producing cold roll stainless steel
coils and sheets of thickness ranging from 0.3mm to 6.0mm with width up to 1250mmin austenitic
ferrite and martens tic grades.
Objectives of the Study
To study and analyze the job satisfaction level among the employees of Salem Steel Plant.
To identify influence level of positive attitude and negative attitude affects the company.
To know about the relationship level between management and the employees in the Salem
Steel Plant.
To measures the impact of current programs, policies and procedures of the company and to
provide suggestions for further improvement.
Scope of the Study
The study has been confined to the employees in Salem steel plant at Salem. The study has
been under taken in order to highlight the job satisfaction of the employees, the company can enhance
the working condition and the over all function of the organization by eliminating dissatisfaction and
providing a good work atmosphere for the employees which will results in increased satisfaction
Limitations of the Study
The study was done only at the Salem steel plant Salem so the findings and interpretations
can not be extended to some other organization
Some of the respondents were not willing to give the correct and full information.
Due to the short duration, I can able to collect the data’s from the respondents of 110 which I
took as sample size.
Research Methodology
To procedures by which researchers go about their work of describing explaining and
prediction phenomena are called methodology. Methods comprise the procedures used for
generating, collecting and evaluation data. Methods are ways of obtaining information useful for
assessing explanations.
INTERCONTINENTAL JOURNAL OF HUMAN RESOURCE RESEARCH REVIEWISSN: 2320-9704 - ONLINE ISSN:2347-1662 - PRINT IMPACT FACTOR:1.615VOLUME 4, ISSUE 7, JULY 2016
www.icmrr.org 69 [email protected]

Research design
A research design is the arrangements of condition for collection and analysis of data. This
speaks about the decision recording what, where, when, how much by what means concerning on
inquiry or a research studies. In constitutes the blue print for the collection measurements and
analysis of data.
The type of research used in this project is descriptive in nature. Descriptive studies aim at
portraying accurately the characteristics of a particular group or situation.
Primary Data
The primary data was collected from the respondents through the questionnaire, observation
& direct interview.
Secondary Data
The secondary data was collected from the
Company Records
Publications
Magazine
Journals
Internet Sources
Sample size
The Target population of employees is 1328 of Salem Steel Plant. Among which 110 were
taken as a sample size.
Sample Design
The sampling technique used in the study was 'Non-probability convenience sampling'
method was adopted and used for the study.
Simple Percentage Analysis
The expression of data in terms of percentage is of the simplest statistical services used in the
interpretation of business and economic statistic. Percentages are useful chiefly for the purpose of
aiding comparison. A percent is the number o\f hundredth parts on numbers are of another.
Formula:
No. of respondents
Percentage = ---------------------------- x 100
Total No. of respondents
INTERCONTINENTAL JOURNAL OF HUMAN RESOURCE RESEARCH REVIEWISSN: 2320-9704 - ONLINE ISSN:2347-1662 - PRINT IMPACT FACTOR:1.615VOLUME 4, ISSUE 7, JULY 2016
www.icmrr.org 70 [email protected]

CHI-SQUARE TEST
The chi square test is used to test whether there is a significant difference between the observed
number of responses in each category and the expected number of responses for such category under
the assumptions of null hypothesis. It is one of the simplest and most widely used non parametric
tests in statistical work.
Where,
Formula:
Where,
Oi = Observed frequency
Ei = Expected frequency
The calculated value is compared with table value given degrees of freedom a specified level
of significance. If the observed value is greater than the table value then there exists a significant
relationship between the factors and if the observed value is lesser than it is not considered significant.
Review of Literature
According to the U.S. Department of Education, National Center for, Education
Statistics (NCES), (1999), the more job stress, the lower group cohesion, the lower work satisfaction
and the higher the anticipated turnover. The higher the work satisfaction, the higher group cohesion
and the lower anticipated turnover. The more stable the work schedule, the less work related stress,
the lower anticipated turnover, the higher group cohesion, and the higher work satisfaction. Job stress,
work satisfaction, group cohesion, and weekend overtime were all predictors of anticipated turnover.
These are difference in the factors predicting anticipated turnover for different age groups.
Maslach (1996) Job Satisfaction and burnout are important areas of study because of the
financial and social effects of job satisfaction and the damaging physical / psychological impacts of
burnout. Two hundred family / children and psychiatric workers of seven social service organizations
were surveyed. Instruments used were the Minnesota Satisfaction Questionnaire, the Maslach Burnout
Inventory, and the staff Burnout Scale for Health Professionals.
NCES (1999) and Thomas (2000) reported an increase from 29 percent in 1986, to 45
percent in 1994. This study addressed the factors that nursing staff perceived as creating job
satisfaction in their working environment in addition to addressing the ethical dilemmas that staff
experienced within an acute psychiatric care setting. It also addressed how clinical supervision
contributed to job satisfaction among staff as well as the differences between staff who attended and
staff who did not attend to clinical supervision. Data were analyzed using descriptive statistics.
2 =
n
i Ei
Eii
1
2)(
INTERCONTINENTAL JOURNAL OF HUMAN RESOURCE RESEARCH REVIEWISSN: 2320-9704 - ONLINE ISSN:2347-1662 - PRINT IMPACT FACTOR:1.615VOLUME 4, ISSUE 7, JULY 2016
www.icmrr.org 71 [email protected]
Chubon (1992) the result of this study showed that the factors influencing nurses are related
to areas of dissatisfaction, for example, stress and experiences with shortcomings. Factors that
contribute to job satisfaction or dissatisfaction were found to be related to the nurses’ value systems.
The ethical dilemmas that were specifically addressed involved how to care for patients and handle
work in relation to patients’ autonomy, how to approach the patient, how to provide care against the
will of the patient, and what action was ethically right for each particular patient.
Lefranois (1994) the current nursing shortage and high turnover is of great concern in many
countries because of its impact upon the efficiency and effectiveness of any health –care delivery
system. Recruitment and retention of nurses are persistent problems associated with job satisfaction.
This paper analyses the growing literature relating to job satisfaction among nurses and concludes that
more research is required to understand the relative importance of the many identified factors to job
satisfaction.
Wilzinki (1991) the satisfaction refers to an individual’s general attitude towards his / her job.
A person with a high level of job satisfaction holds positive attitudes about the job, while a person
who is dissatisfied with his / her job holds negative attitudes about the job. When people speak of
employees attitudes, more often than not they mean job satisfaction.
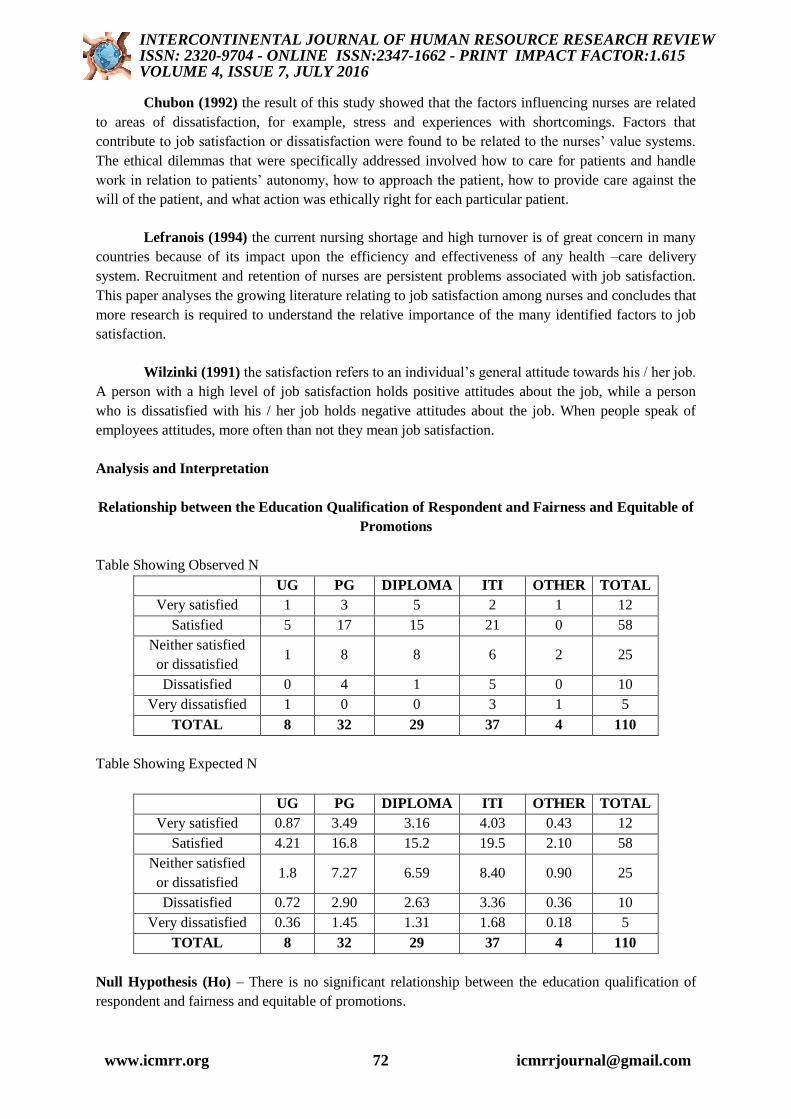
Analysis and Interpretation
Relationship between the Education Qualification of Respondent and Fairness and Equitable of
Promotions
Table Showing Observed N
UG PG DIPLOMA ITI OTHER TOTAL
Very satisfied 1 3 5 2 1 12
Satisfied 5 17 15 21 0 58
Neither satisfied
or dissatisfied 1 8 8 6 2 25
Dissatisfied 0 4 1 5 0 10
Very dissatisfied 1 0 0 3 1 5
TOTAL 8 32 29 37 4 110
Table Showing Expected N
UG PG DIPLOMA ITI OTHER TOTAL
Very satisfied 0.87 3.49 3.16 4.03 0.43 12
Satisfied 4.21 16.8 15.2 19.5 2.10 58
Neither satisfied
or dissatisfied 1.8 7.27 6.59 8.40 0.90 25
Dissatisfied 0.72 2.90 2.63 3.36 0.36 10
Very dissatisfied 0.36 1.45 1.31 1.68 0.18 5
TOTAL 8 32 29 37 4 110
Null Hypothesis (Ho) – There is no significant relationship between the education qualification of
respondent and fairness and equitable of promotions.
INTERCONTINENTAL JOURNAL OF HUMAN RESOURCE RESEARCH REVIEWISSN: 2320-9704 - ONLINE ISSN:2347-1662 - PRINT IMPACT FACTOR:1.615VOLUME 4, ISSUE 7, JULY 2016
www.icmrr.org 72 [email protected]

Alternate hypothesis (H1) – There is significant relationship between the education qualification of
respondent and fairness and equitable of promotions.
O E (O-E) (O-E)2 (O-E)2 /E
1 0.87 0.13 0.0169 0.019
3 3.49 0.49 0.2401 0.068
5 3.16 1.84 3.3856 1.071
2 4.03 -2.03 4.1209 1.022
1 0.43 0.57 0.3249 0.755
5 4.21 0.79 0.6241 0.148
17 16.8 0.2 0.04 0.002
15 15.2 -0.2 0.04 0.002
21 19.5 1.5 2.25 0.117
0 2.10 -2.1 4.41 2.1
1 1.8 -0.8 0.64 0.355
8 7.27 0.73 0.5329 0.073
8 6.59 1.41 1.9881 0.301
6 8.40 -2.4 5.76 0.685
2 0.90 1.1 1.21 1.344
0 0.72 -0.72 0.5184 0.72
4 2.90 1.1 1.21 0.417
1 2.63 -1.63 2.6569 1.010
5 3.36 1.64 2.6896 0.800
0 0.36 -0.36 0.1296 0.36
1 0.36 0.64 0.4096 1.137
0 1.45 -1.45 2.1025 1.45
0 1.31 -1.31 1.7161 1.31
3 1.68 1.32 1.7424 1.037
1 0.18 0.82 0.6724 3.73
20.033
Chi-square Result
Calculated chi-square value = 20.033
Degree of freedom = 16
Table value = 26.3
Level of significant = Sig. At 5% level
Conclusion
From the above analysis we conclude that there is no significant relationship between the
education qualification of respondent and fairness and equitable of promotions.
INTERCONTINENTAL JOURNAL OF HUMAN RESOURCE RESEARCH REVIEWISSN: 2320-9704 - ONLINE ISSN:2347-1662 - PRINT IMPACT FACTOR:1.615VOLUME 4, ISSUE 7, JULY 2016
www.icmrr.org 73 [email protected]

Relationship between the Income Level and Salary System Provided By the Company
Table Showing Observed N
BELOW10000 10001-
20000
20001-
30000
30001-
40000
ABOVE
40000 TOTAL
Very satisfied 0 0 9 0 6 15
Satisfied 12 15 38 0 5 70
Neither satisfied
or dissatisfied 0 5 9 0 1 15
Dissatisfied 2 0 3 0 0 5
Very dissatisfied 1 2 1 0 1 5
TOTAL 15 22 60 0 13 110
Table Showing Expected N
BELOW10000 10001-
20000
20001-
30000
30001-
40000
ABOVE
40000 TOTAL
Very
satisfied 2.04 3 8.18 0 1.77 15
Satisfied 9.54 14 38.18 0 8.27 70
Neither
satisfied or
dissatisfied
2.04 3 8.18 0 1.77 15
Dissatisfied 0.68 1 2.72 0 0.59 5
Very
dissatisfied 0.68 1 2.72 0 0.59 5
TOTAL 15 22 60 0 13 110
Null Hypothesis (HO) – There is no significant relationship between the income level and salary
system provided by the company.
Alternate Hypothesis (H1) – There is significant relationship between the income level and salary
system provided by the company.
O E (O-E) (O-E)2 (O-E)2 /E
0 2.04 -2.04 4.16 2.03
0 3 -3 9 3
9 8.18 0.82 0.67 0.08
0 0 0 0 0
6 1.77 4.23 17.89 10.10
12 9.54 2.46 6.05 0.63
15 14 1 1 0.07
38 38.18 -0.18 0.03 0.0007
0 0 0 0 0
5 8.27 -3.27 10.69 1.29
0 2.04 -2.04 4.16 2.03
5 3 2 4 1.33
9 8.18 0.82 0.67 0.08
INTERCONTINENTAL JOURNAL OF HUMAN RESOURCE RESEARCH REVIEWISSN: 2320-9704 - ONLINE ISSN:2347-1662 - PRINT IMPACT FACTOR:1.615VOLUME 4, ISSUE 7, JULY 2016
www.icmrr.org 74 [email protected]

0 0 0 0 0
1 1.77 -0.77 0.59 0.33
2 0.68 1.32 1.74 2.55
0 1 -1 1 1
3 2.72 0.28 0.078 0.028
0 0 0 0 0
0 0.59 -0.59 0.34 0.576
1 0.68 0.32 0.102 0.15
2 1 1 1 1
1 2.72 1.72 2.95 1.08
0 0 0 0 0
1 0.59 0.41 0.168 0.28
27.63
Chi-square Result
Calculated chi-square value =27.63
Degree of freedom = 16
Table value = 26.3
Level of significant = Sig. At 5% level
Conclusion
From the above analysis we conclude that there is significant relationship between the income
level and salary system provided by the company.
ANOVA
Relationship between Age and the Promotional Opportunities
STEP: 1
Null Hypothesis H0= µ1=µ2=µ3=µ4=µ5
Alternate Hypothesis H1= µ1 ≠ µ2 ≠ µ3≠µ4≠µ5
STEP: 2
X1 X2 X3 X4 X5 (X1)2 (X2)2 (X3)2 (X4)2 (X5)2
0 0 0 0 0 0 0 0 0 0
0 16 2 0 0 0 256 4 0 0
2 30 13 0 0 4 900 169 0 0
1 5 5 6 3 1 25 25 36 9
7 9 10 0 1 49 81 100 0 1
10 60 30 6 4 54 1262 298 36 10
No of observation (N) = 25
Total no of observation (T) = 110
STEP: 3
Correction Factors = (T)2\ N= 484
STEP: 4
SST=TOTAL SUM OF SQUARE
((∑X1)2 + (∑X2)2 + (∑X3)2…..)- (T)2 \ N
SST = 1176
INTERCONTINENTAL JOURNAL OF HUMAN RESOURCE RESEARCH REVIEWISSN: 2320-9704 - ONLINE ISSN:2347-1662 - PRINT IMPACT FACTOR:1.615VOLUME 4, ISSUE 7, JULY 2016
www.icmrr.org 75 [email protected]

STEP: 5
SSC = ((∑X1)2 \ N1 + (∑X2)2 \ N2+ (∑X3)2 \ N3…..)- (T)2 \ N
SSC =446.4
STEP: 6
To Find SSE= SST-SSC
SSE = 729.6
NEXT TO FIND ANOVA TABLE
SOURCES OF
VARIABLES
SUM OF
SQUARE D.O.F
MEAN SUM OF
SQUARE
VARIANCE
RATIO
Between column SSC=446.4 V1=C-1
V1=4
MSC=SSC\C-1
MSC=111.6
F=MSE\MSC
F=0.326
Within samples SSE=729.6 V2=N-C
V2=20
MSE=SSE\N-C
MSE=36.48
STEP: 7
The no. of D.O.F is (4,20)
The table value of f at 5% level T.V= 4.26
Conclusion
Here, C.V < T.V so accept H0
Hence there is no significant relationship between the age and the promotional opportunities.
Relationship Between Educational and the Promotional System
STEP: 1
Null Hypothesis H0= µ1=µ2=µ3=µ4=µ5
Alternate Hypothesis H1= µ1 ≠ µ2 ≠ µ3≠µ4≠µ5
STEP: 2
X1 X2 X3 X4 X5 (X1)2 (X2)2 (X3)2 (X4)2 (X5)2
0 5 3 0 0 0 25 9 0 0
5 15 3 8 1 25 225 9 64 1
14 10 4 0 1 196 100 16 0 1
6 14 13 2 2 36 196 169 4 4
0 1 2 0 1 0 1 4 0 1
25 45 25 10 5 257 547 207 68 7
No of observation (N) = 25
Total no of observation (T) = 110
STEP: 3
Correction Factors = (T)2\ N= 484
STEP: 4
SST=TOTAL SUM OF SQUARE
((∑X1)2 + (∑X2)2 + (∑X3)2…..)- (T)2 \ N
SST = 602
STEP: 5
SSC = ((∑X1)2 \ N1 + (∑X2)2 \ N2+ (∑X3)2 \ N3…..)- (T)2 \ N
SSC =196
INTERCONTINENTAL JOURNAL OF HUMAN RESOURCE RESEARCH REVIEWISSN: 2320-9704 - ONLINE ISSN:2347-1662 - PRINT IMPACT FACTOR:1.615VOLUME 4, ISSUE 7, JULY 2016
www.icmrr.org 76 [email protected]

STEP: 6
To Find SSE= SST-SSC
SSE = 406
NEXT TO FIND ANOVA TABLE
SOURCES OF
VARIABLES
SUM OF
SQUARE D.O.F
MEAN SUM OF
SQUARE
VARIANCE
RATIO
Between column SSC=196 V1=C-1
V1=4
MSC=SSC\C-1
MSC=49
F=MSE\MSC
F=0.414
Within samples SSE=406 V2=N-C
V2=20
MSE=SSE\N-C
MSE=20.3
STEP: 7
The no. of D.O.F is (4,20)
The table value of f at 5% level T.V= 4.26
CONCLUSION:
Here, C.V < T.V so accept H0
Hence there is no significant relationship between the educational and the promotional system.
Findings
Majority (40.90%) of the respondents are in the age group of 31- 40 yrs
Most (91.81%) of respondents are male
Part (33.63%) of respondents are ITI
60% of respondent have above 10 yrs of experience
54.54% of respondents are satisfied towards promotion opportunity.
36.38% of respondent are satisfied towards the manager’s clear sense of direction.
38.20% of respondent are satisfied towards frequency and period of training program.
54.56% of respondents are satisfied towards the communication of information of change.
63.63% of respondents are satisfied towards the leave policy offered by the company.
63.63% of respondents are satisfied towards the safety policy offered by the company.
63.63% of respondents are satisfied towards employees insurance policy provided by the
company.
50% of employees are satisfied towards canteen facility offered by the company.
36.36% of respondents are satisfied towards recreation facility offered by the company.
There is no relationship between education qualification and fairness equitable of promotions
There is no significant variation between age and promotional opportunity.
There is no significant education qualification and bonus system provided by the company
Suggestions
The following recommendations may be offered for improving the job satisfaction of
employees. This includes the recommendations offered by sample respondents also.
The company may take necessary arrangement to make awareness about the promotional
opportunities to the employees.
The company may take the action to improve the relationship among the supervisors,
colleagues and management through programmes.
INTERCONTINENTAL JOURNAL OF HUMAN RESOURCE RESEARCH REVIEWISSN: 2320-9704 - ONLINE ISSN:2347-1662 - PRINT IMPACT FACTOR:1.615VOLUME 4, ISSUE 7, JULY 2016
www.icmrr.org 77 [email protected]

The company may make the employees improve the interest towards the job through the job
enrichment, job enlargement etc.
The company may also give additional opportunity and training program for the workers if
they prefer.
The companies’ bonus and increment policies to be clearly communicate to the employees.
The top management and supervisor can handle clear sense of direction for the employees.
The company can improve recreation facilities offered to make the employees to feel
comfortable.
CONCLUSION
Job satisfaction plays major role in the company. A person with a high level of job
satisfaction holds positive attitudes about the job, while a person who is dissatisfied with his/her job
holds negative attitudes about the job. Satisfied employees are producing more and more output in the
production view for the satisfaction of employees.
Through the study it is found that job satisfaction level of employees in SALEM STEEL
PLANT is satisfactory. Still there is a room for improvement in some area’s Company has to do
conduct some programs like proper training. Company could clearly define the promotional
opportunities. Company could motivate the employees with timely incentives and increments. The
relationship between superior and subordinates may be improved by conducting some programs and
interactive sessions. All there thinks will benefit both employer and employees
References
1. Stphen P. Robbins – organizational behavior eight editions, Prentice hall of India. (Page No.277)
2. Kothari C.R - Research methodology, new age international prakasm publishers, second edition.
(Page No.328)
3. RAO. V.S.P– Human Resource Management. (Page No.117)
4. Prem Chand, Performance management, McMillan India Ltd, Human Resource Management by
Khanka (Page No.301)
INTERCONTINENTAL JOURNAL OF HUMAN RESOURCE RESEARCH REVIEWISSN: 2320-9704 - ONLINE ISSN:2347-1662 - PRINT IMPACT FACTOR:1.615VOLUME 4, ISSUE 7, JULY 2016
www.icmrr.org 78 [email protected]