Embed Size (px)
Citation preview
STATE OF CONNECTICUT DEPARTMENT OF ENERGY AND ENVIRONMENTAL PROTECTION
Robert Klee Commissioner
Bureau of Natural Resources Marine Fisheries Division www.ct.gov/deep/fishing
A STUDY OF MARINE RECREATIONAL FISHERIES IN CONNECTICUT
Federal Aid in Sport Fish Restoration F14AF00296 (F-54-R-34) Annual Performance ReportMarch 1, 2014 – February 28, 2015
Jobs 7-8 (Seine Surveys)
Cover photo: Fisheries Biologist (retired) Roderick MacLeod with a trophy striped bass he caught in Long Island Sound.
Roderick (Rod) MacLeod retired on April 30, 2015, after more than 34 years of service with the Marine Fisheries Division. During that time Rod helped initiate the marine angler survey program including the Volunteer Angler Program – one of the first of its kind on the east coast. Rod headed up the marine angler survey for nearly 30 years including managing the transition from Connecticut’s independent creel surveys to participation in the Marine Recreational Fishery Statistics Survey in 1987. Rod also contributed significantly to the design and implementation of our return to independent creel surveys in 2013 intended to complement the federal MRIP survey.
In addition to oversight of state marine angler surveys, Rod served as Connecticut’s representative on ASMFC Interstate Tagging and Artificial Reef Committees and on the ACCSP Operations and Recreational Technical Committees.
Rod’s day-to-day duties also included heading up fish kill investigations and looking out for anglers’ interests in the agency’s review of structures and dredging permits, including providing critical advice on the development of fishing access sites whenever such opportunities arose. Rod also played a central role in our outreach efforts targeting the angling community, including producing the weekly fishing reports and helping hundreds of callers over the years looking for a good place to get out fishing or crabbing. His detailed knowledge of fishing and fishing access along the entire coast, gleaned from years of creel survey work and his owned extensive fishing experience, has been invaluable to this office and the fishing public.
Rod will be missed not only for the contributions he has made to this agency over more than a third of a century, but also as a longtime friend and colleague. We wish Rod and his family the best as he enters this new and exciting phase in his life in retirement. Try to leave a few fish on the shoal for us weekend warriors, Rod!
State of Connecticut Department of Energy and Environmental Protection
79 Elm Street Hartford, CT 06106-5127
www.ct.gov/deep
Federal Aid in Sport Fish Restoration F14AF00296 (F-54-R-34)
Annual Performance Report
Project Title: A Study of Marine Recreational Fisheries in Connecticut
Period Covered: March 1, 2014 - February 28, 2015
Job Title Prepared by: Job 1: Marine Angler Survey Roderick E. MacLeod Job 2: Volunteer Angler Survey Roderick E. MacLeod Job 3: Enhanced Shore Fishing Gregory Wojcik Job 4: Tackle Shop Co-op Survey Gregory Wojcik Job 5: Marine Finfish Survey Kurt F. Gottschall
Deborah J. Pacileo Job 6: Studies in Conservation Engineering Inactive Job 7: Alosine Survey Jacqueline M. Benway Job 8: Estuarine Seine Survey David R. Molnar
Penelope T. Howell Job 9: Volunteer Estuarine Fisheries Database Penelope T. Howell Job 10: Cooperative Interagency Resource Monitoring Matthew J. Lyman
Katie O’Brien-Clayton Job 11: Public Outreach David R. Molnar Job 12: Marine Fisheries GIS Deborah J. Pacileo
Jacqueline M. Benway
_______________________________ Approved by: David G. Simpson, Director Date: May 1, 2015 Marine Fisheries Division
Page i

Job 7 Page 1
JOB 7: ALOSINE SURVEY
Job 7 Page 2
JOB 7: INSHORE SURVEY
TABLE OF CONTENTS
GOAL……………………………………………………………………………………………..4
OBJECTIVES……………………………………………………………………………………..4
STUDY PERIOD AND AREA……………………………………………………………….......4
INTRODUCTION……………………………………………………………………...…………4
METHODS……………………………………………………………………………………..…5
RESULTS…………………………………………………………………………………………6
MODIFICATIONS………………………………………………………………….………….…8
LITERATURE CITED………………………………………………………………………..…..9
LIST OF TABLES
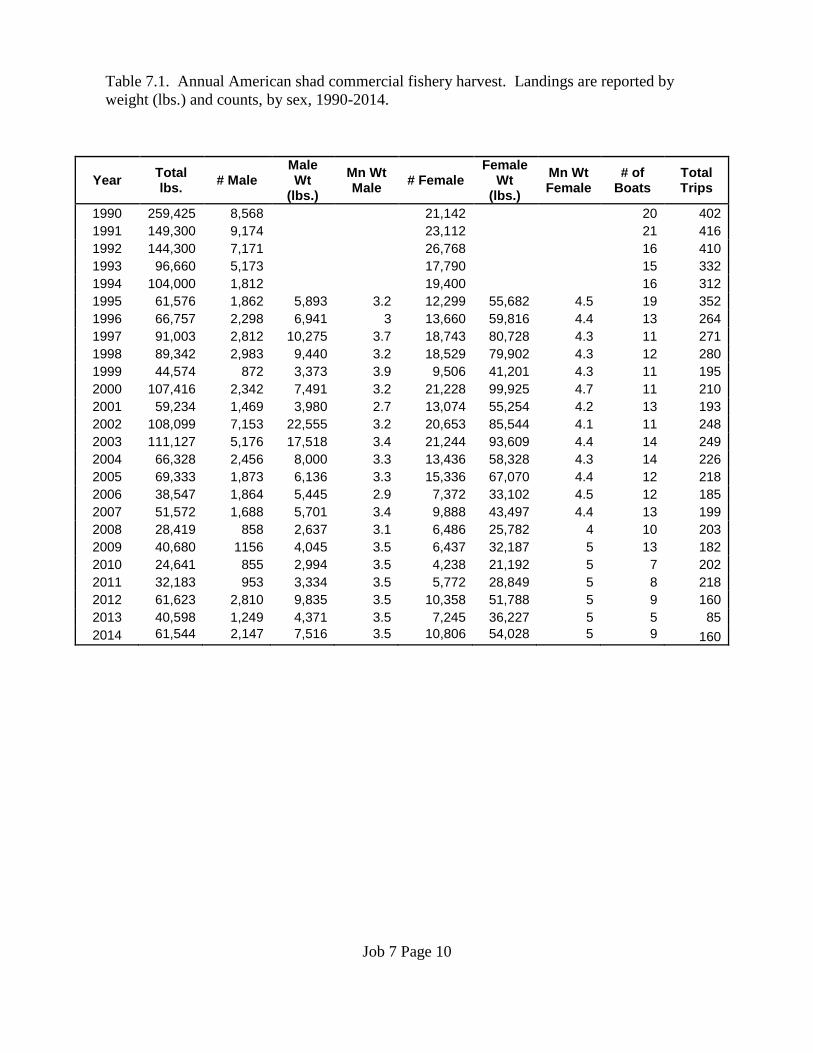
Table 7.1. Annual American shad commercial fishery harvest. Landings are reported by
weight (lbs.) and counts, by sex, 1990-2014................................................…….10
Table 7.2. Fishery independent spawning history and age distribution of American shad in
the upper Connecticut River, 2014 ………...……………………………………11
Table 7.3. Catch and effort of juvenile American shad from the 2014 CT River seine
survey…………………………………..………………………………………...12
Table 7.4. Catch and effort of juvenile blueback herring from the 2014 CT River seine
survey …………......…………..…………………………………………………12
Table 7.5. Geometric mean relative abundance index (CPUE) of juvenile American shad
and blueback herring,1978-2014.…...…………...……….………………...……13
Table 7.6. List of fish species or group and percent frequency of occurrence of fish
collected in Connecticut River seine survey, 2008-2014.……..…………….......14
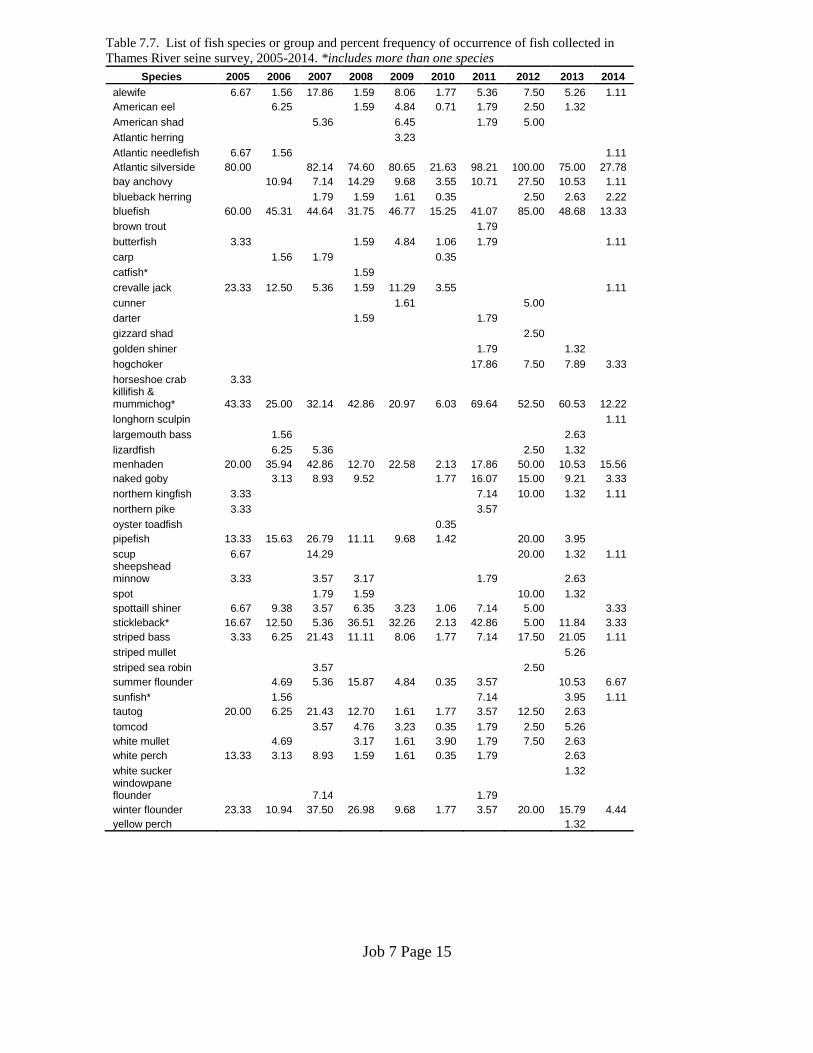
Table 7.7. List of fish species or group and percent frequency of occurrence of fish collected
in the Thames River seine survey, 2005-2014……………………………...........15
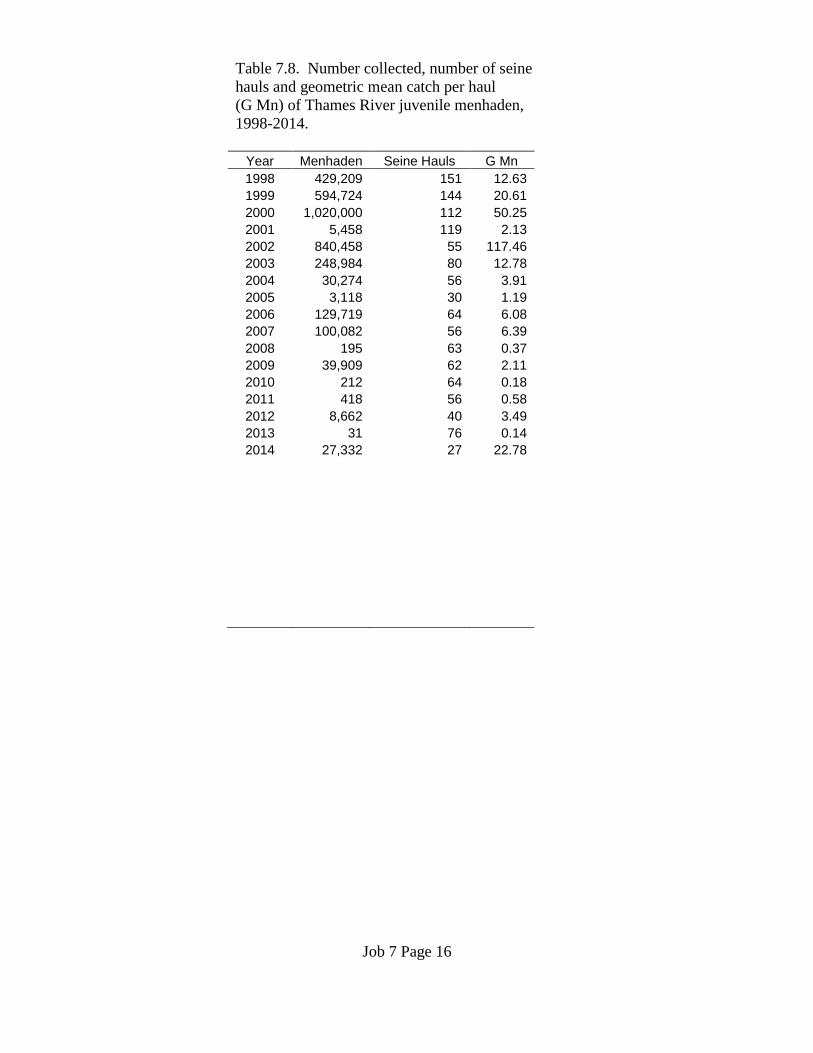
Table 7.8. Number collected, number of seine hauls and geometric mean catch per haul of
Thames River juvenile menhaden, 1998-2014…………………………………..16
Table 7.9. Data and sample requests for 2014………………...………...………………......16
Job 7 Page 3
LIST OF FIGURES
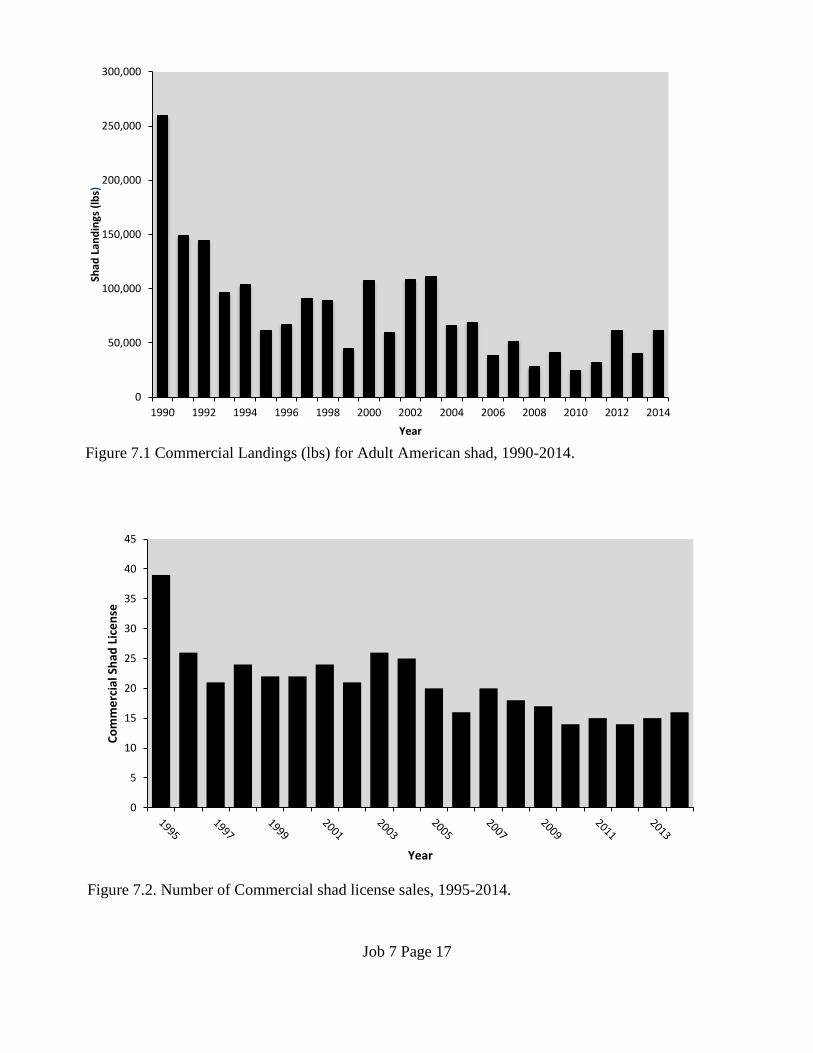
Figure 7.1 Commercial Landings (lbs) for adult American shad, 1990-2014……………...17
Figure 7.2 Number of commercial shad license sales, 1995-2014……………..…………...17
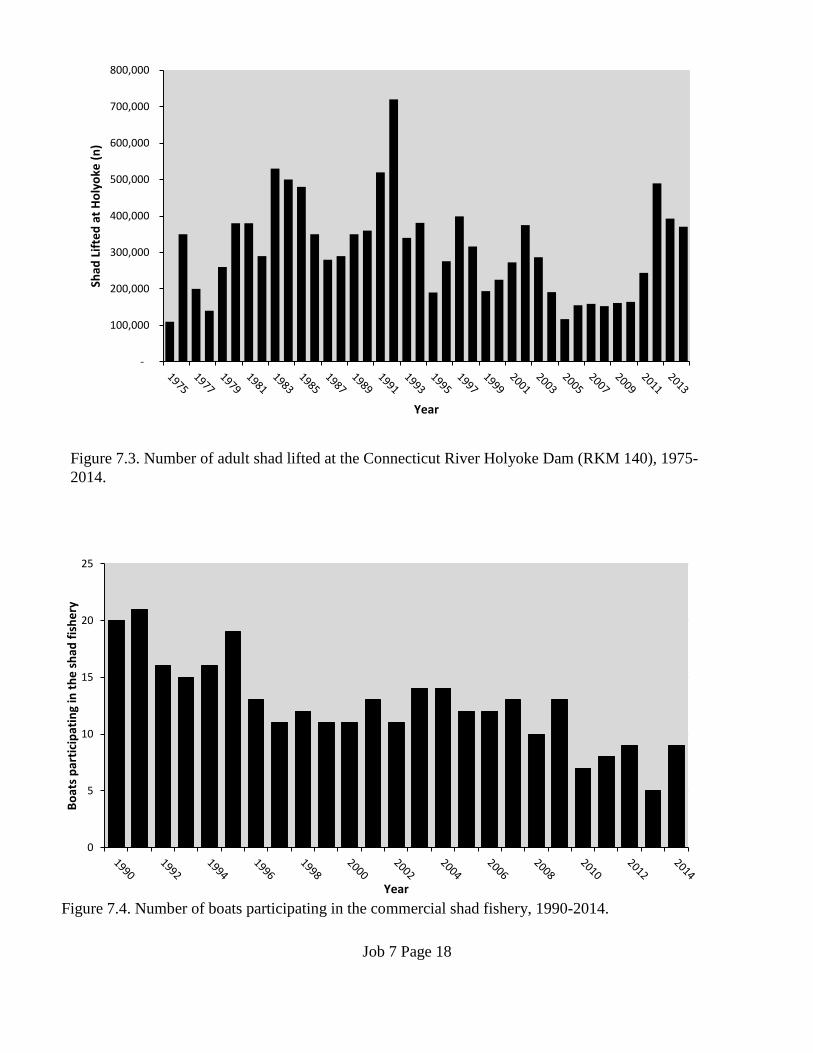
Figure 7.3 Number of adult shad lifted at the Connecticut River Holyoke Dam (RKM 140),
1975-2014.…………………………………………………………………….....18
Figure 7.4 Number of boats participating in the commercial shad fishery, 1990-2014……..18
Figure 7.5 American shad length frequencies (FL, cm), by sex, based on collections at the
Holyoke Lift, 2014………………………………………………………………19
Figure 7.6 Weekly catch per unit effort of juvenile shad and blueback herring, 2014...……20
Figure 7.7 Annual catch per unit effort of juvenile shad and blueback herring, 1978-
2014.......................................................................................................................20
Figure 7.8 Annual catch per unit effort of Connecticut River juvenile American shad by
station,1978-2014 ………….……………………………………………………21
Figure 7.9 Annual catch per unit effort of Connecticut River juvenile blueback herring
by station, 1978-2014 ……..……….……………………………………………22
Job 7 Page 4
JOB 7: AMERICAN SHAD MONITORING AND INSHORE SEINE SURVEYS
GOAL
To monitor relative abundance and distribution of American shad and other fish in Connecticut’s
nearshore waters.
OBJECTIVES
Provide:
1) Information on the adult American shad spawning population: commercial catch, age structure,
sex ratio and size.
2) Annual indices of relative abundance for juvenile shad, blueback herring and common
nearshore marine species.
STUDY PERIOD AND AREA
This report contains information on adult American shad monitoring and seine studies on juvenile
American shad (Alosa sapidissima), blueback herring (Alosa aestivalis), menhaden (Brevoortia
tyrannus) and common nearshore marine species in 2014. Areas of the Connecticut River sampled
range from Holyoke, MA to Essex, CT. The Thames River seine survey begins just south of
Norwich Harbor and ends in Uncasville, CT. Time series data collected under a previous funding
source are also included.
INTRODUCTION
Annual spawning migrations of American shad in the Connecticut River have supported both
recreational and commercial fisheries in the State of Connecticut, as well as recreational fisheries
in upriver states, for generations. There is currently a small commercial driftnet fishery that occurs
in the lower Connecticut River. Connecticut requires an annual commercial shad license for the
Connecticut River. The fishery is managed through area, gear, and season restriction as well as
rest days. The Connecticut River is the state’s only occurrence of a commercial shad fishery.
American shad were once one of Connecticut’s top five most economically important commercial
finfish species in terms of landings. The commercial fishery occurs in the main stem of the
Connecticut River south of the Putnam Bridge in Glastonbury, CT. The recreational fishery
predominantly occurs north of Hartford, CT at River Kilometer (RKM) 83 and south of the
Holyoke Dam in Massachusetts (RKM 139).
The Connecticut Department of Energy and Environmental Protection (CT DEEP) has conducted
annual research studies on adult American shad in the CT River since 1974, to monitor annual
changes in stock composition. Data are collected from mandatory annual reporting of commercial
landings. Landings information is compiled and used to estimate the maximum losses to the
spawning stock from fishing. The Massachusetts Division of Fish and Wildlife monitors fish
passage, which includes adult American shad passage, at the first main stem dam on the CT River
in Holyoke, Massachusetts. Data on the recreational fisheries are monitored periodically by a
Job 7 Page 5
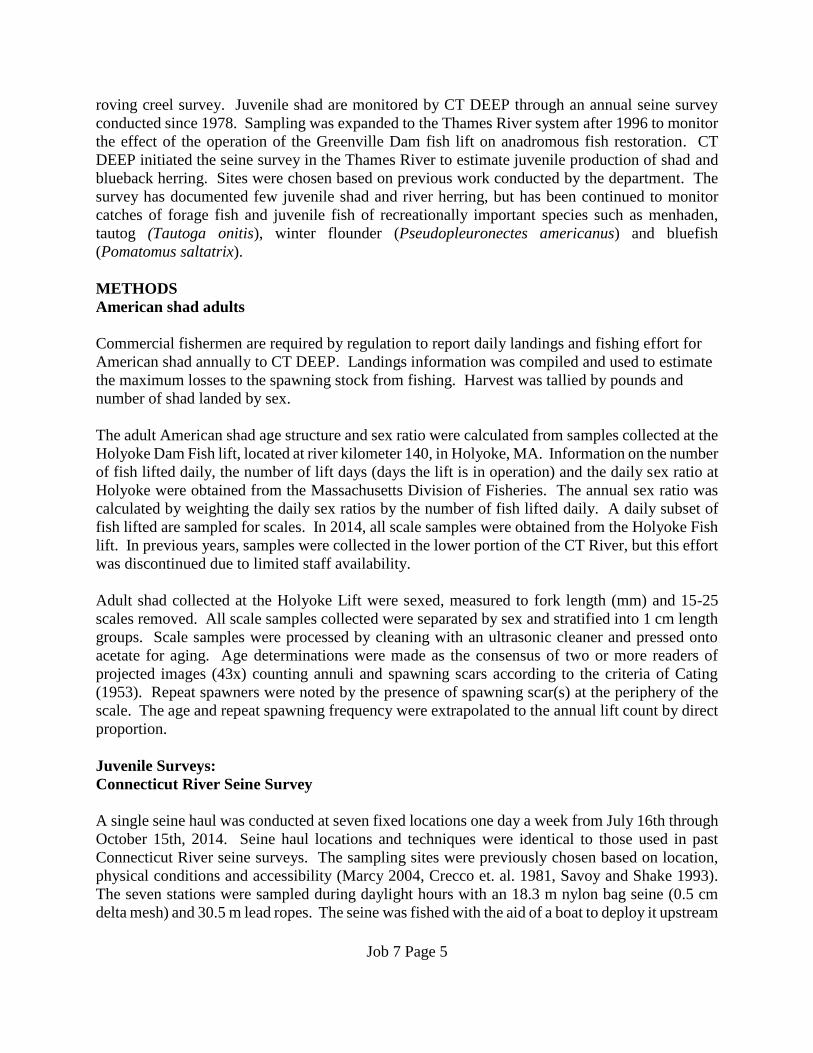
roving creel survey. Juvenile shad are monitored by CT DEEP through an annual seine survey
conducted since 1978. Sampling was expanded to the Thames River system after 1996 to monitor
the effect of the operation of the Greenville Dam fish lift on anadromous fish restoration. CT
DEEP initiated the seine survey in the Thames River to estimate juvenile production of shad and
blueback herring. Sites were chosen based on previous work conducted by the department. The
survey has documented few juvenile shad and river herring, but has been continued to monitor
catches of forage fish and juvenile fish of recreationally important species such as menhaden,
tautog (Tautoga onitis), winter flounder (Pseudopleuronectes americanus) and bluefish
(Pomatomus saltatrix).
METHODS
American shad adults
Commercial fishermen are required by regulation to report daily landings and fishing effort for
American shad annually to CT DEEP. Landings information was compiled and used to estimate
the maximum losses to the spawning stock from fishing. Harvest was tallied by pounds and
number of shad landed by sex.
The adult American shad age structure and sex ratio were calculated from samples collected at the
Holyoke Dam Fish lift, located at river kilometer 140, in Holyoke, MA. Information on the number
of fish lifted daily, the number of lift days (days the lift is in operation) and the daily sex ratio at
Holyoke were obtained from the Massachusetts Division of Fisheries. The annual sex ratio was
calculated by weighting the daily sex ratios by the number of fish lifted daily. A daily subset of
fish lifted are sampled for scales. In 2014, all scale samples were obtained from the Holyoke Fish
lift. In previous years, samples were collected in the lower portion of the CT River, but this effort
was discontinued due to limited staff availability.
Adult shad collected at the Holyoke Lift were sexed, measured to fork length (mm) and 15-25
scales removed. All scale samples collected were separated by sex and stratified into 1 cm length
groups. Scale samples were processed by cleaning with an ultrasonic cleaner and pressed onto
acetate for aging. Age determinations were made as the consensus of two or more readers of
projected images (43x) counting annuli and spawning scars according to the criteria of Cating
(1953). Repeat spawners were noted by the presence of spawning scar(s) at the periphery of the
scale. The age and repeat spawning frequency were extrapolated to the annual lift count by direct
proportion.
Juvenile Surveys:
Connecticut River Seine Survey
A single seine haul was conducted at seven fixed locations one day a week from July 16th through
October 15th, 2014. Seine haul locations and techniques were identical to those used in past
Connecticut River seine surveys. The sampling sites were previously chosen based on location,
physical conditions and accessibility (Marcy 2004, Crecco et. al. 1981, Savoy and Shake 1993).
The seven stations were sampled during daylight hours with an 18.3 m nylon bag seine (0.5 cm
delta mesh) and 30.5 m lead ropes. The seine was fished with the aid of a boat to deploy it upstream
Job 7 Page 6
and offshore to sweep down through the site. Using the lead ropes, the seine was towed in a
downstream arc to the shore and beached. Clupeids (Alosa sapidissima, A. aestivalis, A.
pseudoharengus, and Brevoortia tyrannus) were returned to the laboratory for measurement and
identification. In the laboratory, juvenile clupeids were identified to species by the criteria of
Lippson and Moran (1974) and counted. For each sample, up to 40 randomly selected clupeids of
each species were measured to total length (mm). All fish species other than family clupeidae,
were identified, quantified or estimated and released. Invertebrate species are either counted or
noted as present.
A relative abundance index was calculated as a geometric mean catch per unit effort for both shad
and blueback herring. The geometric mean is the preferred method when reporting to ASMFC for
annual compliance reports because it normalizes clustered data. See Job 5 (Gottschall and Pacileo
2013) for methods used to calculate the geometric mean.
Thames River Seine Survey
Eight fixed stations were sampled twice a month from July 17th through August 28th. The method
of seine deployment, gear used and sample processing in the Thames River was identical to that
used for the Connecticut River seine survey.
RESULTS
Commercial Fishery Landings
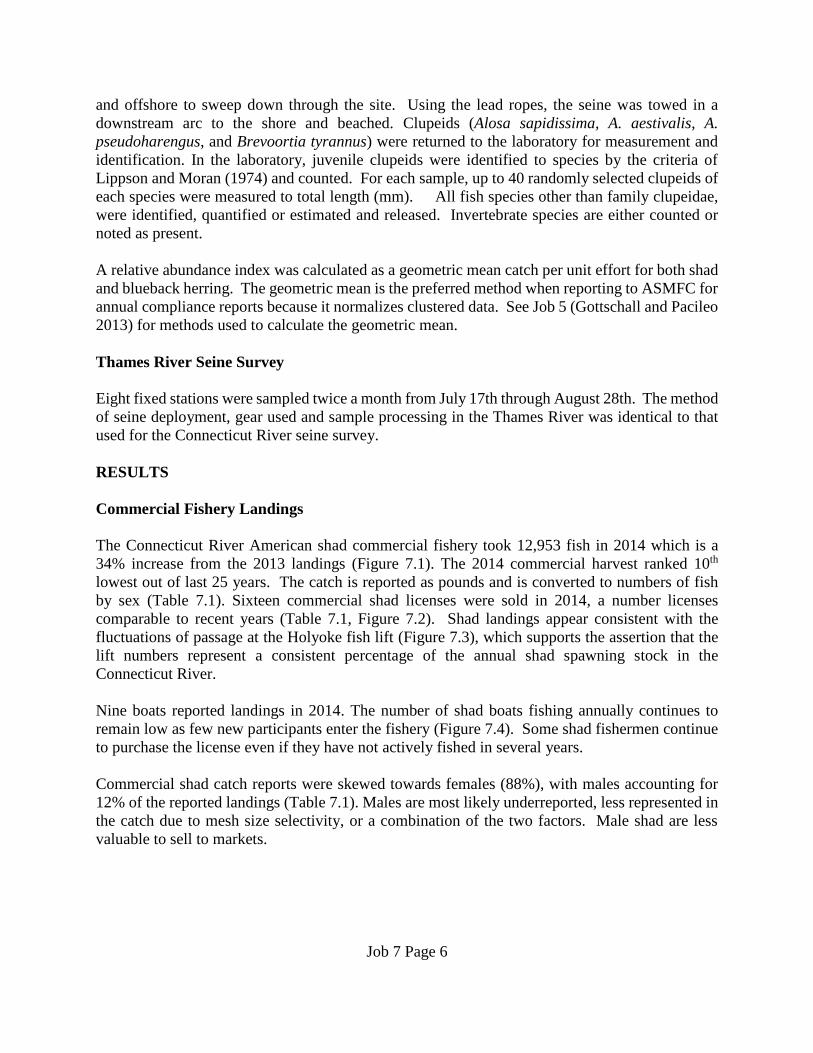
The Connecticut River American shad commercial fishery took 12,953 fish in 2014 which is a
34% increase from the 2013 landings (Figure 7.1). The 2014 commercial harvest ranked 10th
lowest out of last 25 years. The catch is reported as pounds and is converted to numbers of fish
by sex (Table 7.1). Sixteen commercial shad licenses were sold in 2014, a number licenses
comparable to recent years (Table 7.1, Figure 7.2). Shad landings appear consistent with the
fluctuations of passage at the Holyoke fish lift (Figure 7.3), which supports the assertion that the
lift numbers represent a consistent percentage of the annual shad spawning stock in the
Connecticut River.
Nine boats reported landings in 2014. The number of shad boats fishing annually continues to
remain low as few new participants enter the fishery (Figure 7.4). Some shad fishermen continue
to purchase the license even if they have not actively fished in several years.
Commercial shad catch reports were skewed towards females (88%), with males accounting for
12% of the reported landings (Table 7.1). Males are most likely underreported, less represented in
the catch due to mesh size selectivity, or a combination of the two factors. Male shad are less
valuable to sell to markets.
Job 7 Page 7
Connecticut River Adult American shad
The Holyoke Fish lift was open for fish passage from April 24 through July 15, 2014 except for
closings due to high water or operational factors. Total lift numbers of American shad at the
Holyoke Dam were obtained from the Massachusetts Division of Fisheries and Wildlife. The
number of shad passed at Holyoke in 2014 (370,506) was the 11th highest value since 1975 (Figure
7.3). The number of American shad lifted upstream annually at the Holyoke Dam has been highly
variable through the time series, however 2014 was well above the long term mean of 301,000
(median = 289,000, range 110,000 to 720,000).
The 2014 shad run sex ratio was derived from information collected at the Holyoke fish lift which
is located at River Kilometer 140, upstream of both the commercial and sport fisheries. The
combined impact of these small fisheries is likely not significant enough to affect the composition
of the run. The weighted sex ratio of shad sampled at Holyoke was 66% male and 34% female
(Figure 7.5).
American shad scales (n=513) were collected on 29 days over a 66 day span during lift operation.
The shad age structure from scale samples was expanded based on the number of fish lifted at
Holyoke Dam. Scale samples that were able to be aged totaled 496 (187 females and 309 males).
Samples not aged had either regenerated scales or were missing data on the fish.
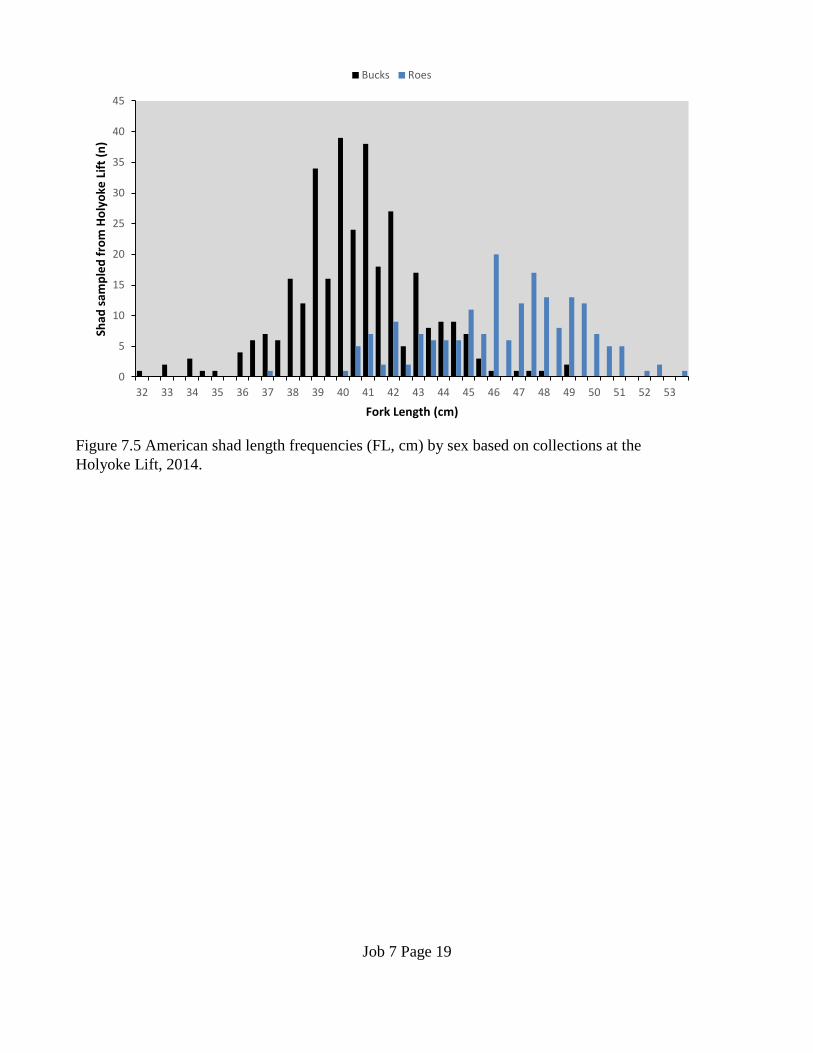
Length frequency of American shad collected at the Holyoke lift ranged from 32.0 to 49.0 cm FL
for male shad and 37.0 to 53.5 cm FL among female shad. Length frequencies of both sexes were
fairly normally distributed (Figures 7.5 and 7.6). Average size among males was 40.6 cm FL and
among females was 46.4 cm FL.
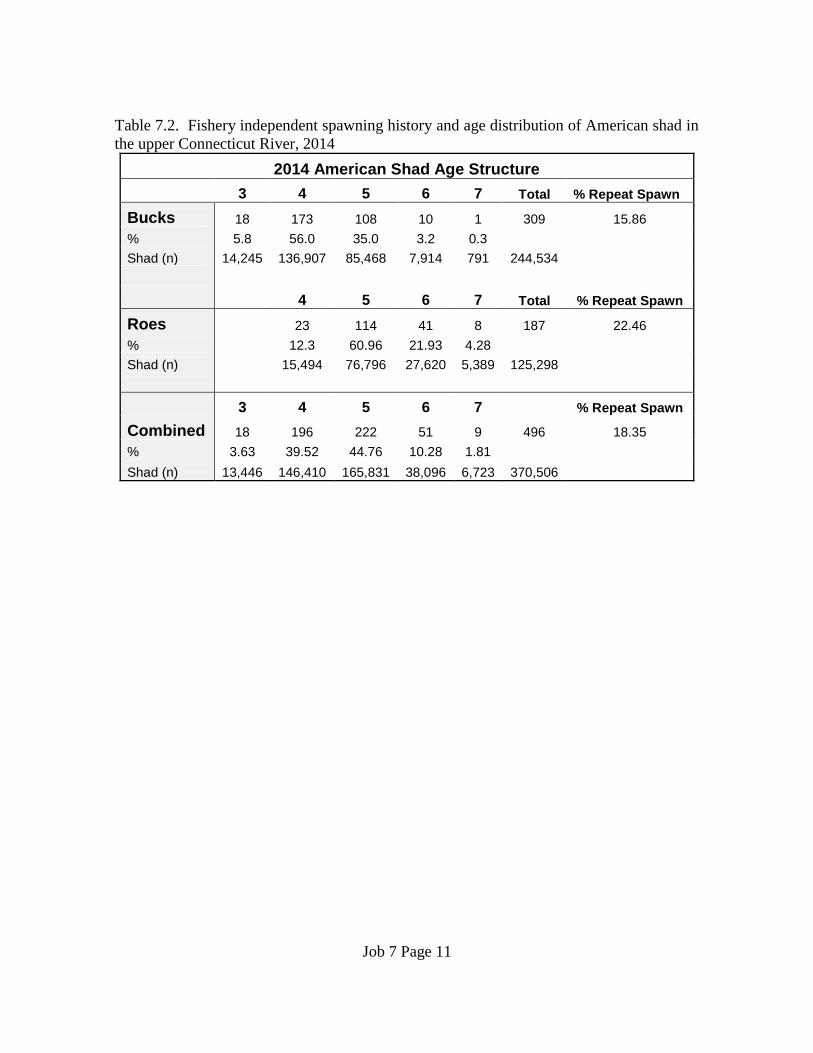
The 2014 male population of spawning adult shad was produced from the 2008-2010 year classes.
A large percentage (56%) of male shad scales examined were from four year old fish, while 35%
were from 5 year old fish and 6% were 3 year old fish. Six and seven year old fish represented
3.2% and 0.3 % of the population, respectively (Table 7.2).
The majority of female shad (61%) sampled in 2014 were five year old fish from the 2009 year
class. Six year old fish contributed to 21.9% of the 2014 run and 12.3% were 4 year old fish. Seven
year old fish represented 4.3%. The incidence of overall repeat spawning in 2014 increased. The
percentage of repeat spawning fish was 15.9% for males and 22.5% among females, with an overall
repeat spawn rate of 18.4% (Table 7.2).
Seine Survey
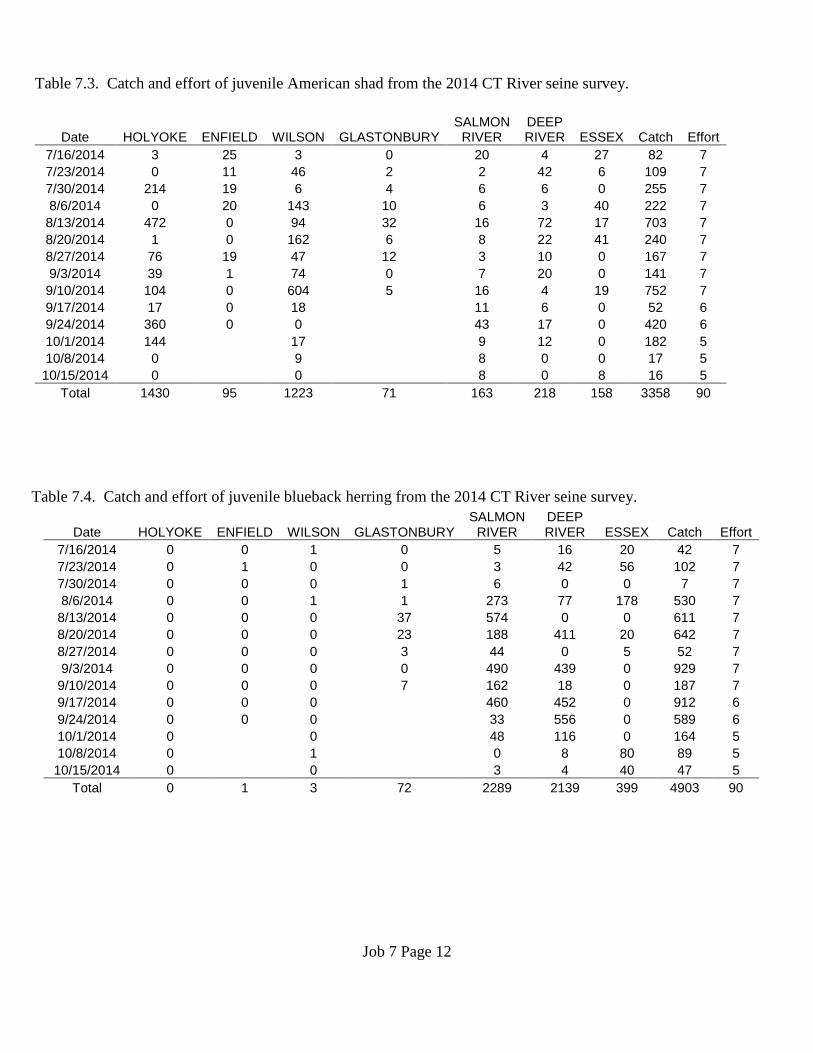
Juvenile collections in the Connecticut River were conducted from July 16th through October 15th,
2014. A total of 3,358 juvenile American shad were collected for the season (Table 7.3). The
highest catch in 2014 was 604 shad collected at the Wilson site (RKM 89) in early September,
representing 49% of the total Wilson catch for the season and 18% of the overall catch (Table 7.3).
The stations with the largest proportion of the season’s catch were Holyoke (43%) and Wilson
(36%). A total of 4,903 blueback herring were collected in 2014 (Table 7.4).
Job 7 Page 8
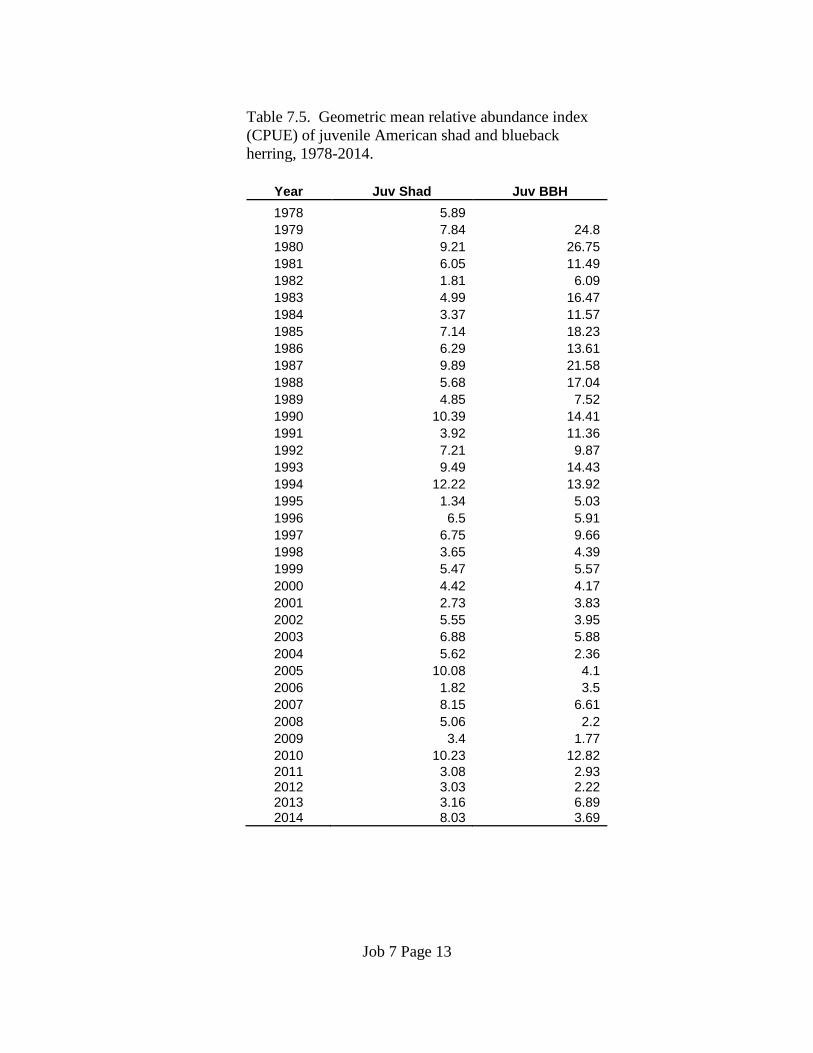
The geometric mean CPUE for shad in 2014 more than doubled from 2013 and ranks as the 9th
largest in the time series (Table 7.5). The annual index of juvenile abundance (geometric mean
catch/haul) has varied without trend over the time series. The geometric mean CPUE for American
shad was slightly more than double that of blueback herring.
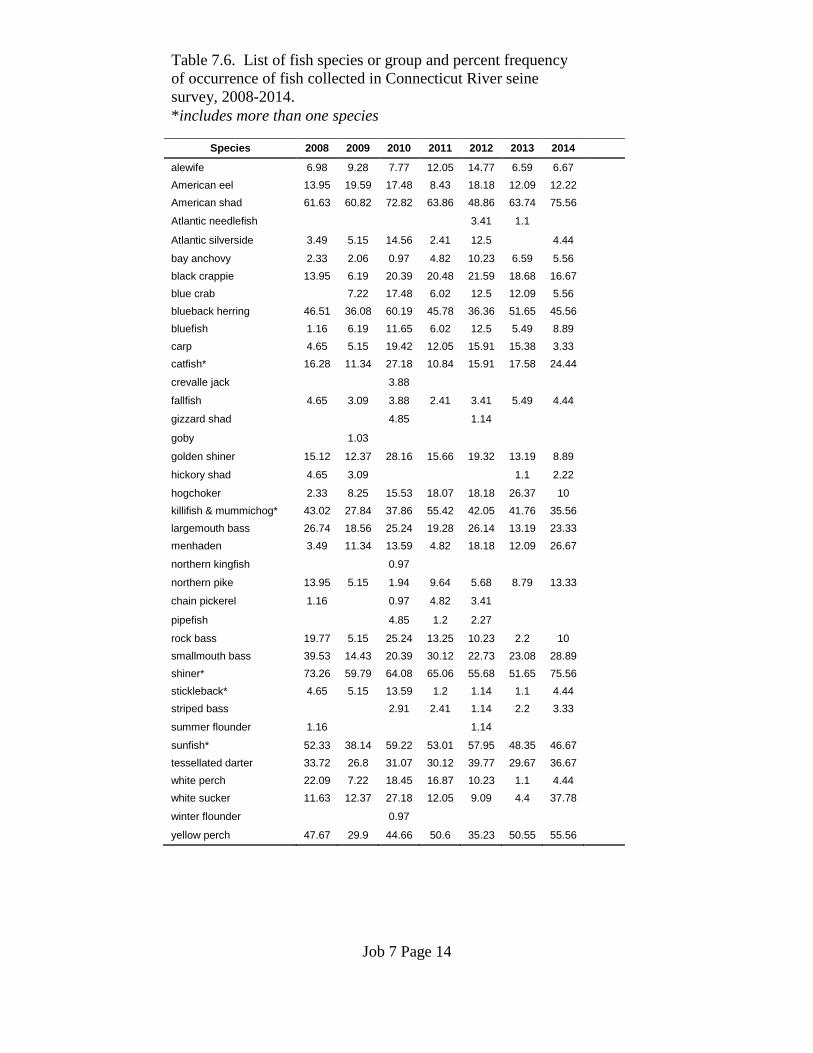
In the 90 hauls completed in 2014, over 35,000 fish representing 29 species or taxonomic groups
were collected (Table 7.6). To minimize mortality and to facilitate returning large catches of fish
quickly to the water, some fish were identified only to the family or genus level (e.g. sunfish,
catfish, killifish). Large catches of common species estimated with a visual count to minimize
handling and processing time. Estimated catches are noted as such in the database. In 2014, the
most abundant species collected were menhaden, shiners, blueback herring and American shad.
Shiners, juvenile shad, yellow perch (Perca flavescens), sunfish and juvenile bluebacks had the
five highest frequencies of occurrence (Table 7.6).
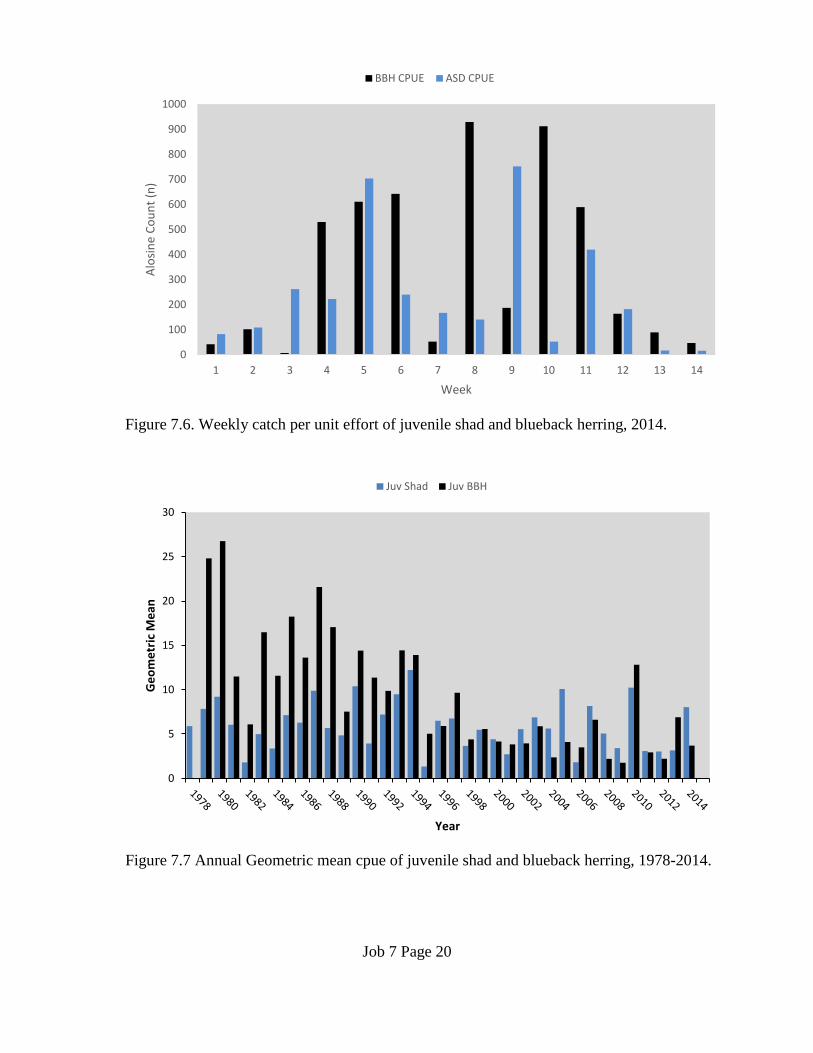
The ratio of blueback catches to shad varied seasonally in 2014 (Figure 7.6) as well as through the
time series (Figure 7.7). In 2014, blueback catches exceeded shad catches. Historically, blueback
catches would far exceed those of American shad. The 2014 Alosa spp. CPUE indices were both
below average. The blueback geometric mean CPUE is the 7th lowest in the time series.
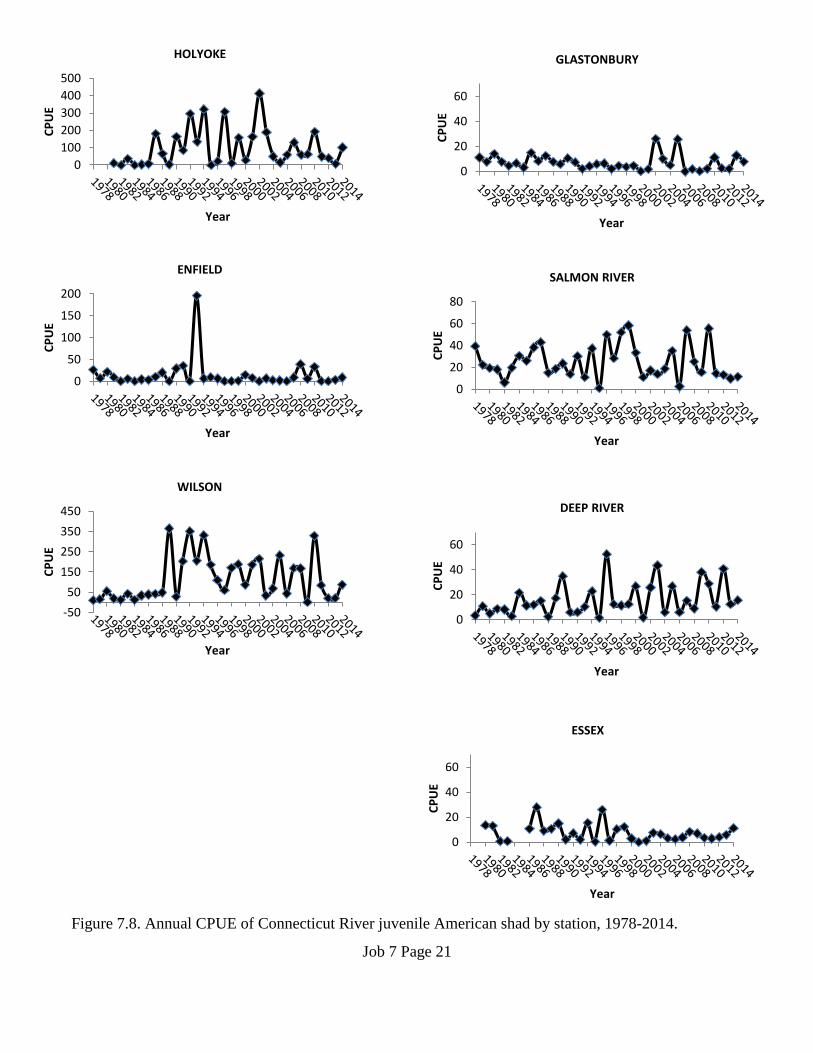
Annual catches of American shad by station over time has been variable with Holyoke and Wilson
typically being the sites with the largest annual catches of juvenile shad (Figure 7.8). The Enfield
and Glastonbury sites provided the lowest catches of the season again in 2014. The southernmost
station (Essex) produced the highest number of zero catches and fifth lowest catch of the season.
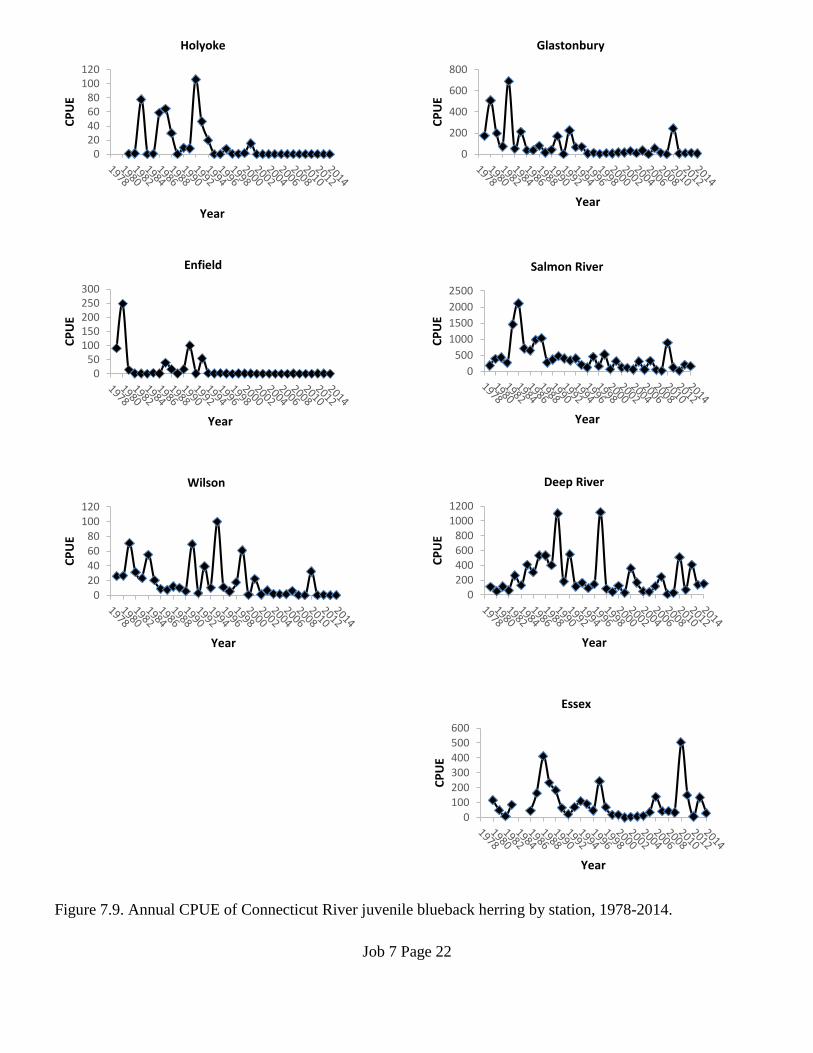
The Salmon River site ranks as the highest total catch for blueback herring, with 47% of the
season’s catch. The single highest seine haul of bluebacks was at Salmon River on August 13th
(574) but was only 12% of the season’s total catch of blueback herring (Table 7.4).
Thames River Seine Survey
The 2014 Thames River survey was conducted bi-weekly from July 17th through August 28th with
27 seine hauls. Over 32,000 fish were collected representing 45 groups or species (Table 7.8).
Atlantic silversides had the highest presence in the catch (28%), followed by menhaden, bluefish
and Fundulus spp. Other notable species collected in 2014 were: Winter flounder, striped bass
(Marone saxatilis), scup (Stenotomus chrysops), snapper bluefish, summer flounder (Paralichthys
dentatus) and tautog. A longhorn sculpin (Myoxocephalus octodecemspinosus) was collected for
the first time in this survey in 2014.
Over the time series, menhaden catches have varied widely from a low in 2013 of just 31 fish to
over a million fish collected in 2000. The 2014 menhaden index, geometric mean CPUE 22.78,
ranked third highest out of 17 (Table 7.8). Juvenile menhaden catches have been variable with the
lowest CPUE in 2013 (0.14) and a peak geometric mean CPUE of 117.5 in 2002.
MODIFICATIONS
Job 7 will not be active during the next grant period as the work is being transferred to another
source of funds.
Job 7 Page 9
LITERATURE CITED
Cating, J.P. 1953. Determining the age of Atlantic shad from their scales. Fish Bull. U.S.
85(54):187-199.
Crecco, V., and T. Savoy. 1985. Density dependent catchability and its potential causes and
consequences on Connecticut River shad, Alosa sapidissima. Can. J. Fish. Aquat.
Sci. 42:1649-1657.
Gottschall, K and D. Pacileo. 2013. Marine Finfish Survey, Job 2. In: A Study of Marine
Recreational Fisheries in Connecticut. Annual Progress Report, Ct DEP/Fisheries
Division, Old Lyme, CT.
Lippson, A.J., and R.L. Moran. 1974. Manual for the identification of early developmental
stages of fishes of the Potomac River estuary. Maryland Dept. of Nat. Res. PPSP-MP-
13. 282 p.
Marcy, B.C., Jr. 2004. Early life history studies of American shad in the lower Connecticut river
and the effects of the Connecticut yankee plant. Pages 155-180 in P.M. Jacobson, D.A.
Dixon, W.C. Leggett, B.C. Marcy, Jr., and R.R. Massengill, editors. The Connecticut
River Ecological Study (1965-1973) revisited: ecology of the lower Connecticut River
1973-2003. American Fisheries Society, Monograph 9, Bethesda, Maryland.
Savoy, T. 1996. Anadromous Fish Studies in Connecticut Waters. Progress Report AFC-24.
Connecticut Dept. Environ. Protect. 62p.
Savoy, T. and D. Shake. 1993. Anadromous Fish Studies in Connecticut Waters. Progress
Report AFC-21-1. Connecticut Dept. Environ. Protect. 44p.
Slater, C. 2012. Anadromous Fish Investigations. Annual Report F-45-R-28. Massachusetts
Division of Fisheries and Wildlife. 10p.
Job 7 Page 10
Table 7.1. Annual American shad commercial fishery harvest. Landings are reported by
weight (lbs.) and counts, by sex, 1990-2014.
Year Total lbs.
# Male Male Wt
(lbs.)
Mn Wt Male
# Female Female
Wt (lbs.)
Mn Wt Female
# of Boats
Total Trips
1990 259,425 8,568 21,142 20 402
1991 149,300 9,174 23,112 21 416
1992 144,300 7,171 26,768 16 410
1993 96,660 5,173 17,790 15 332
1994 104,000 1,812 19,400 16 312
1995 61,576 1,862 5,893 3.2 12,299 55,682 4.5 19 352
1996 66,757 2,298 6,941 3 13,660 59,816 4.4 13 264
1997 91,003 2,812 10,275 3.7 18,743 80,728 4.3 11 271
1998 89,342 2,983 9,440 3.2 18,529 79,902 4.3 12 280
1999 44,574 872 3,373 3.9 9,506 41,201 4.3 11 195
2000 107,416 2,342 7,491 3.2 21,228 99,925 4.7 11 210
2001 59,234 1,469 3,980 2.7 13,074 55,254 4.2 13 193
2002 108,099 7,153 22,555 3.2 20,653 85,544 4.1 11 248
2003 111,127 5,176 17,518 3.4 21,244 93,609 4.4 14 249
2004 66,328 2,456 8,000 3.3 13,436 58,328 4.3 14 226
2005 69,333 1,873 6,136 3.3 15,336 67,070 4.4 12 218
2006 38,547 1,864 5,445 2.9 7,372 33,102 4.5 12 185
2007 51,572 1,688 5,701 3.4 9,888 43,497 4.4 13 199
2008 28,419 858 2,637 3.1 6,486 25,782 4 10 203
2009 40,680 1156 4,045 3.5 6,437 32,187 5 13 182
2010 24,641 855 2,994 3.5 4,238 21,192 5 7 202
2011 32,183 953 3,334 3.5 5,772 28,849 5 8 218
2012 61,623 2,810 9,835 3.5 10,358 51,788 5 9 160
2013 40,598 1,249 4,371 3.5 7,245 36,227 5 5 85
2014 61,544 2,147 7,516 3.5 10,806 54,028 5 9 160
Job 7 Page 11
Table 7.2. Fishery independent spawning history and age distribution of American shad in
the upper Connecticut River, 2014
2014 American Shad Age Structure
3 4 5 6 7 Total % Repeat Spawn
Bucks 18 173 108 10 1 309 15.86
% 5.8 56.0 35.0 3.2 0.3
Shad (n) 14,245 136,907 85,468 7,914 791 244,534
4 5 6 7 Total % Repeat Spawn
Roes 23 114 41 8 187 22.46
% 12.3 60.96 21.93 4.28
Shad (n) 15,494 76,796 27,620 5,389 125,298
3 4 5 6 7 % Repeat Spawn
Combined 18 196 222 51 9 496 18.35
% 3.63 39.52 44.76 10.28 1.81
Shad (n) 13,446 146,410 165,831 38,096 6,723 370,506
Job 7 Page 12
Table 7.3. Catch and effort of juvenile American shad from the 2014 CT River seine survey.
Date HOLYOKE ENFIELD WILSON GLASTONBURY SALMON
RIVER DEEP RIVER ESSEX Catch Effort
7/16/2014 3 25 3 0 20 4 27 82 7
7/23/2014 0 11 46 2 2 42 6 109 7
7/30/2014 214 19 6 4 6 6 0 255 7
8/6/2014 0 20 143 10 6 3 40 222 7
8/13/2014 472 0 94 32 16 72 17 703 7
8/20/2014 1 0 162 6 8 22 41 240 7
8/27/2014 76 19 47 12 3 10 0 167 7
9/3/2014 39 1 74 0 7 20 0 141 7
9/10/2014 104 0 604 5 16 4 19 752 7
9/17/2014 17 0 18 11 6 0 52 6
9/24/2014 360 0 0 43 17 0 420 6
10/1/2014 144 17 9 12 0 182 5
10/8/2014 0 9 8 0 0 17 5
10/15/2014 0 0 8 0 8 16 5
Total 1430 95 1223 71 163 218 158 3358 90
Table 7.4. Catch and effort of juvenile blueback herring from the 2014 CT River seine survey.
Date HOLYOKE ENFIELD WILSON GLASTONBURY SALMON
RIVER DEEP RIVER ESSEX Catch Effort
7/16/2014 0 0 1 0 5 16 20 42 7
7/23/2014 0 1 0 0 3 42 56 102 7
7/30/2014 0 0 0 1 6 0 0 7 7
8/6/2014 0 0 1 1 273 77 178 530 7
8/13/2014 0 0 0 37 574 0 0 611 7
8/20/2014 0 0 0 23 188 411 20 642 7
8/27/2014 0 0 0 3 44 0 5 52 7
9/3/2014 0 0 0 0 490 439 0 929 7
9/10/2014 0 0 0 7 162 18 0 187 7
9/17/2014 0 0 0 460 452 0 912 6
9/24/2014 0 0 0 33 556 0 589 6
10/1/2014 0 0 48 116 0 164 5
10/8/2014 0 1 0 8 80 89 5
10/15/2014 0 0 3 4 40 47 5
Total 0 1 3 72 2289 2139 399 4903 90
Job 7 Page 13
Table 7.5. Geometric mean relative abundance index
(CPUE) of juvenile American shad and blueback
herring, 1978-2014.
Year Juv Shad Juv BBH
1978 5.89 1979 7.84 24.8
1980 9.21 26.75
1981 6.05 11.49
1982 1.81 6.09
1983 4.99 16.47
1984 3.37 11.57
1985 7.14 18.23
1986 6.29 13.61
1987 9.89 21.58
1988 5.68 17.04
1989 4.85 7.52
1990 10.39 14.41
1991 3.92 11.36
1992 7.21 9.87
1993 9.49 14.43
1994 12.22 13.92
1995 1.34 5.03
1996 6.5 5.91
1997 6.75 9.66
1998 3.65 4.39
1999 5.47 5.57
2000 4.42 4.17
2001 2.73 3.83
2002 5.55 3.95
2003 6.88 5.88
2004 5.62 2.36
2005 10.08 4.1
2006 1.82 3.5
2007 8.15 6.61
2008 5.06 2.2
2009 3.4 1.77
2010 10.23 12.82
2011 3.08 2.93 2012 3.03 2.22 2013 3.16 6.89 2014 8.03 3.69
Job 7 Page 14
Species 2008 2009 2010 2011 2012 2013 2014
alewife 6.98 9.28 7.77 12.05 14.77 6.59 6.67
American eel 13.95 19.59 17.48 8.43 18.18 12.09 12.22
American shad 61.63 60.82 72.82 63.86 48.86 63.74 75.56
Atlantic needlefish 3.41 1.1
Atlantic silverside 3.49 5.15 14.56 2.41 12.5 4.44
bay anchovy 2.33 2.06 0.97 4.82 10.23 6.59 5.56
black crappie 13.95 6.19 20.39 20.48 21.59 18.68 16.67
blue crab 7.22 17.48 6.02 12.5 12.09 5.56
blueback herring 46.51 36.08 60.19 45.78 36.36 51.65 45.56
bluefish 1.16 6.19 11.65 6.02 12.5 5.49 8.89
carp 4.65 5.15 19.42 12.05 15.91 15.38 3.33
catfish* 16.28 11.34 27.18 10.84 15.91 17.58 24.44
crevalle jack 3.88
fallfish 4.65 3.09 3.88 2.41 3.41 5.49 4.44
gizzard shad 4.85 1.14
goby 1.03
golden shiner 15.12 12.37 28.16 15.66 19.32 13.19 8.89
hickory shad 4.65 3.09 1.1 2.22
hogchoker 2.33 8.25 15.53 18.07 18.18 26.37 10
killifish & mummichog* 43.02 27.84 37.86 55.42 42.05 41.76 35.56
largemouth bass 26.74 18.56 25.24 19.28 26.14 13.19 23.33
menhaden 3.49 11.34 13.59 4.82 18.18 12.09 26.67
northern kingfish 0.97
northern pike 13.95 5.15 1.94 9.64 5.68 8.79 13.33
chain pickerel 1.16 0.97 4.82 3.41
pipefish 4.85 1.2 2.27
rock bass 19.77 5.15 25.24 13.25 10.23 2.2 10
smallmouth bass 39.53 14.43 20.39 30.12 22.73 23.08 28.89
shiner* 73.26 59.79 64.08 65.06 55.68 51.65 75.56
stickleback* 4.65 5.15 13.59 1.2 1.14 1.1 4.44
striped bass 2.91 2.41 1.14 2.2 3.33
summer flounder 1.16 1.14
sunfish* 52.33 38.14 59.22 53.01 57.95 48.35 46.67
tessellated darter 33.72 26.8 31.07 30.12 39.77 29.67 36.67
white perch 22.09 7.22 18.45 16.87 10.23 1.1 4.44
white sucker 11.63 12.37 27.18 12.05 9.09 4.4 37.78
winter flounder 0.97
yellow perch 47.67 29.9 44.66 50.6 35.23 50.55 55.56
Table 7.6. List of fish species or group and percent frequency
of occurrence of fish collected in Connecticut River seine
survey, 2008-2014.
*includes more than one species
Job 7 Page 15
Table 7.7. List of fish species or group and percent frequency of occurrence of fish collected in
Thames River seine survey, 2005-2014. *includes more than one species
Species 2005 2006 2007 2008 2009 2010 2011 2012 2013 2014
alewife 6.67 1.56 17.86 1.59 8.06 1.77 5.36 7.50 5.26 1.11
American eel 6.25 1.59 4.84 0.71 1.79 2.50 1.32
American shad 5.36 6.45 1.79 5.00
Atlantic herring 3.23
Atlantic needlefish 6.67 1.56 1.11
Atlantic silverside 80.00 82.14 74.60 80.65 21.63 98.21 100.00 75.00 27.78
bay anchovy 10.94 7.14 14.29 9.68 3.55 10.71 27.50 10.53 1.11
blueback herring 1.79 1.59 1.61 0.35 2.50 2.63 2.22
bluefish 60.00 45.31 44.64 31.75 46.77 15.25 41.07 85.00 48.68 13.33
brown trout 1.79
butterfish 3.33 1.59 4.84 1.06 1.79 1.11
carp 1.56 1.79 0.35
catfish* 1.59
crevalle jack 23.33 12.50 5.36 1.59 11.29 3.55 1.11
cunner 1.61 5.00
darter 1.59 1.79
gizzard shad 2.50
golden shiner 1.79 1.32
hogchoker 17.86 7.50 7.89 3.33
horseshoe crab 3.33 killifish & mummichog* 43.33 25.00 32.14 42.86 20.97 6.03 69.64 52.50 60.53 12.22
longhorn sculpin 1.11
largemouth bass 1.56 2.63
lizardfish 6.25 5.36 2.50 1.32
menhaden 20.00 35.94 42.86 12.70 22.58 2.13 17.86 50.00 10.53 15.56
naked goby 3.13 8.93 9.52 1.77 16.07 15.00 9.21 3.33
northern kingfish 3.33 7.14 10.00 1.32 1.11
northern pike 3.33 3.57
oyster toadfish 0.35
pipefish 13.33 15.63 26.79 11.11 9.68 1.42 20.00 3.95
scup 6.67 14.29 20.00 1.32 1.11 sheepshead minnow 3.33 3.57 3.17 1.79 2.63
spot 1.79 1.59 10.00 1.32
spottaill shiner 6.67 9.38 3.57 6.35 3.23 1.06 7.14 5.00 3.33
stickleback* 16.67 12.50 5.36 36.51 32.26 2.13 42.86 5.00 11.84 3.33
striped bass 3.33 6.25 21.43 11.11 8.06 1.77 7.14 17.50 21.05 1.11
striped mullet 5.26
striped sea robin 3.57 2.50
summer flounder 4.69 5.36 15.87 4.84 0.35 3.57 10.53 6.67
sunfish* 1.56 7.14 3.95 1.11
tautog 20.00 6.25 21.43 12.70 1.61 1.77 3.57 12.50 2.63
tomcod 3.57 4.76 3.23 0.35 1.79 2.50 5.26
white mullet 4.69 3.17 1.61 3.90 1.79 7.50 2.63
white perch 13.33 3.13 8.93 1.59 1.61 0.35 1.79 2.63
white sucker 1.32 windowpane flounder 7.14 1.79
winter flounder 23.33 10.94 37.50 26.98 9.68 1.77 3.57 20.00 15.79 4.44
yellow perch 1.32
Job 7 Page 16
Table 7.8. Number collected, number of seine
hauls and geometric mean catch per haul
(G Mn) of Thames River juvenile menhaden,
1998-2014.
Year Menhaden Seine Hauls G Mn
1998 429,209 151 12.63
1999 594,724 144 20.61
2000 1,020,000 112 50.25
2001 5,458 119 2.13
2002 840,458 55 117.46
2003 248,984 80 12.78
2004 30,274 56 3.91
2005 3,118 30 1.19
2006 129,719 64 6.08
2007 100,082 56 6.39
2008 195 63 0.37
2009 39,909 62 2.11
2010 212 64 0.18
2011 418 56 0.58
2012 8,662 40 3.49
2013 31 76 0.14
2014 27,332 27 22.78
Table 3.8. List of fish species or group and percent frequency of occurrence of
fish collected in Thames River seine survey, 2005-2013.
*includes more than one species.
Job 7 Page 17
Figure 7.2. Number of Commercial shad license sales, 1995-2014.
0
5
10
15
20
25
30
35
40
45
Co
mm
erc
ial S
had
Lic
en
se
Year
Figure 7.1 Commercial Landings (lbs) for Adult American shad, 1990-2014.
0
50,000
100,000
150,000
200,000
250,000
300,000
1990 1992 1994 1996 1998 2000 2002 2004 2006 2008 2010 2012 2014
Shad
Lan
din
gs (
lbs)
Year
Job 7 Page 18
Figure 7.4. Number of boats participating in the commercial shad fishery, 1990-2014.
0
5
10
15
20
25
Bo
ats
par
tici
pat
ing
in t
he
sh
ad f
ish
ery
Year
Figure 7.3. Number of adult shad lifted at the Connecticut River Holyoke Dam (RKM 140), 1975-
2014.
-
100,000
200,000
300,000
400,000
500,000
600,000
700,000
800,000
Shad
Lif
ted
at
Ho
lyo
ke (
n)
Year
Job 7 Page 19
Figure 7.5 American shad length frequencies (FL, cm) by sex based on collections at the
Holyoke Lift, 2014.
0
5
10
15
20
25
30
35
40
45
32 33 34 35 36 37 38 39 40 41 42 43 44 45 46 47 48 49 50 51 52 53
Shad
sam
ple
d f
rom
Ho
lyo
ke L
ift
(n)
Fork Length (cm)
Bucks Roes
Job 7 Page 20
Figure 7.6. Weekly catch per unit effort of juvenile shad and blueback herring, 2014.
0
100
200
300
400
500
600
700
800
900
1000
1 2 3 4 5 6 7 8 9 10 11 12 13 14
Alo
sin
e C
ou
nt
(n)
Week
BBH CPUE ASD CPUE
Figure 7.7 Annual Geometric mean cpue of juvenile shad and blueback herring, 1978-2014.
0
5
10
15
20
25
30
Ge
om
etr
ic M
ean
Year
Juv Shad Juv BBH
Job 7 Page 21
0
100
200
300
400
500
CP
UE
Year
HOLYOKE
0
50
100
150
200
CP
UE
Year
ENFIELD
0
20
40
60
CP
UE
Year
GLASTONBURY
0
20
40
60
80
CP
UE
Year
SALMON RIVER
0
20
40
60
CP
UE
Year
DEEP RIVER
0
20
40
60
CP
UE
Year
ESSEX
-50
50
150
250
350
450
CP
UE
Year
WILSON
Figure 7.8. Annual CPUE of Connecticut River juvenile American shad by station, 1978-2014.
Job 7 Page 22
020406080
100120
CP
UE
Year
Holyoke
050
100150200250300
CP
UE
Year
Enfield
0200400600800
10001200
CP
UE
Year
Deep River
020406080
100120
CP
UE
Year
Wilson
0100200300400500600
CP
UE
Year
Essex
0
200
400
600
800
CP
UE
Year
Glastonbury
Figure 7.9. Annual CPUE of Connecticut River juvenile blueback herring by station, 1978-2014.
0
500
1000
1500
2000
2500
CP
UE
Year
Salmon River
JOB 8: ESTUARINE SEINE SURVEY
TABLE OF CONTENTS OBJECTIVES ......................................................................................................................2 METHODS ..........................................................................................................................2 RESULTS ...........................................................................................................................3 Relative Abundance of Juvenile Winter Flounder and Tautog ............................................3 Presence of other Important Recreational Finfish ...............................................................4 Relative Abundance of Forage Species ...............................................................................5 Relative Abundance of Invertebrate Species .......................................................................6 Comparison of 2013-2014 Summer Samples with 1988-1990 ............................................6 Finfish Species Richness......................................................................................................6 MODIFICATIONS ..............................................................................................................6 Appendix 8.1: Finfish species taken in the Estuarine Seine Survey, 1988-2014. .............26 Appendix 8.2: Invertebrate species taken in the Estuarine Seine Survey, 2014. ...............27
LIST OF TABLES Table 8.1: Geometric mean catch and percent occurrence of species commonly taken in
seine samples, 1988-2014 ..................................................................................8 Table 8.2: Mean catch of young-of-year winter flounder at eight sites sampled
by seine, 1988-2014 .........................................................................................12 Table 8.3: Total catch of all finfish and invertebrate species taken in seine samples, 1988-2014 .........................................................................................13 Table 8.4: Cold and warm temperate species captured in the Estuarine Seine Survey ....19
LIST OF FIGURES Figure 8.1: Sampling locations of the seine survey along the coast of Connecticut .........20 Figure 8.2: Mean catch of all finfish taken in seine samples, 1988-2014 .........................20 Figure 8.3: Mean catch of young-of-year winter flounder, 1988-2014 .............................21 Figure 8.4: Mean catch and occurrence rate of tautog taken in seine samples,
1988-2014 ........................................................................................................21 Figure 8.5: Mean catch of forage fish at eight sites sampled by seine, 1988-2014. ..........22 Figure 8.6: Total catch of forage fish at eight sites sampled by seine, 1988-2014 ............23 Figure 8.7: Total catch of juvenile black sea bass and scup, recreational important finfish at eight sites sampled by seine, 1988-2014 ..........................................23 Figure 8.8: Total catch of juvenile striped bass, summer flounder and weakfish,
recreational important finfish at eight sites sampled by seine, 1988-2014 ......24 Figure 8.9: Total catch of three species of juvenile flounder at eight sites sampled by
seine, 1988-2014 ..............................................................................................24 Figure 8.10: Seasonal change in winter flounder young of year abundance, 1988-1990
and 2013-2014 .................................................................................................25 Figure 8.11: Trend in species richness for cold and warm temperate species. ..................25 Figure 8.12: Beach seining with 25’ bag seine, 2014. .......................................................28
Job 8 Page 1
JOB 8: ESTUARINE SEINE SURVEY
OBJECTIVES 1) Provide an annual index of recruitment for winter flounder (Age0, 1+), all finfsh
species taken, and all crab species. The 2014 annual index of recruitment for young-of-year winter flounder (0.47 fish/haul) ranked the third lowest out of 27 annual indices. 2) Provide an annual total count for all finfish taken. Mean catch of all finfish (301 fish/haul) ranked the second highest out of 27 annual indices and extremely higher than the series average of 146 fish/haul (Figure 8.2). Geometric means were calculated for 22 species commonly captured since the survey began in 1988 (Table 8.1). 3) Provide an index for shallow subtidal forage species abundance. An index of forage abundance was generated using the catch of four of the most common forage species caught: Atlantic silversides, striped killifish, mummichog, and sheepshead minnow. The index for 2014 (104 forage fish/haul) was the eleventh highest of the 27-year series, and well above the time series average of 95 forage fish/haul. METHODS Eight sites (Figure 8.1) are sampled during September using an eight-meter (25 ft.) bag seine with 6.4mm (0.25 in.) bar mesh. Area swept is standardized to 4.6 m (15 ft.), width by means of a taut spreader rope and a 30m (98 ft.), measured distance, parallel to, or at a 45º angle to the shoreline, against the current or tide if present. At each site, six seine hauls are taken within two hours before and after low slack tide during daylight hours. Sites in Groton, Waterford, Old Lyme, Clinton, New Haven, Bridgeport and Greenwich have been sampled since 1988. The Milford site was added in 1990. In addition to September sampling, the original seven sites were sampled in June, July, and August 2013 to compare with samples taken in these months in 1988-1990. Sampling methods were the same as described above. Finfish, crabs, and other invertebrates taken in each sample are identified to species or lowest practical taxon (full listing given in Appendix 8.1, 8.2) and counted. One exception is inland silversides, which are not separated from Atlantic silversides because they are rare and difficult to identify. Qualitative counts were used for menhaden when abundant (n>1000) to minimize discard mortality. Winter flounder are measured to total length (mm), and classified as young-of-year (YOY) if less than 12 cm and age 1+ if 12cm or larger. The age of flounder near this size was verified in 1990-1992 by examination of the sagittal otolith. Physical data recorded at each seine location included water temperature and salinity at one-meter depth. The geometric or retransformed natural log mean catch per standard haul is calculated for catches at each site and collectively for the 22 most
Job 8 Page 2
abundant species, with separate indices for young-of-year and winter flounder age 1 and older. Confidence intervals (95%) for each geometric mean are retransformations of the corresponding log intervals. Frequency of occurrence is given as a percentage of all samples taken each year. Diversity in the catch, or species richness, was computed for finish species captured in the Survey over the time series. Species were divided into three groups based on their temperature preferences and seasonal spawning habits as documented in the literature. Criteria used to assign species into a cold temperate group, warm temperate group, or subtropical group are listed in Job 5. RESULTS A total of 48 seine hauls were taken in 2014 at eight sites, yielding a total catch of 14,425 fish of 29 species and 10,752 invertebrates of eleven species. Mean catch of all finfish (301 fish/tow) was the second highest in the 27 year time series (Figure 8.2). This catch is significantly above the long-term mean of 146 fish/tow which can be attributed to above average catches of black sea bass, tautog, scup (porgy), northern kingfish, striped searobin and large catches of bay anchovy along with yoy menhaden. Atlantic silversides were caught in slightly below average abundance. All other forage fish abundances were two or three times above the time series average. Geometric means were calculated for 22 species commonly captured since the survey began in 1988 (Table 8.1). The most frequently caught species was Atlantic silversides, which occurred in all samples, followed by striped killifish (88%), black sea bass (77%), northern pipefish (69%), tautog (63%), inshore lizardfish (60%), mummichog (54%), northern puffer (48%), scup (48%), striped searobin (46%), and northern kingfish (40%). This rank order has changed from the previous years, with a notable decrease in winter flounder (age 0 and age 1+), mummichog, grubby and windowpane flounder occurrence rates and an increases in black sea bass, northern pipefish, northern puffer inshore lizardfish and northern kingfish occurrence. Fifteen of the 22 species monitored increased in abundance in 2014, four other fish species decreased slightly and three were unchanged. Tautog abundance and occurrence rate increased significantly in 2014 to record highs (Figure 8.4). Tautog abundance and occurrence rate increased significantly in 1998-99, returned to the series average in 2005, 2010 and 2011 after a previous record year in 2007. Previous to 2005, tautog relative abundance significantly increased to all-time abundance levels in 2002-04 and 2012 (Figure 8.4). The abundance of cunner, the other labridae species commonly seen in the survey, fell in 2011 and 2013 but rebounded above the time series averages in 2012 and 2014 after declining in abundance since 2007. In 2014, only one of the forage species monitored decreased slightly in abundance from the previous year (Atlantic silverside). Three of the forage species monitored increased in abundance by a factor of 2 to 3 times their previous year abundance. Forage fish species Atlantic silverside was slightly below the 27 year time-series average in 2014. Scup occurrence and abundance increased well above the 27 year time series average in 2014,
Job 8 Page 3
increasing to its largest abundance in 27 years. Snapper bluefish also occurred in record abundance in 2014. Striped bass and weakfish were not observed in the survey in 2014. Weakfish young-of-year were present in 2014 and also occurred in 2003. Black sea bass and northern kingfish occurred in record abundance in 2014. Striped and northern sea robin, inshore lizardfish occurrence ranked second highest in the 27 year time series. In 2014, cunner reached its third highest abundance. All other species occurred in less than 10% of all samples, with occurrence rates similar to previous years. Bay scallop occurred for the first time in the time series. Four-spine stickleback re-occurred in 2014, absent from the survey in 2012-13. Two blue-spotted coronetfish were also captured. Three juvenile summer flounder were captured in 2014. Juvenile summer flounder have also occurred in 2006-08, 2010 and 2013 of the 27 year time series. Windowpane flounder re-occurred at low abundance in 2011 after being absent in 2009-10 and 2012-14. Other notable catches: black sea bass, bay scallop, scup, American eel, tautog, oyster toadfish, and menhaden along with inshore lizardfish at the Waterford site. The Clinton site saw large numbers of YOY black sea bass, scup, tautog, striped searobin, northern searobin and cunner. The Greenwich site saw age 1 winter founder, tautog, fourspine stickleback, scup, along with forage species Atlantic silverside and striped killifish. The New Haven site saw many black sea bass and bay anchovy along with weakfish. Black sea bass, scup, striped searobin, northern kingfish, menhaden, spot and large numbers of forage species were captured at the Old Lyme site. Bridgeport saw the lowest species diversity with Atlantic silverside and snapper bluefish being common. The Groton (Bluff Point) site saw largest numbers of YOY winter flounder, along with black sea bass, blue-spotted coronetfish, sheepshead minnow, naked goby, fourspine stickleback and northern searobin. Relative Abundance of Juvenile Winter Flounder and Tautog The 2014 index of YOY winter flounder (0.47 fish/haul) ranked third lowest out of the 27 annual indices (Table 8.2, Figure 8.3 and 8.7). Overall, the time series indicates that relatively strong year classes were only produced many years ago in 1988, 1992, 1994, and 1996 (Figure 8.3). The 2014 index of YOY tautog (3.5 fish/haul) was the highest ranking out of 27 annual indices (Table 8.1, Figure 8.4), significantly higher than the series average of 0.8 tautog / haul. Overall, the time series indicates an increasing trend in abundance of young-of-year tautog from 1988 to 2008, with relatively abundant year classes produced in 1998-99, 2002-04, 2007-08, 2012 and 2014. The 2006, 2009-11 and 2013 mean was below the long-term average. (P≤0.05, t=2.3, df=26), (Table 8.1, Figure 8.4). Presence of Other Important Recreational Finfish YOY scup is a recent addition to the seine survey. The species occurred in 1999, with the highest relative abundance in the last ten years of the time series. In 2014, the species was present in record numbers, reflecting excellent recruitment and survival for the species in
Job 8 Page 4
2014 (Table 8.3, Figure 8.7). Juvenile striped bass first occurred in the survey in 1999 with one individual captured. In 2003, six more YOY striped bass were taken (Table 8.3, Figure 8.8). One large individual (369mm) was captured in 2008. Four juvenile weakfish occurred in 2014, the first time since 2003 and only the second time in the entire time series. YOY summer flounder have occurred in eleven years (more recently) in the 27-year time series (1993, 1994, 1996, and 1998, 2006 – 2010, 2012-14). The 2006 summer flounder abundances were the highest of the time series, followed by 2007, 2008, 2010, 2012 and 2014. No summer flounder were captured in 2011. YOY black sea bass first appeared in 1991 and every year since 1997, reaching their record highest abundance in 2014 (Figure 8.7). Snapper bluefish occurred in 21 out of 27 years of the time series, reaching peak abundance in 1999 and 2014. Juvenile tautog occurred every year in the seine survey except 1989 and reached record abundance in 2014. White perch appeared in record numbers in 2008 and only once prior, (2005) were present in 2011, and absent in 2012-14. Atlantic tomcod, a threatened species re-appeared in 2008 and 2011, none were present in 2009, 2010 and 2012-14. Inshore lizardfish were captured at above average abundances for the time series in 2014 (second highest). Fourspine stickleback were absent in 2012-13, and appear to be dropping out of the survey, occurring only five times in the past decade. However, they re-occurred in 2014 at three of the eight sites. Relative Abundance of Forage Species
Seine survey catches are numerically dominated by forage species, defined here as short-lived, highly fecund species that spend the majority of their life cycle inshore where they are common food items for piscivorous fish. An index of forage fish abundance was generated using the catch of four of the most common forage species caught: Atlantic silversides, striped killifish, mummichog, and sheepshead minnow (Figure 8.5, Figure 8.6). The index for 2014 was the eleventh highest in the 27 year time series. Three of the four forage fish species increased in abundance and occurrence in 2014. Atlantic silverside abundance increased in 2014 (65 fish/haul) and was exactly at the series mean of 65 fish/haul for the time series (Table 8.1). Atlantic silversides were the most abundant, and the only species present at all sites in all samples (Table 8.1). There was a substantial increase in striped killifish, and mummichog abundance in 2014. A decrease in these species' abundance in 2012-13 reversed a five-year trend of increasing abundance from 2007-2011 and 2014. Striped killifish increased substantially in abundance in 2014, to the seventh highest in the time series. This species of killifish abundance and occurrence (14.5 fish/tow, 88% occurrence) was well above the series mean of 11 fish/tow. In 2014, mummichog abundance (5 fish/haul) was also well above the long-term average of 2.75 in 2014. Sheepshead minnow had record abundance (3.35) in 2007 and decreased in 2008 through 2010 and 2013. Sheepshead increased slightly in 2011 and again in 2012, the index of abundance of this forage fish in 2014 (0.6 fish/haul) was substantially higher, ranking fifth in the time series. Collectively, forage fish abundance has declined since 2003 (Figure 8.5) but the trend was reversed in 2014, with forage fish abundance ranking eleventh highest in the time series. Forage fish abundance had shown a general increase since 1997 (Figure 8.5) after a period of lower abundance (decreasing trend) from 1991-1996. In 2013, forage fish abundance was again below the series mean of 98 fish/haul, with a mean catch of 46 fish per haul
Job 8 Page 5
(large decline from 2007). Forage fish abundance is driven numerically by the occurrence of adult Atlantic silverside (Figure 8.6) and more recently striped killifish, mummichog and sheepshead minnow, the second, third and fourth most abundant forage species. Striped killifish are more suited to marine habitats, than other ‘Fundulus’ species captured in the estuarine seine survey. Striped killifish were captured at extremely low numbers in 2012-13, suggesting very poor year class production and survival 2–3 years ago, since the survey captures adults more effectively. Mummichog, the third most abundant forage fish (Table 8.3) in the survey, peaked in abundance in 2007. The lowest time series abundance occurred in 1997. Mummichog appeared to be stable with an above average catches since 1999 but are more recently declining in abundance until 2014 (trend reversed). Sheepshead minnow the least abundant of the four forage fish species monitored has recently shown elevated abundances in 2002-04 and 2007-09, with a record year in 2007 (3.35 fish/tow) and above average catches in 2008 (1.2 fish/tow) followed by slight decreases in 2009 and 2010. In 2011, 2012 and 2014, the sheepshead minnow catch rebounded and was slightly above the series average. The 2014 mean catch was 0.6 fish per tow, above the series mean of 0.5 fish/tow. Relative Abundance of Invertebrate Species A total of 10,752 invertebrates of eleven species were captured in 2014 (Table 8.3), (Appendix 8.2). Six crab species were present in the seine hauls, along with two shrimp species, one gastropod and bivalve. Mud snail, sand shrimp, shore shrimp, green crab, and hermit crab were the most abundant. Mud snails, shore shrimp, sand shrimp, hermit and green crab had greater than 50% occurrence in 2014 (Table 8.3). Blue crab abundance continued to remain low in 2014 (12 crabs) from an all-time high in 2009 (333 crabs). The Asian shore crab (Japanese crab) re-appeared in 2011 and 2012 but were absent from 2008-10, 2013 and 2014. The shore shrimp increased substantially in abundance in 2014 from the previous year (Table 8.3). Sand shrimp decrease significantly in abundance in 2014. Mud snail abundance was again above the time series average (2013-14). Mud crabs reached an all-time high abundance in 2013 after dropping in 2011, 2012 and 2014 from a previous higher abundance in 2010. Spider crab abundance was at a time-series high in 2011 and increased slightly above the time series average in 2013 and 2014. Comparison of 2013-2014 Summer Samples with 1988-1990 A total of 39 seine hauls were taken in June, July, and August 2014 (six hauls at seven sites except three at Greenwich in June due to heavy surf). Combined with data taken in the same manner in June-September 2013 (N=42), mean catch of all finfish at the seven sites varied from 12.9-66.8 fish/sample in June and July, respectively, to 95.5-134.2, respectively, in August and September.
Job 8 Page 6
This seasonal pattern was similar to the pattern seen in 1988-1990 (June=35.0, July=44.6, August=114.0, September=100.7 fish/sample) with lowest abundance in June and peak abundance in August and September. This seasonal progression probably reflects resident and migrant species moving into the nursery grounds and/or recruiting to the mesh size of the sampling gear. Standard errors for these monthly mean values (CV range of 24-42%) make them statistically indistinguishable with the exception of the low value in June 2013-2014. In contrast to the seasonal increase in abundance seen in total finfish from June through September, winter flounder YOY abundance was highest in June and declined over the summer. Although a seasonal decline in abundance was also noted in June-September of 1988 -1990 (slope = -0.13, r2=0.53), the slope of the decline in 2013-4 was almost three times as steep (slope= -0. 37, r2=0.91). This increased decline in abundance reduced moderate production seen in June 2013 and 2014, which was not statistically different from values recorded in June 1988-1990, to the extremely low abundance recorded in September 2013-2014 (Figure 8.7). Mean water temperature for these beach sites was not significantly different by month, with lowest values in June (mean1988-90 = 21.20C, SE=0.23; mean 2013-14 = 20.70C, SE=0.45) and highest values in July (mean 1988-90 = 24.90C, SE=0.20; mean 2013-14 = 24.00C, SE=0.52). Finfish Species Richness Over the time series, the mean number of cold temperate species captured per seine haul (Figure 8.8, Table 8.4) varied from 1.6 to 2.8 with a slight negative trend (r2=0.11, p=0.049) while the mean number of warm temperate species increased significantly (r2=0.58, p<0.001). The mean number of warm temperate species increased from about three species per sample to more than five over the 27-year time series. These changes primarily reflect a decreasingly frequent catch of winter flounder and windowpane flounder (cold-temperate species), and an increasingly frequent catch of black sea bass, northern kingfish, and smallmouth flounder (warm temperate species). Subtropical species richness showed no trend, averaging about one species per haul almost every year. MODIFICATIONS In 2015 the seven original seine sites (all sites except Milford) will be sampled in June, July, and August as well as September. These catch data will be compared to catches made in the same summer months in 1988-1990.
Job 8 Page 7
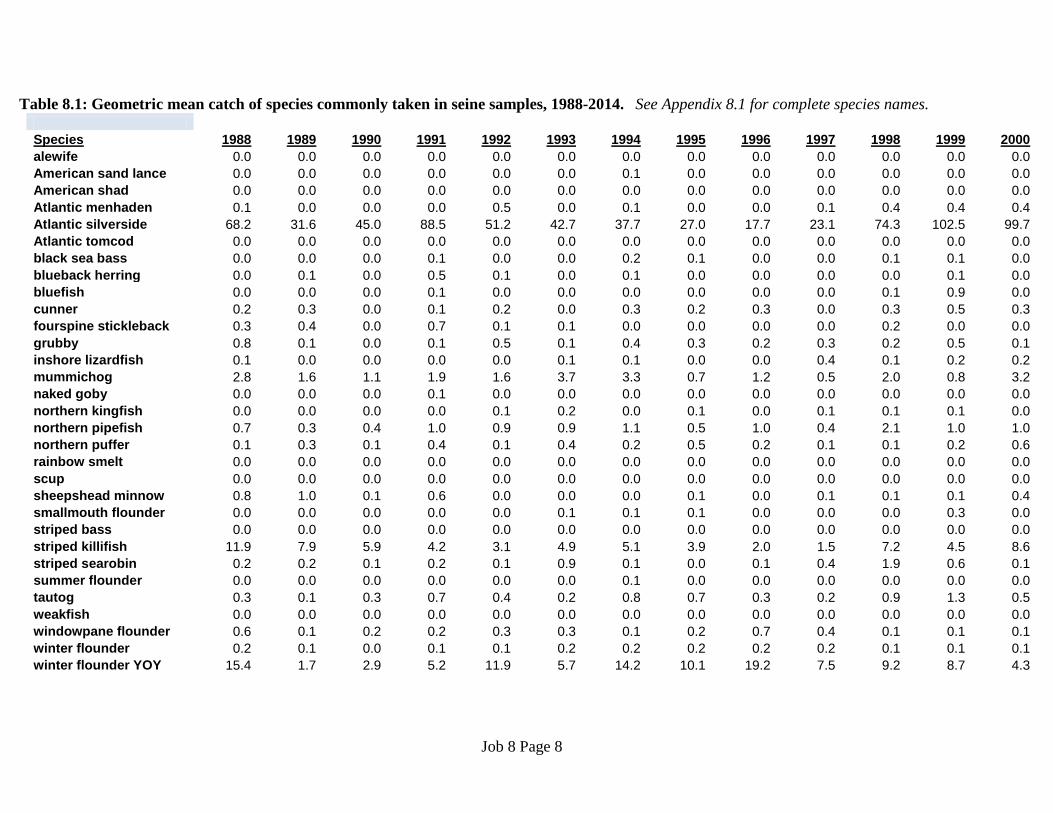
Table 8.1: Geometric mean catch of species commonly taken in seine samples, 1988-2014. See Appendix 8.1 for complete species names. Species 1988 1989 1990 1991 1992 1993 1994 1995 1996 1997 1998 1999 2000 alewife 0.0 0.0 0.0 0.0 0.0 0.0 0.0 0.0 0.0 0.0 0.0 0.0 0.0 American sand lance 0.0 0.0 0.0 0.0 0.0 0.0 0.1 0.0 0.0 0.0 0.0 0.0 0.0 American shad 0.0 0.0 0.0 0.0 0.0 0.0 0.0 0.0 0.0 0.0 0.0 0.0 0.0 Atlantic menhaden 0.1 0.0 0.0 0.0 0.5 0.0 0.1 0.0 0.0 0.1 0.4 0.4 0.4 Atlantic silverside 68.2 31.6 45.0 88.5 51.2 42.7 37.7 27.0 17.7 23.1 74.3 102.5 99.7 Atlantic tomcod 0.0 0.0 0.0 0.0 0.0 0.0 0.0 0.0 0.0 0.0 0.0 0.0 0.0 black sea bass 0.0 0.0 0.0 0.1 0.0 0.0 0.2 0.1 0.0 0.0 0.1 0.1 0.0 blueback herring 0.0 0.1 0.0 0.5 0.1 0.0 0.1 0.0 0.0 0.0 0.0 0.1 0.0 bluefish 0.0 0.0 0.0 0.1 0.0 0.0 0.0 0.0 0.0 0.0 0.1 0.9 0.0 cunner 0.2 0.3 0.0 0.1 0.2 0.0 0.3 0.2 0.3 0.0 0.3 0.5 0.3 fourspine stickleback 0.3 0.4 0.0 0.7 0.1 0.1 0.0 0.0 0.0 0.0 0.2 0.0 0.0 grubby 0.8 0.1 0.0 0.1 0.5 0.1 0.4 0.3 0.2 0.3 0.2 0.5 0.1 inshore lizardfish 0.1 0.0 0.0 0.0 0.0 0.1 0.1 0.0 0.0 0.4 0.1 0.2 0.2 mummichog 2.8 1.6 1.1 1.9 1.6 3.7 3.3 0.7 1.2 0.5 2.0 0.8 3.2 naked goby 0.0 0.0 0.0 0.1 0.0 0.0 0.0 0.0 0.0 0.0 0.0 0.0 0.0 northern kingfish 0.0 0.0 0.0 0.0 0.1 0.2 0.0 0.1 0.0 0.1 0.1 0.1 0.0 northern pipefish 0.7 0.3 0.4 1.0 0.9 0.9 1.1 0.5 1.0 0.4 2.1 1.0 1.0 northern puffer 0.1 0.3 0.1 0.4 0.1 0.4 0.2 0.5 0.2 0.1 0.1 0.2 0.6 rainbow smelt 0.0 0.0 0.0 0.0 0.0 0.0 0.0 0.0 0.0 0.0 0.0 0.0 0.0 scup 0.0 0.0 0.0 0.0 0.0 0.0 0.0 0.0 0.0 0.0 0.0 0.0 0.0 sheepshead minnow 0.8 1.0 0.1 0.6 0.0 0.0 0.0 0.1 0.0 0.1 0.1 0.1 0.4 smallmouth flounder 0.0 0.0 0.0 0.0 0.0 0.1 0.1 0.1 0.0 0.0 0.0 0.3 0.0 striped bass 0.0 0.0 0.0 0.0 0.0 0.0 0.0 0.0 0.0 0.0 0.0 0.0 0.0 striped killifish 11.9 7.9 5.9 4.2 3.1 4.9 5.1 3.9 2.0 1.5 7.2 4.5 8.6 striped searobin 0.2 0.2 0.1 0.2 0.1 0.9 0.1 0.0 0.1 0.4 1.9 0.6 0.1 summer flounder 0.0 0.0 0.0 0.0 0.0 0.0 0.1 0.0 0.0 0.0 0.0 0.0 0.0 tautog 0.3 0.1 0.3 0.7 0.4 0.2 0.8 0.7 0.3 0.2 0.9 1.3 0.5 weakfish 0.0 0.0 0.0 0.0 0.0 0.0 0.0 0.0 0.0 0.0 0.0 0.0 0.0 windowpane flounder 0.6 0.1 0.2 0.2 0.3 0.3 0.1 0.2 0.7 0.4 0.1 0.1 0.1 winter flounder 0.2 0.1 0.0 0.1 0.1 0.2 0.2 0.2 0.2 0.2 0.1 0.1 0.1 winter flounder YOY 15.4 1.7 2.9 5.2 11.9 5.7 14.2 10.1 19.2 7.5 9.2 8.7 4.3
Job 8 Page 8
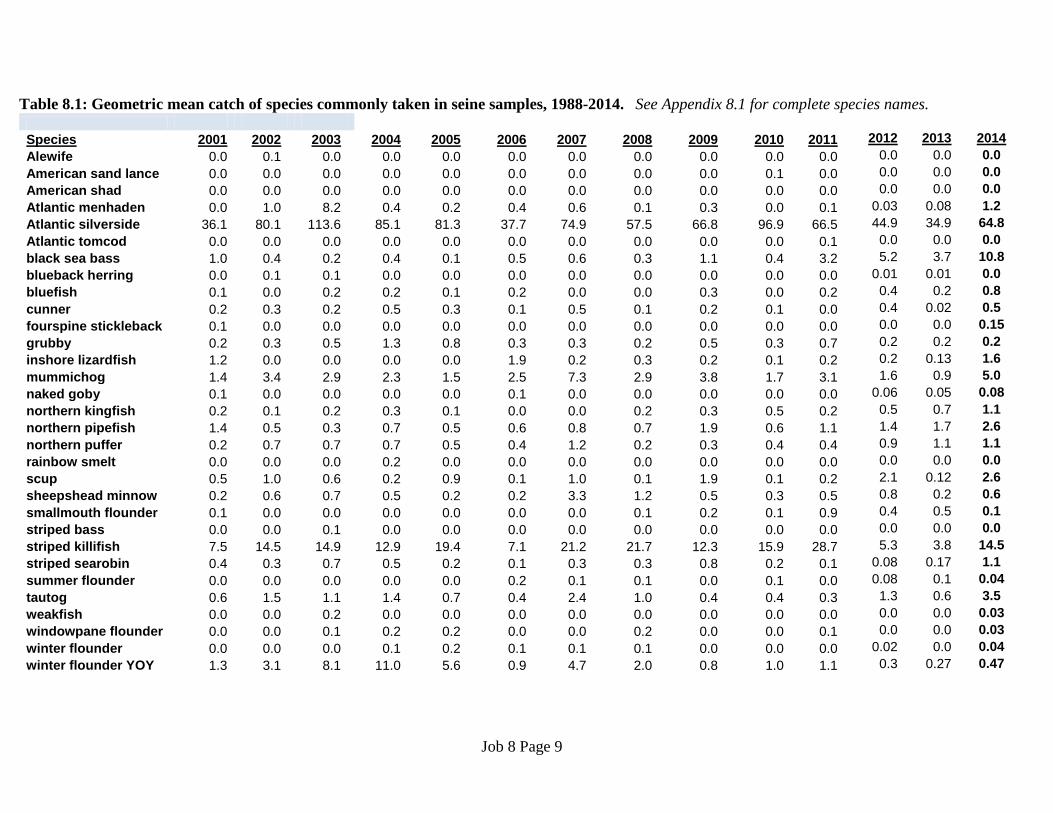
Table 8.1: Geometric mean catch of species commonly taken in seine samples, 1988-2014. See Appendix 8.1 for complete species names.
Species 2001 2002 2003 2004 2005 2006 2007 2008 2009 2010 2011 2012 2013 2014 Alewife 0.0 0.1 0.0 0.0 0.0 0.0 0.0 0.0 0.0 0.0 0.0 0.0 0.0 0.0 American sand lance 0.0 0.0 0.0 0.0 0.0 0.0 0.0 0.0 0.0 0.1 0.0 0.0 0.0 0.0 American shad 0.0 0.0 0.0 0.0 0.0 0.0 0.0 0.0 0.0 0.0 0.0 0.0 0.0 0.0 Atlantic menhaden 0.0 1.0 8.2 0.4 0.2 0.4 0.6 0.1 0.3 0.0 0.1 0.03 0.08 1.2 Atlantic silverside 36.1 80.1 113.6 85.1 81.3 37.7 74.9 57.5 66.8 96.9 66.5 44.9 34.9 64.8 Atlantic tomcod 0.0 0.0 0.0 0.0 0.0 0.0 0.0 0.0 0.0 0.0 0.1 0.0 0.0 0.0 black sea bass 1.0 0.4 0.2 0.4 0.1 0.5 0.6 0.3 1.1 0.4 3.2 5.2 3.7 10.8 blueback herring 0.0 0.1 0.1 0.0 0.0 0.0 0.0 0.0 0.0 0.0 0.0 0.01 0.01 0.0 bluefish 0.1 0.0 0.2 0.2 0.1 0.2 0.0 0.0 0.3 0.0 0.2 0.4 0.2 0.8 cunner 0.2 0.3 0.2 0.5 0.3 0.1 0.5 0.1 0.2 0.1 0.0 0.4 0.02 0.5 fourspine stickleback 0.1 0.0 0.0 0.0 0.0 0.0 0.0 0.0 0.0 0.0 0.0 0.0 0.0 0.15 grubby 0.2 0.3 0.5 1.3 0.8 0.3 0.3 0.2 0.5 0.3 0.7 0.2 0.2 0.2 inshore lizardfish 1.2 0.0 0.0 0.0 0.0 1.9 0.2 0.3 0.2 0.1 0.2 0.2 0.13 1.6 mummichog 1.4 3.4 2.9 2.3 1.5 2.5 7.3 2.9 3.8 1.7 3.1 1.6 0.9 5.0 naked goby 0.1 0.0 0.0 0.0 0.0 0.1 0.0 0.0 0.0 0.0 0.0 0.06 0.05 0.08 northern kingfish 0.2 0.1 0.2 0.3 0.1 0.0 0.0 0.2 0.3 0.5 0.2 0.5 0.7 1.1 northern pipefish 1.4 0.5 0.3 0.7 0.5 0.6 0.8 0.7 1.9 0.6 1.1 1.4 1.7 2.6 northern puffer 0.2 0.7 0.7 0.7 0.5 0.4 1.2 0.2 0.3 0.4 0.4 0.9 1.1 1.1 rainbow smelt 0.0 0.0 0.0 0.2 0.0 0.0 0.0 0.0 0.0 0.0 0.0 0.0 0.0 0.0 scup 0.5 1.0 0.6 0.2 0.9 0.1 1.0 0.1 1.9 0.1 0.2 2.1 0.12 2.6 sheepshead minnow 0.2 0.6 0.7 0.5 0.2 0.2 3.3 1.2 0.5 0.3 0.5 0.8 0.2 0.6 smallmouth flounder 0.1 0.0 0.0 0.0 0.0 0.0 0.0 0.1 0.2 0.1 0.9 0.4 0.5 0.1 striped bass 0.0 0.0 0.1 0.0 0.0 0.0 0.0 0.0 0.0 0.0 0.0 0.0 0.0 0.0 striped killifish 7.5 14.5 14.9 12.9 19.4 7.1 21.2 21.7 12.3 15.9 28.7 5.3 3.8 14.5 striped searobin 0.4 0.3 0.7 0.5 0.2 0.1 0.3 0.3 0.8 0.2 0.1 0.08 0.17 1.1 summer flounder 0.0 0.0 0.0 0.0 0.0 0.2 0.1 0.1 0.0 0.1 0.0 0.08 0.1 0.04 tautog 0.6 1.5 1.1 1.4 0.7 0.4 2.4 1.0 0.4 0.4 0.3 1.3 0.6 3.5 weakfish 0.0 0.0 0.2 0.0 0.0 0.0 0.0 0.0 0.0 0.0 0.0 0.0 0.0 0.03 windowpane flounder 0.0 0.0 0.1 0.2 0.2 0.0 0.0 0.2 0.0 0.0 0.1 0.0 0.0 0.03 winter flounder 0.0 0.0 0.0 0.1 0.2 0.1 0.1 0.1 0.0 0.0 0.0 0.02 0.0 0.04 winter flounder YOY 1.3 3.1 8.1 11.0 5.6 0.9 4.7 2.0 0.8 1.0 1.1 0.3 0.27 0.47
Job 8 Page 9
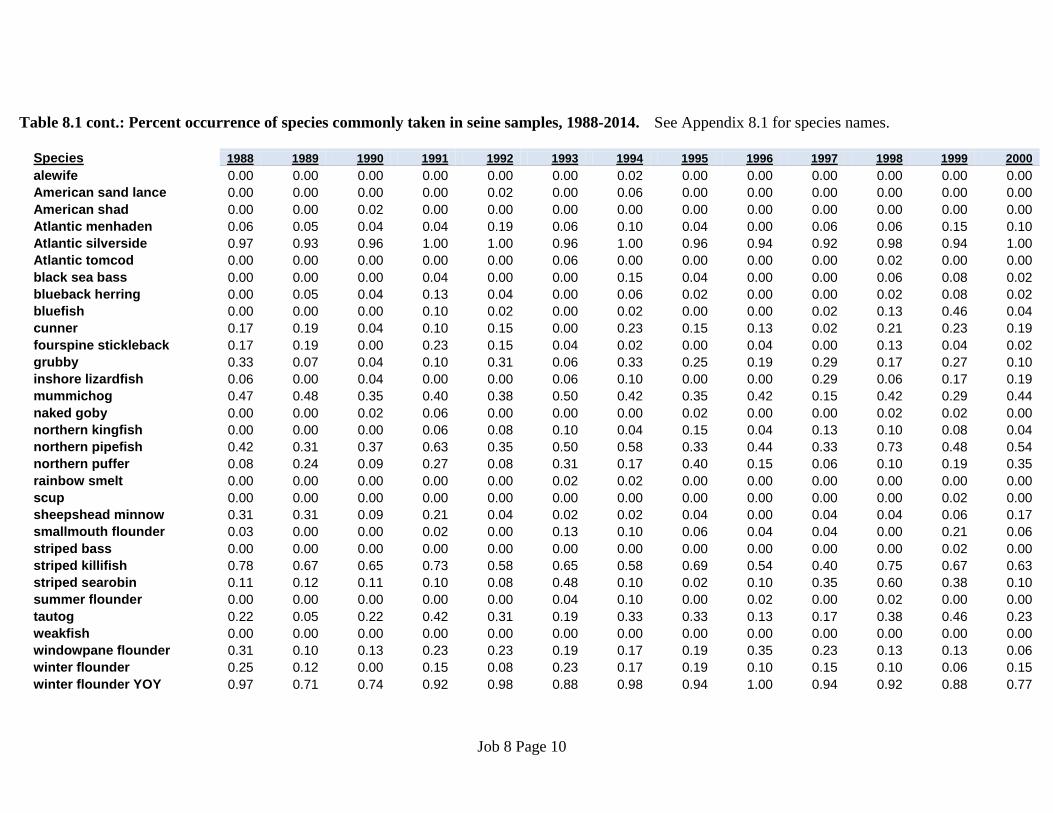
Table 8.1 cont.: Percent occurrence of species commonly taken in seine samples, 1988-2014. See Appendix 8.1 for species names.
Species 1988 1989 1990 1991 1992 1993 1994 1995 1996 1997 1998 1999 2000 alewife 0.00 0.00 0.00 0.00 0.00 0.00 0.02 0.00 0.00 0.00 0.00 0.00 0.00 American sand lance 0.00 0.00 0.00 0.00 0.02 0.00 0.06 0.00 0.00 0.00 0.00 0.00 0.00 American shad 0.00 0.00 0.02 0.00 0.00 0.00 0.00 0.00 0.00 0.00 0.00 0.00 0.00 Atlantic menhaden 0.06 0.05 0.04 0.04 0.19 0.06 0.10 0.04 0.00 0.06 0.06 0.15 0.10 Atlantic silverside 0.97 0.93 0.96 1.00 1.00 0.96 1.00 0.96 0.94 0.92 0.98 0.94 1.00 Atlantic tomcod 0.00 0.00 0.00 0.00 0.00 0.06 0.00 0.00 0.00 0.00 0.02 0.00 0.00 black sea bass 0.00 0.00 0.00 0.04 0.00 0.00 0.15 0.04 0.00 0.00 0.06 0.08 0.02 blueback herring 0.00 0.05 0.04 0.13 0.04 0.00 0.06 0.02 0.00 0.00 0.02 0.08 0.02 bluefish 0.00 0.00 0.00 0.10 0.02 0.00 0.02 0.00 0.00 0.02 0.13 0.46 0.04 cunner 0.17 0.19 0.04 0.10 0.15 0.00 0.23 0.15 0.13 0.02 0.21 0.23 0.19 fourspine stickleback 0.17 0.19 0.00 0.23 0.15 0.04 0.02 0.00 0.04 0.00 0.13 0.04 0.02 grubby 0.33 0.07 0.04 0.10 0.31 0.06 0.33 0.25 0.19 0.29 0.17 0.27 0.10 inshore lizardfish 0.06 0.00 0.04 0.00 0.00 0.06 0.10 0.00 0.00 0.29 0.06 0.17 0.19 mummichog 0.47 0.48 0.35 0.40 0.38 0.50 0.42 0.35 0.42 0.15 0.42 0.29 0.44 naked goby 0.00 0.00 0.02 0.06 0.00 0.00 0.00 0.02 0.00 0.00 0.02 0.02 0.00 northern kingfish 0.00 0.00 0.00 0.06 0.08 0.10 0.04 0.15 0.04 0.13 0.10 0.08 0.04 northern pipefish 0.42 0.31 0.37 0.63 0.35 0.50 0.58 0.33 0.44 0.33 0.73 0.48 0.54 northern puffer 0.08 0.24 0.09 0.27 0.08 0.31 0.17 0.40 0.15 0.06 0.10 0.19 0.35 rainbow smelt 0.00 0.00 0.00 0.00 0.00 0.02 0.02 0.00 0.00 0.00 0.00 0.00 0.00 scup 0.00 0.00 0.00 0.00 0.00 0.00 0.00 0.00 0.00 0.00 0.00 0.02 0.00 sheepshead minnow 0.31 0.31 0.09 0.21 0.04 0.02 0.02 0.04 0.00 0.04 0.04 0.06 0.17 smallmouth flounder 0.03 0.00 0.00 0.02 0.00 0.13 0.10 0.06 0.04 0.04 0.00 0.21 0.06 striped bass 0.00 0.00 0.00 0.00 0.00 0.00 0.00 0.00 0.00 0.00 0.00 0.02 0.00 striped killifish 0.78 0.67 0.65 0.73 0.58 0.65 0.58 0.69 0.54 0.40 0.75 0.67 0.63 striped searobin 0.11 0.12 0.11 0.10 0.08 0.48 0.10 0.02 0.10 0.35 0.60 0.38 0.10 summer flounder 0.00 0.00 0.00 0.00 0.00 0.04 0.10 0.00 0.02 0.00 0.02 0.00 0.00 tautog 0.22 0.05 0.22 0.42 0.31 0.19 0.33 0.33 0.13 0.17 0.38 0.46 0.23 weakfish 0.00 0.00 0.00 0.00 0.00 0.00 0.00 0.00 0.00 0.00 0.00 0.00 0.00 windowpane flounder 0.31 0.10 0.13 0.23 0.23 0.19 0.17 0.19 0.35 0.23 0.13 0.13 0.06 winter flounder 0.25 0.12 0.00 0.15 0.08 0.23 0.17 0.19 0.10 0.15 0.10 0.06 0.15 winter flounder YOY 0.97 0.71 0.74 0.92 0.98 0.88 0.98 0.94 1.00 0.94 0.92 0.88 0.77
Job 8 Page 10
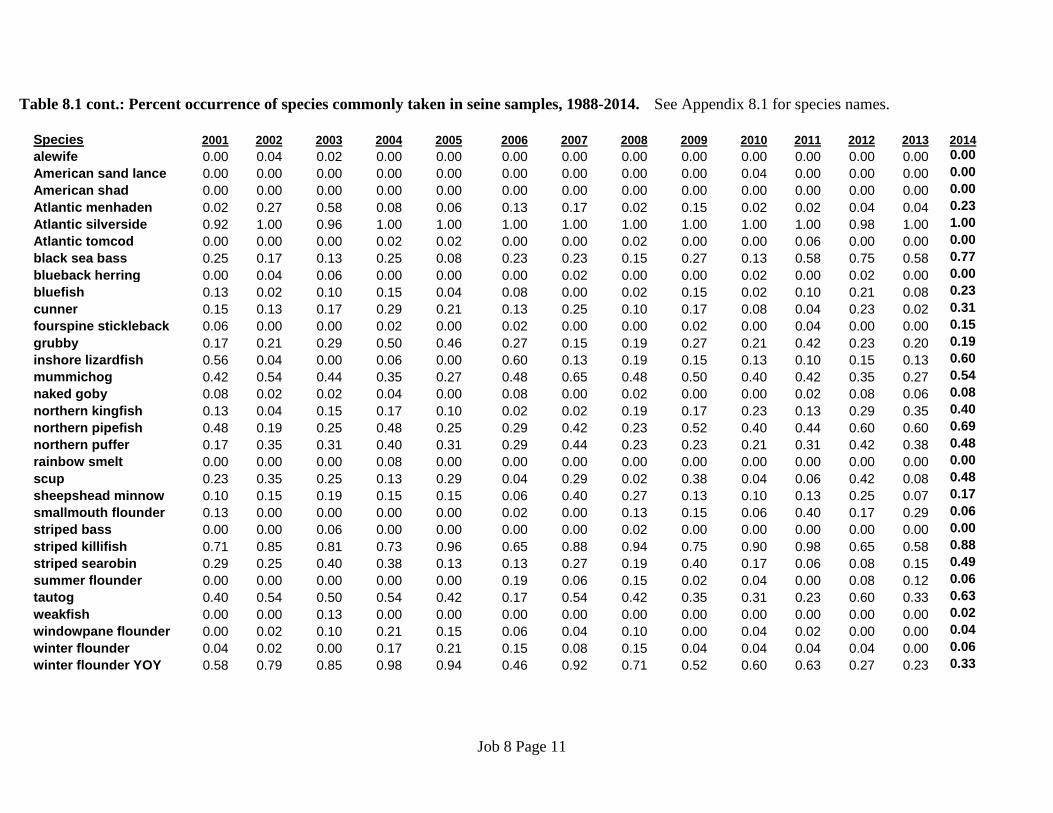
Table 8.1 cont.: Percent occurrence of species commonly taken in seine samples, 1988-2014. See Appendix 8.1 for species names. Species 2001 2002 2003 2004 2005 2006 2007 2008 2009 2010 2011 2012 2013 2014 alewife 0.00 0.04 0.02 0.00 0.00 0.00 0.00 0.00 0.00 0.00 0.00 0.00 0.00 0.00 American sand lance 0.00 0.00 0.00 0.00 0.00 0.00 0.00 0.00 0.00 0.04 0.00 0.00 0.00 0.00 American shad 0.00 0.00 0.00 0.00 0.00 0.00 0.00 0.00 0.00 0.00 0.00 0.00 0.00 0.00 Atlantic menhaden 0.02 0.27 0.58 0.08 0.06 0.13 0.17 0.02 0.15 0.02 0.02 0.04 0.04 0.23 Atlantic silverside 0.92 1.00 0.96 1.00 1.00 1.00 1.00 1.00 1.00 1.00 1.00 0.98 1.00 1.00 Atlantic tomcod 0.00 0.00 0.00 0.02 0.02 0.00 0.00 0.02 0.00 0.00 0.06 0.00 0.00 0.00 black sea bass 0.25 0.17 0.13 0.25 0.08 0.23 0.23 0.15 0.27 0.13 0.58 0.75 0.58 0.77 blueback herring 0.00 0.04 0.06 0.00 0.00 0.00 0.02 0.00 0.00 0.02 0.00 0.02 0.00 0.00 bluefish 0.13 0.02 0.10 0.15 0.04 0.08 0.00 0.02 0.15 0.02 0.10 0.21 0.08 0.23 cunner 0.15 0.13 0.17 0.29 0.21 0.13 0.25 0.10 0.17 0.08 0.04 0.23 0.02 0.31 fourspine stickleback 0.06 0.00 0.00 0.02 0.00 0.02 0.00 0.00 0.02 0.00 0.04 0.00 0.00 0.15 grubby 0.17 0.21 0.29 0.50 0.46 0.27 0.15 0.19 0.27 0.21 0.42 0.23 0.20 0.19 inshore lizardfish 0.56 0.04 0.00 0.06 0.00 0.60 0.13 0.19 0.15 0.13 0.10 0.15 0.13 0.60 mummichog 0.42 0.54 0.44 0.35 0.27 0.48 0.65 0.48 0.50 0.40 0.42 0.35 0.27 0.54 naked goby 0.08 0.02 0.02 0.04 0.00 0.08 0.00 0.02 0.00 0.00 0.02 0.08 0.06 0.08 northern kingfish 0.13 0.04 0.15 0.17 0.10 0.02 0.02 0.19 0.17 0.23 0.13 0.29 0.35 0.40 northern pipefish 0.48 0.19 0.25 0.48 0.25 0.29 0.42 0.23 0.52 0.40 0.44 0.60 0.60 0.69 northern puffer 0.17 0.35 0.31 0.40 0.31 0.29 0.44 0.23 0.23 0.21 0.31 0.42 0.38 0.48 rainbow smelt 0.00 0.00 0.00 0.08 0.00 0.00 0.00 0.00 0.00 0.00 0.00 0.00 0.00 0.00 scup 0.23 0.35 0.25 0.13 0.29 0.04 0.29 0.02 0.38 0.04 0.06 0.42 0.08 0.48 sheepshead minnow 0.10 0.15 0.19 0.15 0.15 0.06 0.40 0.27 0.13 0.10 0.13 0.25 0.07 0.17 smallmouth flounder 0.13 0.00 0.00 0.00 0.00 0.02 0.00 0.13 0.15 0.06 0.40 0.17 0.29 0.06 striped bass 0.00 0.00 0.06 0.00 0.00 0.00 0.00 0.02 0.00 0.00 0.00 0.00 0.00 0.00 striped killifish 0.71 0.85 0.81 0.73 0.96 0.65 0.88 0.94 0.75 0.90 0.98 0.65 0.58 0.88 striped searobin 0.29 0.25 0.40 0.38 0.13 0.13 0.27 0.19 0.40 0.17 0.06 0.08 0.15 0.49 summer flounder 0.00 0.00 0.00 0.00 0.00 0.19 0.06 0.15 0.02 0.04 0.00 0.08 0.12 0.06 tautog 0.40 0.54 0.50 0.54 0.42 0.17 0.54 0.42 0.35 0.31 0.23 0.60 0.33 0.63 weakfish 0.00 0.00 0.13 0.00 0.00 0.00 0.00 0.00 0.00 0.00 0.00 0.00 0.00 0.02 windowpane flounder 0.00 0.02 0.10 0.21 0.15 0.06 0.04 0.10 0.00 0.04 0.02 0.00 0.00 0.04 winter flounder 0.04 0.02 0.00 0.17 0.21 0.15 0.08 0.15 0.04 0.04 0.04 0.04 0.00 0.06 winter flounder YOY 0.58 0.79 0.85 0.98 0.94 0.46 0.92 0.71 0.52 0.60 0.63 0.27 0.23 0.33
Job 8 Page 11
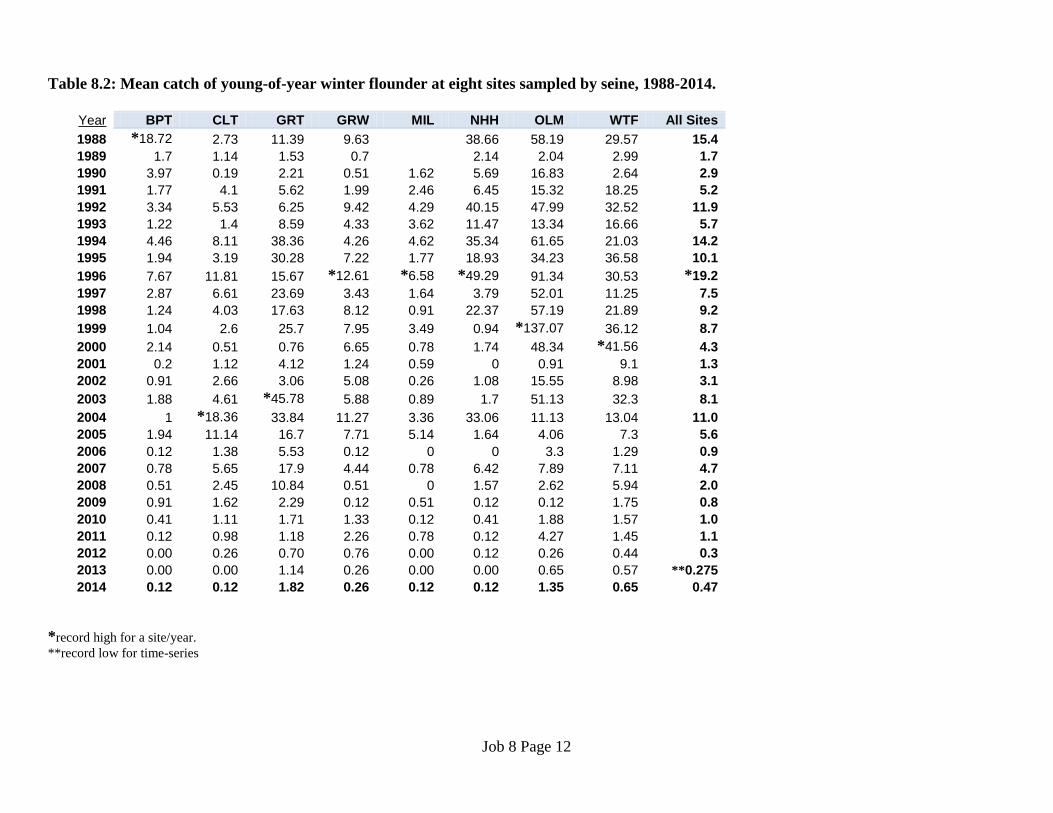
Table 8.2: Mean catch of young-of-year winter flounder at eight sites sampled by seine, 1988-2014.
Year BPT CLT GRT GRW MIL NHH OLM WTF All Sites 1988 *18.72 2.73 11.39 9.63 38.66 58.19 29.57 15.4 1989 1.7 1.14 1.53 0.7 2.14 2.04 2.99 1.7 1990 3.97 0.19 2.21 0.51 1.62 5.69 16.83 2.64 2.9 1991 1.77 4.1 5.62 1.99 2.46 6.45 15.32 18.25 5.2 1992 3.34 5.53 6.25 9.42 4.29 40.15 47.99 32.52 11.9 1993 1.22 1.4 8.59 4.33 3.62 11.47 13.34 16.66 5.7 1994 4.46 8.11 38.36 4.26 4.62 35.34 61.65 21.03 14.2 1995 1.94 3.19 30.28 7.22 1.77 18.93 34.23 36.58 10.1 1996 7.67 11.81 15.67 *12.61 *6.58 *49.29 91.34 30.53 *19.2 1997 2.87 6.61 23.69 3.43 1.64 3.79 52.01 11.25 7.5 1998 1.24 4.03 17.63 8.12 0.91 22.37 57.19 21.89 9.2 1999 1.04 2.6 25.7 7.95 3.49 0.94 *137.07 36.12 8.7 2000 2.14 0.51 0.76 6.65 0.78 1.74 48.34 *41.56 4.3 2001 0.2 1.12 4.12 1.24 0.59 0 0.91 9.1 1.3 2002 0.91 2.66 3.06 5.08 0.26 1.08 15.55 8.98 3.1 2003 1.88 4.61 *45.78 5.88 0.89 1.7 51.13 32.3 8.1 2004 1 *18.36 33.84 11.27 3.36 33.06 11.13 13.04 11.0 2005 1.94 11.14 16.7 7.71 5.14 1.64 4.06 7.3 5.6 2006 0.12 1.38 5.53 0.12 0 0 3.3 1.29 0.9 2007 0.78 5.65 17.9 4.44 0.78 6.42 7.89 7.11 4.7 2008 0.51 2.45 10.84 0.51 0 1.57 2.62 5.94 2.0 2009 0.91 1.62 2.29 0.12 0.51 0.12 0.12 1.75 0.8 2010 0.41 1.11 1.71 1.33 0.12 0.41 1.88 1.57 1.0 2011 0.12 0.98 1.18 2.26 0.78 0.12 4.27 1.45 1.1 2012 0.00 0.26 0.70 0.76 0.00 0.12 0.26 0.44 0.3 2013 0.00 0.00 1.14 0.26 0.00 0.00 0.65 0.57 **0.275 2014 0.12 0.12 1.82 0.26 0.12 0.12 1.35 0.65 0.47
*record high for a site/year. **record low for time-series
Job 8 Page 12
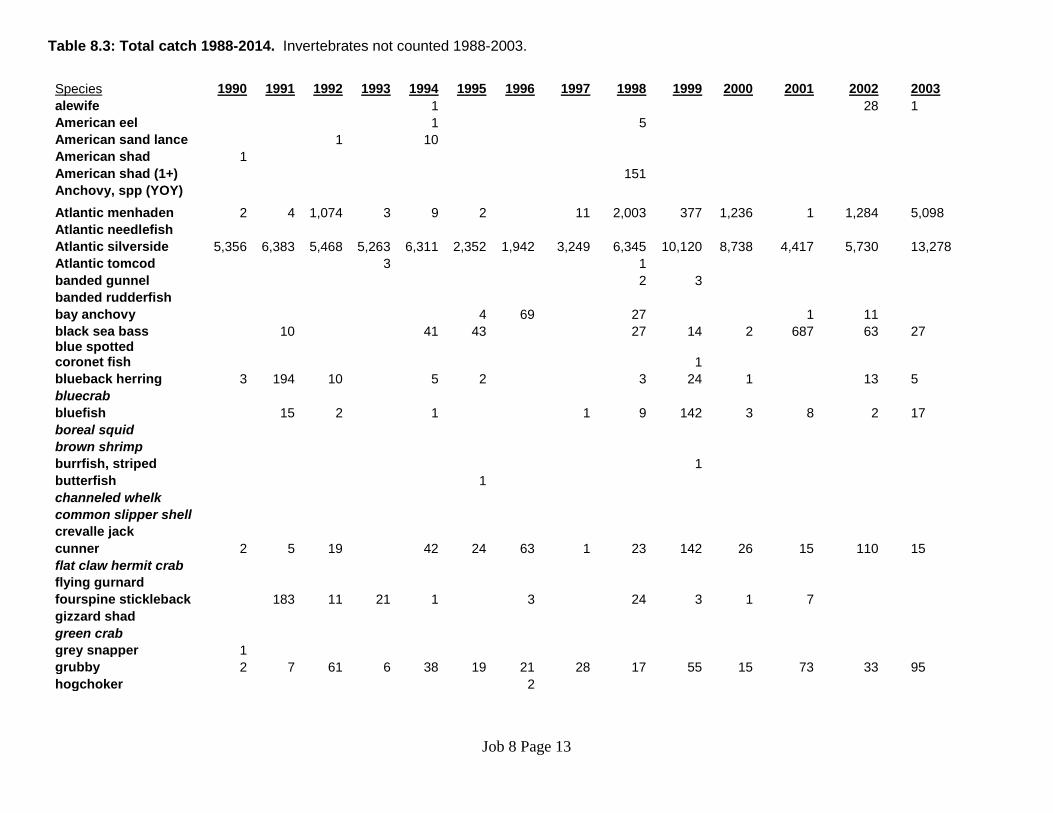
Table 8.3: Total catch 1988-2014. Invertebrates not counted 1988-2003. Species 1990 1991 1992 1993 1994 1995 1996 1997 1998 1999 2000 2001 2002 2003 alewife 1 28 1 American eel 1 5 American sand lance 1 10 American shad 1 American shad (1+) 151 Anchovy, spp (YOY) Atlantic menhaden 2 4 1,074 3 9 2 11 2,003 377 1,236 1 1,284 5,098 Atlantic needlefish Atlantic silverside 5,356 6,383 5,468 5,263 6,311 2,352 1,942 3,249 6,345 10,120 8,738 4,417 5,730 13,278 Atlantic tomcod 3 1 banded gunnel 2 3 banded rudderfish bay anchovy 4 69 27 1 11 black sea bass 10 41 43 27 14 2 687 63 27 blue spotted coronet fish 1
blueback herring 3 194 10 5 2 3 24 1 13 5 bluecrab bluefish 15 2 1 1 9 142 3 8 2 17 boreal squid brown shrimp burrfish, striped 1 butterfish 1 channeled whelk common slipper shell crevalle jack cunner 2 5 19 42 24 63 1 23 142 26 15 110 15 flat claw hermit crab flying gurnard fourspine stickleback 183 11 21 1 3 24 3 1 7 gizzard shad green crab grey snapper 1 grubby 2 7 61 6 38 19 21 28 17 55 15 73 33 95 hogchoker 2
Job 8 Page 13
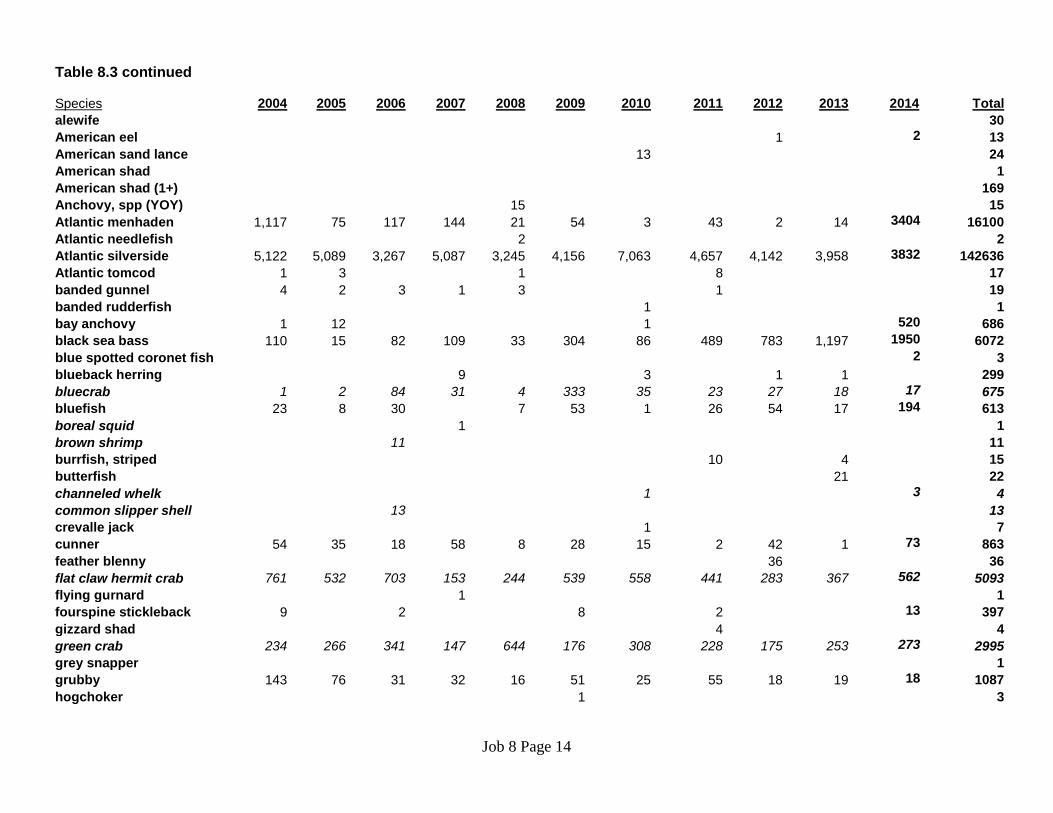
Table 8.3 continued
Species 2004 2005 2006 2007 2008 2009 2010 2011 2012 2013 2014 Total alewife 30 American eel 1 2 13 American sand lance 13 24 American shad 1 American shad (1+) 169 Anchovy, spp (YOY) 15 15 Atlantic menhaden 1,117 75 117 144 21 54 3 43 2 14 3404 16100 Atlantic needlefish 2 2 Atlantic silverside 5,122 5,089 3,267 5,087 3,245 4,156 7,063 4,657 4,142 3,958 3832 142636 Atlantic tomcod 1 3 1 8 17 banded gunnel 4 2 3 1 3 1 19 banded rudderfish 1 1 bay anchovy 1 12 1 520 686 black sea bass 110 15 82 109 33 304 86 489 783 1,197 1950 6072 blue spotted coronet fish 2 3 blueback herring 9 3 1 1 299 bluecrab 1 2 84 31 4 333 35 23 27 18 17 675 bluefish 23 8 30 7 53 1 26 54 17 194 613 boreal squid 1 1 brown shrimp 11 11 burrfish, striped 10 4 15 butterfish 21 22 channeled whelk 1 3 4 common slipper shell 13 13 crevalle jack 1 7 cunner 54 35 18 58 8 28 15 2 42 1 73 863 feather blenny 36 36 flat claw hermit crab 761 532 703 153 244 539 558 441 283 367 562 5093 flying gurnard 1 1 fourspine stickleback 9 2 8 2 13 397 gizzard shad 4 4 green crab 234 266 341 147 644 176 308 228 175 253 273 2995 grey snapper 1 grubby 143 76 31 32 16 51 25 55 18 19 18 1087 hogchoker 1 3
Job 8 Page 14
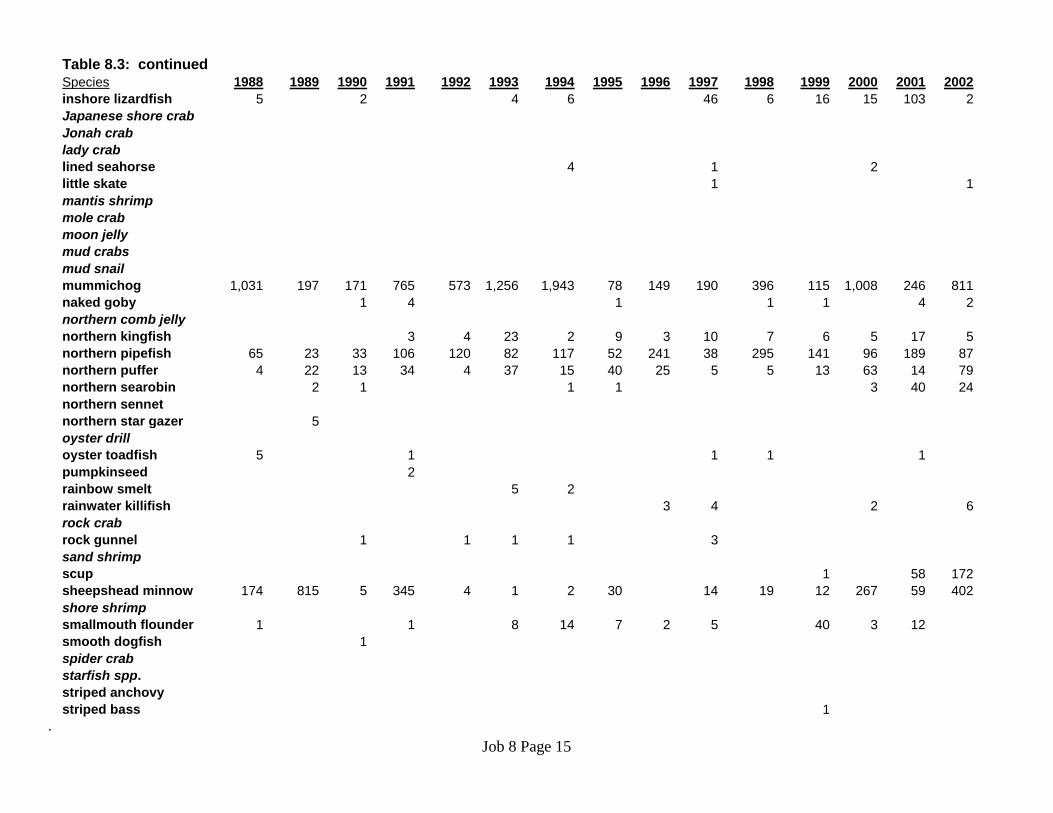
Table 8.3: continued Species 1988 1989 1990 1991 1992 1993 1994 1995 1996 1997 1998 1999 2000 2001 2002 inshore lizardfish 5 2 4 6 46 6 16 15 103 2 Japanese shore crab Jonah crab lady crab lined seahorse 4 1 2 little skate 1 1 mantis shrimp mole crab moon jelly mud crabs mud snail mummichog 1,031 197 171 765 573 1,256 1,943 78 149 190 396 115 1,008 246 811 naked goby 1 4 1 1 1 4 2 northern comb jelly northern kingfish 3 4 23 2 9 3 10 7 6 5 17 5 northern pipefish 65 23 33 106 120 82 117 52 241 38 295 141 96 189 87 northern puffer 4 22 13 34 4 37 15 40 25 5 5 13 63 14 79 northern searobin 2 1 1 1 3 40 24 northern sennet northern star gazer 5 oyster drill oyster toadfish 5 1 1 1 1 pumpkinseed 2 rainbow smelt 5 2 rainwater killifish 3 4 2 6 rock crab rock gunnel 1 1 1 1 3 sand shrimp scup 1 58 172 sheepshead minnow 174 815 5 345 4 1 2 30 14 19 12 267 59 402 shore shrimp smallmouth flounder 1 1 8 14 7 2 5 40 3 12 smooth dogfish 1 spider crab starfish spp. striped anchovy striped bass 1
. Job 8 Page 15
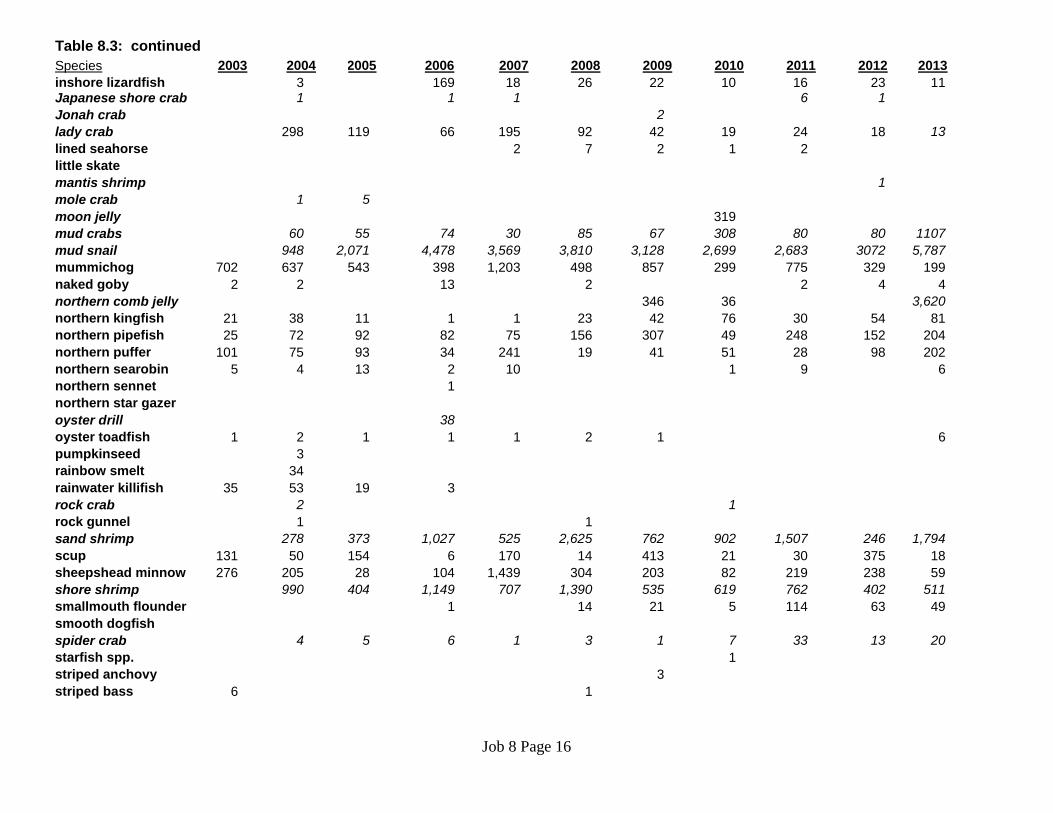
Table 8.3: continued Species 2003 2004 2005 2006 2007 2008 2009 2010 2011 2012 2013 inshore lizardfish 3 169 18 26 22 10 16 23 11 Japanese shore crab 1 1 1 6 1 Jonah crab 2 lady crab 298 119 66 195 92 42 19 24 18 13 lined seahorse 2 7 2 1 2 little skate mantis shrimp 1 mole crab 1 5 moon jelly 319 mud crabs 60 55 74 30 85 67 308 80 80 1107 mud snail 948 2,071 4,478 3,569 3,810 3,128 2,699 2,683 3072 5,787 mummichog 702 637 543 398 1,203 498 857 299 775 329 199 naked goby 2 2 13 2 2 4 4 northern comb jelly 346 36 3,620 northern kingfish 21 38 11 1 1 23 42 76 30 54 81 northern pipefish 25 72 92 82 75 156 307 49 248 152 204 northern puffer 101 75 93 34 241 19 41 51 28 98 202 northern searobin 5 4 13 2 10 1 9 6 northern sennet 1 northern star gazer oyster drill 38 oyster toadfish 1 2 1 1 1 2 1 6 pumpkinseed 3 rainbow smelt 34 rainwater killifish 35 53 19 3 rock crab 2 1 rock gunnel 1 1 sand shrimp 278 373 1,027 525 2,625 762 902 1,507 246 1,794 scup 131 50 154 6 170 14 413 21 30 375 18 sheepshead minnow 276 205 28 104 1,439 304 203 82 219 238 59 shore shrimp 990 404 1,149 707 1,390 535 619 762 402 511 smallmouth flounder 1 14 21 5 114 63 49 smooth dogfish spider crab 4 5 6 1 3 1 7 33 13 20 starfish spp. 1 striped anchovy 3 striped bass 6 1
Job 8 Page 16
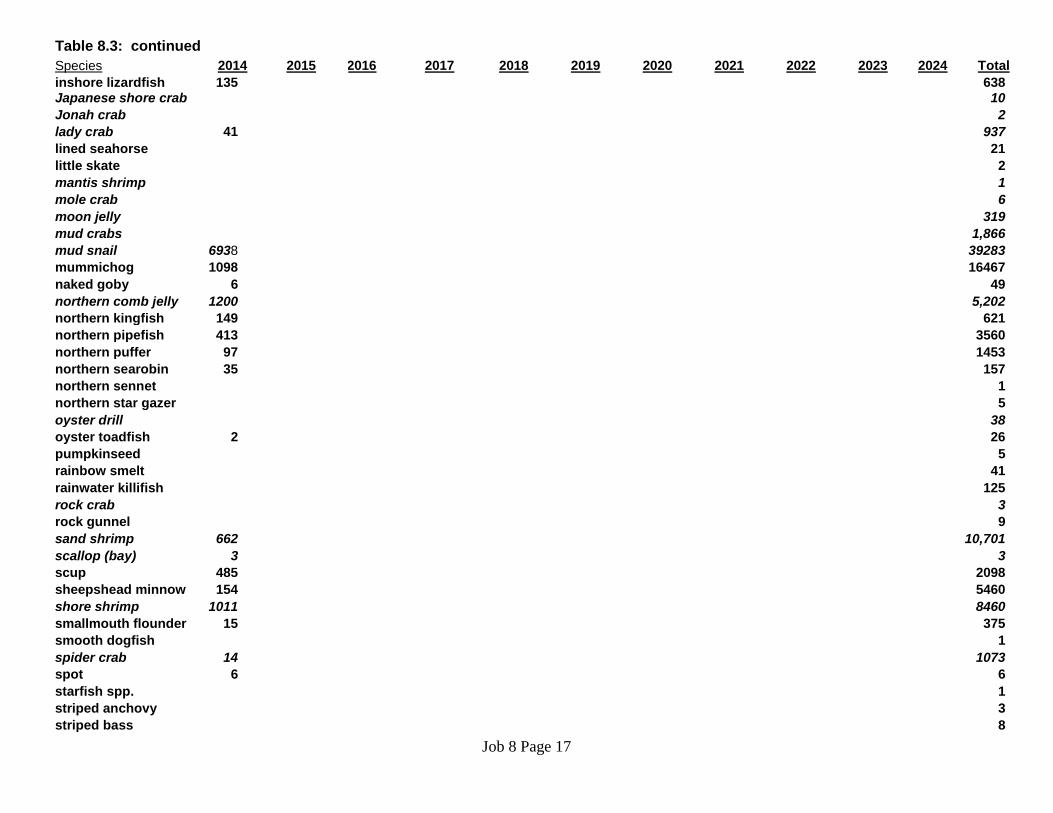
Table 8.3: continued Species 2014 2015 2016 2017 2018 2019 2020 2021 2022 2023 2024 Total inshore lizardfish 135 638 Japanese shore crab 10 Jonah crab 2 lady crab 41 937 lined seahorse 21 little skate 2 mantis shrimp 1 mole crab 6 moon jelly 319 mud crabs 1,866 mud snail 6938 39283 mummichog 1098 16467 naked goby 6 49 northern comb jelly 1200 5,202 northern kingfish 149 621 northern pipefish 413 3560 northern puffer 97 1453 northern searobin 35 157 northern sennet 1 northern star gazer 5 oyster drill 38 oyster toadfish 2 26 pumpkinseed 5 rainbow smelt 41 rainwater killifish 125 rock crab 3 rock gunnel 9 sand shrimp 662 10,701 scallop (bay) 3 3 scup 485 2098 sheepshead minnow 154 5460 shore shrimp 1011 8460 smallmouth flounder 15 375 smooth dogfish 1 spider crab 14 1073 spot 6 6 starfish spp. 1 striped anchovy 3 striped bass 8
Job 8 Page 17
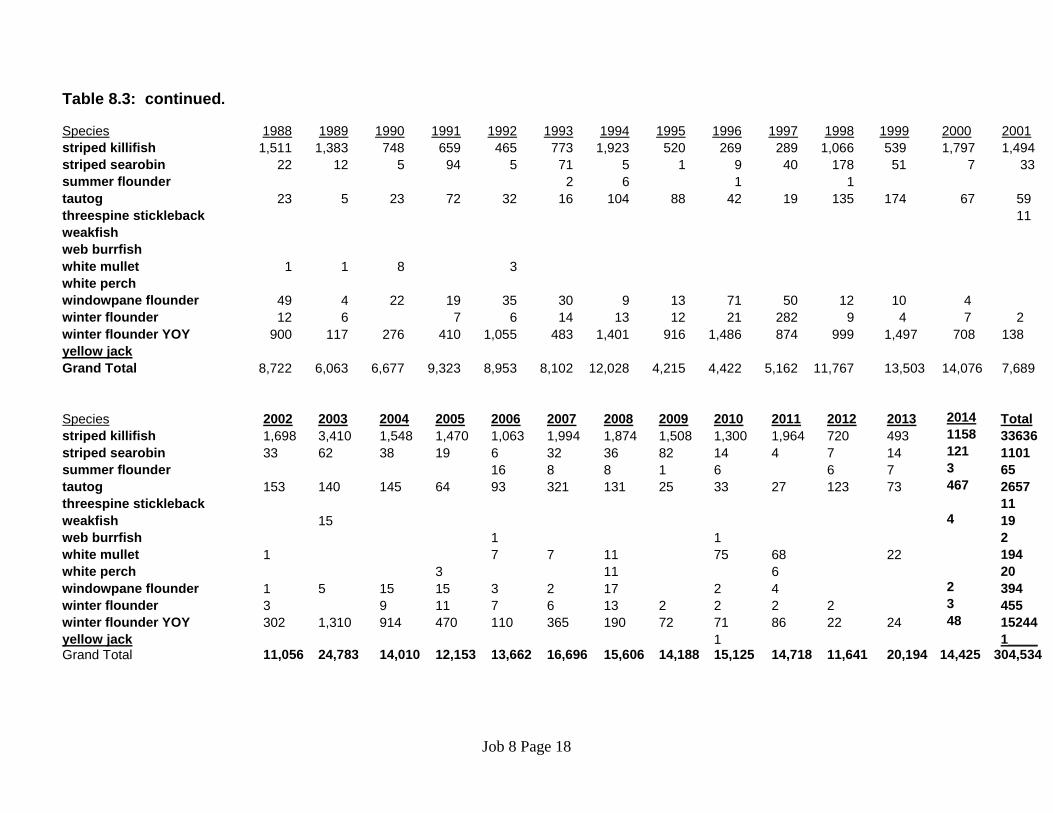
Table 8.3: continued.
Species 1988 1989 1990 1991 1992 1993 1994 1995 1996 1997 1998 1999 2000 2001 striped killifish 1,511 1,383 748 659 465 773 1,923 520 269 289 1,066 539 1,797 1,494 striped searobin 22 12 5 94 5 71 5 1 9 40 178 51 7 33 summer flounder 2 6 1 1 tautog 23 5 23 72 32 16 104 88 42 19 135 174 67 59 threespine stickleback 11 weakfish web burrfish white mullet 1 1 8 3 white perch windowpane flounder 49 4 22 19 35 30 9 13 71 50 12 10 4 winter flounder 12 6 7 6 14 13 12 21 282 9 4 7 2 winter flounder YOY 900 117 276 410 1,055 483 1,401 916 1,486 874 999 1,497 708 138 yellow jack Grand Total 8,722 6,063 6,677 9,323 8,953 8,102 12,028 4,215 4,422 5,162 11,767 13,503 14,076 7,689
Species 2002 2003 2004 2005 2006 2007 2008 2009 2010 2011 2012 2013 2014 Total striped killifish 1,698 3,410 1,548 1,470 1,063 1,994 1,874 1,508 1,300 1,964 720 493 1158 33636 striped searobin 33 62 38 19 6 32 36 82 14 4 7 14 121 1101 summer flounder 16 8 8 1 6 6 7 3 65 tautog 153 140 145 64 93 321 131 25 33 27 123 73 467 2657 threespine stickleback 11 weakfish 15 4 19 web burrfish 1 1 2 white mullet 1 7 7 11 75 68 22 194 white perch 3 11 6 20 windowpane flounder 1 5 15 15 3 2 17 2 4 2 394 winter flounder 3 9 11 7 6 13 2 2 2 2 3 455 winter flounder YOY 302 1,310 914 470 110 365 190 72 71 86 22 24 48 15244 yellow jack 1 1____ Grand Total 11,056 24,783 14,010 12,153 13,662 16,696 15,606 14,188 15,125 14,718 11,641 20,194 14,425 304,534
Job 8 Page 18
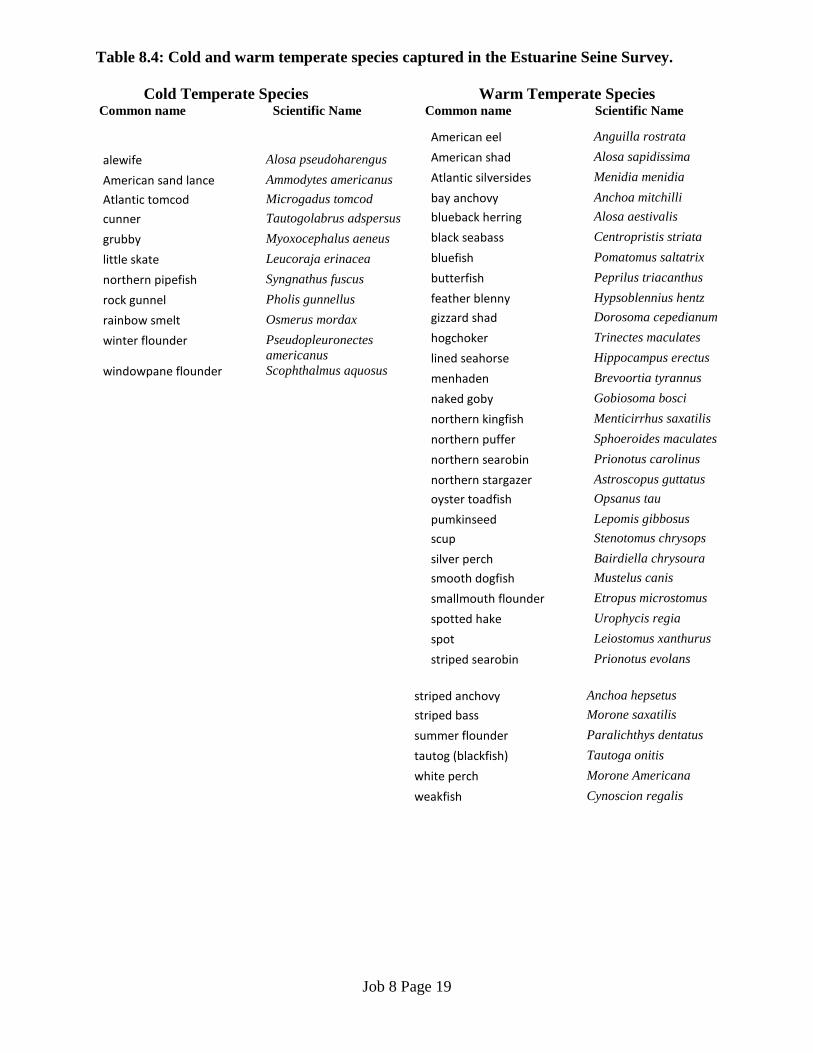
Table 8.4: Cold and warm temperate species captured in the Estuarine Seine Survey. Cold Temperate Species Warm Temperate Species Common name Scientific Name Common name Scientific Name
striped anchovy Anchoa hepsetus striped bass Morone saxatilis summer flounder Paralichthys dentatus tautog (blackfish) Tautoga onitis white perch Morone Americana weakfish Cynoscion regalis
alewife Alosa pseudoharengus American sand lance Ammodytes americanus Atlantic tomcod Microgadus tomcod cunner Tautogolabrus adspersus grubby Myoxocephalus aeneus little skate Leucoraja erinacea northern pipefish Syngnathus fuscus rock gunnel Pholis gunnellus rainbow smelt Osmerus mordax winter flounder Pseudopleuronectes
americanus windowpane flounder Scophthalmus aquosus
American eel Anguilla rostrata American shad Alosa sapidissima Atlantic silversides Menidia menidia bay anchovy Anchoa mitchilli blueback herring Alosa aestivalis black seabass Centropristis striata bluefish Pomatomus saltatrix butterfish Peprilus triacanthus feather blenny Hypsoblennius hentz gizzard shad Dorosoma cepedianum hogchoker Trinectes maculates lined seahorse Hippocampus erectus menhaden Brevoortia tyrannus naked goby Gobiosoma bosci northern kingfish Menticirrhus saxatilis northern puffer Sphoeroides maculates northern searobin Prionotus carolinus northern stargazer Astroscopus guttatus oyster toadfish Opsanus tau pumkinseed Lepomis gibbosus scup Stenotomus chrysops silver perch Bairdiella chrysoura smooth dogfish Mustelus canis smallmouth flounder Etropus microstomus spotted hake Urophycis regia spot Leiostomus xanthurus striped searobin Prionotus evolans
Job 8 Page 19
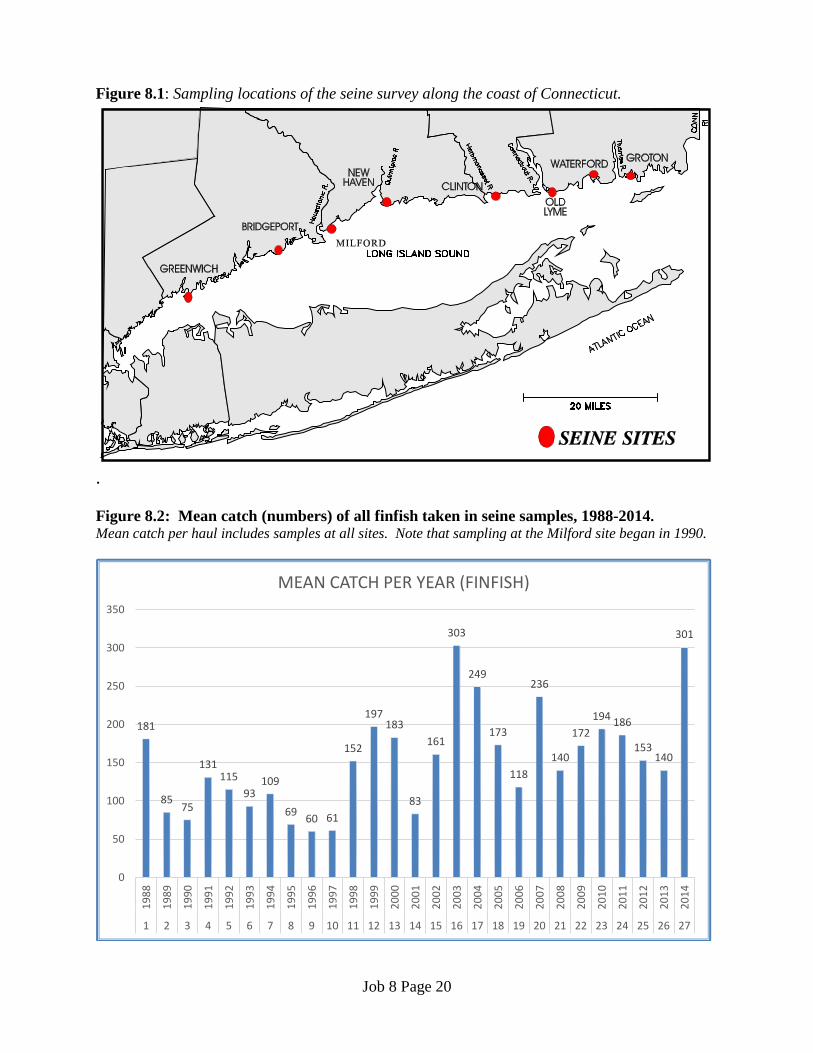
Figure 8.1: Sampling locations of the seine survey along the coast of Connecticut.
. Figure 8.2: Mean catch (numbers) of all finfish taken in seine samples, 1988-2014. Mean catch per haul includes samples at all sites. Note that sampling at the Milford site began in 1990.
181
8575
131115
93109
69 60 61
152
197183
83
161
303
249
173
118
236
140
172194 186
153140
301
0
50
100
150
200
250
300
350
1988
1989
1990
1991
1992
1993
1994
1995
1996
1997
1998
1999
2000
2001
2002
2003
2004
2005
2006
2007
2008
2009
2010
2011
2012
2013
2014
1 2 3 4 5 6 7 8 9 10 11 12 13 14 15 16 17 18 19 20 21 22 23 24 25 26 27
MEAN CATCH PER YEAR (FINFISH)
Job 8 Page 20
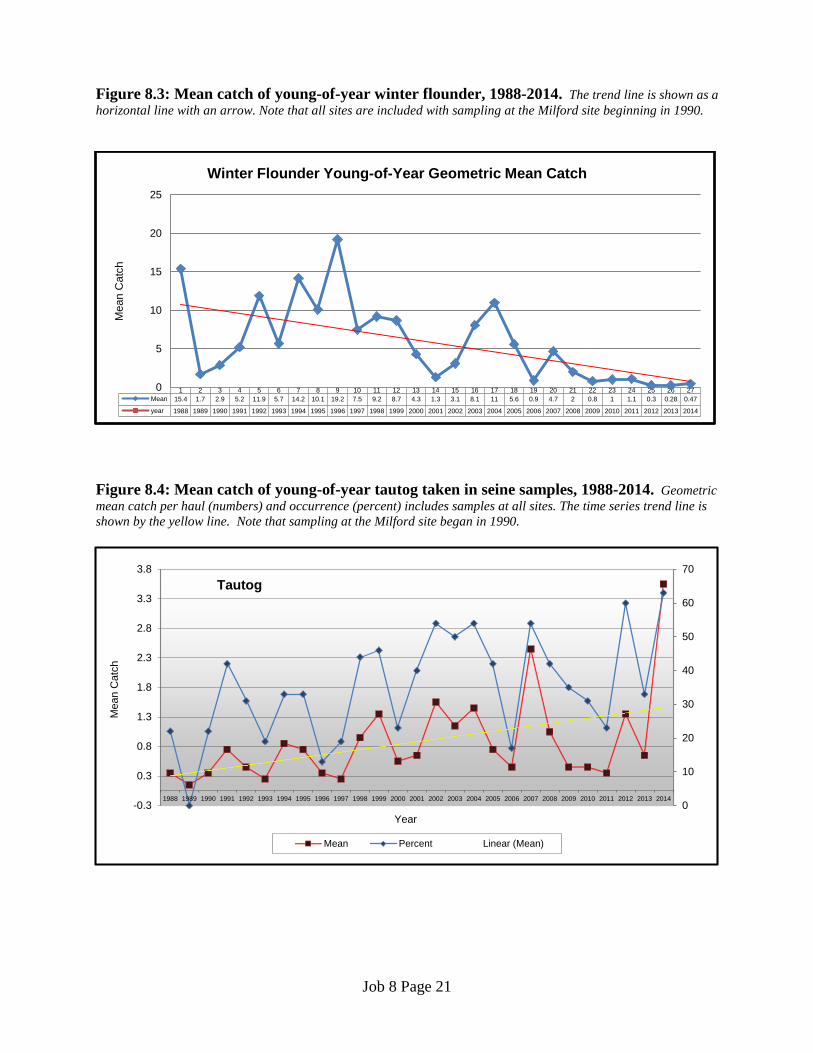
Figure 8.3: Mean catch of young-of-year winter flounder, 1988-2014. The trend line is shown as a horizontal line with an arrow. Note that all sites are included with sampling at the Milford site beginning in 1990.
Figure 8.4: Mean catch of young-of-year tautog taken in seine samples, 1988-2014. Geometric mean catch per haul (numbers) and occurrence (percent) includes samples at all sites. The time series trend line is shown by the yellow line. Note that sampling at the Milford site began in 1990.
1 2 3 4 5 6 7 8 9 10 11 12 13 14 15 16 17 18 19 20 21 22 23 24 25 26 27Mean 15.4 1.7 2.9 5.2 11.9 5.7 14.2 10.1 19.2 7.5 9.2 8.7 4.3 1.3 3.1 8.1 11 5.6 0.9 4.7 2 0.8 1 1.1 0.3 0.28 0.47
year 1988 1989 1990 1991 1992 1993 1994 1995 1996 1997 1998 1999 2000 2001 2002 2003 2004 2005 2006 2007 2008 2009 2010 2011 2012 2013 2014
0
5
10
15
20
25
Mea
n C
atch
Winter Flounder Young-of-Year Geometric Mean Catch
0
10
20
30
40
50
60
70
-0.3
0.3
0.8
1.3
1.8
2.3
2.8
3.3
3.8
1988 1989 1990 1991 1992 1993 1994 1995 1996 1997 1998 1999 2000 2001 2002 2003 2004 2005 2006 2007 2008 2009 2010 2011 2012 2013 2014
Mea
n C
atch
Year
Tautog
Mean Percent Linear (Mean)
Job 8 Page 21
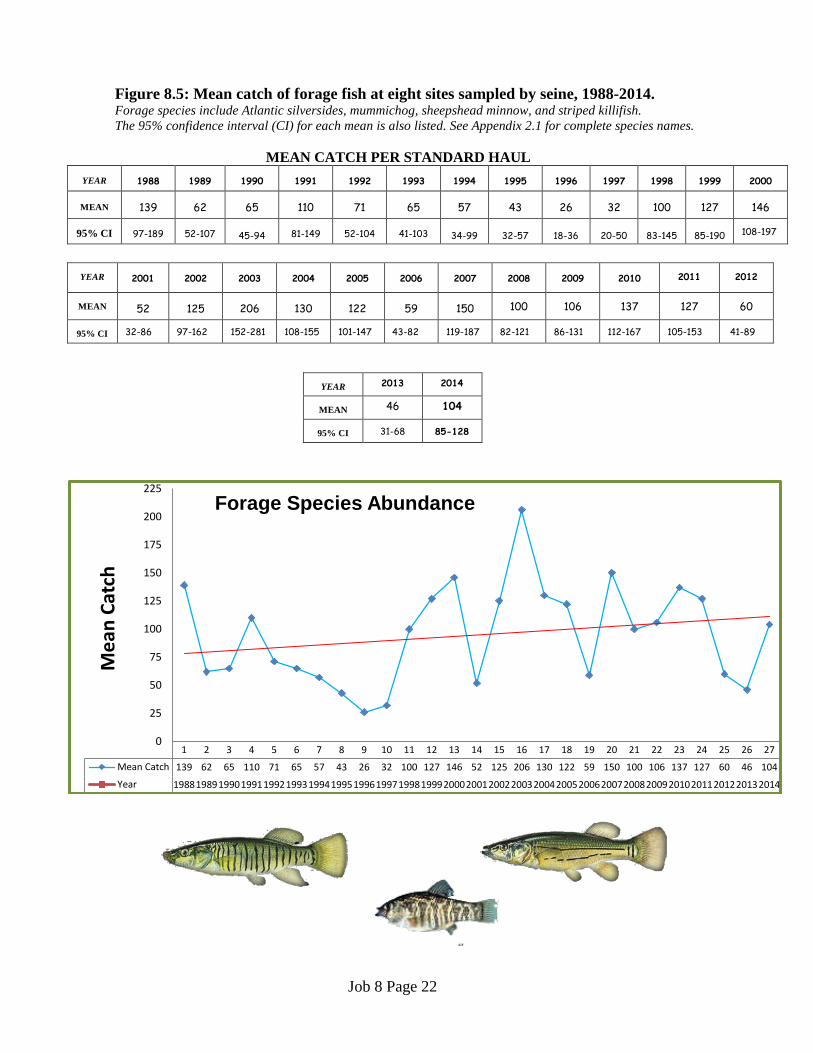
Figure 8.5: Mean catch of forage fish at eight sites sampled by seine, 1988-2014. Forage species include Atlantic silversides, mummichog, sheepshead minnow, and striped killifish. The 95% confidence interval (CI) for each mean is also listed. See Appendix 2.1 for complete species names.
MEAN CATCH PER STANDARD HAUL
YEAR
1988
1989
1990
1991
1992
1993
1994
1995
1996
1997
1998
1999
2000
MEAN
139
62
65
110
71
65
57
43
26
32
100
127
146
95% CI
97-189
52-107
45-94
81-149
52-104
41-103
34-99
32-57
18-36
20-50
83-145
85-190 108-197
YEAR
2001
2002
2003
2004
2005
2006
2007
2008
2009
2010
2011 2012
MEAN
52
125
206
130
122
59
150 100 106 137 127 60
95% CI 32-86 97-162 152-281 108-155 101-147 43-82 119-187 82-121 86-131 112-167 105-153 41-89
YEAR 2013 2014
MEAN 46 104
95% CI 31-68 85-128
1 2 3 4 5 6 7 8 9 10 11 12 13 14 15 16 17 18 19 20 21 22 23 24 25 26 27
Mean Catch 139 62 65 110 71 65 57 43 26 32 100 127 146 52 125 206 130 122 59 150 100 106 137 127 60 46 104
Year 198819891990199119921993199419951996199719981999200020012002200320042005200620072008200920102011201220132014
0
25
50
75
100
125
150
175
200
225
Mea
n Ca
tch
Forage Species Abundance
Job 8 Page 22
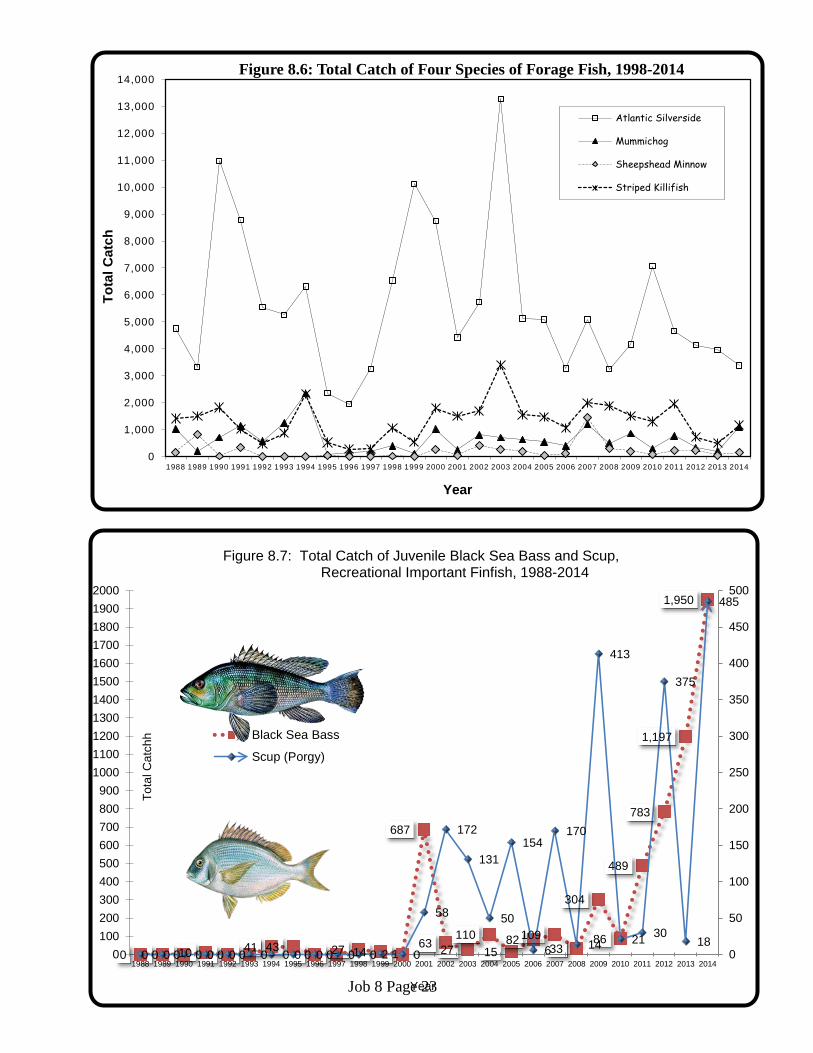
0
1,000
2,000
3,000
4,000
5,000
6,000
7,000
8,000
9,000
10,000
11,000
12,000
13,000
14,000
1988 1989 1990 1991 1992 1993 1994 1995 1996 1997 1998 1999 2000 2001 2002 2003 2004 2005 2006 2007 2008 2009 2010 2011 2012 2013 2014
Tota
l Cat
ch
Year
Figure 8.6: Total Catch of Four Species of Forage Fish, 1998-2014
Atlantic Silverside
Mummichog
Sheepshead Minnow
Striped Killifish
0 0 0 10 0 0 41 43 0 0 27 14 2
687
63 27110
1582 109
33
304
86
489
783
1,197
1,950
0 0 0 0 0 0 0 0 0 0 0 1 0
58
172
131
50
154
6
170
14
413
21 30
375
18
485
0
50
100
150
200
250
300
350
400
450
500
0100200300400500600700800900
10001100120013001400150016001700180019002000
1988 1989 1990 1991 1992 1993 1994 1995 1996 1997 1998 1999 2000 2001 2002 2003 2004 2005 2006 2007 2008 2009 2010 2011 2012 2013 2014
Tota
l Cat
chh
Year
Figure 8.7: Total Catch of Juvenile Black Sea Bass and Scup, Recreational Important Finfish, 1988-2014
Black Sea Bass
Scup (Porgy)
Job 8 Page 23
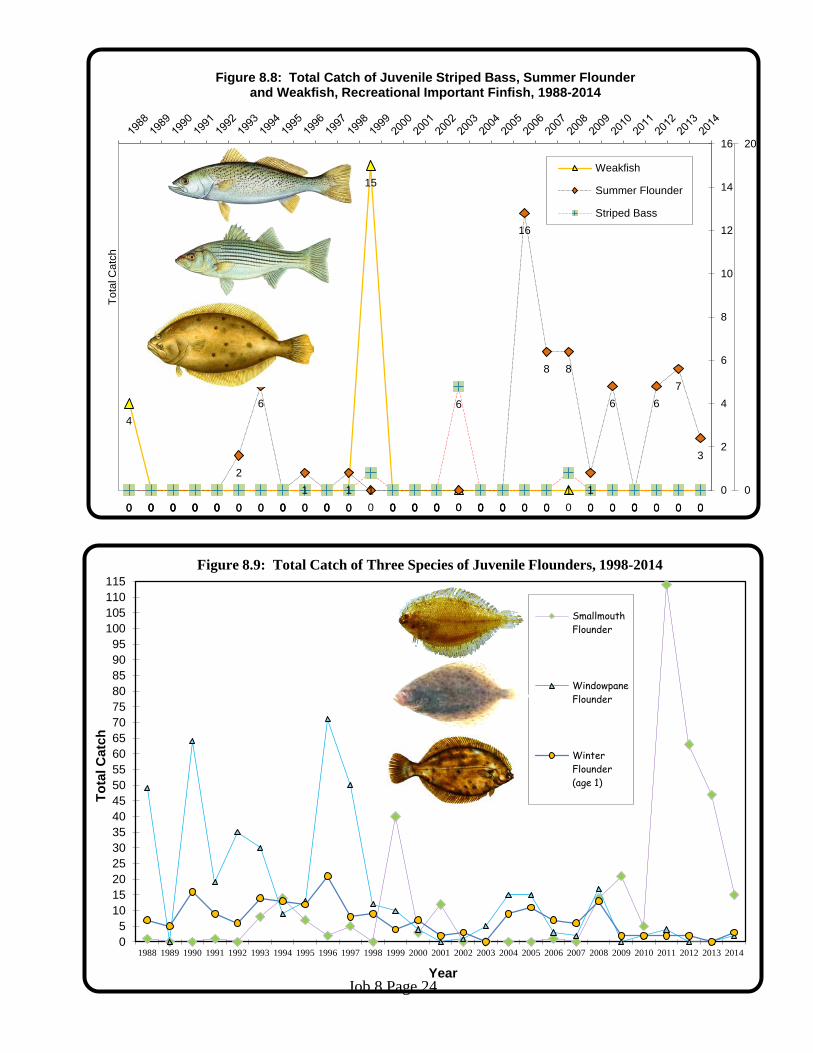
05
101520253035404550556065707580859095
100105110115
1988 1989 1990 1991 1992 1993 1994 1995 1996 1997 1998 1999 2000 2001 2002 2003 2004 2005 2006 2007 2008 2009 2010 2011 2012 2013 2014
Tota
l Cat
ch
Year
Figure 8.9: Total Catch of Three Species of Juvenile Flounders, 1998-2014
SmallmouthFlounder
WindowpaneFlounder
WinterFlounder(age 1)
000000000000000
15
0000000000
4
0 0 0 0 0
2
6
01
01
0 0 0 0 0 0 0
16
8 8
1
6
0
67
3
0 0 0 0 0 0 0 0 0 0 01
0 0 0
6
0 0 0 01
0 0 0 0 0 00
20
0
2
4
6
8
10
12
14
16
Tota
l Cat
ch
Figure 8.8: Total Catch of Juvenile Striped Bass, Summer Flounder and Weakfish, Recreational Important Finfish, 1988-2014
Weakfish
Summer Flounder
Striped Bass
Job 8 Page 24
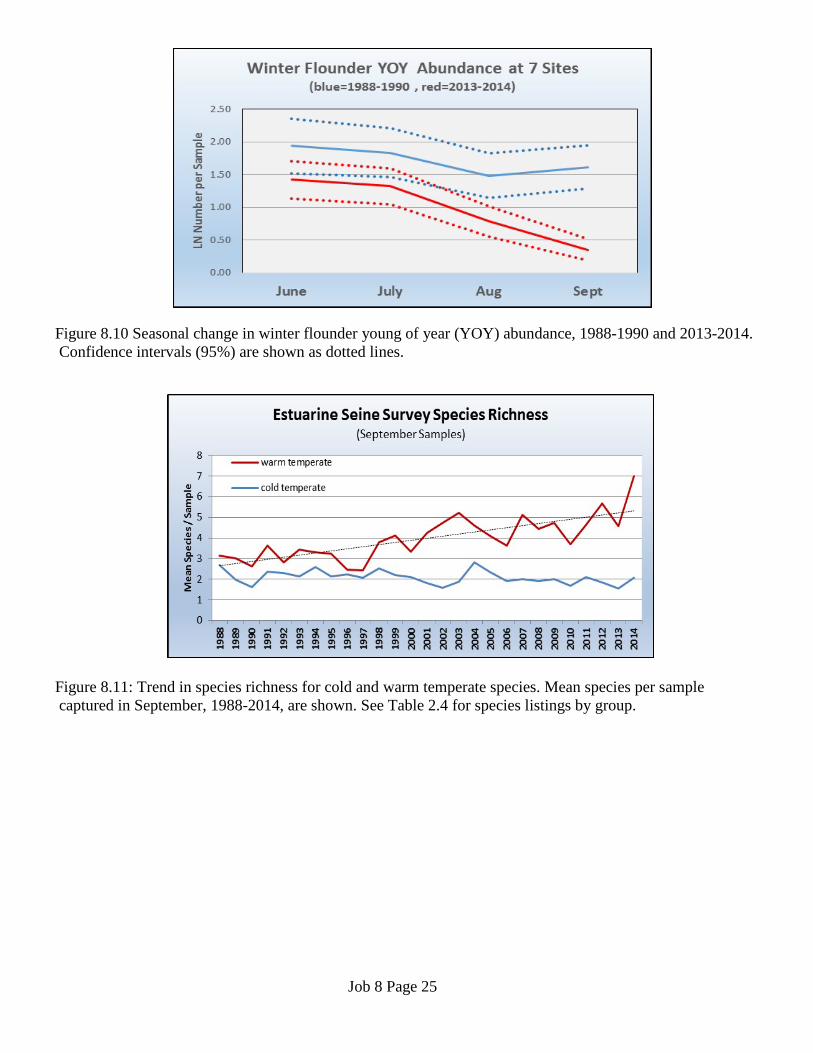
Figure 8.10 Seasonal change in winter flounder young of year (YOY) abundance, 1988-1990 and 2013-2014. Confidence intervals (95%) are shown as dotted lines.
Figure 8.11: Trend in species richness for cold and warm temperate species. Mean species per sample captured in September, 1988-2014, are shown. See Table 2.4 for species listings by group.
Job 8 Page 25
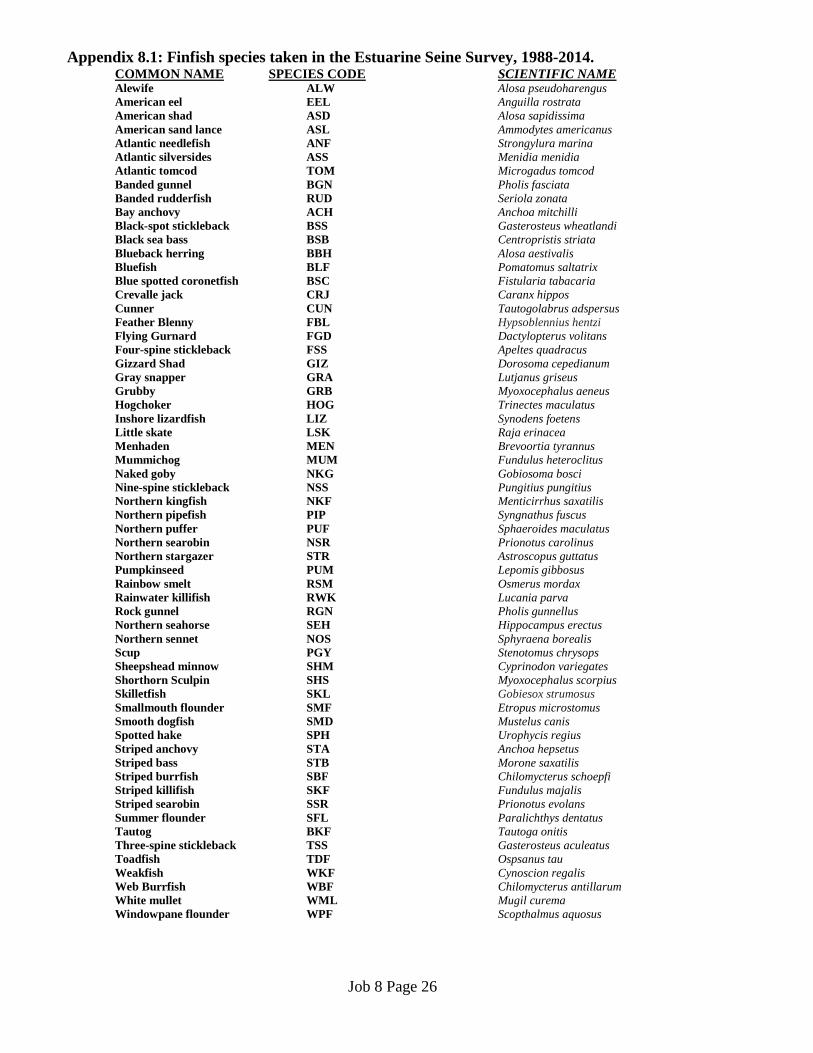
Appendix 8.1: Finfish species taken in the Estuarine Seine Survey, 1988-2014. COMMON NAME SPECIES CODE SCIENTIFIC NAME Alewife ALW Alosa pseudoharengus American eel EEL Anguilla rostrata American shad ASD Alosa sapidissima American sand lance ASL Ammodytes americanus Atlantic needlefish ANF Strongylura marina Atlantic silversides ASS Menidia menidia Atlantic tomcod TOM Microgadus tomcod
Banded gunnel BGN Pholis fasciata Banded rudderfish RUD Seriola zonata
Bay anchovy ACH Anchoa mitchilli Black-spot stickleback BSS Gasterosteus wheatlandi Black sea bass BSB Centropristis striata Blueback herring BBH Alosa aestivalis Bluefish BLF Pomatomus saltatrix Blue spotted coronetfish BSC Fistularia tabacaria Crevalle jack CRJ Caranx hippos Cunner CUN Tautogolabrus adspersus Feather Blenny FBL Hypsoblennius hentzi Flying Gurnard FGD Dactylopterus volitans Four-spine stickleback FSS Apeltes quadracus Gizzard Shad GIZ Dorosoma cepedianum Gray snapper GRA Lutjanus griseus Grubby GRB Myoxocephalus aeneus Hogchoker HOG Trinectes maculatus Inshore lizardfish LIZ Synodens foetens Little skate LSK Raja erinacea Menhaden MEN Brevoortia tyrannus Mummichog MUM Fundulus heteroclitus Naked goby NKG Gobiosoma bosci Nine-spine stickleback NSS Pungitius pungitius Northern kingfish NKF Menticirrhus saxatilis Northern pipefish PIP Syngnathus fuscus Northern puffer PUF Sphaeroides maculatus Northern searobin NSR Prionotus carolinus Northern stargazer STR Astroscopus guttatus Pumpkinseed PUM Lepomis gibbosus Rainbow smelt RSM Osmerus mordax Rainwater killifish RWK Lucania parva Rock gunnel RGN Pholis gunnellus Northern seahorse SEH Hippocampus erectus Northern sennet NOS Sphyraena borealis Scup PGY Stenotomus chrysops Sheepshead minnow SHM Cyprinodon variegates Shorthorn Sculpin SHS Myoxocephalus scorpius Skilletfish SKL Gobiesox strumosus Smallmouth flounder SMF Etropus microstomus Smooth dogfish SMD Mustelus canis Spotted hake SPH Urophycis regius Striped anchovy STA Anchoa hepsetus Striped bass STB Morone saxatilis Striped burrfish SBF Chilomycterus schoepfi Striped killifish SKF Fundulus majalis Striped searobin SSR Prionotus evolans Summer flounder SFL Paralichthys dentatus Tautog BKF Tautoga onitis Three-spine stickleback TSS Gasterosteus aculeatus Toadfish TDF Ospsanus tau Weakfish WKF Cynoscion regalis Web Burrfish WBF Chilomycterus antillarum White mullet WML Mugil curema Windowpane flounder WPF Scopthalmus aquosus
Job 8 Page 26
Appendix 8.1: Finfish species taken in the Estuarine Seine Survey, 1988-2014. Winter flounder (YOY) WFO Pseudopleuronectes americanus Winter flounder (AGE 1+) WFL Pseudopleuronectes americanus Yellow jack YJK Caranx bartholomaei
Appendix 8.2: Invertebrate species taken in the Estuarine Seine Survey, 1988-2014.
COMMON NAME SPECIES CODE SCIENTIFIC NAME Bay Scallop SCA Argopecten irradians Blue crab BCR Callinectes sapidus Brown Shrimp BNS Panaeus aztecus Chaneled Whelk CHW Busycotypus canaliculatus Northern Comb Jelly COM Bolinopsis infundibulum Green crab GCR Carcinus maenas Hermit crab HER Pagurus spp. Horseshoe crab HSC Limulus polyphemus Japanese crab JCR Hemigrapsus sanguineus Lady crab LCR Ovalipes ocellatus Mantis shrimp MAN Squilla empusa Moon Jelly MOJ Aurelia aurita Mud crab BMC Panopeus spp. Mole crab MLR Emerita talpoida
Mud snail MSN Nassarius obsoletus Rock crab RCR Cancer irroratus Sand shrimp CRG Crangon septemspinosa Sea Star STF Asterias forbesi Shore shrimp PAL Palaemonetes spp.
Shortfin Squid ILL Illex illecebrosus
Job 8 Page 27
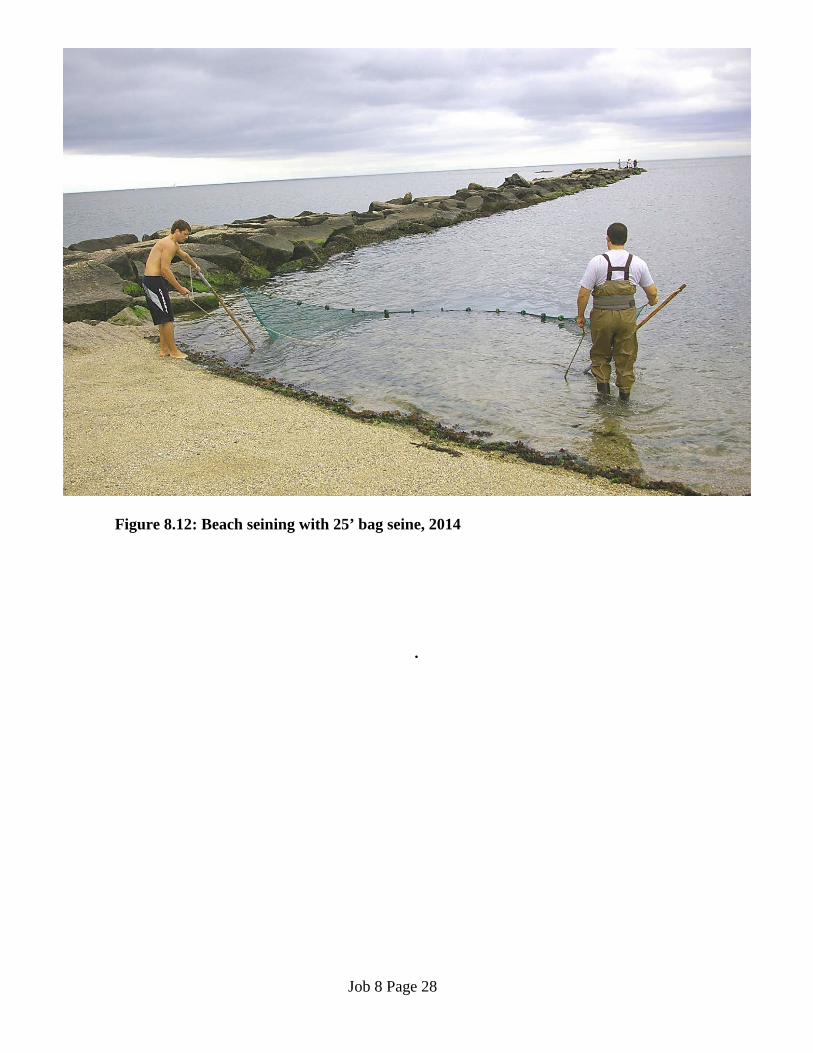
Figure 8.12: Beach seining with 25’ bag seine, 2014
.
Job 8 Page 28