Embed Size (px)
Citation preview

IRIi 9048 PLEASE DO NOT REMOVE FROM LIBRARY
Bureau of Mines Report of Investigations/1986
A Statistical Determination of Spark Ignition Safety Factors in Methane, Propane, and Ethylene Mixtures in Air
By James C. Cawley
UNITED STATES DEPARTMENT OF THE INTERIOR

--
Report of Investigations 9048
A Statistical Determination of Spark Ignition Safety Factors in Methane, Propane, and Ethylene Mixtures in Air
By James C. Cawley
UNITED STATES DEPARTMENT OF THE INTERIOR Donald Paul Hodel, Secretary
BUREAU OF MINES Robert C. Horton, Director

Library of Congress Cataloging in Publication Data:
Cawley, James C A statistical determination of spark ignition safety factors in
methane, propane, and ethylene mixtures in air.
(Report of investigations I Bureau of Mines; 9048)
Bibliography: p. 15.
Supt. of Docs. no.: I 28.23:9048.
1. Electric apparatus and appliances-Safety measures. 2. Mining machinery- r<;)ectric equipment-Safety measures. 3, Mine gases-Safety measures. 4. Electric discharges. 1. Title. II. Series: Report of investigations (United States. Bureau of Mines) ; 9048.
TN23.U43 [TK152] 622s [621.31'042] 86-600190

~--
CONTENTS
Abstract........................................................................ 1 Introduction................................................................... 2 Tes t procedures •••••••••••••••••••••••••••••••••••••••••••••••••••• It. • • • • • • • • • • 3
Statistical procedure........................................................ 3 Experimental procedure....................................................... 5
Discussion of resul ts •••••••••••••• " •••..••.•.••• " ••. " • . . • • . . • . . • • • • • • • • .. • • • • • • 5 Resistive circuits •••••••• • " •••••••••••••••••••••••••••••••• t................. 5 Inductive circuits •••• t ••••••••• t ••• ,......................................... 6 Capacitive circuits •••••••••••••••••••••••••••••• "........................... 9
Safety factor determination.~ ••..........•••. ,................................. 12 Conclusions ••• t • t , •• • • • • • • • • • • • • •• • • • •• •• •• • •• •• •• •••• ••••• ••••• ••••• •• •••• •• •• 15 References............... • ••••• ••••• ••• •••••••••• •••••••••••••••••••••••••••••• • 15
1.
2. 3. 4. S.
6. 7. 8.
9. 10. 11. 12. 13.
ILLUSTRATIONS
Mean ignition current for resistance in 8.3% methane-air, 5.3% propane-air, and 7.8% ethylene-air atmospheres •••••••••••••••••••••••••••••••••••
Mean and 99% confidence interval for resistive circuits ••••••••••••••••••• Experimental versus published data for resistive circuits ••••••••••••••••• Range of data for resistance in 8.3% methane-air •••••••••••••••••••••••••• Mean ignition current for inductance in 8.3% methane-air, 5.3% propane-air, and 7.8% ethylene-air atmospheres at 24 V dc ••••••••••••••••••••••••
Mean and 99% confidence interval for inductive circuits ••••••••••••••••••• Experimental versus published data for inductive circuits ••••••••••••••••• Mean ignition voltage for capacitance in 8.3% methane-air, 5.3% propane-air, and 7.8% ethylene-air atmospheres •••••••••••••••••••••••••••••••••••
Mean and 99% confidence interval capacitive circuits •••••••••••••••••••••• Capacitance in 8.3% methane-air--experimental versus published data ••••••• Resistance safety factors ••••••••••••••••••••••••••••••••••••••••••••••••• Inductance safety factors ••••••••••••••••••••••••••••••••••••. t •••••••••••• Capacitance safety factors ••••••••••••••••••••••••••••••••••••• , ••••••••••
TABLES
6 7 7 8
8 9 9
11 11 11 13 13 14
1. Data for resistive circuits............................................... 5 2. Data for inductive circuits (24 V dc)..................................... 8 3. Capacitor test circuit characteristics.................................... 10 4. Ignition energy contribution from power supply versus ignition energy..... 10 5. Data for capacitive circuits.............................................. 12 6. Igni tion energy........................................................... 12 7. ~Safety factors for resistive circuits..................................... 13 8. Safety factors for inductive circuits at 24 V dc.......................... 14 9. Safety factors for capacitive circuits.................................... 14

UNIT OF MEASURE ABBREVIATIONS USED IN THIS REPORT
A ampere llH mic.rohenry
F farad mJ millijoule
H henry llJ mic.rojoule
J joule IlS microsecond
kohm kilohm rpm revolution per minute
rnA milliampere s second
llF microfarad V dc volt, direct current
mH millihenry yr year

A STATISTICAL DETERMINATION OF SPARK IGNITION SAFETY FACTORS IN METHANE,
PROPANE, AND ETHYLENE MIXTURES IN AIR
By James C. Cawley1
ABSTRACT
The Bureau of Mines conducted an investigation to statistically determine the mean current or voltage for resistive, inductive, and capacitive circuits that would cause spark ignitions in 8.3% methane-air, 5.3% propane-air, and 7.8% ethylene-air mixtures. Each mean ignition current or voltage was determined on the basis of 100 trials. Each trial consisted of 400 revolutions, 200 in each polarity, at 80 rpm of the standard breakf1ash apparatus.
In general, spark ignition curves published in UL 913 for resistive and inductive circuits represent approximately the mean current values determined in this study, while published capacitive circuit values in methane are considerably less than the mean voltage values from this study, especially for a capacitance of less than 100 ~F. For resistive and inductive circuits, spark ignitions were obtained at currents considerably below those in the published curves, but this study was not optimized to find minimum ignition values.
This report defines "safety factor" as applied to intrinsic safety testing as the energy ratio of the mean values of ignition current or voltage for two test gases. The safety factors presented in this report are not constant with voltage or current and, therefore, are not recommended for use.
1Supervisory electrical engineer, Pittsburgh Research Center, Bureau of Mines, Pittsburgh, PA.

[i II I
2
INTRODUCTION
In equipment approved as "intrinsically safe," any sparking in the electrical circuits that may occur during normal operation will not be enough to cause an ignition of the surrounding atmosphere. In the United States, approval of intrinsically safe apparatus used in industrial applications is based on Underwriters Laboratories Standard 913 CUL 913), "Intrinsically Safe Apparatus and Associated Apparatus," and the National Fire Protection Association Standard 493 (NFPA 493), "Intrinsically Safe Apparatus for Use in Class I Hazardous Locations and Its Associated Apparatus." The UL 913 and NFPA 493 documents are virtually identical concerning the requirements for intrinsically safe equipment. For mining applications, however, approval authority lies with the U.S. Department of Labor's Mine Safety and Health Administration (MSHA). MSHA regulations covering the approval requirements for intrinSically safe equipment for use in underground mines are contained in the Code of Federal Regulations, Title 30, Part 18.68. The MSHA document lists a short number of specific tests required of intrinsically safe equipment, but in practice, the MSHA requirements parallel those of UL 913 and NFPA 493.
Traditionally, the term "safety factor," in the context of intrinsic safety, refers to a margin of safety in actual use, produced by using a higher current or voltage in approval testing than would be used in normal operation. The numerical safety factor is computed as the ratio of the product of the higher voltage and current to the voltage and current in normal operation. The safety factors related to the spark ignition characteristics of methane-air, propane-air, and ethylene-air mixtures remain unclear despite the widespread use of national standards for intrinsic safety. As the field of intrinsic safety advanced, it was found that spark ignition could be achieved at lower currents or voltages if the test electrode materials or geometry was altered. As more sensitive testing machines became possible, standards
organizations adopted stricter test criteria without regard to the true safety factor of the test relative to the conditions of actual use.
Electronic equipment used in mining has evolved and become more complex. Solidstate electronics are used in all new applications for instrumentation, communications, environmental monitoring, etc. As the complexity of this equipment increases, so does its intolerance for the overvoltage or overcurrent conditions induced during routine intrinsic safety examinations. To conduct approval examinations of such sophisticated electronics, approval authorities usually test an equivalent circuit of the actual device. Such circuits are good representations of the device over some range of frequency, voltage, current, etc. However, the most desirable test would be one that supplies information on the unaltered circuit under consideration while providing a safety factor equivalent to that provided by conventional testing.
If safety factors are to be provided by some method other than increased current or voltage during testing, the behavior of the technique used to produce the safety factor must be thoroughly examined. Traditionally, the safety factor applied to MSHA intrinsic safety examinations has been 1.5 times rated energy at the point of test under the worst case, two-fault conditions. In other countries, the factor of 1.5 may be applied to voltage or current, not energy. The factor of 1.5 times has historically been used and has proven itself in practice to be adequate over the last 30 yr.
Safety factors could be produced in several ways aside from increasing the current or voltage. Zborovszky (1)2 reported that inconsistent resultS were achieved by attempting to use oxygenenriched mixtures to provide safety factors. The author concluded that ..... oxygen enrichment is too complicated and
2Underlined numbers in parentheses refer to items in the list of references at the end of this report.

inaccurate ..... The same report further concluded that increasing pressure during testing would provide a safety factor, but that this method suffers from increased experimental complexity, and pressure increases provide a safety factor that varies with circuit configuration.
In 1983, MSHA proposed to rewrite its intrinsic safety regulations in order to bring them up to the current state of the art and to incorporate several recent changes in MSHA policy regarding environmental monitoring systems. In support of this rewrite, MSHA requested that the Bureau of Mines investigate alternate ways of applying safety factors to modern electronic circuits in lieu of increasing current or voltage at the point of test. In response to that request, the Bureau tested spark ignition of methane-air,
3
propane-air, and ethylene-air mixtures over a range of voltages and currents, to determine the safety factors associated with using more explosive gases in testing. Despite the widespread use of national and international standards for intrinsic safety, safety factors related to the spark ignition characteristics of the common test gases are uncertain. The purposes of the Bureau experiment were
1. To determine a statistical basis for the published spark ignition curves by conducting a large number of tests for resistive, inductive, and capacitive circuits in methane, propane, and ethylene;
2. To examine the relationship between the published spark ignition data and the curves derived from the experimental data;
3. To attempt to arrive at a good operational definition of "safety factor."
TEST PROCEDURES
STATISTICAL PROCEDURE
To present statistical data on spark ignition characteristics, a statistical method is needed that allows the gathering of a maximum amount of information with a minimum number of lexperiments. Such a method was developed at Princeton University (2) and refined by others (3-4). The method developed has become known within the Bureau as the Bruceton Up-Down Method for its subsequent use in the classification of explosives at the Bureau's Pittsburgh Research Center, at Bruceton, PA.
The Bruceton Up-Down Method is useful for dealing with quantities that are continuous but cannot be measured in a continuous fashion. An example is in testing the response of explosives to mechanical shock. In this type of test, a weight is dropped from a given height onto an explosive sample, and the mechanical energy released on impact with the sample mayor may not ignite it. In either case, a new sample is used for each test. The weight is dropped from a new height, either higher or lower, depending upon the outcome of the previous experiment.
The testing height is clearly a continuous variable, but the test can be conducted only once on each sample. However, one may conclude with a certain degree of confidence based on the number of experiments that the critical height (the height that causes an explosion) is more or lesss than the height chosen for a particular test drop.
In testing the ignition of explosive gases, a similar situation exists. The gas mixture is closely controlled to its most explosive level, and the electrical test circuit is driven at a constant voltage or current. During a test, the gas mixture is constantly renewed. The ignition or nonignition of a gas mixture at a given voltage or current is dependent on mnay factors, such as electrode condition and material, ambient temperature, pressure, humidity, etc. If an ignition occurs at a specific voltage or current, a repeat test at the same value may not give ignition. The best that can be done in the case of explosive gas mixtures is to estimate a mean, a standard deviation, and confidence limits on the mean.

l'
:'.1;" P'
4
To apply the Bruceton Up-Down Method to spark ignition testing, the following procedure is used:
1. An appropriate test current (I) or voltage (V) is chosen for the first trial, based on the published spark ignition data.
2. An interval (d) between voltage or current test levels is estimated. This value should be approximately equal to the standard deviation. However, it is allowable for the interval to differ from the standard deviation by as much as 50%.
3. If an ignition occurs at the trial value (assume I in this example) then the next test will take place at I-d. If no ignition occurs, the next test will take place at I+d.
4. Each subsequent test will be run at a current level that is d units below the previous current if ignition occurs and d units above the previous current if ignition does not occur.
The procedure assumes that the shape of the distribution is approximately known. In this case, the current or voltage was assumed to be log normally distributed. When graphed on coordinates that are normally distributed along the X-axis, the plot of log current (or vqltage) v~rsus cumulative probability is 'approximately linear.
This statistical method has an important advantage over conventional methods. Since the Bruceton Up-Down Method tends to automatically concentrate testing about the mean, the number of experiments is greatly reduced. The one disadvan-
is that the test current (or voltage) must be changed based upon the outcome of the previous experiment. In practice this proved to be only a minor inconvenience.
In order to accurately estimate the statistics in any experiment, one must generate a sufficient number of measurements to ensure that the confidence interval is acceptably small. The literature (~) cautions against using sample sizes smaller than 50 and recommends 100 as an appropriate size for most experiments. In this experiment, the number of
trials to determine each mean was fixed at 100. Hence, about 50 experiments in any given series were ignitions and 50 were nonignitions. Since the distribution is approximately log normal, the mean and the median (50th percentile) have approximately the same value.
The mean may be estimated by the following equation:
where
and
x = c + d [ ~ t in i ± t J' ( 1)
X mean value of ignition current (or voltage),
c = log of lowest current (or voltage) level,
d log of increment between test levels,
i internal number beginning with c = 0,
nl number of ignitions or non-ignitions (whichever is fewest) occurring at the ith step,
N total number of ignitions or nonignitions (whichever is fewest).
The plus sign (+1/2) is used if the number of nonignitions is used and the minus sign if the number of ignitions is used.
The standard deviation is determined as follows. First calculate the intermediate variable, M:
I i 2 n i
M = _i-N-:--- (2)
The value of M is then used to find the value of the variable s, which is given graphically in reference 2 and may be approximated by the equation
s = (M + 0.04758)/0.62712, (3)

where s = correction factor for standard deviation for M > 0.4.
(For M < 0.4, consult reference 2 for the graphs.)
The sample standard deviation (S) may now be estimated as
S = (d)(s). (4)
The standard error of the mean (Sm) is estimated as
Sm == S(G)/(N)1/2, (5)
where G == a variable found graphically in reference 2 and estimated by the equation
G == -0.0 12793s 3 + 0.125471s 2
- 0.384361s + 1.288653. (6)
The percentile predictions and the confidence intervals may be calculated by standard statistical methods (5) once the mean, standard deviation, and standard error are known.
5
EXPERIMENTAL PROCEDURE
The experimental procedure used to estimate the statistical properties of the spark ignition curves centers around the standard procedures in UL 913. Each test was run with the most explosive gas-air mixture held within the limits specified by UL 913, as determined by on-line infrared analysis and occasional off-line chromatographic analysis. Four hundred revolutions of the International Electrochemical Commission (IEC) standard breakflash machine 3 (200 positive polarity and 200 reversed polarity) were run for each test. One hundred such tests were used as the basis for each graphical point, with the test current or voltage adjusted up or down based upon the outcome of the previous experiment. If an ignition occurred during the 400 revolutions, the time to ignition was recorded for future statistical work and the number of sparks inferred. If no ignition occurred, the number of sparks was assumed to be 1,600. The test was arranged so that about 50 ignitions and 50 nonignitions occurred in each set of 100 trials.
DISCUSSION OF RESULTS
RESISTIVE CIRCUITS
Figure 1 and table 1 show the data collected for resistive circuits in 8.3% methane-air, 5.3% propane-air, and 7.8% ethylene-air mixtures. The mean ignition currents are shown for voltages between 16 and 50 V dc since that is the range of greatest interest for mine environmental monitoring systems and other typical mine electronic systems. At voltages much less than 16 V dc in resistive circuits, the upper range of currents can easily exceed 4,000 rnA, which may cause problems with hot-wire ignition in the standard breakflash machine.
Figure 2A shows the mean values for resistive circuits in 8.3% methane-air and
3AS described in IEe standard 79-3.
TABLE 1. - Data for resistive circuits
Voltage, V dc
20 •••.•• 30 ••••.• 40 •.•... 50 ••••••
20 •••••• 30 •••••. 40 ..•••• 50 ••••••
16.111 •••• 20 •••••• 30 •••••• 40 ....... 50 ••••••
Mean, rnA
3,130 792 410 274
2,633 551 277 182
3,548 1,182
341 208 153
99% confidence interval, rnA
Lower limit I Upper limit METHANE
2,934 767 386 158
PROPANE 2,415
534 264 172
ETHYLENE 3,273 1,095
325 202 146
3,738 819 436 476
2,871 568 290 193
3,847 1,276
359 215 161

"
"
6
<t E .,: z w a::: a::: :::::> u
10,000 r----.,--r--.---.--.,...-,-,-,-,
1,000
KEY • Methane • Propane A Ethylene
100 L--__ I..----L._I..-L-..I........I-L..I....I
10 20 40 60 80 100 V de
FIGURE 1.-Mean Ignition current for resistance In 8.3% methane-air 5.3% propane'air, and 7.8% ethylene-air atmospheres.
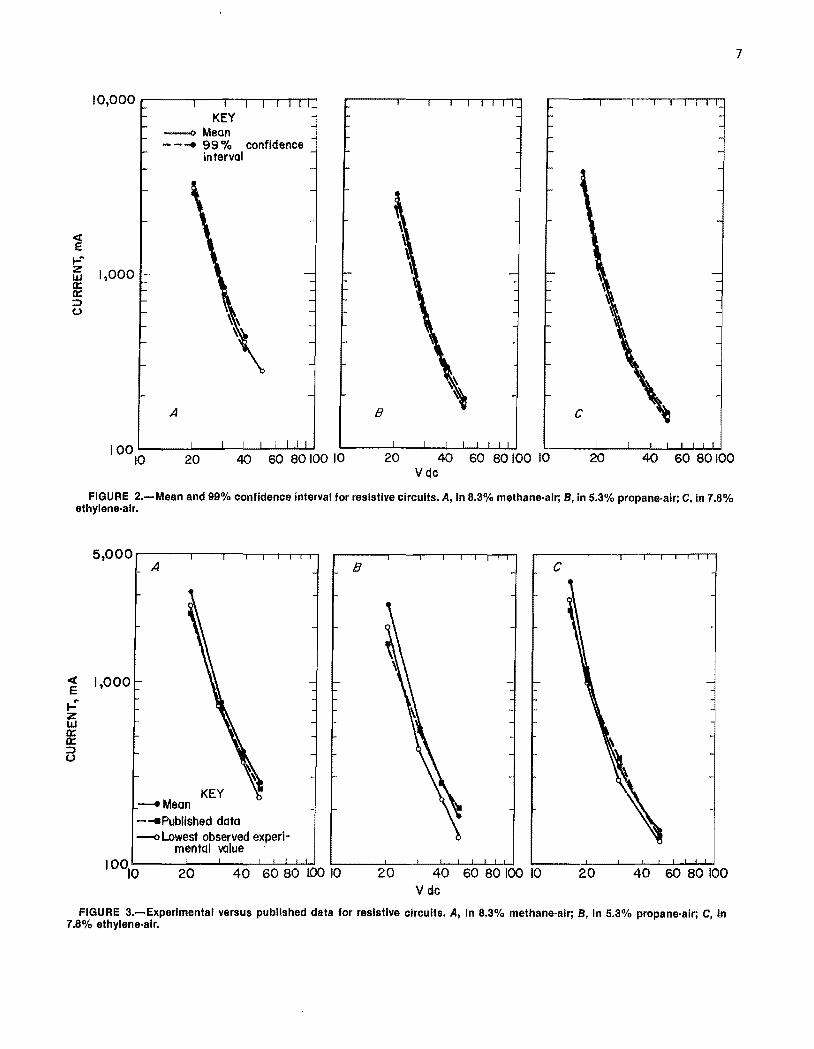
their 99% confidence intervals. Figures 2B and 2C show mean value and 99% confidence interval data for circuits in propane-air and ethylene-air mixtures, respectively. The data for ethylene-air are complete down to 16 V dc because of ethylene's characteristically lower ignition level, whereas the data for propaneair and methane-air are complete only to 20 V de. The 99% confidence intervals are "well behaved" (confined to an acceptably narrow region) about the means because of the relatively large body of data collected.
Figure 3A shows the relationship of the mean ignition currents in 8.3% methane-air and the curve as published
in UL 913. As can be seen, the data exceed the published curve by about 30% at 20 V dc, 10% at 30 V dc, 11% at 40 V dc, and 7% at 50 V de. In fact, the published curve falls below the lowest observed ignition point at 20 V de. The lowest data point at 50 V dc is about 25 rnA below the published curve. Figure 3R shows the mean data for 5.3% propane-air mixtures, the published curve for propane, and the lowest observed data values. The lowest observed points fall below the published curve from 50 V dc to about 25 V dc, where the published data become lower. .A similar situation occurs for 7.8% ethylene-air mixtures, shown in figure 3C.
The current at any percentile can be predicted using the mean and standard deviation calculated from the data. Figure 4 shows the mean value and the 10th and 90th percentile predictions for methaneair mixtures, as well as the range of the experimental data. The range of the data rarely exceeded the predicted 10th or 90th percentiles. In general, this situation held true for resistive circuits in all three gases. Considering that over 1,300 trials were run for resistive circuits alone, this is a glaring statistical anomaly. However, the Bruceton Up-Down Method is optimized to collect data about the mean and is, therefore, not a random sampling technique. Unless the distribution is very well behaved, small errors in the estimated standard deviation can give erroneous results when trying to predict extreme values, because very few data were actually collected in the extremes of the distribution. This situation will be corrected in work planned for the near future.
INDUCTIVE CIRCUITS
Figure 5 and table 2 show the data for inductive circuits at 24 V dc in 8.3% methane-air, 5.3% propane-air and 7.8% ethylene-air mixtures. The range of inductance values tested was from 500 ~H to 600 mHo In figure 6A, the mean ignition
~ t-!' ffi 1,000 a:: a:: ;::) o
KEY ---0 Mean --.... 99% confidence
interval
A
100~--~--~~~~~ 10 20 40 60 80 100 10
B
20 40 60 80 100 10 Vdc
FIGURE 2.-Mean and 99% confidence interval for resistive circuits. A, In 8.3% methane-air; S, in 5.3% propane·alr; C, in 7.8% ethylene-air.
5,000 ...----..,.--...---.---.----r-,..,.....,....,
~ 1,000
.: ~ ~ ;::) o
A
KEY -Mean - ... Publlshed data --0 Lowest observed experl~
mental value .
10010 20 40 60 80 lOO 10
B
20 40 60 80 100 10 Vdc
c
20 40 60 80100
FIGURE 3.-Experimental versus published data for resistive circuits. A, In 8.3% methane-air; S, in 5.3% propane-air; C, In 7.8% ethylene-air.
7

8
~ 1,000
t-'" z LLI a:: a:: ::> u
KEY ___�� Mean -1-'" 10th-90th percentile
Range of data
10010 20 40 60 80 100
V de FIGURE 4.-Range of data for resistance in 8.3% methane·
air.
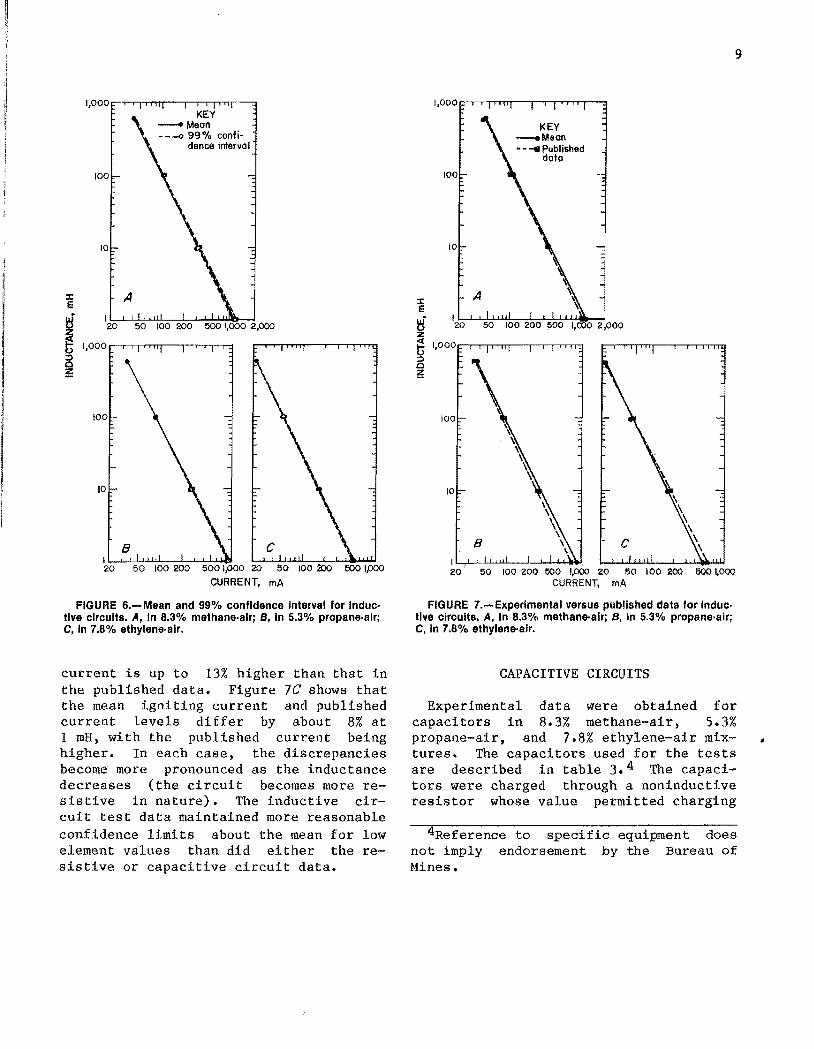
current for methane-air and its 99% confidence int.erval are shown plotted against inductance. The function is well behaved, and the confidence interval is very narrow. Likewise, figures 6B and 6C show very well behaved means and confidence limits for 5.3% propane-air and 7.8% ethylene-air, respectively. In each gas, tests at the 600-mH data point (100 trials) were repeated at 12 V dc to examine the effect of driving voltage on the mean ignition current. The mean ignition current was virtually identical at both 24 V dc and 12 V dc in all three gases.
Figures 7A, 7B, and 7C show the experimental and UL 913 ignition data for methane-air, propane-air, and ethyleneair, respectively. Figure 7A shows a close correlation between the published and empirical data in 8.3% methane-air. In figure 7B, however, the mean igniting
100 :I: E
W (.)
z f! (.) ::> 0 ~ 10
vE7]J V=24Vdc -i
KEY • Methane • Propane .. Ethylene
10,000
FIGURE 5.-Mean ignition current for inductance in 8.3% methane·air, 5.3% propane·alr, and 7.8% ethylene-air at· mospheres at 24 V dc.
TABLE 2. - Data for inductive circuits (24 V dc)
Inductance,
mH
600 ••••• 600 1 •••• 100 ••••• 10 •••••• 1 ••••••• 0.5 •••••
600 ••••• 600 1 •••• 100 ••••• 10 •••••• 1 ••••••• 0.5 •••••
600 ••••• 600 1 •••• 100 ••••• 10 •••••• 1 ••••• " •• 0.5 •••••
Mean, 99% confidence rnA interval, rnA
Lower limitlUpper limit METHANE
42 41.7 43.3 43 42.3 43.5
122 110 115 318 314 322
1,092 1,074 1,111 1,314 1,260 1,371
PROPANE 35 34 36 36 35 37 89 81 98
276 269 284 905 881 929
1,196 1,095 1,307 ETHYLENE
22.3 21.8 22.6 22.5 22.2 23.0 53 52 54
167 165 170 511 501 521 599 569 631
ITests run at 12 V dc.
100
10
::t: e ~ I
20
~ 1,000 :::> Q
!:
100
A
KEY -Mean ---099% confi-
dence interval
FIGURE 5.-Mean and 99% confidence interval for inductive circuits. A, In 8.3% methane-air; B, in 5.3% propane·alr; C, in 7.8% ethylene·air.
current is up to 13% higher than that in the published data. Figure 7C shows that the mean igniting current and published current levels differ by about 8% at 1 mH, with the published current being higher. In each case, the discrepancies become more pronounced as the inductance decreases (the circuit becomes more resistive in nature). The inductive circuit test data maintained more reasonable confidence limits about the mean for low element values than did either the resistive or capacitive circuit data.
::t: e ui (.) z
e ::> Q ~
10
I 20
I .
A
B
KEY _Meon - - .... Published
data
9
20· 50 100200 500 1,000 20 50 100 200 500 1,000 CURRENT, rnA
FIGURE 7.-Experimental versus published data for Indue· tlve circuits. A, In 8.3% methane-air; B, In 5.3% propane·air; C, in 7.8% ethylene·air. .
CAPACITIVE CIRCUITS
Experimental data were obtained for capacitors in 8.3% methane-air, 5.3% propane-air, and 7.8% ethylene-air mixtures. The capacitors used for the tests are described in table 3. 4 The capacitors were charged through a noninductive resistor whose value permitted charging
4Reference to specific equipment does not imply endorsement by the Bureau of Mines.
..

10
for approximately five time constants between discharges. The breakflash machine was run for 1,600 revolutions at 80 rpm for each test, owing to the use of only a single tungsten electrode. Polarity was reversed at 800 revolutions.
The total discharge time for the test circuit through the breakflash contacts is also shown in table 3. This time was measured using a storage oscilloscope in parallel with the capacitor under test.
The energy contribution from the power supply (p, in watts) during the discharge time (t, in seconds) can be estimated by assuming a rectangular discharge pulse at the mean ignition voltage for the duration of the discharge as
where E
v
and R
E = Pt V 2 t = --, R
total energy contribution from power supply, Jj
(7)
mean ignition voltage, V dc;
current-limiting resistance value (from table 3), ohms.
This relation yields the results shown in table 4. Thus, in all cases, the energy contributed by the power supply (v 2t/R) during the capacitor discharge period is less than 1% of the mean stored energy required for ignition (1/2 CV 2).
Figure 8 shows the mean ignition voltage curves obtained in 8.3% methane-air, 5.3% propane-air, and 7.8% ethylene-air mixtures. It is interesting to note in figure 8 that there is little difference in the test data for 8.3% methane-air and 5.3% propane-air mixtures above 10.3 UFo In fact, the mean ignition vol tend to converge as the value of capacitance exceeds 100 UFo Table 5 shows that the statistical confidence of the mean tion voltage is very good for capacitance values of 10.3 UF and above. The mean ignition voltage for a capacitance value of 1.2 uF is unreliable since its confidence limits are very large. The 99% confidence limit about the mean for each test gas is shown if figure 9.
Figure 10 compares the UL 913 spark ignition curve and test data for 8.3% methane-air mixtures. The published
TABLE 3. - Capacitor test circuit characteristics
Capacitor Capaci- I Voltage, Time con- Resistor, Discharge tanc V dc stant, us kohm time,l us
Mallory: TC56 •••••••• 1.2 250 0.104 87.0 0.7 TC50100 ••••• 1,330 50 .100 .075 500
Sprague: TEI407 •••••• 10.3 100 .103 10.0 3.5 TE1211 •••••• 106 25 .106 1.0 200
IMeasured from test circuits.
TABLE 4. - Ignition energy contribution from power supply (v 2t/R) versus ignition energy (1/2 CV2)
(Methane-air mixture)
Capacitance •••••••••••••••• UF •• 1.2 10.3 106 1,330 Voltage •••••••••••••••••• V de •• 124 36.8 19.9 12.9 Time constant •••••••••••••• us •• 0.7 3.5 200 500 Resistor ••••••••••••••••• kohm •• 87.0 10 1 0.075 Energy (V2 t /R) ••••••••••••• )JJ •• 12.4 47 79 1,100 Energy 0/2 CV 2 ) ••••••••••• mJ •• 9.2 7.2 21 111

.. w u z j:! U ct. () 100
10
KEY ----- Methane ---II Propane ._._ .... Ethylene
FIGURE 8.-Mean ignition voltage for capacitance in 8.3% methane'air, 5.3% propane·alr, and 7.8% ethylene'alr at· mospheres.
~I.OOO eJ z g <.)
a: <3
A
IOLi ---'--)ll.J...J-WI'='OO 10
V de
FIGURE 9.-Mean and 99% confidence Interval for capacitive circuits. A, In 8.3% methane'air; S, in 5.3% propane·alr; C, in 7.8% ethylene·air.
1,000
100
10
KEY -Mean - - -- Published data - ._ .... Lowest observed
11
experimental value
100 V de
1,000
FIGURE 10.-Capacltance in 8.3% methane·alr-experi· mental versus published data.
curve more closely approximates the lowest observed ignition values than the mean. Once again, the empirical values below 10.3 ~F lack sufficient statistical confidence from which to draw any firm conclusions.
The mean and lowest observed ignition energies for capacitive spark ignition are tabulated in table 6. As can be seen, the process of capacitor spark ignition in the lEe break£lash is relatively inefficient compared with the minimum ignition energies for methane, propane, or ethylene from the literature (6). It should be reemphasized here that this experiment was not optimized to find the minimum ignition energies but to

"I
12
determine the spark ignition
mean value. The energies found
minimum in the
literature are significantly lower than the lowest observed values cited here.
SAFETY FACTOR DETERMINATION
In the United States, the generally accepted concept for applying safety factors to .intrinsically safe circuits is to increase the energy at the point of test by a factor of 1.5 over the conditions of use. This level of safety factor has been shown through long experience to provide a satisfactory margin of error against variations in test conditions, part tolerances, etc. The mean value of the ignition variable is used for each circuit element to calculate a relative safety factor when testing in a more easily ignited test gas.
For a resistive circuit, the energy may be defined as
(8)
where ER = mean ignition energy, J;
V = mean ignition voltage, V dc;
I = mean ignition current, A' ,
and t = discharge time of the test circuit through the IEC breakflash contacts, s.
TABLE 5. - Data for capacitive circuits
Capaci- Mean, 99% confidence interval, itance, V dc V dc
lJF Lower limi t I Upper limit METHANE
1.2 .••.• 124 NA NA 10.3 •••• 36.8 33.4 40.5 106 ••••• 19.9 19.1 20.7 1,330 ••• 12.9 12.9 13.0
PROPANE 1.2 ••••. 161 NA NA 10.3 •••• 35.3 32.4 38.4 106 ••••• 17.7 17.1 18.5 1,330 ••• 13.0 12.8 13.2
ETHYLENE 1.2 ••••• 138 NA NA 10.3 •••• 25.1 23.0 27.3 106 ••••• 14.8 14.4 15.3 1,330 ••• 1l.7 11.6 11.8 NA Not available.
The average resistive discharge time was measured as approximately 5 vs, independent of the driving voltage and gas mixture. To compare methane and propane ignitions at a given mean current,
where ERM = mean ignition energy for methane, J;
ERX = mean ignition energy for comparison gas, J. ,
Vx = Vm == comparison voltage, V dc;
1m mean ignition current for methane, A' ,
Ix = mean ignition current for comparison gas, A;
and t = discharge time, s.
Since the pared at a discharge
mean currents are being comconstant voltage and constant
time,
I (10) safety factor =
Ix
Therefore, the safety factor for resistive circuits is the ratio of the mean currents along lines of constant voltage;
TABLE 6. - Ignition energy (1/2 CV2)
Capacitance •••••• vF •• 1.2 10.3 106 1,330 Mean ignition energy;
mJ: Methane •••••••••••• 9.2 7.2 21 111 Propane •••••••••••• 15.5 6.4 17 112 Ethylene ••••••••••• 11 3.2 12 91
Lowest observed igni-tion energy, mJ: Methane •••••••••••• 5;6 4.1 18 102 Propane •••••••••••• '7.4 4.5 15 102 Ethylene ••••••••••• 5.6 2.3 10 87
13
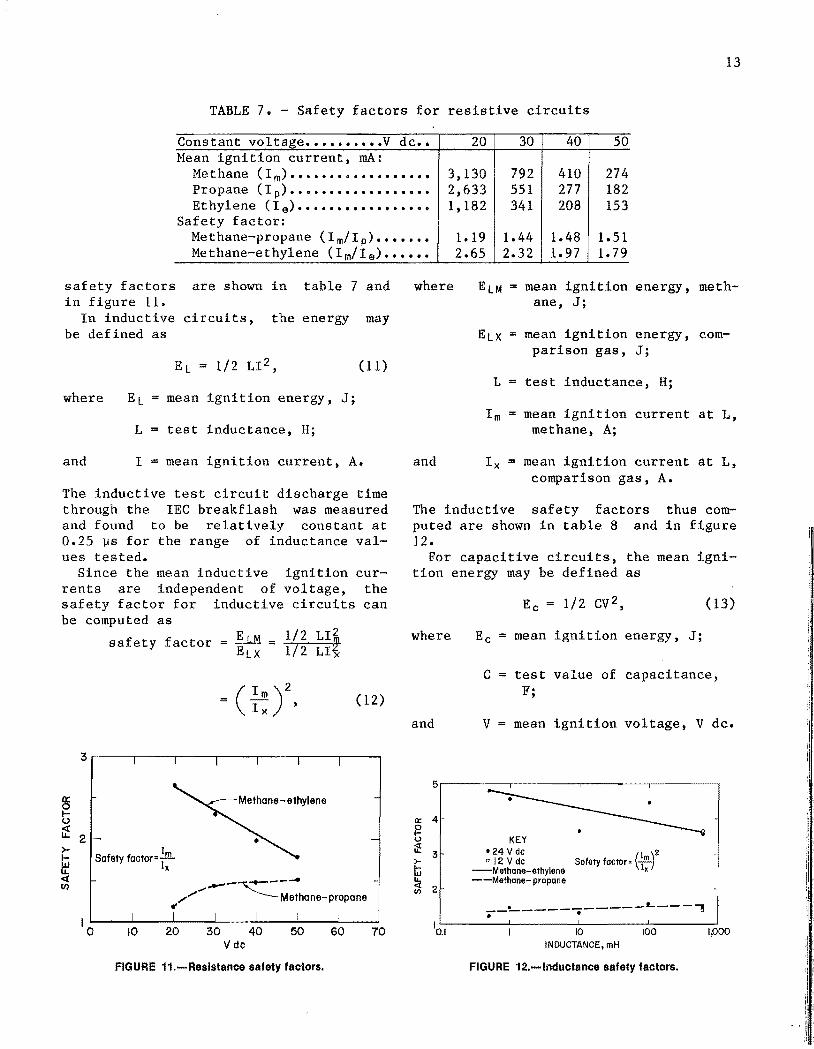
TABLE 7. - Safety factors for resistive circuits
Constant voltage •••••••••• V de •• 20 30 40 50 Mean ignition current, rnA:
Methane (1 m) •••••••••••••••••• 3,130 792 410 274 Propane (I p) •••••••••••••••••• 2,633 551 277 182 Ethylene (Ie) ••••••••••••••••• 1,182 341 208 153
Safety factor: Methane-propane (Im/lp) ••••••• 1.19 1.44 1.48 1.51 Methane-ethylene (1m/Ie) •••••• 2.65 2.32 1.97 1.79
safety factors are shown in table 7 and in figure 11.
In inductive circuits, the energy may be defined as
EL == 1/2 LI2, ( 11)
where EL mean ignition energy, J;
L test inductance, H;
and I mean ignition current, A.
The inductive test circuit discharge time through the IEC breakflash was measured and found to be relatively constant at 0.25 ~s for the range of inductance values tested.
Since the mean inductive ignition currents are independent of voltage, the safety factor for inductive circuits can be computed as
0:: o Io ~ >-
~ « (J)
safety factor - !LM _ 1/2 Llj - ELX - 1/2 LI:
3r----.----.----.-----r----.----.--~
2 I
Safety faetor= I;
--~--."-",,, Methane-propane .. 10 20 30 40
V de 50
FIGURE 11.-Reslstance safety factors.
60 70
where
L
1m
and Ix
mean ignition energy, methane, J;
mean ignition energy, comparison gas, J;
test inductance, H;
mean ignition current at L, methane, A;
mean ignition current at L, comparison gas, A.
The inductive safety factors thus computed are shown in table 8 and in figure 12.
For capacitive circuits, the mean igni-tion energy may be defined as
Ec = 1/2 CV2, (13)
where Ec == mean ignition energy , J;
C test value of capacitance, F' ,
and V mean ignition voltage, V de.
5r--------,--------r--------,--------.
KEY .24 V de 2 o I 2 V de Safety factor = (~mK )
-Methane-ethylene --Methane- propane
__ ~ ____ • ___ --L---e •
10•1 10 100 IPOO
INDUCTANCE, mH
FIGURE 12.-lnductance safety factors.

14
TABLE 8. - Safety factors for inductive circuits at 24 V dc
Inductance ••••••••••••••••••• mH •• 0.5 1 10 100 600 1600 Mean ignition current, rnA:
Methane (1 m) ••••••••••••••••••• 1,314 1,092 318 112 42 43 Propane (I p) ••••••••••••••••••• 1,196 905 276 89 35 36 Ethylene (Ie) •••••••••••••••••• 599 511 167 53 22.3 22.5
Safety factor: Methane-propane (Im/lp)2 ••••••• 1.21 1.46 1.33 1.58 1.44 1.43 Methane-ethylene (Im/IA)2 •••••• 4.81 4.57 3.62 4.47 3.55 3.65
ITested at 12 V dc.
TABLE 9. - Safety factors for capacitive circuits
Capacitance ••••••••••••••••••• ~F •• 1.2 10.3 106 1,300 Mean ignition voltage, V dc:
Methane (V m) •••••••••••••••••••• 124 36.8 19.9 12.9 Propane (V p) •••••••••••••••••••• 161 35.3 17.7 l3 .0 Ethylene (V e) ••••••••••••••••••• 138 25.1 14.8 11.7
Safety factor: Methane-propane (Vm/Vp)2 •••••••• 10.59 1.09 1.26 0.98 Me thane-ethylene (V m/V e) 2 ••••••• 10.81 2.15 1.81 1. 22
IBased on mean voltages of low statistical confidence.
The safety factor of a capacitive test circuit can be computed as
safety factor = (~:) 2 (15)
safety factor Ecm 1/2 CV~ Ecx = 1/2 CVr
(14)
where
and
The becomes
Ecm mean ignition energy, methane, J;
Ecx mean ignition energy, comparison gas, J;
C test capacitance, F;
Vm mean ignition voltage, methane, V dc;
mean ignition voltage, comparison gas, V dc.
capacitive safety factor thus
and is shown in table 9 and figure 13.
3.-------,--------,-------,,-------,
Safety factor = ( ~~ t a:: 2
t Lt >-[;j LL
~ I -----. ------
KEY --Methane-ethylene -- - Methane-propane
10,000 CAPACITANCE, JLF
FIGURE 13.-Capacitance safety factors.
15
CONCLUSIONS
To facilitate estimating the safety factors provided by testing with more easily ignited gases rather than higher currents or voltages, the Bureau experimentally established spark curves that yield a 50% probability of ignition during a standard intrinsic safety test in the IEC breakflash apparatus. Propaneair, ethylene-air, and methane-air mixtures were tested over a range of voltages and currents, to establish safety factors for testing intrinsically safe equipment.
However, the safety' factor provided by testing in a more explosive gas is not constant with voltage or current. For example, the safety factor for ignition in methane-air versus propane-air in a resistive circuit increases from 1.19 to 1.51 between 20 and 50 V dc while the safety factor for ignition in methane-air versus ethylene-air decreases from 2.65 to 1.79 over the same range. The safety
factors obtained for inductive and capacitive circuits show similar trends. Applying safety factors through the use of alternate test gases is not a straightforward procedure and, therefore, is not recommended.
The statistical basis for the curves published in UL 913 has been clarified somewhat by this study, in that the relationship of curves to the mean values of the ignition variable has been quantified. Minimum ignition currents (or voltages) cited in other literature are substantially lower than results presented here, which are the mean values of ignition currents or voltages* The differences between the mean and minimum ignition values are especially large in the capacitor data where the voltages are highly variable at a capacitance of 1.2 ~F. In data having a small standard deviation, the mean and minimum ignition values are rather close.
REFERENCES
1. Zborovszky, Z. Intrinsically Safe Supporting Research (contract J0177111, Denver Res. Inst., Univ. Denver). BuMines OFR 7-81, 1980, 146 ppo; NTIS PB 81-179384.
2. Princeton University, Statistical Research Group. Statistical Analysis for a New Procedure in Sensitivity Experiments. July 1944, 58 pp.
3. Dixon, W. J., and A. M. Mood. A Method for Obtaining and Analyzing Sensitivity Data. J. Am. Stat. Assoc., v. 43, 1948, pp. 109-126.
it u.s. GOVERNMENT PRINTING OFFICE: 1900-605·017/40,081
4. Brownlee, K. A., J. L. Hodges, Jr., and M. Rosenblatt. The Up-and-Down Method With Small Samples. J. Am. Stat. Assoc., v. 48, 1953, pp. 262-277.
5. Kreyszig, E. Advanced Engineering Mathematics. Wiley, 2d ed., 1967, pp. 732-840.
6. Lewis, B., and G. von Elbe. Combustion, Flames and Explosion of Gases. Academic, 2d ed., 1961, p. 341.
I NT .-BU J)F MI NES ,PGH .,PA • 28355