Embed Size (px)
Citation preview
A proposed classification of invasive alien plantspecies in South Africa: towards prioritizing speciesand areas for management action
J.L. Nel , D.M. Richardson , M. Rouget , T.N. Mgidi , N. Mdzeke , D.C. Le Maitre , B.W. van Wilgen ,L.Schonegevel , L. Henderson and S. Neser
IntroductionSouth Africa’s natural ecosystems, like those in most parts of
the world, are under threat from invasive alien plants.1,2 Thescale of the problem facing managers of invasive alien plants inSouth Africa is huge; about 10 million ha has been invaded tosome extent.3 Many invaders are already well-established, whilescores of others are at early stages of invasion. Several are recentintroductions, and/or have only recently entered a phase ofrapid population growth. Problems associated with plantinvasions are escalating rapidly. Limited resources dictate thatchoices must be made about where to focus control efforts, andwhich species to select for control. This paper presents a protocolfor the objective derivation of lists of major and emerginginvaders, and of several categories within these main groups.Classification of invaders to this end is needed to inform strategicplanning at national and regional scales.
Several attempts have been made to prioritize alien speciesbased on their invasive potential in different parts of the world.Most attention has been given to screening species for theirinvasive potential before their introduction to a given region.4–8
Less systematic attention has been directed at classifyinginvasive alien species already in a region to help formulateregional or national plans for managing invasions. Where thishas been undertaken, studies generally apply expert knowledgeto score criteria such as impact and invasiveness of species.9,10 Forexample, a process for determining and ranking ‘Weeds ofNational Significance’ was developed for Australia11 based on ex-pert scoring of four criteria: invasiveness, impacts, potential forspread, and socio-economic and environmental values. The toptwenty species thus ranked were selected to serve as a test case forimproved coordination amongst affected parties in Australia. Asimilar study in South Africa12 sought to prioritize invasive alienspecies based on their potential invasiveness, spatial characteris-tics, potential impacts, and conflicts of interest. Species werethen ranked by summed scores of expert ratings to provide ameans of prioritizing species for national action.
There are, however, several limitations with such rankingexercises. First, there is no objective criterion that determineswhen a score is sufficient to qualify a species for high-prioritymanagement action. Comparisons are also difficult betweenspecies that occur over a wide range of different habitats, withvarying levels of abundance and impacts. For example, Robertson’spaper12 reported difficulty in ranking priority for species requir-ing management at the local scale against more widespreadspecies (perhaps much less abundant) requiring control effortover large areas. Thorp and Lynch11 suggested that, for mostspecies, rankings in such exercises should be seen as approxi-mate rather than absolute, and that it may be more appropriateto view groups of invasive alien species with some degree ofsimilarity as ‘clusters’. This study attempts to provide a meansfor ‘clustering’ invasive alien species in a way that takes accountof current distribution patterns (range and abundance) forestablished invaders, and best estimates on potential range(based on current propagule availability and invasible habitat)for emerging invaders.
An opportunity to define more meaningful clusters ofcurrently invasive alien species than has been done to date isprovided by the Southern African Plant Invaders Atlas (SAPIA).The SAPIA database contains records for over 500 species ofinvasive alien plants in South Africa, Lesotho and Swaziland,with information on their distribution, abundance and habitattypes.13 In the study reported here, we present two lists of inva-sive alien plants, classified to group species based on similaritiesin their distribution, abundance and/or biological traits. The firstlist contains those species that have already had a substantialimpact on natural and semi-natural ecosystems of South Africa.Impact is defined as the product of a species’ range, abundance
Working for Water South African Journal of Science 100, January/February 2004 53
aCSIR Division of Water, Environment and Forestry Technology, P.O. Box 320,Stellenbosch 7599, South Africa.bInstitute for Plant Conservation, Botany Department, University of Cape Town, PrivateBag, Rondebosch 7701, South Africa.cAgricultural Research Council, Plant Protection Research Institute, stationed at NationalBotanical Institute, Private Bag X101, Pretoria 0001, South Africa.dAgricultural Research Council, Plant Protection Research Institute, Private Bag X134,Queenswood 0121, South Africa.*Author for correspondence. E-mail: [email protected]
Many invasive alien plant species in South Africa are alreadywell-established and cause substantial damage, while scores ofothers are at the early stages of invasion (only recently introducedand/or entering a phase of rapid population growth). Managementprogrammes must target well-established invaders, but must alsogive appropriate attention to emerging problems. Protocols forobjectively prioritizing species in the two groups for managementaction are lacking. To this end, we describe the objective derivationof two lists of invasive alien plants in South Africa, using availablequantitative data and expert knowledge on current patterns ofdistribution and abundance, life-history traits, and (for emerginginvaders) estimates of potential habitat. ‘Major invaders’ are thoseinvasive alien species that are well-established, and which alreadyhave a substantial impact on natural and semi-natural ecosystems.‘Emerging invaders’ currently have less influence, but haveattributes and potentially suitable habitat that could result inincreased range and consequences in the next few decades. Wedescribe the derivation of lists that contain 117 major invaders(categorized into groups based on geographical range and abun-dance) and 84 emerging invaders (categorized into groups basedon current propagule-pool size and potentially invasible habitat).The main lists, and groupings within them, provide a useful meansfor prioritizing species for a range of management interventions atnational, regional and local scales.

and per capita effect.14,15 Thus a species having a high value forany one of these three components will have a high impact, andspecies with high values for all three components have the highestimpact. These species (hereafter termed ‘major invaders’) arelikely to constitute the prime concern for managers, and projectsaimed at their control should receive the largest proportion ofavailable funding over the next few decades.
The second list contains those species that currently have alower impact on natural or semi-natural ecosystems in SouthAfrica (that is, a lower product of range, abundance and effect),but which appear to have the capacity to exercise greater influencein the future (based on an assessment of life-history attributesand potentially invasible habitat). These species (hereaftertermed ‘emerging invaders’) are currently afforded lowerpriority in management. Some of these are likely to becomemore important in the future, and could become targets forpre-emptive action (such as biocontrol16); these species shouldbe carefully monitored to ensure that they do not become majorproblems. Ultimately, we hope to use the lists to help select speciesfor modelling their rates of spread, to determine where to focusmanagement action in the future, and to facilitate improvedscenario development for managing biological invasions.17
Methods
Database of invasive alien plants in South AfricaWe compiled a database of invasive alien plants that have
already been introduced to South Africa (for the purposes of thisstudy, we have also included Lesotho and Swaziland). Whilerecognizing that other alien plant species present in South Africamay begin to spread, or that new, highly invasive species mayyet be introduced to the country, the species in this database arelikely to account for the bulk of expenditure on managementover the next few decades.
We used data from the SAPIA database as the primary sourceof information. This atlas comprises nearly 50 000 invasive alienplant records, incorporating records from roadside surveysconducted by Lesley Henderson (1979–1993) and the SAPIAproject (1994–1998), as well records collected on an ad hoc basisfrom 1999 onwards.13,18–20
In instances where there is taxonomic uncertainty within agenus or identification of species is problematic in the field, thefield sheets submitted for inclusion in the SAPIA database didnot identify single species. In these instances, there may berecords for individual species, records which simply name thegenus, or records with the names of two close relatives withinthe genus. For the purposes of compiling our initial database,these species and species-groups were combined, except for therecords for eucalypts and pines, which we treated separately(we decided not to combine the records for these species andspecies-groups because of the different effects and ranges of theindividual species). This yielded a total of 552 taxa (species orspecies-groups) from the SAPIA database. We used informationin the SAPIA database on spatial locality, which is provided forall records at the level of quarter-degree squares (15’ latitude ×15’ longitude, hereafter called grid-cells). We also used informa-tion on habitat and abundance. The 18 different habitat classes inthe SAPIA database were grouped to identify riparian, land-scape and human-modified habitats (see below), and the abun-dance classes were used to help classify major invaders.
A further 29 plant species found in the country were added toour database, based on published literature21,22 and a consensusamongst alien-plant experts that these species have the potentialof invading natural ecosystems in South Africa. No detailedinformation on distribution and abundance was available for
these species in South Africa, partly because some are at an earlystage of invasion.
The database was reviewed by a team of seven alien-plantspecialists, whose knowledge covered all major biome types,and represented approximately 175 years of collective relevantexperience (ranging between 15 and 35 years per expert).These specialists also reviewed the lists of major and emerginginvaders (see below). During the review, two species wereadded to the database, and 12 species were removed because aconsensus was reached that either they were indigenous or thatthey did not yet occur in South Africa, Swaziland or Lesotho.This produced a final database of 571 species and species-groups, from which we identified major invaders and emerginginvaders (Fig. 1).
Classification of major invadersA preliminary list of major invaders was constructed by
applying three filtering criteria to the SAPIA database: (i) thenumber of records, (ii) the type of habitat invaded, and (iii) theabundance and range of each species. First, we excluded anyspecies having fewer than five records in the SAPIA database.Although some of these species could potentially have a majorimpact, they were not considered as significant invaders owingto their current limited distribution. This filtering rule reducedthe original list from 571 species to 290 species (Fig. 1).
Next, we classified species as landscape invaders, riparian
54 South African Journal of Science 100, January/February 2004 Working for Water
Fig. 1. Schematic representation of the approach used for constructing lists ofmajor and emerging invaders in South Africa. Numbers in brackets are the numberof species, or species-groups, after various filters had been applied to thedatabase.

invaders, or invaders of both landscape and riparian habitat. Wedid this using the 18 habitat categories in the SAPIA database,13
which we grouped into riparian habitat (categories ‘Water-course’ and ‘Wetland’), and landscape habitat (all other catego-ries). A species was classified as a riparian invader or a landscapeinvader if more than 75% of its records fell into the respectivecategory. If neither the landscape nor riparian records exceeded75% then the species was classified as an invader of both land-scape and riparian habitats. We also distinguished specieslargely confined to human-modified habitat from those thatinvade natural and semi-natural habitats. Our interest in thisstudy was in species invading natural and semi-natural ecosys-tems, that is, those that are still reasonably intact, having most oftheir biodiversity structure and functioning, and with primarydriving forces operating within natural/evolutionary limits. Aspecies was classified as being largely confined to human-modified habitat if more than 75% of its records fell into thefollowing SAPIA database habitat categories: ‘Road/Railside’,‘Habitation’, ‘Plantation’, ‘Arable’, ‘Pastoral’, ‘Wasteland’, and‘Transformed’. Using these categories, we applied the secondfiltering rule and excluded non-riparian species confined tohuman-modified habitat (riparian species confined to disturbedareas were included, based on the rationale that riparian habitatsare naturally disturbed). This process reduced the list to 248species (Fig. 1).
We classified the remaining 248 species according to range andabundance, the cut-off values for each category being determinedusing cluster analysis (Table 1). We performed two separatecluster analyses. The first, based on the number of grid-cellswhere the species was recorded, was used to determine thethresholds for range categories (very widespread, widespread,and localized). The second, based on the percentage of grid-cellswhere the species was recorded as ‘abundant’ or ‘very abundant’in the SAPIA database, was used to determine the thresholds forabundance categories (abundant, common and scarce; seeTable 1). Where more than one record with the same species andabundance code occurred within a grid-cell, it was counted asone record. The rationale for this was to eliminate any potentialduplicate records for the same location. We excluded speciesfrom the range–abundance categories ‘localized–scarce’ and‘localized–common’. The list was thus reduced to 82 species,which we considered to be the preliminary list of major invad-ers, which was then submitted to expert review.
An expert workshop was held to review the range–abundancecategories assigned to each species, according to the SAPIAdatabase statistics. If there was general consensus amongstreviewers that some form of collection bias had resulted in aninaccurate classification, then species were moved to a moreappropriate range–abundance category. If reviewers were indoubt as to which category a species belonged, then the specieswas left where it was, as dictated by the SAPIA database statisticson range and abundance. In this way, the range and/or abundanceof 45 species in the ‘localized–scarce’ and ‘localized–common’categories were elevated (that is, species that were initially ex-
cluded as major invaders were placed back on the majorinvaders list). A further 10 species were removed from the majorinvaders list because they are largely confined to human-modified habitats (that is, where habitat data of the SAPIA data-base seemed biased). This produced a final major invaders list of117 species (Fig. 1).
Classification of emerging invadersTo construct the emerging invaders list, we first excluded all
major invaders (namely, the 117 species above) from our originaldatabase of alien invasive plants in South Africa. This reducedthe list to 454 species, which were then scored according to fourcriteria selected because of their strong association with factorsthat predict the potential invasiveness of plant species,23 and theavailability of quantitative data to support their subsequentscoring:• Impact: the invasive status (listed in Henderson’s guide to
declared weeds and invaders19) was used to score impact invarious categories24, where ‘Transformer’ = 10, ‘Potentialtransformer’ = 5, ‘Minor weed’/‘Special effect weed’/‘Poison-ous’/‘Irritant’ = 1. Expert ratings were used to score the speciesadded to the SAPIA database.
• Weediness: we used the global invasive status25 to score weedi-ness, based on the rationale that a plant showing signs ofweediness elsewhere in the world has a higher chance ofbecoming problematic in South Africa.23 Four of the 11categories in Randall’s compendium of weeds25 were used tocalculate a score for weediness, namely ‘Sleeper weed’,‘Noxious weed’, ‘Naturalized species’ and ‘Environmentalweed’. The weediness score for each species was calculated bysumming the number of times each species was listed withinthese four categories.
• Biocontrol: the status of species currently under biocontrolwas scored based on available information,26 and the potentialof species for biocontrol in the future was scored using outputsfrom a recent expert workshop on biological control in SouthAfrica. (Unpublished data from a workshop held in Thaba-meetse, South Africa, May 2002.) The categories26 and scoresthus derived were ‘Complete’ = 0 (species already undercomplete biocontrol are not likely to become a problem inthe future, and are therefore unlikely to become emerginginvaders), ‘Substantial’ = 1, ‘Highly suitable’ = 2; and ‘Negligi-ble’/ ‘Unknown’/not listed = 5.
• Weedy relatives: this score gave the number of weedy speciesin the same genus worldwide,25 expressed as a percentage ofthe total number of species per genus.27 A recognized problemwith this score is that the compendium of weeds25 includesspecies that are introduced but not naturalized, and cultivated.To be accurate, records of congeneric species falling into thesenon-weedy categories should be excluded. Nevertheless, thescore serves as a useful indicator of invasiveness.Scores for these four criteria were standardized and weighted,
with Impact, Weediness and Biocontrol receiving equal weightingof 4, and Weedy congeners receiving a lower weighting of 1 to
Working for Water South African Journal of Science 100, January/February 2004 55
Table 1. Thresholds used to define categories of abundance and range categories of likely major invaders in South Africa from information in the SAPIA database.
Range Abundance
Very widespread (found in 350 or more grid-cells) Abundant (the species was recorded in the SAPIA database as ‘Very Abundant’/’Abundant’ in16% or more of the grid-cells where it is found)
Widespread (distributed over more than 70 grid-cells but fewer than350 grid-cells)
Common (the species was recorded in the SAPIA database as ‘Very Abundant’/’Abundant’ inless than 16% of the grid-cells where it is found)
Localized (found in fewer than 70 grid-cells) Scarce (quantitative data were insufficient, and during expert review of the information theabundance was confirmed as scarce)
account for the lower level of confidence in this factor. Theweighted criteria were summed to obtain a combined score foreach species. The combined score was used only as a first, coarsefilter approach to focus attention at expert workshops on thespecies most likely to become problematic. Expert opinion over-ruled ranking results in some instances. All species with acombined score of 60 or more (just over 100 species) were chosenfor collective expert review by the same experts who reviewedthe major invaders list. The combined score cut-off of 60 wasarbitrarily selected on the basis of what was manageable for thecollective workshop, and species with a combined score of lessthan 60 were also reviewed by the same experts, but individu-ally. For the individual reviews, experts were asked to elevateany species that had a combined score lower than 60, but whichthey felt were receiving too low a score. These species wereincluded with those species with combined scores of 60 or more.The remaining species with scores less than 60 were excluded,reducing the list to 167 species.
Those species that are largely confined to human-modifiedhabitats and have not shown the ability to invade natural orsemi-natural ecosystems were identified by expert reviewers,and excluded. Our rationale was that species invading naturaland semi-natural habitats will have the most impact on nativebiodiversity and ecosystem processes; the influence of alienplants in human-modified environments is generally less thanthat of the human impact itself. This reduced the list to 115species.
We classified the remaining 115 species according to theamount of invasible habitat available for each species and theircurrent propagule pool size. Experts estimated invasible habitatand current propagule pool size in various categories (Table 2).We excluded species from the categories where the combinedinvasible habitat and propagule pool was ‘moderate habitat–small propagule pool’, ‘riparian habitat–small propagulepool’, ‘small habitat–moderate propagule pool’, ‘small habitat–small propagule pool’. The list was thus reduced to 84 species,which we considered to be the final list of emerging invaders(Fig. 1).
Comparisons with other national invasive alien plantmanagement lists
We compared our lists of major and emerging invaders withfour other national lists of invasive alien plant species:1) The regulations pertaining to the Conservation of Agricultural
Resources (Act 43 of 1983). These regulations provide legisla-tion that lists different categories of 199 weeds and invasivealien species, and prescribes the actions which landownersare obliged to take to control these species.
2) A proposed prioritization system12 that lists and ranks 61priority invasive alien plant species for management inSouth Africa.
3) A ranking of the top 25 invasive alien plant species in SouthAfrica, based on their estimated mean annual water use.28
4) A list of 84 important environmental weeds in southernAfrican biomes.2 This list was compiled by combining the
‘transformer’ species in South Africa’s ‘catalogue of problemplants’21 with the invaders recorded as ‘widespread’ in asurvey of South African nature reserves.29
Results
Database of invasive alien plants in South AfricaAccording to the distribution information recorded in the
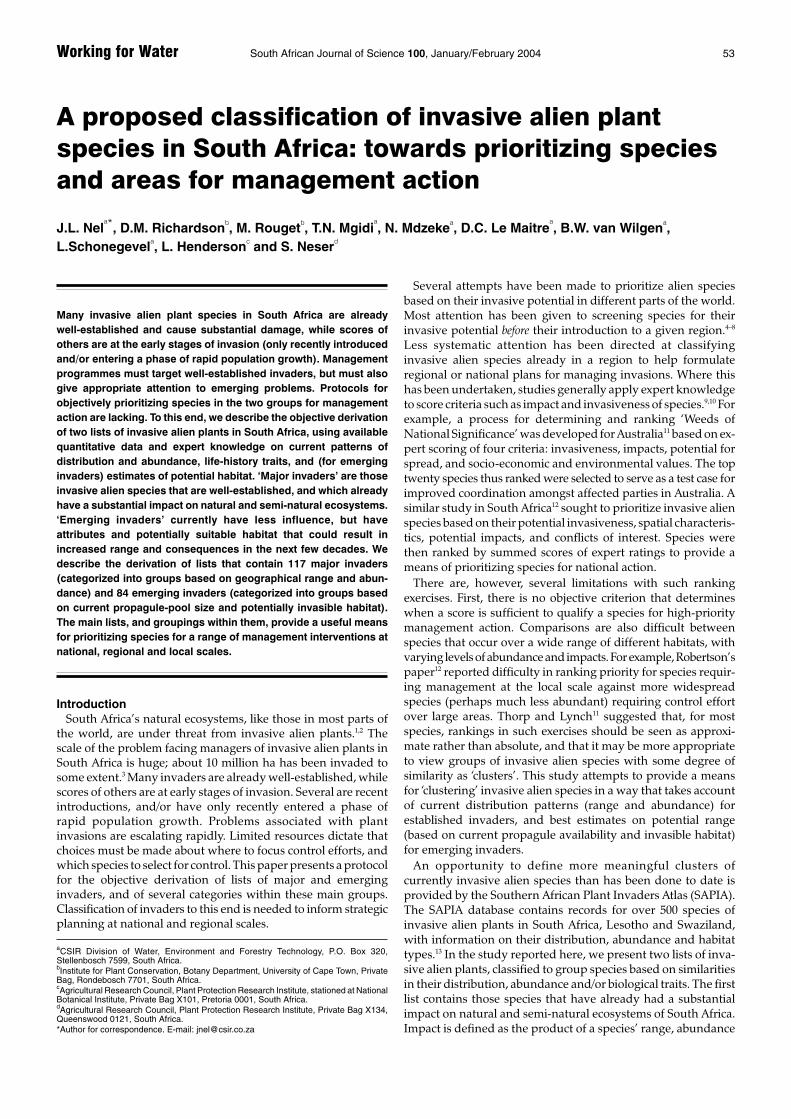
SAPIA database, almost 80% of the grid-cells within South Africacurrently contain invasive alien species and almost 35% support10 or more species. This excludes the additional 29 species inour invasive alien plant database for which we did not havedistribution data. The areas containing more than 10 species pergrid-cell occur mainly along the southern and eastern coasts ofSouth Africa, along the eastern escarpment of Natal andMpumalanga, and around the eastern Free State and Gautengprovinces (Fig. 2). These correspond to areas with a high propor-tion of transformed land (such as agriculture, forestry andurbanization), high rainfall and a high population density.
Major invadersWe identified 117 major invaders (Appendix 1, Table 3) and just
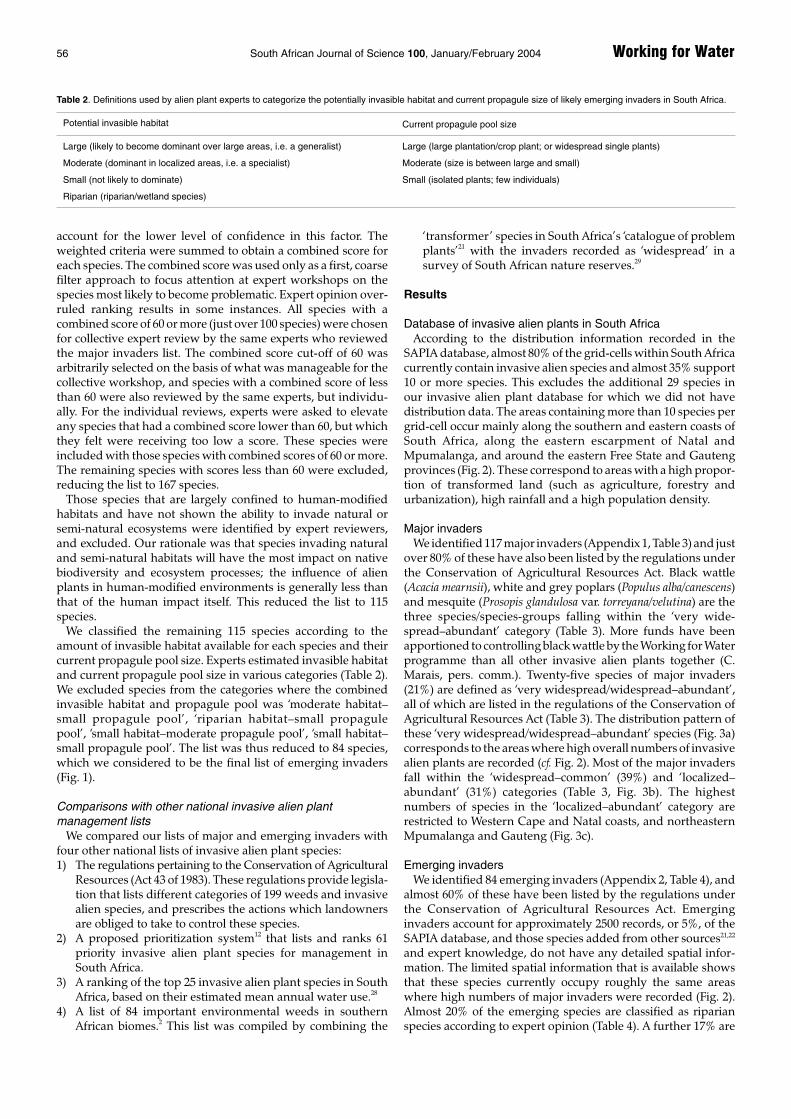
over 80% of these have also been listed by the regulations underthe Conservation of Agricultural Resources Act. Black wattle(Acacia mearnsii), white and grey poplars (Populus alba/canescens)and mesquite (Prosopis glandulosa var. torreyana/velutina) are thethree species/species-groups falling within the ‘very wide-spread–abundant’ category (Table 3). More funds have beenapportioned to controlling black wattle by the Working for Waterprogramme than all other invasive alien plants together (C.Marais, pers. comm.). Twenty-five species of major invaders(21%) are defined as ‘very widespread/widespread–abundant’,all of which are listed in the regulations of the Conservation ofAgricultural Resources Act (Table 3). The distribution pattern ofthese ‘very widespread/widespread–abundant’ species (Fig. 3a)corresponds to the areas where high overall numbers of invasivealien plants are recorded (cf. Fig. 2). Most of the major invadersfall within the ‘widespread–common’ (39%) and ‘localized–abundant’ (31%) categories (Table 3, Fig. 3b). The highestnumbers of species in the ‘localized–abundant’ category arerestricted to Western Cape and Natal coasts, and northeasternMpumalanga and Gauteng (Fig. 3c).
Emerging invadersWe identified 84 emerging invaders (Appendix 2, Table 4), and
almost 60% of these have been listed by the regulations underthe Conservation of Agricultural Resources Act. Emerginginvaders account for approximately 2500 records, or 5%, of theSAPIA database, and those species added from other sources21,22
and expert knowledge, do not have any detailed spatial infor-mation. The limited spatial information that is available showsthat these species currently occupy roughly the same areaswhere high numbers of major invaders were recorded (Fig. 2).Almost 20% of the emerging species are classified as riparianspecies according to expert opinion (Table 4). A further 17% are
56 South African Journal of Science 100, January/February 2004 Working for Water
Table 2. Definitions used by alien plant experts to categorize the potentially invasible habitat and current propagule size of likely emerging invaders in South Africa.
Potential invasible habitat Current propagule pool size
Large (likely to become dominant over large areas, i.e. a generalist) Large (large plantation/crop plant; or widespread single plants)
Moderate (dominant in localized areas, i.e. a specialist) Moderate (size is between large and small)
Small (not likely to dominate) Small (isolated plants; few individuals)
Riparian (riparian/wetland species)
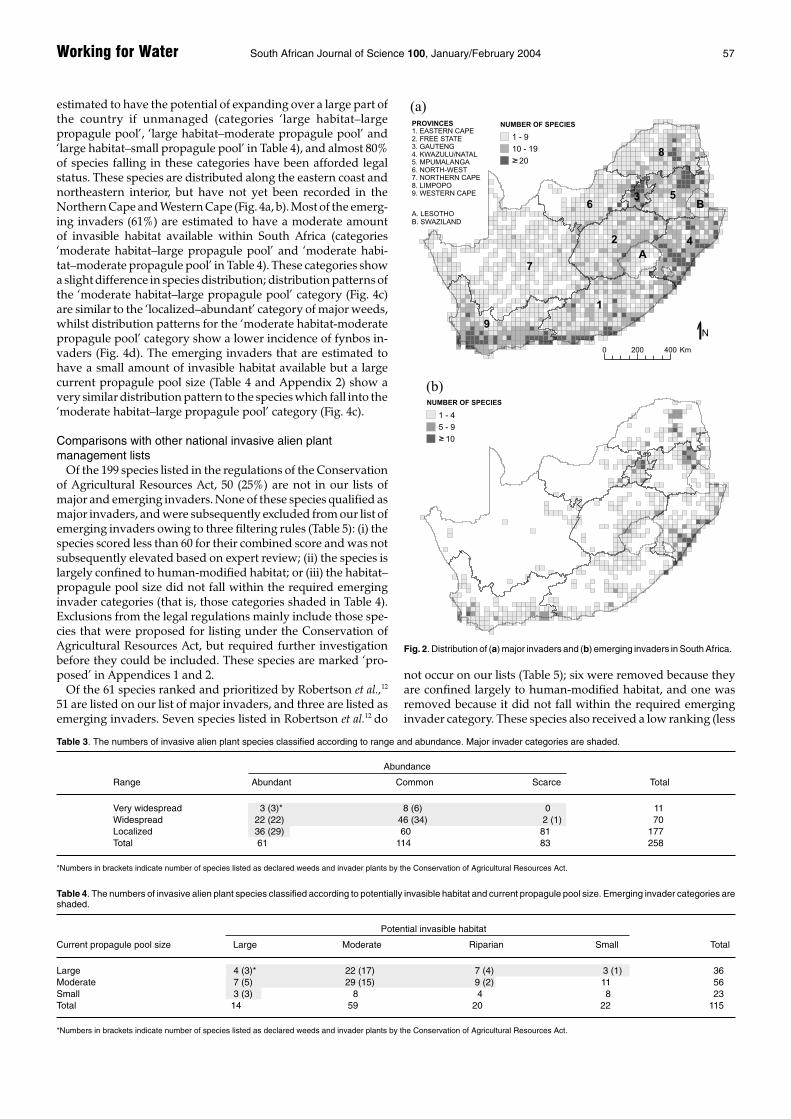
estimated to have the potential of expanding over a large part ofthe country if unmanaged (categories ‘large habitat–largepropagule pool’, ‘large habitat–moderate propagule pool’ and‘large habitat–small propagule pool’ in Table 4), and almost 80%of species falling in these categories have been afforded legalstatus. These species are distributed along the eastern coast andnortheastern interior, but have not yet been recorded in theNorthern Cape and Western Cape (Fig. 4a, b). Most of the emerg-ing invaders (61%) are estimated to have a moderate amountof invasible habitat available within South Africa (categories‘moderate habitat–large propagule pool’ and ‘moderate habi-tat–moderate propagule pool’ in Table 4). These categories showa slight difference in species distribution; distribution patterns ofthe ‘moderate habitat–large propagule pool’ category (Fig. 4c)are similar to the ‘localized–abundant’ category of major weeds,whilst distribution patterns for the ‘moderate habitat-moderatepropagule pool’ category show a lower incidence of fynbos in-vaders (Fig. 4d). The emerging invaders that are estimated tohave a small amount of invasible habitat available but a largecurrent propagule pool size (Table 4 and Appendix 2) show avery similar distribution pattern to the species which fall into the‘moderate habitat–large propagule pool’ category (Fig. 4c).
Comparisons with other national invasive alien plantmanagement lists
Of the 199 species listed in the regulations of the Conservationof Agricultural Resources Act, 50 (25%) are not in our lists ofmajor and emerging invaders. None of these species qualified asmajor invaders, and were subsequently excluded from our list ofemerging invaders owing to three filtering rules (Table 5): (i) thespecies scored less than 60 for their combined score and was notsubsequently elevated based on expert review; (ii) the species islargely confined to human-modified habitat; or (iii) the habitat–propagule pool size did not fall within the required emerginginvader categories (that is, those categories shaded in Table 4).Exclusions from the legal regulations mainly include those spe-cies that were proposed for listing under the Conservation ofAgricultural Resources Act, but required further investigationbefore they could be included. These species are marked ‘pro-posed’ in Appendices 1 and 2.
Of the 61 species ranked and prioritized by Robertson et al.,12
51 are listed on our list of major invaders, and three are listed asemerging invaders. Seven species listed in Robertson et al.12 do
not occur on our lists (Table 5); six were removed because theyare confined largely to human-modified habitat, and one wasremoved because it did not fall within the required emerginginvader category. These species also received a low ranking (less
Working for Water South African Journal of Science 100, January/February 2004 57
Fig. 2. Distribution of (a) major invaders and (b) emerging invaders in South Africa.
Table 4. The numbers of invasive alien plant species classified according to potentially invasible habitat and current propagule pool size. Emerging invader categories areshaded.
Potential invasible habitat
Current propagule pool size Large Moderate Riparian Small Total
Large 4 (3)* 22 (17) 7 (4) 3 (1) 36Moderate 7 (5) 29 (15) 9 (2) 11 56Small 3 (3) 8 4 8 23Total 14 59 20 22 115
*Numbers in brackets indicate number of species listed as declared weeds and invader plants by the Conservation of Agricultural Resources Act.
Table 3. The numbers of invasive alien plant species classified according to range and abundance. Major invader categories are shaded.
Abundance
Range Abundant Common Scarce Total
Very widespread 3 (3)* 8 (6) 0 11Widespread 22 (22) 46 (34) 2 (1) 70Localized 36 (29) 60 81 177Total 61 114 83 258
*Numbers in brackets indicate number of species listed as declared weeds and invader plants by the Conservation of Agricultural Resources Act.

than 32) by the prioritization system of Robertson et al.12
All 25 species on the list of invasive alien plant species rankedaccording to their estimated mean annual water use28 appear onour lists, and all are classified as major invaders except forEnglish oak (Quercus species), which is classified as an emerginginvader.
Of the 84 important environmental weeds in southern Africarecorded by Richardson et al.,2 24 species do not occur on ourlists, the majority of which were excluded because they areconfined largely to human-modified habitat (Table 5). Of thespecies that are common on both lists, 60 are classified as majorinvaders and three are classified as emerging invaders, namelythe sugar gum (Eucalyptus cladocalyx), passion fruit (Passifloraedulis), and pereskia (Pereskia aculeata).
DiscussionThe identification and classification of invaders presented
here will ultimately be used to prioritize species on which tofocus management and to identify those species which requirefurther study and/or close monitoring. Classification is a neces-sary means of prioritizing species at a national level, because itcircumvents the problem of prioritization across multiple spatialscales,12 which make it difficult to compare the importance ofspecies that occupy different ranges and habitats, with differentlevels of impact and abundance (‘comparing apples withoranges’). This classification system therefore provides a meansof implementing scale-appropriate management strategies.For example, the scale of the ‘widespread–common’ and‘localized–abundant’ categories of major invaders have differ-
58 South African Journal of Science 100, January/February 2004 Working for Water
Fig. 3. Distribution of the number of major invader species per grid-cell for three range–abundance categories: (a) ‘widespread–abundant’, (b) ‘widespread–common’, and(c) ‘localized–abundant’. Categories ‘very widespread–abundant’, ‘very widespread–common’ and ‘widespread–scarce’ were grouped respectively with ‘wide-spread–abundant’, ‘widespread–common’ and ‘widespread–common’, owing to their similar distribution patterns and/or small number of occupied grid-cells.
Table 5. Numbers of species appearing in legislation (Conservation of Agricultural Resources Act), or on other national lists of invasive alien plants2,12, but which do notoccur on our lists of major or emerging invaders, and reasons for their removal from our lists.
Reason for removal Number of species not listed Number of species not Number of species not inin legislation in Robertson et al.12 Richardson et al.2
Combined score <60 20 0 6Largely confined to human-modified habitat 15 6 14Range/propagule size filtering 14 1 2Does not occur in South Africa, Lesotho or Swaziland 1 0 2
Total 50 7 24
ent implications for management; control efforts for speciesclassified as ‘widespread–common’, for example, Australianblackwood (Acacia melanoxylon) or jointed cactus (Opuntiaaurantiaca) are best launched at a national scale, whereas thespecies within the ‘localized–abundant’ category, such as rockhakea (Hakea gibbosa), will require habitat-specific control opera-tions, at the regional or provincial scale. The categories will alsohelp to define specific management guidelines. For example,emerging invaders with a large area of invasible habitat and asubstantial propagule pool size should be investigated aspriority species for research on biocontrol;16 there should also bea sustained effort to eradicate the species within this categorythat are listed in legislation as ‘category 1 species’ (that is, haveno economic or social benefits), and an attempt to limit thespread of those species listed in legislation as ‘category 2 species’(those with commercial value). In contrast, emerging invaderswith a small amount of invasible habitat and low propagulepressure may require only removal from sensitive sites, andbasic monitoring of known populations can be designed todetect any changes in their invasion patterns.
Applying ranking systems11,12 within each of the categoriesdefined in this study would, therefore, circumvent scale issues,and further prioritize species within each of the categoriespresented by this study.
We have classified 117 species as well-established, major
invaders. The distribution of the species which are ‘widespread–abundant’ (Fig. 3a) follows a similar pattern to the distribution ofareas where high numbers of major invaders are recorded(Fig. 2a). This suggests that these areas are at the most risk ofbeing severely affected by invasive alien plants because not onlydo they contain large numbers of invasive alien species, but theinvasive alien species that do establish themselves also have theability to become abundant within these areas. This is in sharpcontrast to the northern interior and northwestern coast of thecountry, where both the number of major invaders and theirassociated abundance levels tend to be low (Figs 2a and 3b).
Emerging invaders do not appear to be establishing in areaswhich were previously not invaded and exhibit distributionpatterns similar to major invaders (see Figs 2, 3 and 4). Thissuggests that some areas may be susceptible to invasion by alienplants because of certain climatic conditions, patterns of humansettlement, or land-use patterns that predispose them to inva-sion by alien plants. Past invasions by ‘major invader’ species arealso likely to be facilitating invasions of many of the ‘emerginginvader ’ species. Emerging invaders are often overlookedbecause they currently have few consequences compared tomajor invaders. However, they have the potential to causesevere impacts in the future if not kept in check. We haveidentified 84 species of emerging invaders. It is critical to incor-porate these species into alien plant monitoring programmes.
Working for Water South African Journal of Science 100, January/February 2004 59
Fig. 4. Distribution of the number of emerging invader species per grid-cell for four categories of potentially invasible habitat and propagule pool size: (a) ‘largehabitat–large propagule pool’, (b) ‘large habitat–moderate propagule pool’ (c) ‘moderate habitat–large propagule pool’, and (d) ‘moderate habitat–moderate propagulepool’. Categories ‘large habitat–small propagule pool’ and ‘small habitat–large propagule pool’ were grouped with ‘large habitat–moderate propagule pool’ and ‘moderatehabitat–large propagule pool’ respectively, owing to their similar distribution patterns and/or small number of occupied grid-cells.

South African researchers have also demonstrated that bio-control is most effective during the earliest stages of invasion.26
The emerging invaders identified in this study should be used asa pro-active means of focusing biocontrol research to identifyagents that have the potential to keep these species undercontrol, preventing them from having a major influence onnatural and semi-natural ecosystems.
The relatively close correspondence between the results of thisanalysis and the species lists compiled and ranked using otherdata sources and criteria, demonstrates that there is generalagreement on which are the most important species. The differ-ences appear to be species which are grouped in the SAPIAdatabase, or which are confined largely to human-modifiedhabitat, but some are not easily explained. A more detailedassessment of the anomalies is needed but is beyond the scope ofthis paper.
Using quantitative data from the SAPIA database and othersources to guide experts in making decisions regarding theclassification of invasive alien plants has the advantage ofreducing the inevitable subjectivity of expert knowledge alone.In turn, experts were given the opportunity of collectivelyreviewing the quantitative data provided by the SAPIA data-base, and updating data gaps wherever there was reliableknowledge. A primary source of collection bias within the SAPIAdatabase, which affected the classification of major invaders,was species visibility. Some of the less visible, undergrowthinvasive alien plants, which in reality are quite widespread orcommon, were initially excluded from the major invaders listbecause their range and/or abundance was underestimated inthe SAPIA database. Experts identified where this form ofcollection bias was evident and reached consensus on a moreappropriate classification for these species during review.
There are two limitations of the data from the SAPIA databasewhich affected our study, and could not be rectified. First,treating all species and species groups of pines as well aseucalypts separately (when they have been recorded by SAPIAsometimes as separate species and at other times combined intospecies groups) may have led to underestimating the extent ofinfestation of some individual species. Second, although themapping programme has attempted to survey every grid-cell,the database is likely to contain a certain degree of collection biastowards areas which are easily accessible by road, or around theareas where active SAPIA contributors live and work. Futuremodelling exercises to examine potential distributions of speciesusing data from the SAPIA database will help to correct this bias.
ConclusionsA national strategy to manage invasive alien plants will need to
consider a broad range of management actions simultaneously.For example, it should aim to eradicate invasive alien plants thatare confined to small areas or just beginning to become invasive;it should consider targeting emerging invaders for biocontrol;16
and it should seek to prioritize areas on which to focus manage-ment of the most widespread species. Our classification systemprovides a starting point on which these priorities can be formu-lated. In addition, predictive modelling is planned to explorethe potential distribution ranges for the major and emerginginvaders. This, in turn, will aid further prioritization through theidentification of invaders that probably have achieved theirfull potential range in the country, and those which still havesignificant available habitat into which they can spread, as wellas areas which are particularly vulnerable to invasions. This willhelp us to predict species and areas where current and futuremanagement will be most cost-effective.
Funding was provided by the Department of Water Affairs and Forestry’s Workingfor Water Programme. We thank those who attended our expert workshop. In par-ticular, we would like to thank Rod Randall for the use of his database.
1. Macdonald I.A.W., Kruger F.J. and Ferrar A.A. (1986). The Ecology and Manage-ment of Biological Invasions in Southern Africa. Oxford University Press, CapeTown.
2. Richardson D.M., Macdonald I.A.W., Hoffmann J.H. and Henderson L. (1997).Alien plant invasions. In Vegetation of Southern Africa, eds R.M Cowling, D.M.Richardson and S.M. Pierce, pp. 534–570. Cambridge University Press,Cambridge.
3. Le Maitre D.C., Versfeld D.B. and Chapman R.A. (2000). The impact of invadingalien plants on surface water resources in South Africa: a preliminaryassessment. Water SA 26, 397–408.
4. Navarantham S.J. and Catley A. (1986). Quarantine measures to exclude plantpests. In Ecology of Biological Invasions, eds R.H. Groves and J.J. Burdon,pp. 106–112. Cambridge University Press, Cambridge.
5. Smallwood K.S. and Salmon T.P. (1992). A rating system for potential exotic birdand mammal pests. Biol. Conserv. 62, 149–159.
6. Tucker K.C. and Richardson D.M. (1995). An expert system for screeningpotentially invasive alien plants in South African fynbos. J. Environ. Manage. 44,309–338.
7. Pheloung P.C., Williams P.A. and Halloy S.A. (1999). A weed risk assessmentmodel for use as a biosecurity tool evaluating plant introductions. J. Environ.Manage. 57, 239–251.
8. Daehler C.C. and Carino D.A. (1999). Predicting invasive plants: prospects for ageneral screening system based on current regional models. Biol. Invas. 2,93–102.
9. Batianoff G.N. and Butler D.W. (2002). Assessment of invasive naturalizedplants in south-east Queensland. Plant Prot. Quart. 17(1), 27–34.
10. Batianoff G.N. and Butler D.W. (2003). Impact assessment and analysis ofsixty-six priority invasive weeds in south-east Queensland. Plant Prot. Quart.18(1), 11–17.
11. Thorp J.R. and Lynch R. (2000). The Determination of Weeds of NationalSignificance. National Weeds Strategy Executive Committee, Launceston,Cornwall. Http://www.weeds.org.au/docs/WONS/
12. Robertson M.P., Villet M.H., Fairbanks D.H.K., Henderson L., Higgins S.I.,Hoffmann J.H., Le Maitre D.C., Palmer A.R., Riggs I., Shackleton C.M. andZimmermann H.G. (2003). A proposed prioritization system for themanagement of invasive alien plants in South Africa. S. Afr. J. Sci. 99, 37–43.
13. Henderson L. (1998). Southern African Plant Invaders Atlas (SAPIA). Appl.Plant Sci. 12, 31–32.
14. Parker I.M., Simberloff D., Lonsdale W.M., Goodell K., Wonham M., KareivaP.M., Williamson M., von Holle B., Moyle P.B., Byers J.E. and Goldwasser L.(1999). Impact: towards a framework for understanding the ecological effectsof invaders. Biol. Invas. 1, 3–19.
15. Richardson, D.M. and van Wilgen, B.W. (2004). Invasive alien plants in SouthAfrica: how well do we understand the ecological impacts? S. Afr. J. Sci. 100,45–52.
16. Olckers, T. (2004). Targeting ‘emerging weeds’ for biological control in SouthAfrica: the benefits of halting the spread of alien plants at an early stage of theirinvasion. S. Afr. J. Sci. 100, 64–68.
17. Chapman R.A., Le Maitre D.C. and Richardson D.M. (2000). Scenario planning:understanding and managing biological invasions in South Africa. In The GreatReshuffling: Human dimensions of invasive alien species, ed J.A. McNeely,pp. 195–208. IUCN, Gland, Switzerland.
18. Henderson L. (1999). The Southern African Plant Invaders Atlas (SAPIA) and itscontribution to biological weed control. African Entomology 1, 159–163.
19. Henderson L. (2001). Alien Weeds And Invasive Plants: A complete guide to declaredweeds and invaders in South Africa. ARC-PPRI, PPRI Handbook No. 12, Pretoria.
20. Henderson L. (2002). Southern African Plant Invaders Atlas (SAPIA) withparticular reference to invasive Australian species. Proc. 13th Australian WeedsConference, Perth, September 2002.
21. Wells M.J., Balsinhas A.A., Joffe H., Engelbrecht, V.M., Harding G. and Stirton,C.H. (1986). A catalogue of problem plants in southern Africa. Mem. Bot. Surv. S.Afr. 53.
22. Bromilow C. (1995). Problem Plants of South Africa. Briza Publishers, Pretoria.23. Rejmánek M., Richardson D.M., Higgins S.I. Pitcairn M. and Grotkopp E. (in
press). Plant invasion ecology: state of the art. In Invasive Alien Species: A newsynthesis, eds H.A. Mooney, J.A. Mc Neely, L. Neville, P.J. Schei and J. Waage. Is-land Press, Washington, DC.
24. Richardson D.M., Pysek P., Rejmánek M., Barbour M.G., Panetta D.F. and WestC.J. (2000). Naturalization and invasion of alien plants: concepts anddefinitions. Diversity Distrib. 6, 93–107.
25. Randall R.P. (2002). A Global Compendium of Weeds. R.G. and F.J. Richardson,Melbourne.
26. Olckers T. and Hill M.P. (1999). Biological control of weeds in South Africa(1990–1998). African Entomology Memoir No. 1.
27. Mabberley D.J. (1997). The Plant Book, 2nd edn. Cambridge University Press,Cambridge.
28. Versfeld D.B., Le Maitre D.C. and Chapman R.A. (1998). Alien Invading Plantsand Water Resources in South Africa: A preliminary assessment. Report No. TT99/98, Water Research Commission, Pretoria.
29. Macdonald I.A.W. (1991). Conservation implications of the invasion of southernAfrica by alien organisms. PhD thesis, University of Cape Town.
60 South African Journal of Science 100, January/February 2004 Working for Water
Working for Water South African Journal of Science 100, January/February 2004 61
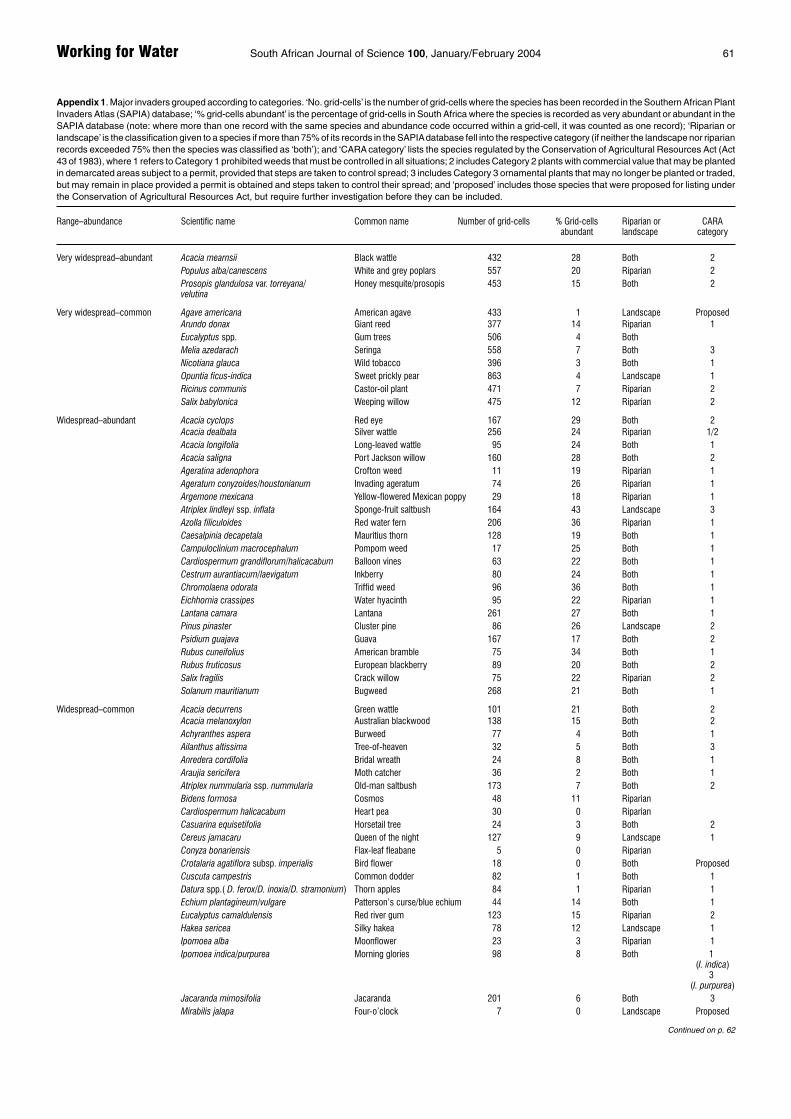
Appendix 1. Major invaders grouped according to categories. ‘No. grid-cells’ is the number of grid-cells where the species has been recorded in the Southern African PlantInvaders Atlas (SAPIA) database; ‘% grid-cells abundant’ is the percentage of grid-cells in South Africa where the species is recorded as very abundant or abundant in theSAPIA database (note: where more than one record with the same species and abundance code occurred within a grid-cell, it was counted as one record); ‘Riparian orlandscape’ is the classification given to a species if more than 75% of its records in the SAPIAdatabase fell into the respective category (if neither the landscape nor riparianrecords exceeded 75% then the species was classified as ‘both’); and ‘CARA category’ lists the species regulated by the Conservation of Agricultural Resources Act (Act43 of 1983), where 1 refers to Category 1 prohibited weeds that must be controlled in all situations; 2 includes Category 2 plants with commercial value that may be plantedin demarcated areas subject to a permit, provided that steps are taken to control spread; 3 includes Category 3 ornamental plants that may no longer be planted or traded,but may remain in place provided a permit is obtained and steps taken to control their spread; and ‘proposed’ includes those species that were proposed for listing underthe Conservation of Agricultural Resources Act, but require further investigation before they can be included.
Range–abundance Scientific name Common name Number of grid-cells % Grid-cells Riparian or CARAabundant landscape category
Very widespread–abundant Acacia mearnsii Black wattle 432 28 Both 2Populus alba/canescens White and grey poplars 557 20 Riparian 2Prosopis glandulosa var. torreyana/ Honey mesquite/prosopis 453 15 Both 2velutina
Very widespread–common Agave americana American agave 433 1 Landscape ProposedArundo donax Giant reed 377 14 Riparian 1Eucalyptus spp. Gum trees 506 4 BothMelia azedarach Seringa 558 7 Both 3Nicotiana glauca Wild tobacco 396 3 Both 1Opuntia ficus-indica Sweet prickly pear 863 4 Landscape 1Ricinus communis Castor-oil plant 471 7 Riparian 2Salix babylonica Weeping willow 475 12 Riparian 2
Widespread–abundant Acacia cyclops Red eye 167 29 Both 2Acacia dealbata Silver wattle 256 24 Riparian 1/2Acacia longifolia Long-leaved wattle 95 24 Both 1Acacia saligna Port Jackson willow 160 28 Both 2Ageratina adenophora Crofton weed 11 19 Riparian 1Ageratum conyzoides/houstonianum Invading ageratum 74 26 Riparian 1Argemone mexicana Yellow-flowered Mexican poppy 29 18 Riparian 1Atriplex lindleyi ssp. inflata Sponge-fruit saltbush 164 43 Landscape 3Azolla filiculoides Red water fern 206 36 Riparian 1Caesalpinia decapetala Mauritius thorn 128 19 Both 1Campuloclinium macrocephalum Pompom weed 17 25 Both 1Cardiospermum grandiflorum/halicacabum Balloon vines 63 22 Both 1Cestrum aurantiacum/laevigatum Inkberry 80 24 Both 1Chromolaena odorata Triffid weed 96 36 Both 1Eichhornia crassipes Water hyacinth 95 22 Riparian 1Lantana camara Lantana 261 27 Both 1Pinus pinaster Cluster pine 86 26 Landscape 2Psidium guajava Guava 167 17 Both 2Rubus cuneifolius American bramble 75 34 Both 1Rubus fruticosus European blackberry 89 20 Both 2Salix fragilis Crack willow 75 22 Riparian 2Solanum mauritianum Bugweed 268 21 Both 1
Widespread–common Acacia decurrens Green wattle 101 21 Both 2Acacia melanoxylon Australian blackwood 138 15 Both 2Achyranthes aspera Burweed 77 4 Both 1Ailanthus altissima Tree-of-heaven 32 5 Both 3Anredera cordifolia Bridal wreath 24 8 Both 1Araujia sericifera Moth catcher 36 2 Both 1Atriplex nummularia ssp. nummularia Old-man saltbush 173 7 Both 2Bidens formosa Cosmos 48 11 RiparianCardiospermum halicacabum Heart pea 30 0 RiparianCasuarina equisetifolia Horsetail tree 24 3 Both 2Cereus jamacaru Queen of the night 127 9 Landscape 1Conyza bonariensis Flax-leaf fleabane 5 0 RiparianCrotalaria agatiflora subsp. imperialis Bird flower 18 0 Both ProposedCuscuta campestris Common dodder 82 1 Both 1Datura spp.( D. ferox/D. inoxia/D. stramonium) Thorn apples 84 1 Riparian 1Echium plantagineum/vulgare Patterson’s curse/blue echium 44 14 Both 1Eucalyptus camaldulensis Red river gum 123 15 Riparian 2Hakea sericea Silky hakea 78 12 Landscape 1Ipomoea alba Moonflower 23 3 Riparian 1Ipomoea indica/purpurea Morning glories 98 8 Both 1
(I. indica)3
(I. purpurea)Jacaranda mimosifolia Jacaranda 201 6 Both 3Mirabilis jalapa Four-o’clock 7 0 Landscape Proposed
Continued on p. 62

62 South African Journal of Science 100, January/February 2004 Working for Water
Range–abundance Scientific name Common name Number of grid-cells % Grid-cells Riparian or CARAabundant landscape category
Widespread–common Morus alba White or common mulberry 130 4 Riparian 3Opuntia aurantiaca Jointed cactus 61 5 Landscape 1Opuntia imbricata Imbricate cactus 131 10 Landscape 1Opuntia monacantha Cochineal prickly pear 48 1 Both 1Opuntia robusta Blue-leaf cactus 225 1 LandscapeOpuntia stricta Australian pest pear 108 10 Landscape 1Pinus halepensis Aleppo pine 85 3 Landscape 2Pinus patula Patula pine 90 12 Both 2Pinus radiata Radiata pine 71 12 Landscape 2Pinus spp. Pine trees 126 9 LandscapePyracantha angustifolia Yellow firethorn 143 1 Both 3Robinia pseudoacacia Black locust 110 9 Both 2Schinus molle Pepper tree 232 1 Both ProposedSenna didymobotrya Peanut butter cassia 142 13 Both 3Senna occidentalis Wild coffee 56 8 BothSesbania punicea Red sesbania 325 13 Riparian 1Solanum seaforthianum Potato creeper 33 7 Both 1Solanum sisymbriifolium Dense-thorned bitter apple 40 6 Both 1Sorghum halepense Johnson grass 44 4 Riparian 2Tamarix spp. (T. chinensis/T. ramosissima) Tamarisk 92 4 Riparian 1/3Verbena bonariensis Purple top 58 5 RiparianVerbena tenuisecta Fine-leaved verbena 14 4 RiparianXanthium strumarium Large cocklebur 151 12 Both 1Zinnia peruviana Redstar zinnia 4 0 Both
Widespread–scarce Acacia baileyana Bailey’s wattle 87 0 Both 3Populus nigra var. italica Lombardy poplar 90 0 Riparian Proposed
Localized–abundant Acacia pycnantha Golden wattle 35 25 Landscape 1Albizia lebbeck Lebbeck tree 5 33 no data 1Azolla pinnata var. imbricata Mosquito fern 3 25 RiparianColocasia esculenta Elephant’s ear 10 21 RiparianEchinopsis spachiana Torch cactus 57 3 Landscape 1Eucalyptus lehmannii Spider gum 41 13 Landscape 1/2Flaveria bidentis Smelter’s bush 19 26 RiparianHakea drupacea Sweet hakea 28 7 Landscape 1Hakea gibbosa Rock hakea 18 11 Landscape 1Harrisia martinii Moon cactus 21 43 Both 1Hedychium coccineum Red ginger lily 3 20 Riparian 1Hedychium flavescens Yellow ginger lily 5 40 Both 1Hedychium spp. Ginger lilies 7 25 Riparian 1Helianthus annuus Sunflower 5 17 no dataLeptospermum laevigatum Australian mrytle 38 30 Landscape 1Ligustrum vulgare Common privet 3 20 Riparian 3Lilium formosanum Formosa lily 16 21 Landscape 3Litsea glutinosa Indian laurel 8 44 Both 1Macfadyena unguis-cati Cat’s claw creeper 27 27 Both 1Melilotus alba White sweet clover 15 40 RiparianMetrosideros excelsa New Zealand bottlebrush 2 25 Riparian 3Myriophyllum aquaticum Parrot’s feather 48 19 Riparian 1Nassella trichotoma Nassella tussock 12 21 Landscape 1Nerium oleander Oleander 24 6 Riparian 1Opuntia fulgida Chainfruit-cholla/rosea cactus 11 17 Landscape 1Opuntia lindheimeri/Opuntia engelmannii Small round-leaved prickly pear 11 21 Landscape 1
var. linderheimeriParaserianthes lophantha Stinkbean 54 10 Both 1Parthenium hysterophorus Parthenium weed 24 37 Riparian 1Paspalum dilatatum Common Paspalum 6 33 RiparianPennisetum villosum Feathertop 22 21 Landscape 1Pinus elliottii Slash pine 34 15 Landscape 2Pistia stratiotes Water lettuce 27 17 Riparian 1Pittosporum undulatum Australian cheesewood 3 0 Both 1Rumex usambarensis Rumex 4 20 LandscapeSalvinia molesta Salvinia 33 20 Riparian 1Schinus terebinthifolius Brazilian pepper tree 32 16 Both 1
Appendix 1 (continued )

Working for Water South African Journal of Science 100, January/February 2004 63
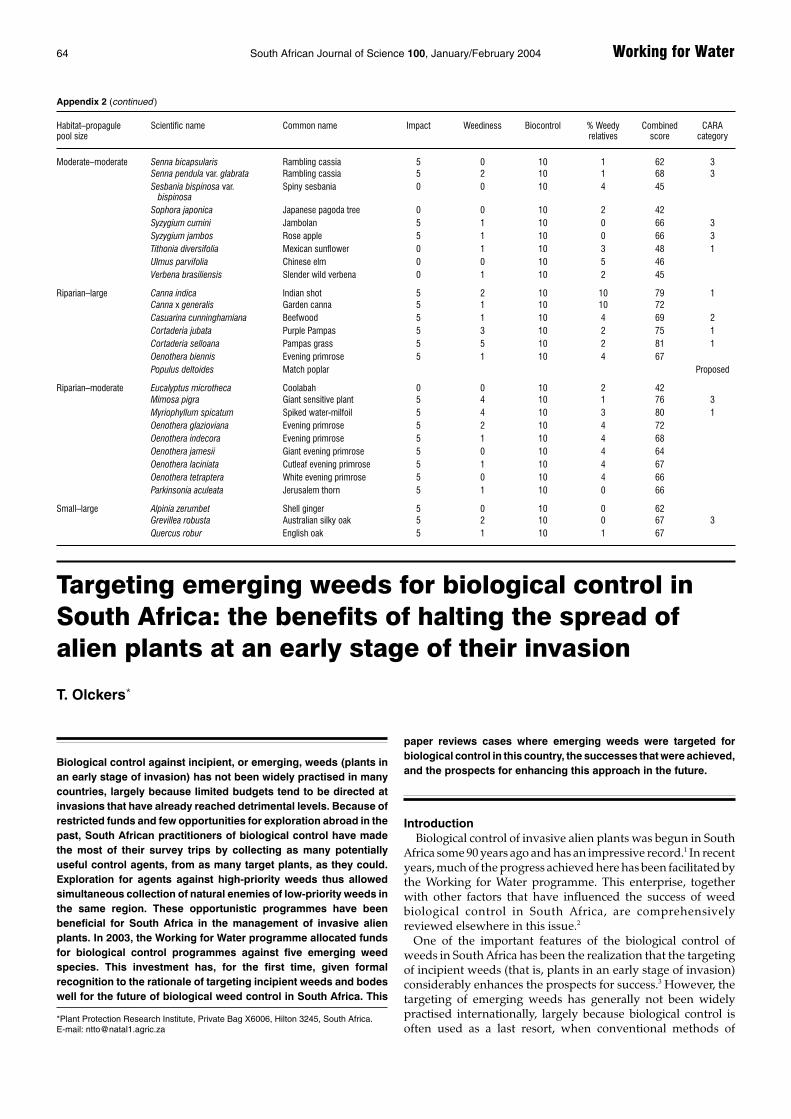
Appendix 2. Emerging invaders grouped according to categories. Scores for ‘Impact’, ‘Weediness’, Biocontrol’ and ‘Weedy relatives’ are standardized by dividing themaximum score for that criterion and multiplying by 10 (see text for details on how scores were assigned to these criteria). Scores for these four criteria were weighted, with‘Impact’, ‘Weediness’ and Biocontrol’ receiving an equal weighting of four, and ‘Weedy relatives’ receiving a lower weighting of one (see text). The weighted criteria weresummed to obtain the ‘Combined score’ for each species. ‘CARA category’ lists the species regulated by the Conservation of Agricultural Resources Act (Act 43 of 1983),where 1 refers to Category 1 prohibited weeds that must be controlled in all situations; 2 includes Category 2 plants with commercial value that may be planted indemarcated areas subject to a permit, provided that steps are taken to control spread; 3 includes Category 3 ornamental plants that may no longer be planted or traded, butmay remain in place provided a permit is obtained and steps taken to control their spread; and ‘proposed’ includes those species that were proposed for listing under theConservation of Agricultural Resources Act, but require further investigation before they can be included.
Habitat–propagule Scientific name Common name Impact Weediness Biocontrol % Weedy Combined CARApool size relatives score category
Large–large Bromus diandrus Ripgut brome 0 2 10 5 53Pinus taeda Loblolly pine 10 1 10 4 87 2Tecoma stans Yellow bells 5 1 10 3 69 1Tipuana tipu Tipu tree 5 1 10 10 73 3
Large–moderate Celtis sinensis/ Chinese nettle tree/Celtis occidentalis/ Common hackberry/Celtis australis European hackberry 0 1 10 1 45 ProposedCytisus scoparius Scotch broom 5 5 10 4 86 1Pennisetum purpureum Elephant grass 10 3 10 2 95 ProposedPereskia aculeata Pereskia 10 1 10 2 87 1Rosa rubiginosa Eglantine 10 3 10 3 96 1Toona ciliata Toon tree 5 1 10 2 64 3Ulex europaeus European gorse 5 5 10 1 80 1
Large–small Acacia paradoxa Kangaroo thorn 5 2 10 3 69 1Pueraria lobata Kudzu vine 5 3 10 5 76 1Triplaris americana Triplaris 5 0 10 1 62 1
Moderate–large Acacia elata Peppertree wattle 5 2 10 3 69 3Acacia podalyriifolia Pearl acacia 5 1 10 3 67 3Ardisia crenata Coralberry tree 5 1 10 0 66 1Cinnamomum camphora Camphor tree 10 2 10 0 90 1/3Cotoneaster franchetii Orange cotoneaster 5 2 10 1 69 3Cotoneaster pannosus Silver-leaf cotoneaster 5 2 10 1 69 3Eucalyptus cladocalyx Sugar gum 5 1 10 2 68 2Eucalyptus saligna Saligna gum 5 1 10 2 66Eugenia uniflora Surinam cherry 5 2 10 0 68 1Hedychium coronarium White ginger lily 10 2 10 1 87 1Hedychium gardnerianum Kahili ginger lily 10 3 10 1 92 1Ligustrum japonicum Japanese wax-leaved privet 5 1 10 3 66 3Ligustrum lucidum Chinese wax-leaved privet 5 4 10 3 78 3Ligustrum ovalifolium Californian privet 5 1 10 3 68 3Ligustrum sinense Chinese privet 5 4 10 3 80 3Lonicera japonica Japanese honeysuckle 5 6 10 1 83 ProposedMyoporum serratum Manatoka 5 0 10 2 62Myoporum tenuifolium Manatoka 5 0 10 2 63 3ssp. montanum
Nephrolepis exaltata Sword fern 10 0 10 3 84 3Pyracantha coccinea Red firethorn 5 0 10 8 69Spartium junceum Spanish broom 5 3 10 10 82 1Syzygium paniculatum Australian water pear 5 0 10 0 61
Moderate–moderate Albizia procera False lebbeck 5 1 10 2 64 1Alhagi maurorum Camelthorn bush 5 2 10 10 79 1Anacardium occidentale Cashew nut 5 1 10 1 63Callistemon rigidus Sitt-leavedbottlebrush 0 1 10 1 45 ProposedCatharanthus roseus Madagascar periwinkle 0 2 10 3 51Cestrum parqui Chilean cestrum 10 3 10 1 91 1Cynodon nlemfuensis East African couch 5 2 10 10 76Cytisus monspessulanus Montpellier broom 5 0 10 4 66 1Duranta erecta Forget-me-not 0 1 10 1 44 ProposedEriobotrya japonica Loquat 0 2 10 0 50 3Ficus carica Fig 0 2 10 0 50Gleditsia triacanthos Honey locust 5 2 10 1 68 2Leucaena leucocephala Leucaena 5 3 4 3 52 1Mangifera indica Mango 0 1 10 0 46Montanoa hibiscifolia Tree daisy 0 1 10 1 44 1Passiflora edulis Passion fruit 0 2 10 1 50Passiflora subpeltata Granadina 0 1 10 1 46 1Physalis peruviana Cape gooseberry 0 2 10 5 54Phytolacca octandra Forest inkberry 0 2 10 6 55Pyracantha crenulata Himalayan firethorn 5 1 10 8 73 3
Continued on p. 64
64 South African Journal of Science 100, January/February 2004 Working for Water
Habitat–propagule Scientific name Common name Impact Weediness Biocontrol % Weedy Combined CARApool size relatives score category
Moderate–moderate Senna bicapsularis Rambling cassia 5 0 10 1 62 3Senna pendula var. glabrata Rambling cassia 5 2 10 1 68 3Sesbania bispinosa var. Spiny sesbania 0 0 10 4 45
bispinosaSophora japonica Japanese pagoda tree 0 0 10 2 42Syzygium cumini Jambolan 5 1 10 0 66 3Syzygium jambos Rose apple 5 1 10 0 66 3Tithonia diversifolia Mexican sunflower 0 1 10 3 48 1Ulmus parvifolia Chinese elm 0 0 10 5 46Verbena brasiliensis Slender wild verbena 0 1 10 2 45
Riparian–large Canna indica Indian shot 5 2 10 10 79 1Canna x generalis Garden canna 5 1 10 10 72Casuarina cunninghamiana Beefwood 5 1 10 4 69 2Cortaderia jubata Purple Pampas 5 3 10 2 75 1Cortaderia selloana Pampas grass 5 5 10 2 81 1Oenothera biennis Evening primrose 5 1 10 4 67Populus deltoides Match poplar Proposed
Riparian–moderate Eucalyptus microtheca Coolabah 0 0 10 2 42Mimosa pigra Giant sensitive plant 5 4 10 1 76 3Myriophyllum spicatum Spiked water-milfoil 5 4 10 3 80 1Oenothera glazioviana Evening primrose 5 2 10 4 72Oenothera indecora Evening primrose 5 1 10 4 68Oenothera jamesii Giant evening primrose 5 0 10 4 64Oenothera laciniata Cutleaf evening primrose 5 1 10 4 67Oenothera tetraptera White evening primrose 5 0 10 4 66Parkinsonia aculeata Jerusalem thorn 5 1 10 0 66
Small–large Alpinia zerumbet Shell ginger 5 0 10 0 62Grevillea robusta Australian silky oak 5 2 10 0 67 3Quercus robur English oak 5 1 10 1 67
Appendix 2 (continued )
Targeting emerging weeds for biological control inSouth Africa: the benefits of halting the spread ofalien plants at an early stage of their invasion
T. Olckers
IntroductionBiological control of invasive alien plants was begun in South
Africa some 90 years ago and has an impressive record.1 In recentyears, much of the progress achieved here has been facilitated bythe Working for Water programme. This enterprise, togetherwith other factors that have influenced the success of weedbiological control in South Africa, are comprehensivelyreviewed elsewhere in this issue.2
One of the important features of the biological control ofweeds in South Africa has been the realization that the targetingof incipient weeds (that is, plants in an early stage of invasion)considerably enhances the prospects for success.3 However, thetargeting of emerging weeds has generally not been widelypractised internationally, largely because biological control isoften used as a last resort, when conventional methods of
Biological control against incipient, or emerging, weeds (plants inan early stage of invasion) has not been widely practised in manycountries, largely because limited budgets tend to be directed atinvasions that have already reached detrimental levels. Because ofrestricted funds and few opportunities for exploration abroad in thepast, South African practitioners of biological control have madethe most of their survey trips by collecting as many potentiallyuseful control agents, from as many target plants, as they could.Exploration for agents against high-priority weeds thus allowedsimultaneous collection of natural enemies of low-priority weeds inthe same region. These opportunistic programmes have beenbeneficial for South Africa in the management of invasive alienplants. In 2003, the Working for Water programme allocated fundsfor biological control programmes against five emerging weedspecies. This investment has, for the first time, given formalrecognition to the rationale of targeting incipient weeds and bodeswell for the future of biological weed control in South Africa. This
paper reviews cases where emerging weeds were targeted forbiological control in this country, the successes that were achieved,and the prospects for enhancing this approach in the future.
*Plant Protection Research Institute, Private Bag X6006, Hilton 3245, South Africa.E-mail: [email protected]