Embed Size (px)
Citation preview
386 IEEE TRANSACTIONS ON GEOSCIENCE AND REMOTE SENSING, VOL. 54, NO. 1, JANUARY 2016
A New Geostatistical Solution to RemoteSensing Image Downscaling
Qunming Wang, Member, IEEE, Wenzhong Shi, Peter M. Atkinson, and Eulogio Pardo-Igúzquiza
Abstract—The availability of the panchromatic (PAN) bandin remote sensing images gives birth to so-called image fusiontechniques for increasing the spatial resolution of images to that ofthe PAN band. The spatial resolution of such spatially sharpenedimages, such as for the MODIS and Landsat sensors, however,may not be sufficient to provide the required detailed land-cover/land-use information. This paper proposes an area-to-pointregression kriging (ATPRK)-based geostatistical solution to in-crease the spatial resolution of remote sensing images beyond thatof any input images, including the PAN band. The new approachis a two-stage approach, including covariate downscaling andATPRK-based image fusion. The new approach treats the PANband as the covariate and takes advantages of its textural in-formation. It explicitly accounts for the size of support, spatialcorrelation, and the point spread function of the sensor and has thecharacteristic of perfect coherence with the original coarse data.Moreover, the new downscaling approach can be extended readilyby incorporating other ancillary information. The proposed ap-proach was examined using both Landsat and MODIS images.The results show that it can produce more accurate sharpenedimages than four benchmark approaches.
Index Terms—Area-to-point regression kriging (ATPRK),downscaling, geostatistics, image fusion, Landsat Enhanced The-matic Mapper, Moderate Resolution Imaging Spectroradiometer(MODIS).
I. INTRODUCTION
THE Moderate Resolution Imaging Spectroradiometer(MODIS) and Landsat sensors can revisit the Earth reg-
ularly. Their products (i.e., MODIS and Landsat images) are
Manuscript received May 6, 2015; revised June 18, 2015; accepted July 15,2015. This work was supported in part by the Research Grants Council ofHong Kong under Grant PolyU 15223015 and Grant PolyU 5249/12E, bythe National Natural Science Foundation of China under Grant 41331175, bythe Leading Talent Project of the National Administration of Surveying underGrant K.SZ.XX.VTQA, and by the Ministry of Science and Technology ofChina under Grant 2012BAJ15B04 and Project 2012AA12A305. (Correspond-ing author: Wenzhong Shi.)
Q. Wang is with the Department of Land Surveying and Geo-Informatics,The Hong Kong Polytechnic University, Kowloon, Hong Kong (e-mail:[email protected]).
W. Shi is with The Hong Kong Polytechnic University, Kowloon, Hong Kong,and also with Wuhan University, Wuhan 430072, China (e-mail: [email protected]).
P. M. Atkinson is with the Faculty of Science and Technology, LancasterUniversity, Lancaster LA1 4YR, U.K., with the Faculty of Geosciences, Uni-versity of Utrecht, 3584 CS Utrecht, The Netherlands, with the School of Ge-ography, Archaeology and Palaeoecology, Queen’s University Belfast, BelfastBT7 1NN, U.K., and also with Geography and Environment, Universityof Southampton, Southampton SO17 1BJ, U.K. (e-mail: [email protected]).
E. Pardo-Igúzquiza is with Instituto Geológico y Minero de España,28003 Madrid, Spain (e-mail: [email protected]).
Color versions of one or more of the figures in this paper are available onlineat http://ieeexplore.ieee.org.
Digital Object Identifier 10.1109/TGRS.2015.2457672
freely available, and the swath is much wider than the com-mercial high-resolution images such as QuickBird, WorldView,and IKONOS. These advantages lead to the popular use ofMODIS and Landsat images in global land-cover/land-use(LCLU) monitoring, such as the use of 500-m MODIS data(i.e., bands 1–7) in detecting deforestation processes [1] and30-m Landsat data in detecting urbanization processes [2].However, they provide coarse spatial resolutions relative to therequirements of some applications within these domains. Forexample, deforestation generally occurs at a spatial resolutionfiner than the 500-m pixel size of MODIS, and changes in smallresidential buildings are usually at a resolution finer than the30-m pixel size of Landsat.
There is a great need for downscaling techniques that canincrease the spatial resolution of such data. MODIS bands 1and 2 have a 250-m spatial resolution, whereas Landsat En-hanced Thematic Mapper Plus (ETM+) images contain a 15-mpanchromatic (PAN) band. The fine spatial, but coarse spectral,resolution bands can be combined with coarse spatial, but finespectral, resolution bands to generate a fine spatial and spec-tral resolution image, using image fusion techniques such aspansharpening. A variety of image fusion algorithms have beendeveloped over the past decades, including the intensity–hue–saturation [3], Brovey [4], principal component analysis [5],wavelet transformation [6], [7], high-pass filter (HPF) [3], [7],and spare representation [8] methods, as well as the automatedstatistics-based fusion method implemented in PCI Geomatica[9]. It is beyond the scope of this paper to explicitly reviewexisting image fusion methods, but several reviews on suchapproaches exist [10]–[14].
Recently, the application of geostatistical solutions for im-age fusion-based downscaling has increased, based on theirsignificant advantage in preserving the spectral propertiesof the observed coarse images. Pardo-Iguzquiza et al. [15]sharpened Landsat images using a one-stage downscaling cok-riging (DSCK) method, in which each observed coarse bandwas considered as the primary variable and the fine PAN bandwas considered as the secondary variable. In their later work,DSCK was extended with a spatially adaptive filtering scheme[16]. In view of the complex cross-semivariogram modeling,Sales et al. [17] proposed a kriging with external drift (KED)approach to downscale MODIS images, which requires onlyautosemivariogram modeling and is easier to implement thanDSCK. KED, however, suffers from expensive computationalcost, as it needs to compute kriging weights locally for each finepixel [17]. Wang et al. [18] first introduced the area-to-point re-gression kriging (ATPRK) concept in a remote sensing contextand proposed it for MODIS image downscaling. ATPRK is fast,user friendly, and can readily incorporate fine spatial resolutioninformation provided by other supplementary data.
0196-2892 © 2015 IEEE. Personal use is permitted, but republication/redistribution requires IEEE permission.See http://www.ieee.org/publications_standards/publications/rights/index.html for more information.
WANG et al.: NEW GEOSTATISTICAL SOLUTION TO REMOTE SENSING IMAGE DOWNSCALING 387
The aforementioned image fusion approaches, including thegeostatistical solutions, were generally designed to downscalecoarse images to the spatial resolution of the PAN or PAN-like (i.e., band 1 or 2 in MODIS data; hereafter also PAN forsimplicity) bands. However, in many cases, the 250-m fusedMODIS and 15-m Landsat product may not be sufficient toprovide detailed LCLU information, as the size of the objectsof interest in MODIS or Landsat images may be smaller than250- or 15-m. In this case, it is necessary to develop down-scaling approaches that can predict pixel values at a spatialresolution finer than that of all available images, including thePAN band, to provide more LCLU information.
Atkinson et al. [19] extended the DSCK approach to caseswhere the pixel size to be predicted is smaller than that ofall input variables. The applicability of the extended DSCKapproach was demonstrated using a Landsat ETM+ data set.As aforementioned, however, DSCK requires complex semivar-iogram modeling, which makes it difficult to automate [17].
In pansharpening, it is of great interest to downscale theimages to spatial resolutions finer than that of PAN, which isparticularly significant for MODIS and Landsat data interpreta-tion. For clarity, hereafter, the observed bands to be fused, thePAN, and the target bands to be predicted are called the coarse,intermediate, and fine bands, respectively, according to theirrelative spatial resolutions. In this paper, as an alternative toDSCK, ATPRK is extended to the case where the intermediatePAN band is available as the covariate. It is an extension of theoriginal ATPRK approach developed in [18], where the targetvariables are of the same spatial resolution as the PAN band.Alternatively, the ATPRK-based downscaling approach in thispaper involves two stages. The covariates (e.g., the PAN image)are first downscaled to the target fine spatial resolution, andthen, the derived fine PAN image is used for ATPRK-basedsharpening.
ATPRK is a new image fusion approach, which consists ofregression modeling and area-to-point kriging (ATPK)-basedresidual downscaling [18]. It treats the PAN band as the co-variate and models the overall trend in the target variables (i.e.,fine pixels to be predicted) by regression. ATPRK is not only anewly developed regression kriging approach [20], [21] withATPK for kriging interpolation but also an enhanced ATPKapproach [22], [23] that incorporates fine spatial resolutionancillary data (e.g., the PAN band in pansharpening) throughregression modeling. The ATPRK-based downscaling approachproposed in this paper has the following properties andadvantages.
1) The use of intermediate spatial resolution covariates(e.g., the PAN image) can enhance the quality of fusedimages.
2) ATPRK accounts for the size of support, spatial correla-tion, and the point spread function (PSF) of the sensor.
3) ATPRK can perfectly preserve the spectral properties,that is, when upscaling the fused image to the originalcoarse spatial resolution, it is identical to the original oneacross all bands.
4) Different from DSCK in [19], ATPRK does not involvecross-semivariogram modeling, and the sizes of matricesin the kriging system are much smaller and, thus, moreuser friendly.
Fig. 1. Downscaling problem.
5) Other supplementary data at any spatial resolution finerthan the primary variables (i.e., the coarse image to bedownscaled) can be readily incorporated for possibleenhancement.
The remainder of this paper is organized as follows.Section II introduces the principles of the proposed ATPRK indetail. In Section III, experimental results for the MODIS andLandsat data sets are provided to demonstrate the applicabilityof the new approach. Section IV further discusses the proposedapproach, followed by a conclusion in Section V.
II. METHODS
A. Downscaling Problem
Let Z lV (xi) be the random variable of pixel V centered at
xi (i = 1, . . . ,M , where M is the number of pixels) in coarseband l and Zu(xj) be the random variable of pixel u centered atxj (j = 1, . . . ,MF 2, where F is the spatial resolution (zoom)ratio between the coarse and PAN bands) in the PAN band. Thenotations u and V denote the intermediate and coarse pixels,respectively. The objective of downscaling in this paper is topredict target variable Z l
v(x) (Sv < Su < SV , where Sv , Su,and SV are the sizes of pixels v, u, and V , respectively) for allfine pixels in all coarse bands. Fig. 1 sketches the downscalingproblem.
B. Downscaling Covariates in ATPRK
In ATPRK, the covariates are used for overall trend predic-tion of Z l
v(x) and play an important role in the downscalingprocess, as they provide valuable finer spatial resolution textureinformation than the observed coarse data. The covariates needto be at the same spatial resolution as the target variables. In thispaper, the covariates are proposed to be downscaled to the targetfine spatial resolution using general ATPK. For the MODISand Landsat images, this means using ATPK to downscale theintermediate PAN band Zu to fine PAN band Zv. In the MODISimages, there are two intermediate bands (bands 1 and 2). Foreach coarse band, we select one band as PAN by measuringthe spectral similarity [in terms of correlation coefficient (CC)]between it and the two intermediate bands, and the intermediateband with greater CC is selected as PAN.
ATPK refers to prediction on a support that is smallerthan that of the original data [24]. It is distinguished fromconventional centroid-based kriging, which ignores the spatialsupport and treats it always as equivalent to the observationsupport. ATPK explicitly accounts for the size of support, spa-tial correlation, and the PSF of the sensor. It predicts variables
388 IEEE TRANSACTIONS ON GEOSCIENCE AND REMOTE SENSING, VOL. 54, NO. 1, JANUARY 2016
from areal supports to points (i.e., pixels at the target fine spatialresolution in this paper) using semivariogram deconvolutionto parameterize the random function model and kriging forprediction. Moreover, another appealing advantage associatedwith ATPK is its coherence property [22], [23], that is, theoriginal coarse data can be perfectly preserved in predictions.The advantages encourage its development in downscaling.
Based on ATPK, the prediction for fine pixel v centered at aspecific location x0 in the PAN band (i.e., Zv(x0)) is a linearcombination of N intermediate observations in Zu, i.e.,
Zv(x0) =
N1∑i=1
λiZu(xi), s.t.N1∑i=1
λi = 1 (1)
in which λi is the weight for the ith intermediate pixel centeredat xi. The N1 pixels surround the pixel centered at x0, such asthe N1 = 5× 5 window of pixels. Thus, the spatial correlationbetween coarse pixels is accounted for in ATPK.
The task becomes the estimation of weights {λ1, . . . , λN1}
in (1). They are calculated by minimizing the prediction errorvariance, and the corresponding kriging system is
⎡⎢⎢⎢⎣γuu(x1,x1) . . . γuu(x1,xN1
) 1...
. . ....
...γuu(xN1
,x1) . . . γuu(xN1,xN1
) 11 . . . 1 0
⎤⎥⎥⎥⎦⎡⎢⎢⎢⎣λ1
...λN1
θ
⎤⎥⎥⎥⎦
=
⎡⎢⎢⎢⎣γvu(x0,x1)
...γvu(x0,xN1
)1
⎤⎥⎥⎥⎦ . (2)
In (2), γuu(xi,xj) is the intermediate-to-intermediate semi-variogram between intermediate pixels centered at xi and xj ,γvu(x,xj) is the fine-to-intermediate semivariogram betweenfine and intermediate pixels centered at x0 and xj , and θ is theLagrange multiplier.
Let s be the Euclidean distance between the centroidsof any two pixels, γvv(s) be the fine-to-fine semivariogrambetween two fine pixels, and hu(s) be the PSF. The fine-to-intermediate semivariogram γvu(s) and the intermediate-to-intermediate semivariogram γuu(s) in (2) are calculated byconvoluting γvv(s) with the PSF, i.e.,
γvu(s) = γvv(s)∗hu(s) (3)
γuu(s) = γvv(s)∗hu(s)
∗hu(−s) (4)
in which ∗ is the convolution operator.Based on the assumption that the pixel value is the average
of the fine pixel values within it, the PSF is
hu(x) =
{1Su
, if x ∈ u(x)
0, otherwise(5)
where u(x) is the spatial support of pixel u centered at x.Based on the PSF in (5), the calculation in (3) and (4) can be
further simplified as
γvu(x0,xj) =1
σ
σ∑m=1
γvv(sm) (6)
γuu(xi,xj) =1
σ2
σ∑m=1
σ∑m′=1
γvv(smm′). (7)
In (6) and (7), σ = Su/Sv is the pixel size (zoom) ratio betweenthe intermediate and fine pixels, sm is the distance between thecentroid x0 of fine pixel v and the centroid of any fine pixelwithin the intermediate pixel u centered at xj , and smm′ isthe distance between the centroid of any fine pixel within theintermediate pixel centered at xi and the centroid of any finepixel within the intermediate pixel centered at xj .
The fine-to-fine semivariogram γvv(s) in (6) and (7) isderived by deconvolution (also called deregularization in geo-statistics) of the intermediate (areal) semivariogram, denoted byγu(s), which is calculated directly from the known intermediatePAN band. Note that γu(s) is different from γuu(s): the latteris derived by convoluting γvv(s) [see (4)]. The regularizedsemivariogram γR
u (s) is calculated as
γRu (s) = γuu(s)− γuu(0). (8)
The objective of deconvolution is to estimate the optimalγvv(s), the regularized semivariogram of which approximatesγu(s).
In this paper, an empirical deconvolution approach is devel-oped. In semivariogram modeling, the fitted function is oftencharacterized by three parameters: nugget, sill, and range. Toease the computational burden, the assumption made in [15],[16], and [19] is adopted: there is zero nugget effect in thefine-to-fine semivariogram. The sill and range are determinedby referring to the known γu(s). First, a candidate pool offine-to-fine semivariograms is generated. For each parameterof γvv(s), two multipliers are empirically defined to generatean interval for selecting the optimal one. The interval for sillselection is set to between 1 and 3 times that of the sill of γu(s),whereas the interval for range selection is set to between 0.5 and2.5 times that of the range of γv(s). The step is 0.1. Second,each semivariogram characterized by the two parameters isconvolved to the regularized semivariogram according to (8).Finally, the optimal fine-to-fine semivariogram is determined asthe one with the parameter combination leading to the smallestdifference between γR
u (s) and the known γu(s).Note that the deconvolution approach presented above is
different from that in [25]. The former selects an optimal pa-rameter combination from the empirically predefined candidatepool by testing and comparison, and the solution space isconstrained. The deconvolution approach in [25], however, isiterative and fully automated, which seeks the optimal param-eter combination from the unconstrained solution space bysetting the initialization and stopping rules.
As seen from the deconvolution and convolution processesand (3), (4), and (8), the size of support and the PSF aretaken into account explicitly in ATPK. This is different fromconventional kriging-based interpolation that treats each ob-served areal unit (i.e., intermediate pixel here) as a centroid.Following the procedures introduced here, ATPK can be used
WANG et al.: NEW GEOSTATISTICAL SOLUTION TO REMOTE SENSING IMAGE DOWNSCALING 389
easily for downscaling multiple covariates (such as elevationdata and field measurement at a spatial resolution finer thanthe coarse image) in a more general case. For example, in thecase involving T groups of covariates with different spatialresolutions, each type of covariate can be downscaled to thetarget fine spatial resolution according to (1).
C. ATPRK-Based Image Fusion
After the covariates (e.g., PAN) are downscaled to the finespatial resolution, they are used to model the overall trend of thetarget variables Z l
v(x) via regression, followed by the postresid-ual downscaling step with ATPK in ATPRK. Suppose Z l
v1(x)
and Z lv2(x) are the predictions of the regression and ATPK-
derived residuals for coarse band l. The ATPRK prediction is
Z lv(x) = Z l
v1(x) + Z lv2(x). (9)
The two steps, i.e., regression modeling and residual downscal-ing, are introduced in the following.
1) Regression Modeling: This phase takes full advantage ofthe texture information in the fine PAN band. First, the fine PANband Zv is upscaled to ZV to match the spatial resolution ofeach coarse band. Second, the relationship between ZV and theobserved coarse band, for example, band l, is built by linearregression, i.e.,
Z lV (x) = alZV (x) + bl +R(x) (10)
where R(x) is a residual term, and the two coefficients al andbl can be estimated by ordinary least squares [26]. Based on theassumption of scale invariance, the regression model in (10) isthen used for regression prediction at a specific location x0 atfine spatial resolution (i.e., coefficients al and bl do not changewith the spatial resolution), by taking fine PAN band Zv as inputvariables, i.e.,
Z lv1(x) = alZv(x) + bl. (11)
The auxiliary information from other data (but after thedownscaling process in Section II-B) can be also favorablyincorporated into regression modeling, which involves multi-variate regression.
2) Residual Downscaling: Generally, the regression modelin (10) is bias, and there are residuals from the regression phase.The residuals at coarse spatial resolution, denoted by Z l
V 2(x),are calculated as
Z lV 2(x) = R(x) = Z l
V (x)− [alZV (x) + bl] . (12)
The regression-only approach in (11) fails to fully makeuse of the spectral information of the observed coarse data,and the prediction will lead to obvious spectral distortion. Asa complement to the regression step, ATPK-based residualdownscaling is performed as a postprocessing step to preservethe spectral properties of the coarse data. ATPK downscales thecoarse residuals Z l
V 2(x) to fine residuals Z lv2(x).
According to the theoretical basis of ATPK presented inSection II-B, the fine residual Z l
v2(x0) is calculated as
Z lv2(x0) =
N2∑i=1
βiZlV 2(xi), s.t.
N2∑i=1
βi = 1 (13)
where βi is the weight for the ith coarse pixel surroundingthe fine pixel centered at x0, and N2 is the number of coarseobservations. The weights {β1, . . . , βN2
} are obtained in thesame way as that illustrated in (2)–(8), which starts from fine-to-fine residual semivariogram estimation by deconvolution.
After the residual downscaling process is completed, the pre-diction is added back to the regression prediction to achieve thefinal ATPRK prediction, as shown in (9). ATPRK is conductedfor each coarse band in turn to produce a fused multispectralimage. The implementation of the proposed ATPRK approachthat downscales coarse images to a spatial resolution finer thanany of the input images is summarized as follows.
Stage 1. Downscaling intermediate covariates with ATPK.
1) Deconvolution for estimation of the fine-to-fine semivar-iogram γvv(s).
2) Calculation of γvu(s) and γuu(s) by (3) and (4).3) Calculation of the kriging weights {λ1, . . . , λN1
} by (2).4) Calculation of Zv(x0) by (1).
Stage 2. ATPRK using downscaled fine covariates.
1) Regression modeling by (11).2) ATPK-based residual downscaling by (13).3) Combination of regression predictions and downscaled
fine residuals by (9).4) Steps 1–3 are implemented for each coarse band.
In the proposed geostatistical solution to the downscalingproblem in Fig. 1, ATPK has twofold functions. It is not onlyused for downscaling the intermediate covariates but also usedfor downscaling the residuals from regression. ATPRK fallswithin the theoretical framework of ATPK, and the former isa special case of the latter: fine spatial resolution covariatesare incorporated into ATPK through regression modeling inATPRK [see (11)]. More precisely, when both coefficients aland bl in the regression model are 0, the coarse residualsZ lV 2(x) in (12) become the coarse variables ZV (x) in fact, and
correspondingly, ATPRK in this case becomes ATPK.
III. EXPERIMENTS
A. Data Sets and Experimental Setup
Two data sets, including a Landsat ETM+ data set anda MODIS data set, were used to examine the proposeddownscaling approach. The Landsat data set was supplied bythe Government of Canada through Natural Resources Canada,Earth Sciences Sector, Canada Centre for Remote Sensing. Thestudy area is a 15 km × 15 km area in Alberta in Canada. Weused 30-m green, red, and near-infrared bands (i.e., bands 2, 3,and 4) and 15-m PAN band 8 in the experiments. The 30-mbands and the PAN band contain 500 × 500 and 1000 × 1000pixels, respectively. The false color composite of the Landsatimage is shown in Fig. 2(a).
390 IEEE TRANSACTIONS ON GEOSCIENCE AND REMOTE SENSING, VOL. 54, NO. 1, JANUARY 2016
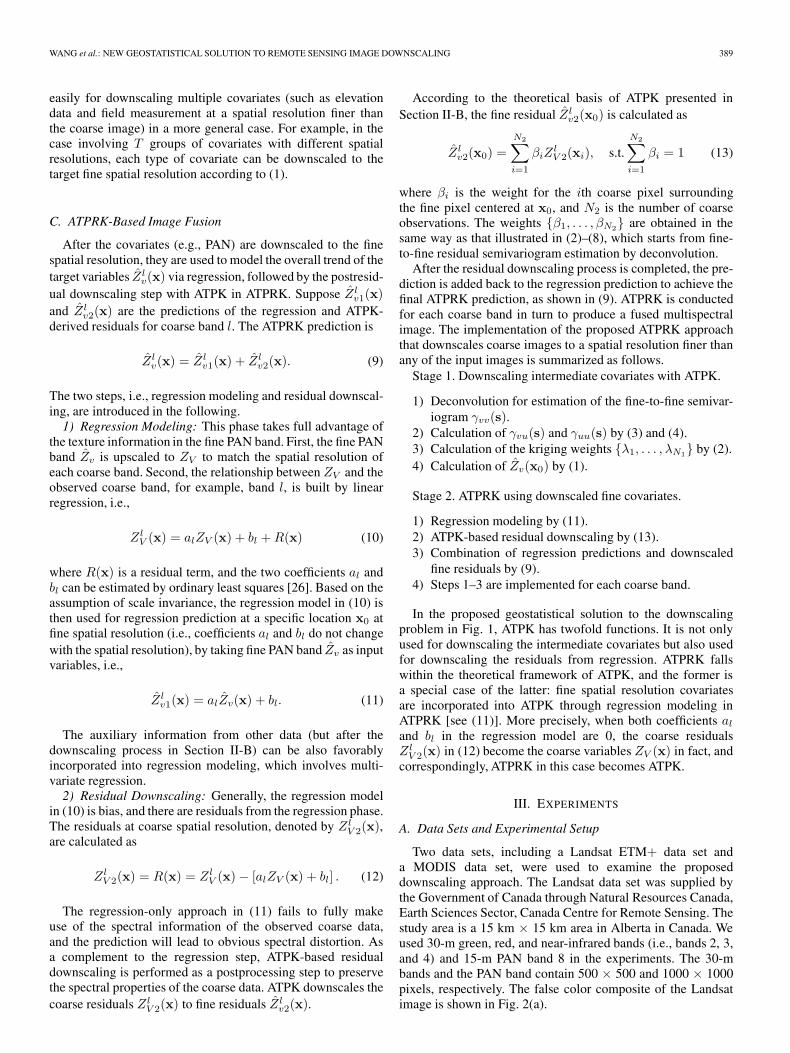
Fig. 2. Data sets used in the experiments. (a) 30-m Landsat data set (500 ×500 pixels; bands 4, 3, and 2 as RGB). (b) 500-m MODIS data set (1000 ×1000 pixels; bands 7, 6, and 4 as RGB).
The MODIS data set is a set of MODIS products, includ-ing MOD09GQ and MOD09GA. The MOD09GQ product ofbands 1 and 2 is provided at 250-m spatial resolution, whereasthe MOD09GA product of bands 3–7 is provided at 500-mspatial resolution. The study area is a 500 km × 500 km areaof tropical forest in the Brazilian Amazon. Correspondingly,bands 1 and 2 and bands 3–7 have a spatial size of 2000 × 2000pixels and 1000 × 1000 pixels, respectively. Fig. 2(b) shows thefalse color composite of the MODIS image. In the experiments,band 5 of the MODIS product MOD09GA was not considereddue to the striping artifacts in this band.
Based on the proposed ATPRK approach, the multispectralbands 2–4 in the Landsat image and the bands 3, 4, 6, and 7in the MODIS image can be downscaled to a spatial resolu-tion finer than 15- and 250-m, for example, 7.5- and 125-m,respectively. In this case, however, no reference at target finespatial resolution can be used to examine the downscalingresults objectively. For quantitative assessment, we upscaledthe 30-m Landsat and 500-m MODIS multispectral bands by afactor to synthesize coarse images. Taking the Landsat data setas an example for illustration, the 30-m bands 2–4 and the 15-mPAN band were simultaneously upscaled with a factor of 4 tocreate 120-m multispectral bands and a 60-m PAN band. Theobjective of downscaling in the experiments is then to restorethe 30-m fine Landsat image, taking the 120-m multispectralbands as observed coarse data and the 60-m intermediate PANas the covariate. This is the same case for the MODIS dataset, which was also upscaled to synthesize 2000-m coarse and1000-m intermediate images with a factor of 4, and the 500-mfine MODIS image needs to be predicted. The advantage ofusing synthetic images is that the reference data (i.e., 30-mLandsat and 500-m MODIS images) are known perfectly andcan be used objectively to assess the quality of the downscaledproducts.
Four downscaling approaches, including wavelets [7], HPF[3], KED [17], and DSCK [19], were used as benchmark al-gorithms to provide a systematic comparison and illustration ofthe benefits of the new approach. All methods aim to downscalethe observed coarse data to the target fine resolution (i.e., 30-mLandsat and 500-m MODIS images). For fair comparison, thefour two-stage pansharpening approaches, namely, wavelets,HPF, KED, and ATPRK, used the same ATPK-downscaled finePAN band (as illustrated in Section II-B) as input for the secondstage. DSCK is a one-stage approach, and it directly used theintermediate PAN as input [19].
The downscaling results were compared both visually andquantitatively. We used six indices for quantitative evaluation,
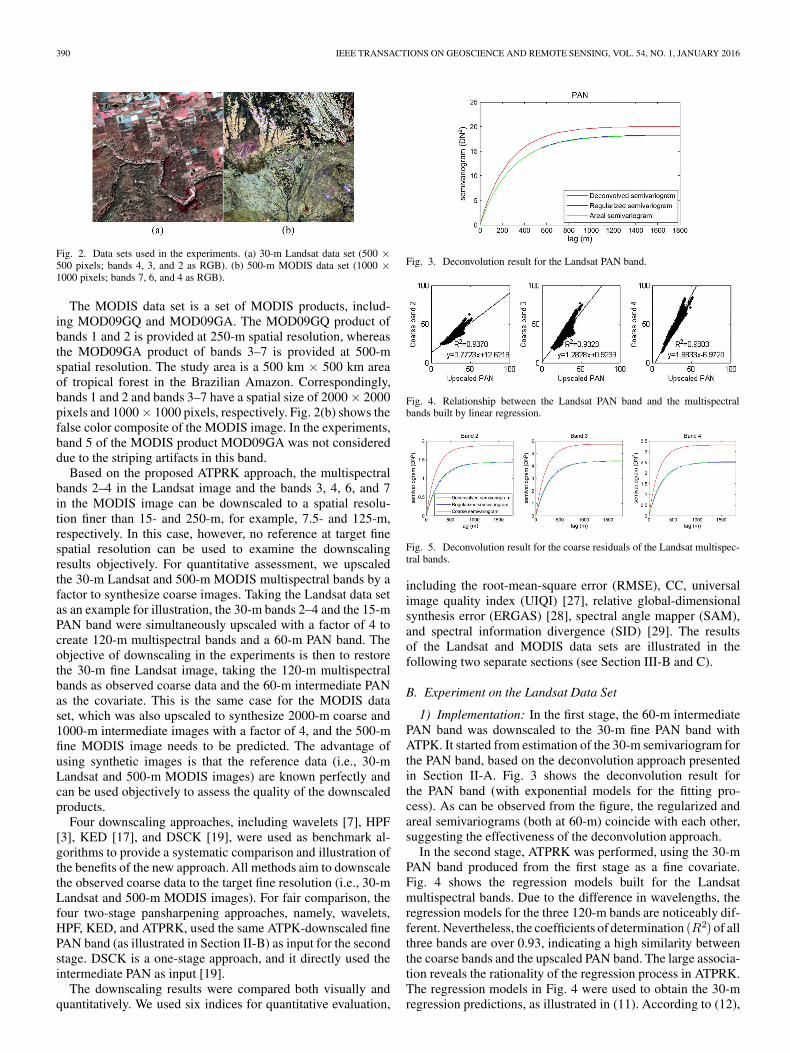
Fig. 3. Deconvolution result for the Landsat PAN band.
Fig. 4. Relationship between the Landsat PAN band and the multispectralbands built by linear regression.
Fig. 5. Deconvolution result for the coarse residuals of the Landsat multispec-tral bands.
including the root-mean-square error (RMSE), CC, universalimage quality index (UIQI) [27], relative global-dimensionalsynthesis error (ERGAS) [28], spectral angle mapper (SAM),and spectral information divergence (SID) [29]. The resultsof the Landsat and MODIS data sets are illustrated in thefollowing two separate sections (see Section III-B and C).
B. Experiment on the Landsat Data Set
1) Implementation: In the first stage, the 60-m intermediatePAN band was downscaled to the 30-m fine PAN band withATPK. It started from estimation of the 30-m semivariogram forthe PAN band, based on the deconvolution approach presentedin Section II-A. Fig. 3 shows the deconvolution result forthe PAN band (with exponential models for the fitting pro-cess). As can be observed from the figure, the regularized andareal semivariograms (both at 60-m) coincide with each other,suggesting the effectiveness of the deconvolution approach.
In the second stage, ATPRK was performed, using the 30-mPAN band produced from the first stage as a fine covariate.Fig. 4 shows the regression models built for the Landsatmultispectral bands. Due to the difference in wavelengths, theregression models for the three 120-m bands are noticeably dif-ferent. Nevertheless, the coefficients of determination (R2) of allthree bands are over 0.93, indicating a high similarity betweenthe coarse bands and the upscaled PAN band. The large associa-tion reveals the rationality of the regression process in ATPRK.The regression models in Fig. 4 were used to obtain the 30-mregression predictions, as illustrated in (11). According to (12),
WANG et al.: NEW GEOSTATISTICAL SOLUTION TO REMOTE SENSING IMAGE DOWNSCALING 391
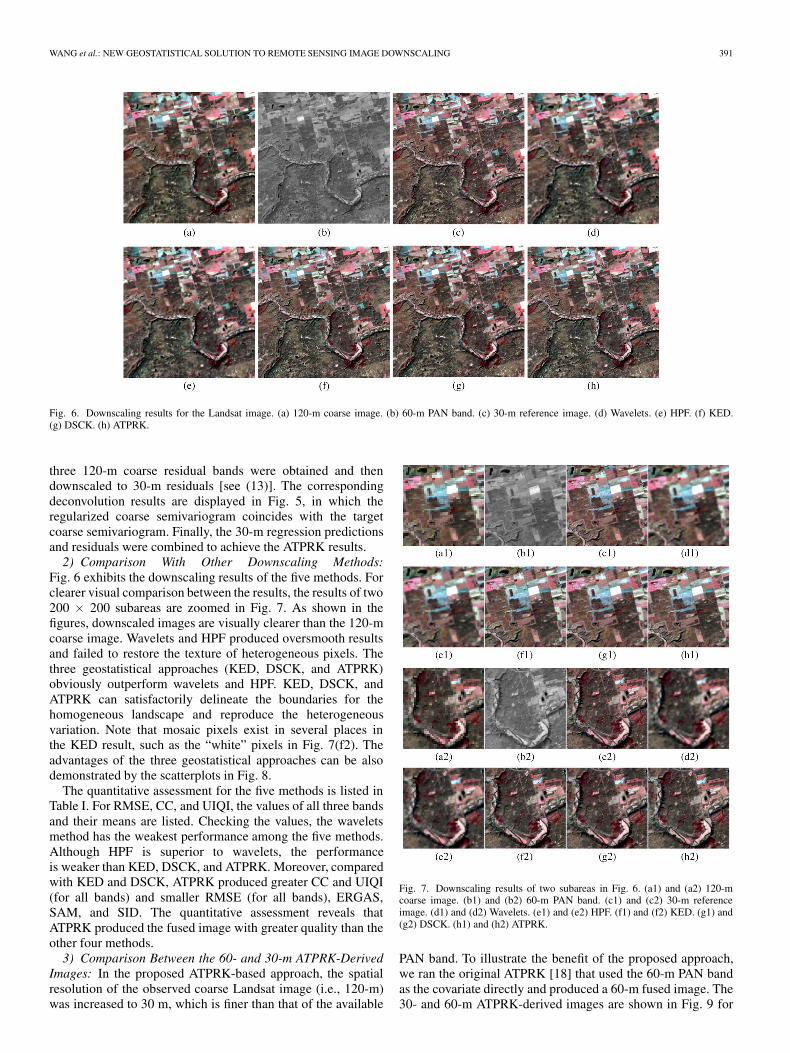
Fig. 6. Downscaling results for the Landsat image. (a) 120-m coarse image. (b) 60-m PAN band. (c) 30-m reference image. (d) Wavelets. (e) HPF. (f) KED.(g) DSCK. (h) ATPRK.
three 120-m coarse residual bands were obtained and thendownscaled to 30-m residuals [see (13)]. The correspondingdeconvolution results are displayed in Fig. 5, in which theregularized coarse semivariogram coincides with the targetcoarse semivariogram. Finally, the 30-m regression predictionsand residuals were combined to achieve the ATPRK results.
2) Comparison With Other Downscaling Methods:Fig. 6 exhibits the downscaling results of the five methods. Forclearer visual comparison between the results, the results of two200 × 200 subareas are zoomed in Fig. 7. As shown in thefigures, downscaled images are visually clearer than the 120-mcoarse image. Wavelets and HPF produced oversmooth resultsand failed to restore the texture of heterogeneous pixels. Thethree geostatistical approaches (KED, DSCK, and ATPRK)obviously outperform wavelets and HPF. KED, DSCK, andATPRK can satisfactorily delineate the boundaries for thehomogeneous landscape and reproduce the heterogeneousvariation. Note that mosaic pixels exist in several places inthe KED result, such as the “white” pixels in Fig. 7(f2). Theadvantages of the three geostatistical approaches can be alsodemonstrated by the scatterplots in Fig. 8.
The quantitative assessment for the five methods is listed inTable I. For RMSE, CC, and UIQI, the values of all three bandsand their means are listed. Checking the values, the waveletsmethod has the weakest performance among the five methods.Although HPF is superior to wavelets, the performanceis weaker than KED, DSCK, and ATPRK. Moreover, comparedwith KED and DSCK, ATPRK produced greater CC and UIQI(for all bands) and smaller RMSE (for all bands), ERGAS,SAM, and SID. The quantitative assessment reveals thatATPRK produced the fused image with greater quality than theother four methods.
3) Comparison Between the 60- and 30-m ATPRK-DerivedImages: In the proposed ATPRK-based approach, the spatialresolution of the observed coarse Landsat image (i.e., 120-m)was increased to 30 m, which is finer than that of the available
Fig. 7. Downscaling results of two subareas in Fig. 6. (a1) and (a2) 120-mcoarse image. (b1) and (b2) 60-m PAN band. (c1) and (c2) 30-m referenceimage. (d1) and (d2) Wavelets. (e1) and (e2) HPF. (f1) and (f2) KED. (g1) and(g2) DSCK. (h1) and (h2) ATPRK.
PAN band. To illustrate the benefit of the proposed approach,we ran the original ATPRK [18] that used the 60-m PAN bandas the covariate directly and produced a 60-m fused image. The30- and 60-m ATPRK-derived images are shown in Fig. 9 for
392 IEEE TRANSACTIONS ON GEOSCIENCE AND REMOTE SENSING, VOL. 54, NO. 1, JANUARY 2016
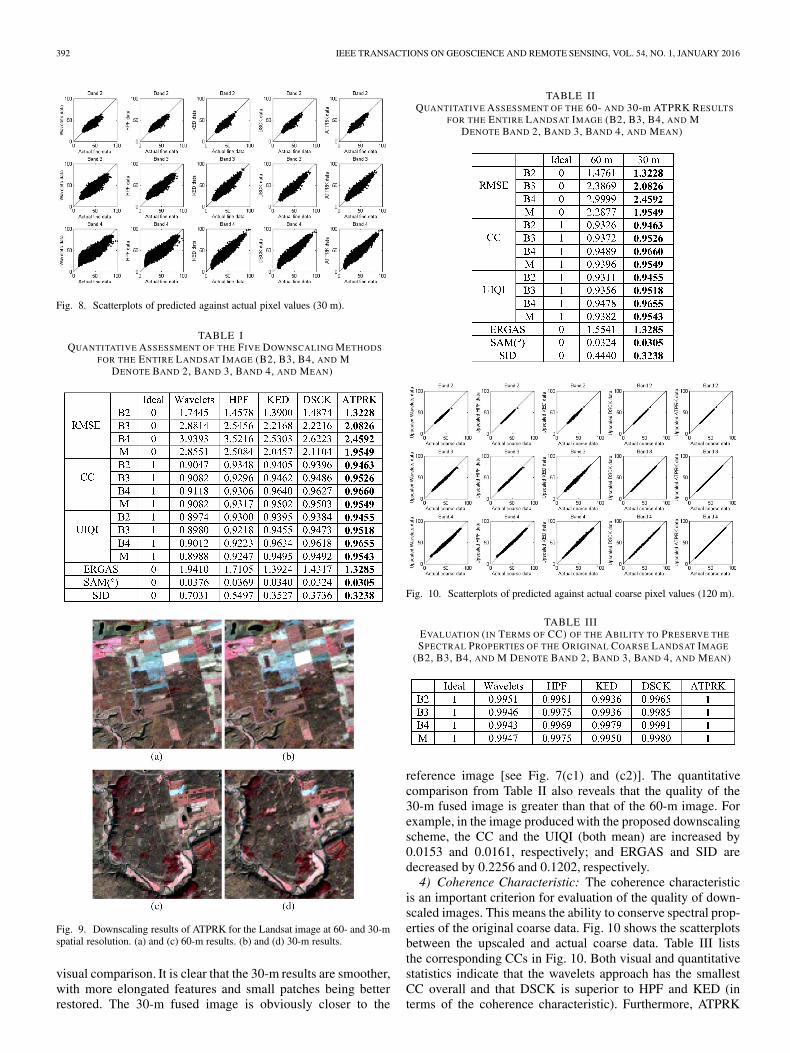
Fig. 8. Scatterplots of predicted against actual pixel values (30 m).
TABLE IQUANTITATIVE ASSESSMENT OF THE FIVE DOWNSCALING METHODS
FOR THE ENTIRE LANDSAT IMAGE (B2, B3, B4, AND MDENOTE BAND 2, BAND 3, BAND 4, AND MEAN)
Fig. 9. Downscaling results of ATPRK for the Landsat image at 60- and 30-mspatial resolution. (a) and (c) 60-m results. (b) and (d) 30-m results.
visual comparison. It is clear that the 30-m results are smoother,with more elongated features and small patches being betterrestored. The 30-m fused image is obviously closer to the
TABLE IIQUANTITATIVE ASSESSMENT OF THE 60- AND 30-m ATPRK RESULTS
FOR THE ENTIRE LANDSAT IMAGE (B2, B3, B4, AND MDENOTE BAND 2, BAND 3, BAND 4, AND MEAN)
Fig. 10. Scatterplots of predicted against actual coarse pixel values (120 m).
TABLE IIIEVALUATION (IN TERMS OF CC) OF THE ABILITY TO PRESERVE THESPECTRAL PROPERTIES OF THE ORIGINAL COARSE LANDSAT IMAGE
(B2, B3, B4, AND M DENOTE BAND 2, BAND 3, BAND 4, AND MEAN)
reference image [see Fig. 7(c1) and (c2)]. The quantitativecomparison from Table II also reveals that the quality of the30-m fused image is greater than that of the 60-m image. Forexample, in the image produced with the proposed downscalingscheme, the CC and the UIQI (both mean) are increased by0.0153 and 0.0161, respectively; and ERGAS and SID aredecreased by 0.2256 and 0.1202, respectively.
4) Coherence Characteristic: The coherence characteristicis an important criterion for evaluation of the quality of down-scaled images. This means the ability to conserve spectral prop-erties of the original coarse data. Fig. 10 shows the scatterplotsbetween the upscaled and actual coarse data. Table III liststhe corresponding CCs in Fig. 10. Both visual and quantitativestatistics indicate that the wavelets approach has the smallestCC overall and that DSCK is superior to HPF and KED (interms of the coherence characteristic). Furthermore, ATPRK
WANG et al.: NEW GEOSTATISTICAL SOLUTION TO REMOTE SENSING IMAGE DOWNSCALING 393
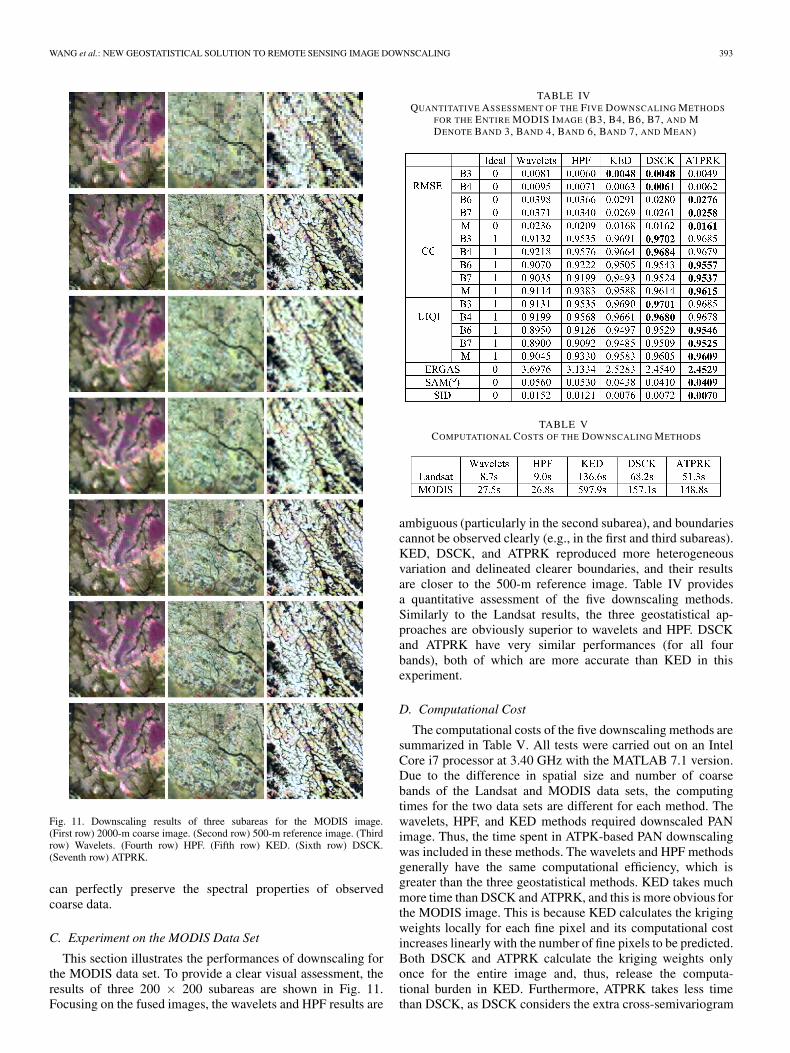
Fig. 11. Downscaling results of three subareas for the MODIS image.(First row) 2000-m coarse image. (Second row) 500-m reference image. (Thirdrow) Wavelets. (Fourth row) HPF. (Fifth row) KED. (Sixth row) DSCK.(Seventh row) ATPRK.
can perfectly preserve the spectral properties of observedcoarse data.
C. Experiment on the MODIS Data Set
This section illustrates the performances of downscaling forthe MODIS data set. To provide a clear visual assessment, theresults of three 200 × 200 subareas are shown in Fig. 11.Focusing on the fused images, the wavelets and HPF results are
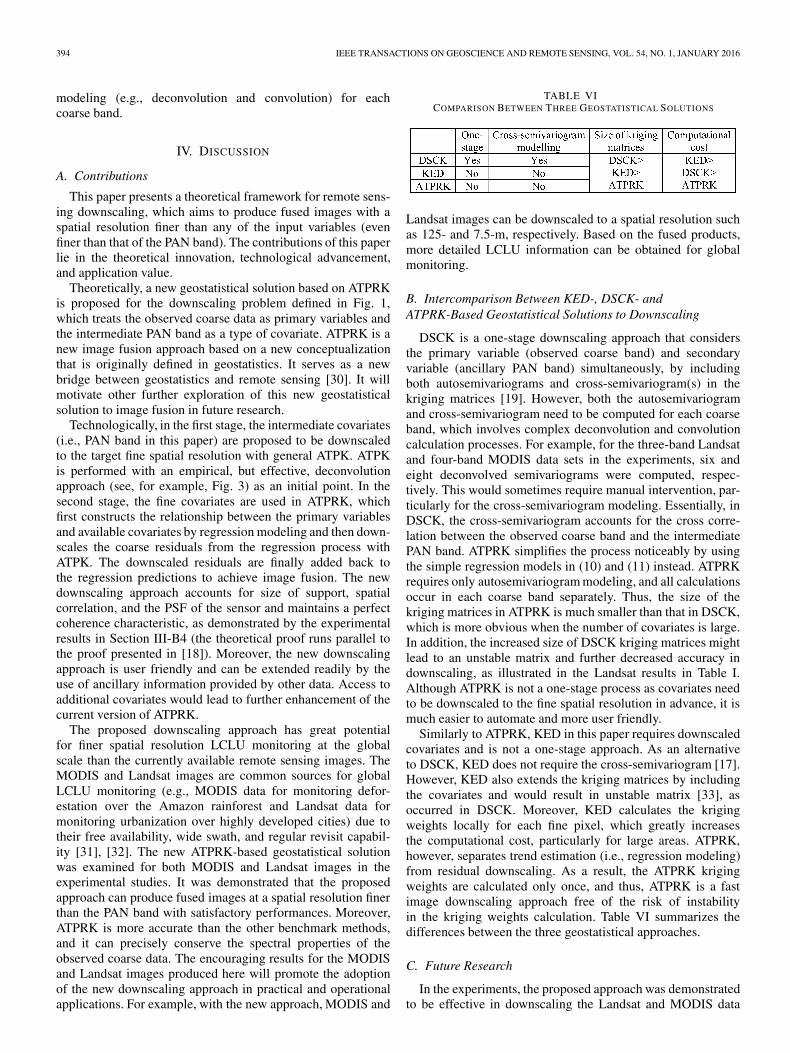
TABLE IVQUANTITATIVE ASSESSMENT OF THE FIVE DOWNSCALING METHODS
FOR THE ENTIRE MODIS IMAGE (B3, B4, B6, B7, AND MDENOTE BAND 3, BAND 4, BAND 6, BAND 7, AND MEAN)
TABLE VCOMPUTATIONAL COSTS OF THE DOWNSCALING METHODS
ambiguous (particularly in the second subarea), and boundariescannot be observed clearly (e.g., in the first and third subareas).KED, DSCK, and ATPRK reproduced more heterogeneousvariation and delineated clearer boundaries, and their resultsare closer to the 500-m reference image. Table IV providesa quantitative assessment of the five downscaling methods.Similarly to the Landsat results, the three geostatistical ap-proaches are obviously superior to wavelets and HPF. DSCKand ATPRK have very similar performances (for all fourbands), both of which are more accurate than KED in thisexperiment.
D. Computational Cost
The computational costs of the five downscaling methods aresummarized in Table V. All tests were carried out on an IntelCore i7 processor at 3.40 GHz with the MATLAB 7.1 version.Due to the difference in spatial size and number of coarsebands of the Landsat and MODIS data sets, the computingtimes for the two data sets are different for each method. Thewavelets, HPF, and KED methods required downscaled PANimage. Thus, the time spent in ATPK-based PAN downscalingwas included in these methods. The wavelets and HPF methodsgenerally have the same computational efficiency, which isgreater than the three geostatistical methods. KED takes muchmore time than DSCK and ATPRK, and this is more obvious forthe MODIS image. This is because KED calculates the krigingweights locally for each fine pixel and its computational costincreases linearly with the number of fine pixels to be predicted.Both DSCK and ATPRK calculate the kriging weights onlyonce for the entire image and, thus, release the computa-tional burden in KED. Furthermore, ATPRK takes less timethan DSCK, as DSCK considers the extra cross-semivariogram
394 IEEE TRANSACTIONS ON GEOSCIENCE AND REMOTE SENSING, VOL. 54, NO. 1, JANUARY 2016
modeling (e.g., deconvolution and convolution) for eachcoarse band.
IV. DISCUSSION
A. Contributions
This paper presents a theoretical framework for remote sens-ing downscaling, which aims to produce fused images with aspatial resolution finer than any of the input variables (evenfiner than that of the PAN band). The contributions of this paperlie in the theoretical innovation, technological advancement,and application value.
Theoretically, a new geostatistical solution based on ATPRKis proposed for the downscaling problem defined in Fig. 1,which treats the observed coarse data as primary variables andthe intermediate PAN band as a type of covariate. ATPRK is anew image fusion approach based on a new conceptualizationthat is originally defined in geostatistics. It serves as a newbridge between geostatistics and remote sensing [30]. It willmotivate other further exploration of this new geostatisticalsolution to image fusion in future research.
Technologically, in the first stage, the intermediate covariates(i.e., PAN band in this paper) are proposed to be downscaledto the target fine spatial resolution with general ATPK. ATPKis performed with an empirical, but effective, deconvolutionapproach (see, for example, Fig. 3) as an initial point. In thesecond stage, the fine covariates are used in ATPRK, whichfirst constructs the relationship between the primary variablesand available covariates by regression modeling and then down-scales the coarse residuals from the regression process withATPK. The downscaled residuals are finally added back tothe regression predictions to achieve image fusion. The newdownscaling approach accounts for size of support, spatialcorrelation, and the PSF of the sensor and maintains a perfectcoherence characteristic, as demonstrated by the experimentalresults in Section III-B4 (the theoretical proof runs parallel tothe proof presented in [18]). Moreover, the new downscalingapproach is user friendly and can be extended readily by theuse of ancillary information provided by other data. Access toadditional covariates would lead to further enhancement of thecurrent version of ATPRK.
The proposed downscaling approach has great potentialfor finer spatial resolution LCLU monitoring at the globalscale than the currently available remote sensing images. TheMODIS and Landsat images are common sources for globalLCLU monitoring (e.g., MODIS data for monitoring defor-estation over the Amazon rainforest and Landsat data formonitoring urbanization over highly developed cities) due totheir free availability, wide swath, and regular revisit capabil-ity [31], [32]. The new ATPRK-based geostatistical solutionwas examined for both MODIS and Landsat images in theexperimental studies. It was demonstrated that the proposedapproach can produce fused images at a spatial resolution finerthan the PAN band with satisfactory performances. Moreover,ATPRK is more accurate than the other benchmark methods,and it can precisely conserve the spectral properties of theobserved coarse data. The encouraging results for the MODISand Landsat images produced here will promote the adoptionof the new downscaling approach in practical and operationalapplications. For example, with the new approach, MODIS and
TABLE VICOMPARISON BETWEEN THREE GEOSTATISTICAL SOLUTIONS
Landsat images can be downscaled to a spatial resolution suchas 125- and 7.5-m, respectively. Based on the fused products,more detailed LCLU information can be obtained for globalmonitoring.
B. Intercomparison Between KED-, DSCK- andATPRK-Based Geostatistical Solutions to Downscaling
DSCK is a one-stage downscaling approach that considersthe primary variable (observed coarse band) and secondaryvariable (ancillary PAN band) simultaneously, by includingboth autosemivariograms and cross-semivariogram(s) in thekriging matrices [19]. However, both the autosemivariogramand cross-semivariogram need to be computed for each coarseband, which involves complex deconvolution and convolutioncalculation processes. For example, for the three-band Landsatand four-band MODIS data sets in the experiments, six andeight deconvolved semivariograms were computed, respec-tively. This would sometimes require manual intervention, par-ticularly for the cross-semivariogram modeling. Essentially, inDSCK, the cross-semivariogram accounts for the cross corre-lation between the observed coarse band and the intermediatePAN band. ATPRK simplifies the process noticeably by usingthe simple regression models in (10) and (11) instead. ATPRKrequires only autosemivariogram modeling, and all calculationsoccur in each coarse band separately. Thus, the size of thekriging matrices in ATPRK is much smaller than that in DSCK,which is more obvious when the number of covariates is large.In addition, the increased size of DSCK kriging matrices mightlead to an unstable matrix and further decreased accuracy indownscaling, as illustrated in the Landsat results in Table I.Although ATPRK is not a one-stage process as covariates needto be downscaled to the fine spatial resolution in advance, it ismuch easier to automate and more user friendly.
Similarly to ATPRK, KED in this paper requires downscaledcovariates and is not a one-stage approach. As an alternativeto DSCK, KED does not require the cross-semivariogram [17].However, KED also extends the kriging matrices by includingthe covariates and would result in unstable matrix [33], asoccurred in DSCK. Moreover, KED calculates the krigingweights locally for each fine pixel, which greatly increasesthe computational cost, particularly for large areas. ATPRK,however, separates trend estimation (i.e., regression modeling)from residual downscaling. As a result, the ATPRK krigingweights are calculated only once, and thus, ATPRK is a fastimage downscaling approach free of the risk of instabilityin the kriging weights calculation. Table VI summarizes thedifferences between the three geostatistical approaches.
C. Future Research
In the experiments, the proposed approach was demonstratedto be effective in downscaling the Landsat and MODIS data
WANG et al.: NEW GEOSTATISTICAL SOLUTION TO REMOTE SENSING IMAGE DOWNSCALING 395
sets. The encouraging results for the two types of images withdifferent spatial resolutions will motivate its application to moretypes of remote sensing images, including very high resolutionremote sensing products (such as IKONOS, QuickBird, andWorldView) [34], [35] and hyperspectral images [12], [36],[37]. This has been a lively topic in the remote sensing com-munity in recent years.
In ATPRK, ATPK-based residual downscaling satisfactorilycompensates for the residuals from regression to the fine pix-els. In the regression part, based on the hypothesis of scaleinvariance, the regression model fitted at coarse spatial reso-lution in (10) is used for regression prediction at fine spatialresolution, as shown in (11). This hypothesis may work betterfor homogeneous pixels. For heterogeneous pixels, where thespatial pattern changes sharply, the regression model in (10)might be insufficient for characterizing the relationship at finespatial resolution. As observed from Fig. 4, the linear regressionmay sometimes not be sufficient to model the relationshipbetween the covariate and the observed coarse data. It wouldbe worthwhile to develop new regression models (e.g., spatiallyadaptive regression model that can separate homogeneous andheterogeneous pixels) with more powerful modeling ability forfurther possible enhancement of ATPRK.
The proposed approach allows the use of multiple covariateswith different intermediate spatial resolutions. Specifically, themultiple covariates can be downscaled separately to the targetfine spatial resolution according to (1). The relationship be-tween the multiple fine covariates and observed coarse datacan be built via multivariate regression, a process similar tothat in (10) and (11). Theoretically, the proposed approach candownscale the coarse multispectral bands to a spatial resolution(denoted by A m) finer than that of the covariates with thefinest spatial resolution (denoted by B m). However, the zoomratio B/A should not be too large, and generally, a zoom factorbetween 2 and 4 is suggested. This is because downscaling is es-sentially an ill-posed problem, and as the zoom ratio increases,the number of subpixels to be predicted within each coarsepixel increases quadratically, which increases the uncertaintyin downscaling. The ease of incorporating multiple covariatesprovides an interesting avenue for future research, where morerelevant information on the studied areas is encouraged to besought.
V. CONCLUSION
In this paper, an ATPRK-based geostatistical solution hasbeen proposed to downscale remote sensing images to a spatialresolution finer than that of any of the input images. ThePAN band is considered as an intermediate covariate, andits spatial resolution is increased to the target fine spatialresolution with general ATPK. The ATPK-derived fine PANband is used by ATPRK to sharpen the coarse bands, whichconsists of regression modeling between the fine PAN andobserved coarse bands and ATPK-based residual downscaling.The proposed approach was tested using a Landsat data set anda MODIS data set. The conclusions from the experiments aresummarized as follows: 1) Compared with the original ATPRKapproach that produces sharpened images with the same spa-tial resolution as the PAN band [18], the new ATPRK-basedgeostatistical solution can produce sharpened images at afiner spatial resolution with greater quality in terms of
the six indices (i.e., RMSE, CC, UIQI, ERGAS, SAM,and SID). 2) Compared with wavelets, HPF, KED, and DSCK,ATPRK is able to produce more accurate fused images in termsof the six indices. 3) ATPRK can precisely conserve the spectralcontent of the original coarse images.
ACKNOWLEDGMENT
The authors would like to thank the handling editor andanonymous reviewers for their valuable and constructive com-ments, which greatly improved this paper. P. M. Atkinsonwould like to thank the University of Utrecht for supportinghim with The Belle van Zuylen Chair.
REFERENCES
[1] M. C. Hansen, Y. E. Shimabukuro, P. Potapov, and K. Pittman, “Compar-ing annual MODIS and PRODES forest cover change data for advancingmonitoring of Brazilian forest cover,” Remote Sens. Environ., vol. 112,no. 10, pp. 3784–3793, Oct. 2008.
[2] M. Castrence, D. H. Nong, C. C. Tran, L. Young, and J. Fox, “Mappingurban transitions using multi-temporal Landsat and DMSP-OLS night-time lights imagery of the red river delta in Vietnam,” Land, vol. 3, no. 1,pp. 148–166, Feb. 2014.
[3] P. S. Chavez, Jr., S. C. Sides, and J. A. Anderson, “Comparison ofthree different methods to merge multiresolution and multispectral data:Landsat TM and SPOT panchromatic,” Photogramm. Eng. Remote Sens.,vol. 57, no. 3, pp. 295–303, Mar. 1991.
[4] A. R. Gillespie, A. B. Kahle, and R. E. Walker, “Color enhancement ofhighly correlated images—II. Channel ratio and ‘chromaticity’ transfor-mation techniques,” Remote Sens. Environ., vol. 22, no. 3, pp. 343–365,Aug. 1987.
[5] V. K. Shettigara, “A generalized component substitution technique forspatial enhancement of multispectral images using a higher resolutiondata set,” Photogramm. Eng. Remote Sens., vol. 58, no. 5, pp. 561–567,May 1992.
[6] J. Nunez et al., “Multiresolution-based image fusion with additive waveletdecomposition,” IEEE Trans. Geosci. Remote Sens., vol. 37, no. 3,pp. 1204–1211, May 1999.
[7] B. Aiazzi, L. Alparone, S. Baronti, and A. Garzelli, “Context-driven fu-sion of high spatial and spectral resolution images based on oversampledmulti-resolution analysis,” IEEE Trans. Geosci. Remote Sens., vol. 40,no. 10, pp. 2300–2312, Oct. 2002.
[8] Q. Wei, J. Bioucas-Dias, N. Dobigeon, and J. Tourneret, “Hyperspectraland multispectral image fusion based on a sparse representation,” IEEETrans. Geosci. Remote Sens., vol. 53, no. 7, pp. 3658–3668, Jul. 2015.
[9] Y. Zhang, “Understanding image fusion,” Photogramm. Eng. RemoteSens., vol. 70, no. 6, pp. 657–661, Jun. 2004.
[10] C. Pohl and J. L. Van Genderen, “Review article multisensor image fusionin remote sensing: Concepts, methods and applications,” Int. J. RemoteSens., vol. 19, no. 5, 823–854, Jan. 1998.
[11] Z. Wang, D. Ziou, C. Armenakis, D. Li, and Q. Li, “A comparativeanalysis of image fusion methods,” IEEE Trans. Geosci. Remote Sens.,vol. 43, no. 6, pp. 1391–1402, Jun. 2005.
[12] J. Bioucas-Dias et al., “Hyperspectral remote sensing data analysis andfuture challenges,” IEEE Geosci. Remote Sens. Mag., vol. 1, no. 2,pp. 6–36, Jun. 2013.
[13] G. Vivone et al., “A critical comparison among pansharpening algo-rithms,” IEEE Trans. Geosci. Remote Sens., vol. 53, no. 5, pp. 2565–2586,May 2015.
[14] J. Zhang, “Multi-source remote sensing data fusion: Status and trends,”Int. J. Image Data Fusion, vol. 1, no. 1, pp. 5–24, Mar. 2010.
[15] E. Pardo-Igúzquiza, M. Chica-Olmo, and P. M. Atkinson, “Downscalingcokriging for image sharpening,” Remote Sens. Environ., vol. 102, no. 1/2,pp. 86–98, May 2006.
[16] E. Pardo-Iguzquiza, V. F. Rodríguez-Galiano, M. Chica-Olmo, andP. M. Atkinson, “Image fusion by spatially adaptive filtering using down-scaling cokriging,” ISPRS J. Photogramm. Remote Sens., vol. 66, no. 3,pp. 337–346, May 2011.
[17] M. H. R. Sales, C. M. Souza, Jr., and P. C. Kyriakidis, “Fusion of MODISimages using kriging with external drift,” IEEE Trans. Geosci. RemoteSens., vol. 51, no. 4, pp. 2250–2259, Apr. 2013.
[18] Q. Wang, W. Shi, P. M. Atkinson, and Y. Zhao. Downscaling MODISimages with area-to-point regression kriging. Remote Sens. Environ.,vol. 166, pp. 191–204, Sep. 2015.
396 IEEE TRANSACTIONS ON GEOSCIENCE AND REMOTE SENSING, VOL. 54, NO. 1, JANUARY 2016
[19] P. M. Atkinson, E. Pardo-Igúzquiza, and M. Chica-Olmo, “Downscalingcokriging for super-resolution mapping of continua in remotely sensedimages,” IEEE Trans. Geosci. Remote Sens., vol. 46, no. 2, pp. 573–580,Feb. 2008.
[20] T. Hengl, G. B. M. Heuvelink, and A. Stein, “A generic frameworkfor spatial prediction of soil variables based on regression-kriging,”Geoderma, vol. 120, no. 1/2, pp. 75–93, May 2004.
[21] T. Hengl, G. B. M. Heuvelink, and D. G. Rossiter, “About regression-kriging: From equations to case studies,” Comput. Geosci., vol. 33,no. 10, pp. 1301–1315, Oct. 2007.
[22] P. Kyriakidis and E.-H. Yoo, “Geostatistical prediction and simulationof point values from areal data,” Geograph. Anal., vol. 37, no. 2,pp. 124–151, Apr. 2005.
[23] P. C. Kyriakidis, “A geostatistical framework for area-to-point spatialinterpolation,” Geograph. Anal., vol. 36, no. 3, pp. 259–289, Jul. 2004.
[24] P. M. Atkinson, “Downscaling in remote sensing,” Int. J. Appl. EarthObserv. Geoinf., vol. 22, pp. 106–114, Jun. 2013.
[25] P. Goovaerts, “Kriging and semivariogram deconvolution in presence ofirregular geographical units,” Math. Geosci., vol. 40, no. 1, pp. 101–128,2008.
[26] P. Kitanidis, “Generalized covariance functions in estimation,” Math.Geol., vol. 25, no. 5, pp. 525–540, Jul. 1994.
[27] Z. Wang and A. C. Bovik, “A universal image quality index,” IEEE SignalProcess. Lett., vol. 9, no. 3, pp. 81–84, Mar. 2002.
[28] T. Ranchin and L. Wald, “Fusion of high spatial and spectral resolutionimages: The ARSIS concept and its implementation,” Photogramm. Eng.Remote Sens., vol. 66, no. 1, pp. 49–61, Jan. 2000.
[29] C. Chang, “Spectral information divergence for hyperspectral image anal-ysis,” in Proc. IEEE Int. Geosci. Remote Sens. Symp., 1999, vol. 1,pp. 509–511.
[30] F. D. van der Meer, “Remote-sensing image analysis and geostatistics,”Int. J. Remote Sens., vol. 33, no. 18, pp. 5644–5676, Sep. 2012.
[31] Q. Wang, P. M. Atkinson, and W. Shi, “Fast subpixel mapping algorithmsfor subpixel resolution change detection,” IEEE Trans. Geosci. RemoteSens., vol. 53, no. 4, pp. 1692–1706, Apr. 2015.
[32] Q. Wang, W. Shi, P. M. Atkinson, and Z. Li, “Land cover change detectionat subpixel resolution with a Hopfield neural network,” IEEE J. Sel.Topics Appl. Earth Observ. Remote Sens., vol. 8, no. 3, pp. 1339–1352,Mar. 2015.
[33] P. Goovaerts, Geostatistics for Natural Resources Evaluation. London,U.K.: Oxford Univ. Press, 1997.
[34] L. Alparone et al., “Comparison of pansharpening algorithms: Outcomeof the 2006 GRS-S data-fusion contest,” IEEE Trans. Geosci. RemoteSens., vol. 46, no. 10, pp. 3012–3021, Oct. 2007.
[35] L. Zhang, H. Shen, W. Gong, and H. Zhang, “Adjustable model-basedfusion method for multispectral and panchromatic images,” IEEE Trans.Syst., Man, Cybern. B, Cybern., vol. 42, no. 6, pp. 1693–1704, Dec. 2012.
[36] G. A. Licciardi et al., “Fusion of hyperspectral and panchromatic im-ages using multiresolution analysis and nonlinear PCA band reduction,”EURASIP J. Adv. Signal Process., vol. 2012, no. 1, pp. 207:1–207:17,Sep. 2012.
[37] L. Loncan et al., “Hyperspectral pansharpening: A review,” IEEE Geosci.Remote Sens. Mag., vol. 3, no. 3, pp. 27–46, Sep. 2015.
Qunming Wang (M’15) received the B.S. degreeand M.S. degree from Harbin Engineering Univer-sity, China, in 2010 and 2012, and the Ph.D. de-gree from The Hong Kong Polytechnic University,Hong Kong, in 2015. He is now a Senior Re-search Associate in Lancaster Environment Centre,Lancaster University, U.K.
From June to December 2013, he was a VisitingPh.D. Student with Geography and Environment,University of Southampton, Southampton, U.K.He has authored or coauthored over 20 peer-reviewed
articles in international journals such as Remote Sensing of Environment, theIEEE TRANSACTIONS ON GEOSCIENCE AND REMOTE SENSING, and ISPRSJournal of Photogrammetry and Remote Sensing. His current research interestsfocus on remote sensing image analysis and geostatistics.
Dr. Wang serves as a reviewer for over ten international journals. He wasawarded the hypercompetitive Hong Kong Ph.D. Fellowship to support histhree-year Ph.D. study. He was a recipient of the Excellent Master DissertationAward and the Excellent Graduates in Heilongjiang Province, China, in 2012.
Wenzhong Shi received the Ph.D. degree fromOsnabrück University, Vechta, Germany, in 1994.
He is currently a Chair Professor of geograph-ical information science (GIS) and remote sensingand the Head of the Department of Land Surveyingand Geo-Informatics, The Hong Kong PolytechnicUniversity, Kowloon, Hong Kong. He is also cur-rently with Wuhan University, Wuhan, China. He hasauthored or coauthored over 130 Science CitationIndex papers and ten books. His current researchinterests include GIS and remote sensing, uncertainty
and spatial data quality control, and image processing for high-resolutionsatellite images.
Prof. Shi was a recipient of the State Natural Science Award from the StateCouncil of China in 2007 and The Wang Zhizhuo Award from the InternationalSociety for Photogrammetry and Remote Sensing in 2012.
Peter M. Atkinson received the B.Sc. degree ingeography from The University of Nottingham,Nottingham, U.K., in 1986, the Ph.D. degree fromThe University of Sheffield (NERC CASE awardwith Rothamsted Experimental Station), Sheffield,U.K., in 1990, and the MBA degree from the Univer-sity of Southampton, Southampton, U.K., in 2012.
He is currently the Dean of the Faculty of Scienceand Technology, Lancaster University, Lancaster,U.K. He has been a Professor of geography withthe University Southampton (for the last 21 years;
13 years as Professor), where he is currently Visiting Professor. He is alsocurrently a holder of the Belle van Zuylen Chair in the Faculty of Geoscienceswith Utrecht University, Utrecht, The Netherlands, and a Visiting Professorwith Queen’s University Belfast, Belfast, U.K. He has authored or coauthoredaround 200 peer-reviewed articles in international scientific journals and around50 refereed book chapters. He has also edited nine journal special issues andeight books. The main focus of his research is in remote sensing, geographicalinformation science, and spatial (and space–time) statistics applied to a rangeof environmental science and socioeconomic problems.
Dr. Atkinson is an Associate Editor of Computers and Geosciences andsits on the editorial boards of several other journals, including GeographicalAnalysis, Spatial Statistics, the International Journal of Applied Earth Obser-vation and Geoinformation, and Environmental Informatics. He sits on variousinternational scientific committees.
Eulogio Pardo-Igúzquiza received the Ph.D. de-gree in geology and statistics from the University ofGranada, Granada, Spain, in 1991.
In 1995, he was awarded a two-year postdoctoralgrant by the Spanish Ministry of Science and Edu-cation. In 1997, he was awarded a two-year MarieCurie fellowship by the European Union to under-take research at the University of Reading, Reading,U.K. In 2000, he moved to Universidad Politécnicade Cataluña, Barcelona, Spain. In July 2003, he wasawarded a Ramón y Cajal fellowship to undertake
research at the University of Granada. During this time, he paid short visits toSouthampton and the Department of Statistics at Leeds. He obtained the postof Lecturer at the University of Granada in 2008. In 2010, he moved to Madridto take up a position as Research Scientist at the Geological Survey of Spain,Madrid, Spain. He has recently published Geomatemáticas, a popular sciencebook on geomathematics.
Dr. Pardo-Igúzquiza is the Editor-in-Chief of Boletín Geológico y Minero.