Embed Size (px)
Citation preview
Measurement 58 (2014) 61–67
Contents lists available at ScienceDirect
Measurement
journal homepage: www.elsevier .com/ locate/measurement
A new correlation for wet gas flow rate measurement withVenturi meter based on two-phase mass flow coefficient
http://dx.doi.org/10.1016/j.measurement.2014.08.0140263-2241/Crown Copyright � 2014 Published by Elsevier Ltd. All rights reserved.
⇑ Corresponding author.E-mail address: [email protected] (B. Bai).
Denghui He, Bofeng Bai ⇑State Key Laboratory of Multiphase Flow in Power Engineering, Xi’an Jiaotong University, Xi’an 710049, China
a r t i c l e i n f o a b s t r a c t
Article history:Received 20 January 2014Received in revised form 3 July 2014Accepted 1 August 2014Available online 21 August 2014
Keywords:Venturi meterMeasurement correlationWet gas flow rateTwo-phase flow
Much attention has been devoted to the study of the correlation of the wet gas flow ratemeasurement with a Venturi meter. However, up to now a widely-accepted correlationor model is not available. In this study, a new correlation for wet gas flow rate measure-ment with Venturi meter based on a two-phase mass flow coefficient was proposed. Thetwo-phase mass flow coefficient was found to linearly increase with the Lockhart–Martinelli parameter and decrease with the increase of the gas-to-liquid density ratio. Italso decreased with the gas densiometric Froude number increasing. The relationships ofthe two-phase mass flow coefficient with the Lockhart–Martinelli parameter, the gasdensiometric Froude number and the ratio of gas to liquid density were concluded. Com-parisons with the existing correlations showed that the new correlation predicted thewet gas flow rate more accurately than other correlations under the following conditions:the Lockhart–Martinelli parameter ranging from 0 to 0.3, the gas densiometric Froudenumber from 0.6 to 4.7, the ratio of gas to liquid density from 0.01 to 0.081 and the inletdiameter of the Venturi meter from 50 to 200 mm. The present work provided an alterna-tive approach to the study on the wet gas flow rate measurement with the Venturi meter.
Crown Copyright � 2014 Published by Elsevier Ltd. All rights reserved.
1. Introduction
Wet gas flow widely exists in industrial processes (e.g.,the petroleum industry, nuclear industry, chemical indus-try and metallurgical industry), and its measurement hasbeen paid much attention [1,2]. At present the measure-ment is implemented mostly with the Differential Pressure(DP) meters such as the Venturi meter, orifice plate meterand V-Cone meter [3]. It is generally accepted that theperformance of the DP meter is primarily affected by theLockhart–Martinelli parameter, the ratio of the gas toliquid density, the gas densiometric Froude number andthe diameter ratio. Wet gas correlations are available inthe literatures about the DP meters, the most well-knownof which are by Murdock [4], James [5], Smith and Leang
[6], Chisholm [7,8], Lin [9], de Leeuw [10] and Steven[11–13], and they are well summarized by He et al. [14],Tan and Dong [15] and Xu et al. [16].
As a tabulated DP meter, the Venturi meter distin-guishes itself in metering the dry gas flow rate; it alsobehaves well in the wet gas flow rate measurement [17].Most of the wet gas flow rate measurement prototypesand the marketed gas–liquid flow rate meters are basedon the Venturi meter. Xu et al. [18] developed a doubleDP wet gas flow rate metering device by using the Venturimeter and the V-Cone meter in series. Agar and Farchy [19]proposed a wet gas measurement method based on theVenturi meter and the sonar sensor. The Dualstream IIwet gas metering systems produced by the Solartron ISA[20] and the Agar Wet Gas Meter (WGM) provided by theAgar Corporation [21] made use of the double Venturimeters. The TEA Sistemi S.R.L. [22] and the Roxar FlowMeasurement [23] also developed wet gas meters by using
Nomenclature
English symbolsA area (m2)a slope in Eq. (9) (–)b intercept in Eq. (9) (–)Cd discharge coefficient of Venturi meter (–)D inlet diameter of Venturi meter (m)d diameter of the Venturi throat (m)DR gas-to-liquid density ratio (–)Fr densiometric Froude number (–)g gravitational constant (m/s2)K two-phase mass flow coefficient (–)m mass flow rate (kg/s)NG natural gasP operating pressure (Pa)RMSD root-mean-square-deviation (%)U velocity (m/s)XLM Lockhart–Martinelli parameter (–)
Greek symbolsDP differential pressure (Pa)b diameter ratio (–)e gas expansibility coefficient (–)q density (kg/m3)
Subscriptsd dischargeg gasl liquidsg superficial gassl superficial liquidtp two-phase
62 D. He, B. Bai / Measurement 58 (2014) 61–67
the Venturi tube. The measurement correlation is the foun-dation for the development of the wet gas flow rate meters.Much effort has been devoted to the study of the measure-ment correlation with the DP techniques. Three popularcorrelations for the Venturi meter are listed in Table A.1in Appendix A [10,11,24,25]. The TR 11583 report wasissued by ISO [24], but the reported measurement correla-tion is controversial; some researchers suggest that itshould be withdrawn [26].
The aim of the present study is to develop a new corre-lation for wet gas flow rate measurement with Venturimeter based on the two-phase mass flow coefficient. Thetwo-phase mass flow coefficient of the Venturi meter isfirst proposed and then its influencing factors are investi-gated. The new correlation is compared with the existingcorrelations and the results show that it provides a moreaccurate prediction of the gas mass flow rate in the wetgas.
2. K–XLM model
In our previous study, a flow rate measurement modelwith a V-Cone meter for the wet gas under the low pres-sure was proposed [14]. However, the V-Cone meter is anonstandard differential pressure meter, and its dischargecoefficient (Cd) and expansibility coefficient (e) used in thesingle phase flow are not tabulated; therefore, they are notconsidered in the previous model. The Venturi meter in thepresent study is a classical DP meter; its Cd and e are takeninto account in the new measurement model. The develop-ment of the K–XLM model with the Venturi meter is asfollows.
When used in the wet gas flow, the Venturi meterproduces a higher DP than it does in the dry gas flow.Generally, the uncorrected gas mass flow rate producedby the higher DP is termed the ‘apparent’ gas mass flowrate, mg,apparent, and it is calculated by the correlation asshown in Eq. (1).
mg;apparent ¼Ab2Cde
ffiffiffiffiffiffiffiffiffiffiffiffiffiffiffiffiffiffi2qgDPtp
qffiffiffiffiffiffiffiffiffiffiffiffiffiffi1� b4
q ð1Þ
where A is the cross area of the Venturi meter inlet; b = d/Dis the ratio of the throat diameter, d, to the inlet diameterof the Venturi meter, D; Cd, the discharge coefficient; e, thegas expansibility coefficient; qg, the gas density and4Ptp isthe real differential pressure of the wet gas flow.
The two-phase mass flow coefficient of the Venturimeter, K, is defined as the ratio of the sum of the gas andliquid mass flow rate to the apparent gas mass flow rate(Eq. (2)).
K ¼ mg þml
mg;apparentð2Þ
where mg and ml are the gas and liquid mass flow rate,respectively.
The Lockhart–Martinelli parameter, XLM, is a provendimensionless parameter commonly used in the investiga-tions on the wet gas. XLM denotes the relative content ofthe liquid phase in the wet gas flow. It is defined as thesquare root of the ratio of the liquid inertia (when theliquid flows exclusively in the pipe) to the gas inertia(when the gas flows exclusively in the pipe).
XLM ¼ml
mg
ffiffiffiffiffiffiqg
ql
sð3Þ
where ql is the liquid density and DR = qg/ql is the ratio ofthe gas to liquid density.
Combine Eqs. (1)–(3) and the new model follows asshown in Eq. (4).
mg ¼mg;apparentK
1þ XLM=ffiffiffiffiffiffiffiffiffiffiffiffiqg=ql
q ð4Þ
where mg,apparent is calculated by Eq. (1), and K is correctedaccording to the influencing factors.
0.01 0.1 1 101E-3
0.01
0.1
1
10
XLM=0.3
XLM=0.01
XLM=0.1
Stratified
Annular-Mist
Slug
NG&Water DR=0.0104DR=0.0339
NG&StoddardDR=0.0125DR=0.0441
NG&Water&StoddardDR=0.0118DR=0.0379
NG&KeroseneDR=0.015DR=0.0474DR=0.081
Frl
Frg
XLM=1
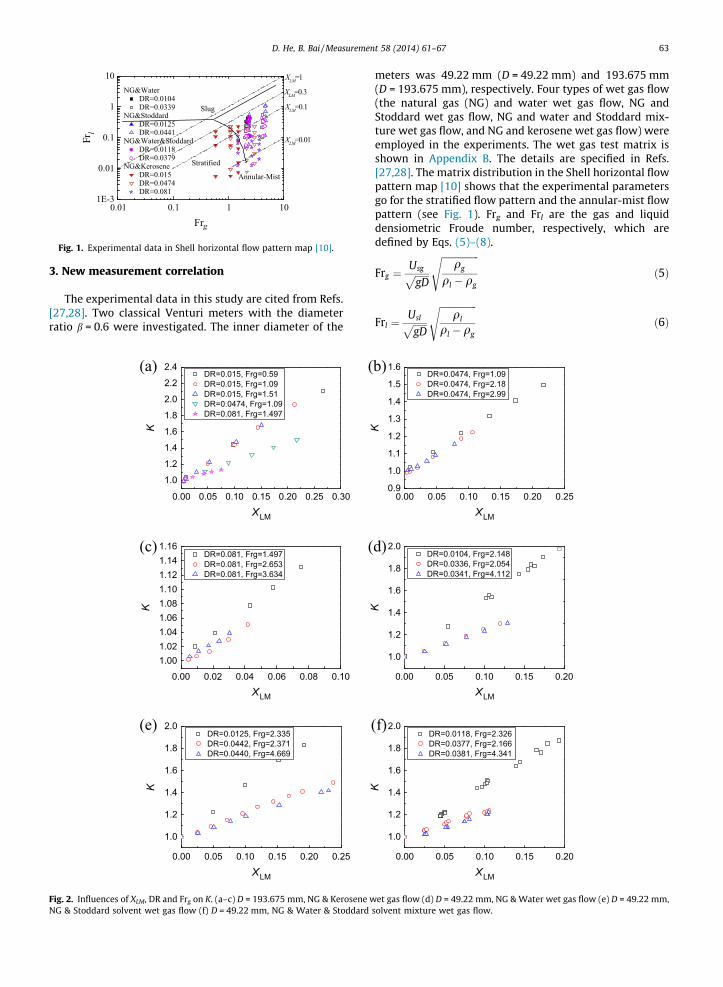
Fig. 1. Experimental data in Shell horizontal flow pattern map [10].
D. He, B. Bai / Measurement 58 (2014) 61–67 63
3. New measurement correlation
The experimental data in this study are cited from Refs.[27,28]. Two classical Venturi meters with the diameterratio b = 0.6 were investigated. The inner diameter of the
0.00 0.05 0.10 0.15 0.20 0.25 0.30
1.0
1.2
1.4
1.6
1.8
2.0
2.2
2.4 DR=0.015, Frg=0.59 DR=0.015, Frg=1.09 DR=0.015, Frg=1.51 DR=0.0474, Frg=1.09 DR=0.081, Frg=1.497
K
0.00 0.02 0.04 0.06 0.08 0.10
1.001.021.041.061.081.101.121.141.16
DR=0.081, Frg=1.497 DR=0.081, Frg=2.653 DR=0.081, Frg=3.634
K
0.00 0.05 0.10 0.15 0.20 0.25
1.0
1.2
1.4
1.6
1.8
2.0 DR=0.0125, Frg=2.335 DR=0.0442, Frg=2.371 DR=0.0440, Frg=4.669
K
XLM
XLM
XLM
(a)
(c)
(
(
(e) (
Fig. 2. Influences of XLM, DR and Frg on K. (a–c) D = 193.675 mm, NG & Kerosene wNG & Stoddard solvent wet gas flow (f) D = 49.22 mm, NG & Water & Stoddard
meters was 49.22 mm (D = 49.22 mm) and 193.675 mm(D = 193.675 mm), respectively. Four types of wet gas flow(the natural gas (NG) and water wet gas flow, NG andStoddard wet gas flow, NG and water and Stoddard mix-ture wet gas flow, and NG and kerosene wet gas flow) wereemployed in the experiments. The wet gas test matrix isshown in Appendix B. The details are specified in Refs.[27,28]. The matrix distribution in the Shell horizontal flowpattern map [10] shows that the experimental parametersgo for the stratified flow pattern and the annular-mist flowpattern (see Fig. 1). Frg and Frl are the gas and liquiddensiometric Froude number, respectively, which aredefined by Eqs. (5)–(8).
Frg ¼Usgffiffiffiffiffiffi
gDp
ffiffiffiffiffiffiffiffiffiffiffiffiffiffiffiffiqg
ql � qg
sð5Þ
Frl ¼Uslffiffiffiffiffiffi
gDp
ffiffiffiffiffiffiffiffiffiffiffiffiffiffiffiffiql
ql � qg
sð6Þ
0.00 0.05 0.10 0.15 0.20 0.250.9
1.0
1.1
1.2
1.3
1.4
1.5
1.6 DR=0.0474, Frg=1.09 DR=0.0474, Frg=2.18 DR=0.0474, Frg=2.99
K
0.00 0.05 0.10 0.15 0.20
1.0
1.2
1.4
1.6
1.8
2.0
K
DR=0.0104, Frg=2.148 DR=0.0336, Frg=2.054 DR=0.0341, Frg=4.112
0.00 0.05 0.10 0.15 0.20
1.0
1.2
1.4
1.6
1.8
2.0 DR=0.0118, Frg=2.326 DR=0.0377, Frg=2.166 DR=0.0381, Frg=4.341
K
XLM
XLM
XLM
b)
d)
f)
et gas flow (d) D = 49.22 mm, NG & Water wet gas flow (e) D = 49.22 mm,solvent mixture wet gas flow.
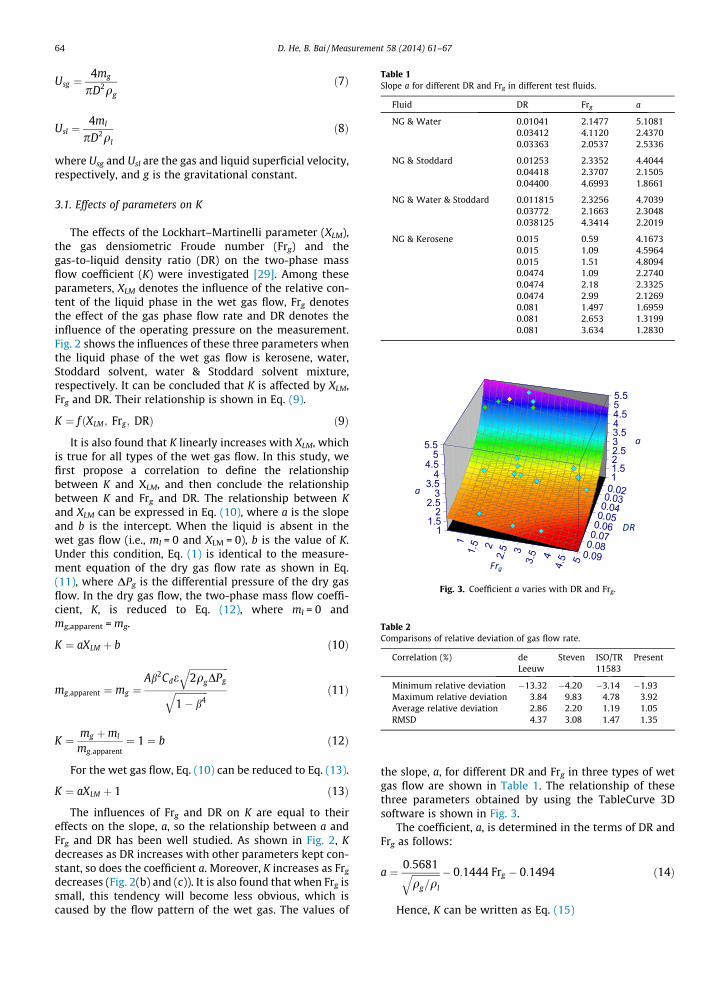
Table 1Slope a for different DR and Frg in different test fluids.
Fluid DR Frg a
NG & Water 0.01041 2.1477 5.10810.03412 4.1120 2.43700.03363 2.0537 2.5336
NG & Stoddard 0.01253 2.3352 4.40440.04418 2.3707 2.15050.04400 4.6993 1.8661
NG & Water & Stoddard 0.011815 2.3256 4.70390.03772 2.1663 2.30480.038125 4.3414 2.2019
NG & Kerosene 0.015 0.59 4.16730.015 1.09 4.59640.015 1.51 4.80940.0474 1.09 2.27400.0474 2.18 2.33250.0474 2.99 2.12690.081 1.497 1.69590.081 2.653 1.31990.081 3.634 1.2830
0.090.080.070.060.050.040.030.02
54.543.532.521.51
1
1
1.5
1.5
2
2
2.5
2.5
3
3
3.5
3.5
4
4
4.5
4.5
5
5
5.5
5.5
Fig. 3. Coefficient a varies with DR and Frg.
Table 2Comparisons of relative deviation of gas flow rate.
Correlation (%) deLeeuw
Steven ISO/TR11583
Present
Minimum relative deviation �13.32 �4.20 �3.14 �1.93Maximum relative deviation 3.84 9.83 4.78 3.92Average relative deviation 2.86 2.20 1.19 1.05RMSD 4.37 3.08 1.47 1.35
64 D. He, B. Bai / Measurement 58 (2014) 61–67
Usg ¼4mg
pD2qg
ð7Þ
Usl ¼4ml
pD2ql
ð8Þ
where Usg and Usl are the gas and liquid superficial velocity,respectively, and g is the gravitational constant.
3.1. Effects of parameters on K
The effects of the Lockhart–Martinelli parameter (XLM),the gas densiometric Froude number (Frg) and thegas-to-liquid density ratio (DR) on the two-phase massflow coefficient (K) were investigated [29]. Among theseparameters, XLM denotes the influence of the relative con-tent of the liquid phase in the wet gas flow, Frg denotesthe effect of the gas phase flow rate and DR denotes theinfluence of the operating pressure on the measurement.Fig. 2 shows the influences of these three parameters whenthe liquid phase of the wet gas flow is kerosene, water,Stoddard solvent, water & Stoddard solvent mixture,respectively. It can be concluded that K is affected by XLM,Frg and DR. Their relationship is shown in Eq. (9).
K ¼ f ðXLM; Frg ; DRÞ ð9Þ
It is also found that K linearly increases with XLM, whichis true for all types of the wet gas flow. In this study, wefirst propose a correlation to define the relationshipbetween K and XLM, and then conclude the relationshipbetween K and Frg and DR. The relationship between Kand XLM can be expressed in Eq. (10), where a is the slopeand b is the intercept. When the liquid is absent in thewet gas flow (i.e., ml = 0 and XLM = 0), b is the value of K.Under this condition, Eq. (1) is identical to the measure-ment equation of the dry gas flow rate as shown in Eq.(11), where DPg is the differential pressure of the dry gasflow. In the dry gas flow, the two-phase mass flow coeffi-cient, K, is reduced to Eq. (12), where ml = 0 andmg,apparent = mg.
K ¼ aXLM þ b ð10Þ
mg;apparent ¼ mg ¼Ab2Cde
ffiffiffiffiffiffiffiffiffiffiffiffiffiffiffiffiffi2qgDPg
qffiffiffiffiffiffiffiffiffiffiffiffiffiffi1� b4
q ð11Þ
K ¼ mg þml
mg;apparent¼ 1 ¼ b ð12Þ
For the wet gas flow, Eq. (10) can be reduced to Eq. (13).
K ¼ aXLM þ 1 ð13Þ
The influences of Frg and DR on K are equal to theireffects on the slope, a, so the relationship between a andFrg and DR has been well studied. As shown in Fig. 2, Kdecreases as DR increases with other parameters kept con-stant, so does the coefficient a. Moreover, K increases as Frg
decreases (Fig. 2(b) and (c)). It is also found that when Frg issmall, this tendency will become less obvious, which iscaused by the flow pattern of the wet gas. The values of
the slope, a, for different DR and Frg in three types of wetgas flow are shown in Table 1. The relationship of thesethree parameters obtained by using the TableCurve 3Dsoftware is shown in Fig. 3.
The coefficient, a, is determined in the terms of DR andFrg as follows:
a ¼ 0:5681ffiffiffiffiffiffiffiffiffiffiffiffiqg=ql
q � 0:1444 Frg � 0:1494 ð14Þ
Hence, K can be written as Eq. (15)
0.00 0.05 0.10 0.15 0.20 0.25 0.30-15-12
-9-6-30369
1215
0.0%
-3.0%
+3.0%
1234
Rel
ativ
e de
viat
ion
(%)
0.00 0.05 0.10 0.15 0.20 0.25 0.30-15-12-9-6-30369
1215
-3.0%
+3.0%
0.0%
1234
Rel
ativ
e D
evia
tion
(%)
XLM
XLM XLM
XLM
0.00 0.05 0.10 0.15 0.20 0.25 0.30-10
-8-6-4-202468
10
0.0%
+3.0%
-3.0%
1234
Rel
ativ
e de
viat
ion
(%)
(c)
0.00 0.05 0.10 0.15 0.20 0.25 0.30-10
-8-6-4-202468
10
0.0%
+3.0%
-2.0%1234R
elat
ive
devi
atio
n (%
)
(a) (b)
(d)
De Leeuw correlation Steven correlation
ISO/TR 11583 correlation present correlation
XLM=0.075 XLM=0.1
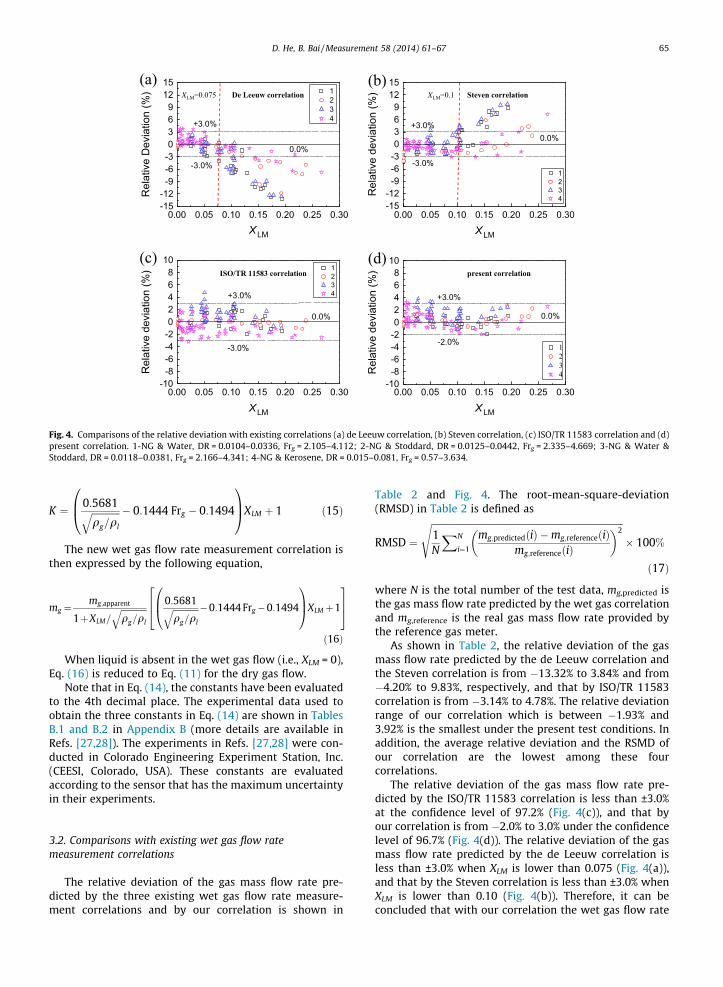
Fig. 4. Comparisons of the relative deviation with existing correlations (a) de Leeuw correlation, (b) Steven correlation, (c) ISO/TR 11583 correlation and (d)present correlation. 1-NG & Water, DR = 0.0104–0.0336, Frg = 2.105–4.112; 2-NG & Stoddard, DR = 0.0125–0.0442, Frg = 2.335–4.669; 3-NG & Water &Stoddard, DR = 0.0118–0.0381, Frg = 2.166–4.341; 4-NG & Kerosene, DR = 0.015–0.081, Frg = 0.57–3.634.
D. He, B. Bai / Measurement 58 (2014) 61–67 65
K ¼ 0:5681ffiffiffiffiffiffiffiffiffiffiffiffiqg=ql
q � 0:1444 Frg � 0:1494
0B@
1CAXLM þ 1 ð15Þ
The new wet gas flow rate measurement correlation isthen expressed by the following equation,
mg ¼mg;apparent
1þXLM=ffiffiffiffiffiffiffiffiffiffiffiffiqg=ql
q 0:5681ffiffiffiffiffiffiffiffiffiffiffiffiqg=ql
q �0:1444 Frg�0:1494
0B@
1CAXLMþ1
264
375
ð16Þ
When liquid is absent in the wet gas flow (i.e., XLM = 0),Eq. (16) is reduced to Eq. (11) for the dry gas flow.
Note that in Eq. (14), the constants have been evaluatedto the 4th decimal place. The experimental data used toobtain the three constants in Eq. (14) are shown in TablesB.1 and B.2 in Appendix B (more details are available inRefs. [27,28]). The experiments in Refs. [27,28] were con-ducted in Colorado Engineering Experiment Station, Inc.(CEESI, Colorado, USA). These constants are evaluatedaccording to the sensor that has the maximum uncertaintyin their experiments.
3.2. Comparisons with existing wet gas flow ratemeasurement correlations
The relative deviation of the gas mass flow rate pre-dicted by the three existing wet gas flow rate measure-ment correlations and by our correlation is shown in
Table 2 and Fig. 4. The root-mean-square-deviation(RMSD) in Table 2 is defined as
RMSD ¼
ffiffiffiffiffiffiffiffiffiffiffiffiffiffiffiffiffiffiffiffiffiffiffiffiffiffiffiffiffiffiffiffiffiffiffiffiffiffiffiffiffiffiffiffiffiffiffiffiffiffiffiffiffiffiffiffiffiffiffiffiffiffiffiffiffiffiffiffiffiffiffiffiffiffiffiffiffiffiffiffiffiffiffi1N
XN
i¼1
mg;predictedðiÞ �mg;referenceðiÞmg;referenceðiÞ
� �2s
� 100%
ð17Þ
where N is the total number of the test data, mg,predicted isthe gas mass flow rate predicted by the wet gas correlationand mg,reference is the real gas mass flow rate provided bythe reference gas meter.
As shown in Table 2, the relative deviation of the gasmass flow rate predicted by the de Leeuw correlation andthe Steven correlation is from �13.32% to 3.84% and from�4.20% to 9.83%, respectively, and that by ISO/TR 11583correlation is from �3.14% to 4.78%. The relative deviationrange of our correlation which is between �1.93% and3.92% is the smallest under the present test conditions. Inaddition, the average relative deviation and the RSMD ofour correlation are the lowest among these fourcorrelations.
The relative deviation of the gas mass flow rate pre-dicted by the ISO/TR 11583 correlation is less than ±3.0%at the confidence level of 97.2% (Fig. 4(c)), and that byour correlation is from �2.0% to 3.0% under the confidencelevel of 96.7% (Fig. 4(d)). The relative deviation of the gasmass flow rate predicted by the de Leeuw correlation isless than ±3.0% when XLM is lower than 0.075 (Fig. 4(a)),and that by the Steven correlation is less than ±3.0% whenXLM is lower than 0.10 (Fig. 4(b)). Therefore, it can beconcluded that with our correlation the wet gas flow rate
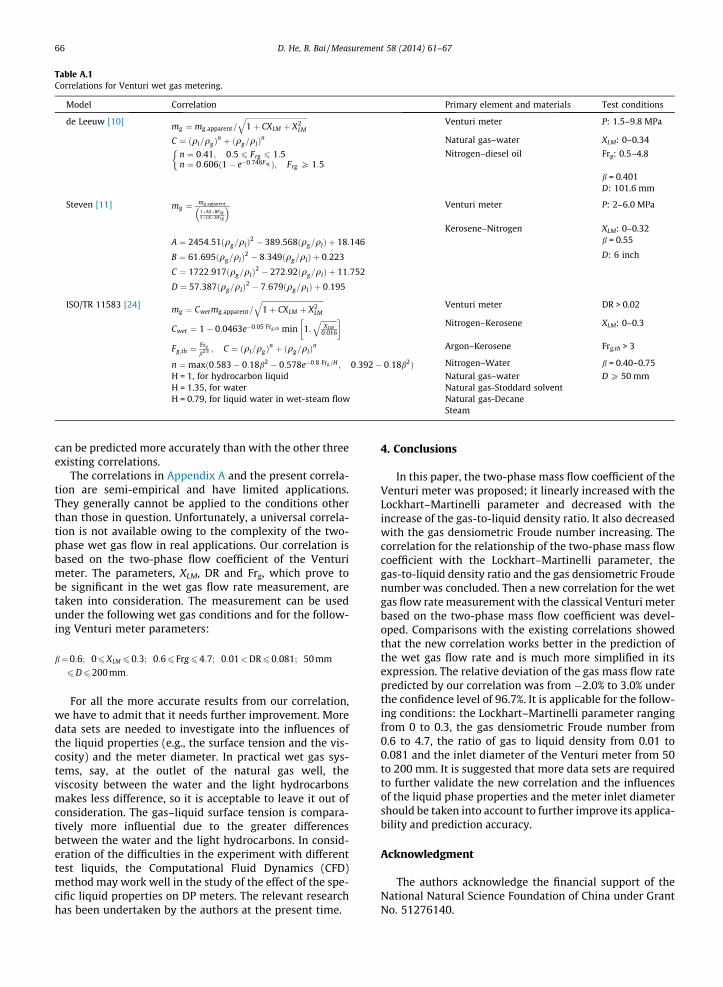
Table A.1Correlations for Venturi wet gas metering.
Model Correlation Primary element and materials Test conditions
de Leeuw [10] mg ¼ mg;apparent=
ffiffiffiffiffiffiffiffiffiffiffiffiffiffiffiffiffiffiffiffiffiffiffiffiffiffiffiffiffiffiffiffiffiffi1þ CXLM þ X2
LM
qVenturi meter P: 1.5–9.8 MPa
C ¼ ðql=qgÞn þ ðqg=qlÞ
n Natural gas–water XLM: 0–0.34
n ¼ 0:41; 0:5 6 Frg 6 1:5n ¼ 0:606ð1� e�0:746Frg Þ; Frg P 1:5
�Nitrogen–diesel oil Frg: 0.5–4.8
b = 0.401D: 101.6 mm
Steven [11] mg ¼ mg;apparent
1þAXþBFrg1þCXþDFrg
� � Venturi meter P: 2–6.0 MPa
Kerosene–Nitrogen XLM: 0–0.32
A ¼ 2454:51ðqg=qlÞ2 � 389:568ðqg=qlÞ þ 18:146 b = 0.55
B ¼ 61:695ðqg=qlÞ2 � 8:349ðqg=qlÞ þ 0:223 D: 6 inch
C ¼ 1722:917ðqg=qlÞ2 � 272:92ðqg=qlÞ þ 11:752
D ¼ 57:387ðqg=qlÞ2 � 7:679ðqg=qlÞ þ 0:195
ISO/TR 11583 [24] mg ¼ Cwetmg;apparent=
ffiffiffiffiffiffiffiffiffiffiffiffiffiffiffiffiffiffiffiffiffiffiffiffiffiffiffiffiffiffiffiffiffiffi1þ CXLM þ X2
LM
qVenturi meter DR > 0.02
Cwet ¼ 1� 0:0463e�0:05 Frg;th min 1;ffiffiffiffiffiffiffiffiffiXLM
0:016
q� Nitrogen–Kerosene XLM: 0–0.3
Fg;th ¼Frg
b2:5 ; C ¼ ðql=qgÞn þ ðqg=qlÞ
n Argon–Kerosene Frg,th > 3
n ¼maxð0:583� 0:18b2 � 0:578e�0:8 Frg=H ; 0:392� 0:18b2Þ Nitrogen–Water b = 0.40–0.75
H = 1, for hydrocarbon liquid Natural gas–water D P 50 mmH = 1.35, for water Natural gas-Stoddard solventH = 0.79, for liquid water in wet-steam flow Natural gas-Decane
Steam
66 D. He, B. Bai / Measurement 58 (2014) 61–67
can be predicted more accurately than with the other threeexisting correlations.
The correlations in Appendix A and the present correla-tion are semi-empirical and have limited applications.They generally cannot be applied to the conditions otherthan those in question. Unfortunately, a universal correla-tion is not available owing to the complexity of the two-phase wet gas flow in real applications. Our correlation isbased on the two-phase flow coefficient of the Venturimeter. The parameters, XLM, DR and Frg, which prove tobe significant in the wet gas flow rate measurement, aretaken into consideration. The measurement can be usedunder the following wet gas conditions and for the follow-ing Venturi meter parameters:
b¼0:6; 06XLM 6 0:3; 0:66 Frg64:7; 0:01<DR60:081; 50 mm6D6200 mm:
For all the more accurate results from our correlation,we have to admit that it needs further improvement. Moredata sets are needed to investigate into the influences ofthe liquid properties (e.g., the surface tension and the vis-cosity) and the meter diameter. In practical wet gas sys-tems, say, at the outlet of the natural gas well, theviscosity between the water and the light hydrocarbonsmakes less difference, so it is acceptable to leave it out ofconsideration. The gas–liquid surface tension is compara-tively more influential due to the greater differencesbetween the water and the light hydrocarbons. In consid-eration of the difficulties in the experiment with differenttest liquids, the Computational Fluid Dynamics (CFD)method may work well in the study of the effect of the spe-cific liquid properties on DP meters. The relevant researchhas been undertaken by the authors at the present time.
4. Conclusions
In this paper, the two-phase mass flow coefficient of theVenturi meter was proposed; it linearly increased with theLockhart–Martinelli parameter and decreased with theincrease of the gas-to-liquid density ratio. It also decreasedwith the gas densiometric Froude number increasing. Thecorrelation for the relationship of the two-phase mass flowcoefficient with the Lockhart–Martinelli parameter, thegas-to-liquid density ratio and the gas densiometric Froudenumber was concluded. Then a new correlation for the wetgas flow rate measurement with the classical Venturi meterbased on the two-phase mass flow coefficient was devel-oped. Comparisons with the existing correlations showedthat the new correlation works better in the prediction ofthe wet gas flow rate and is much more simplified in itsexpression. The relative deviation of the gas mass flow ratepredicted by our correlation was from �2.0% to 3.0% underthe confidence level of 96.7%. It is applicable for the follow-ing conditions: the Lockhart–Martinelli parameter rangingfrom 0 to 0.3, the gas densiometric Froude number from0.6 to 4.7, the ratio of gas to liquid density from 0.01 to0.081 and the inlet diameter of the Venturi meter from 50to 200 mm. It is suggested that more data sets are requiredto further validate the new correlation and the influencesof the liquid phase properties and the meter inlet diametershould be taken into account to further improve its applica-bility and prediction accuracy.
Acknowledgment
The authors acknowledge the financial support of theNational Natural Science Foundation of China under GrantNo. 51276140.
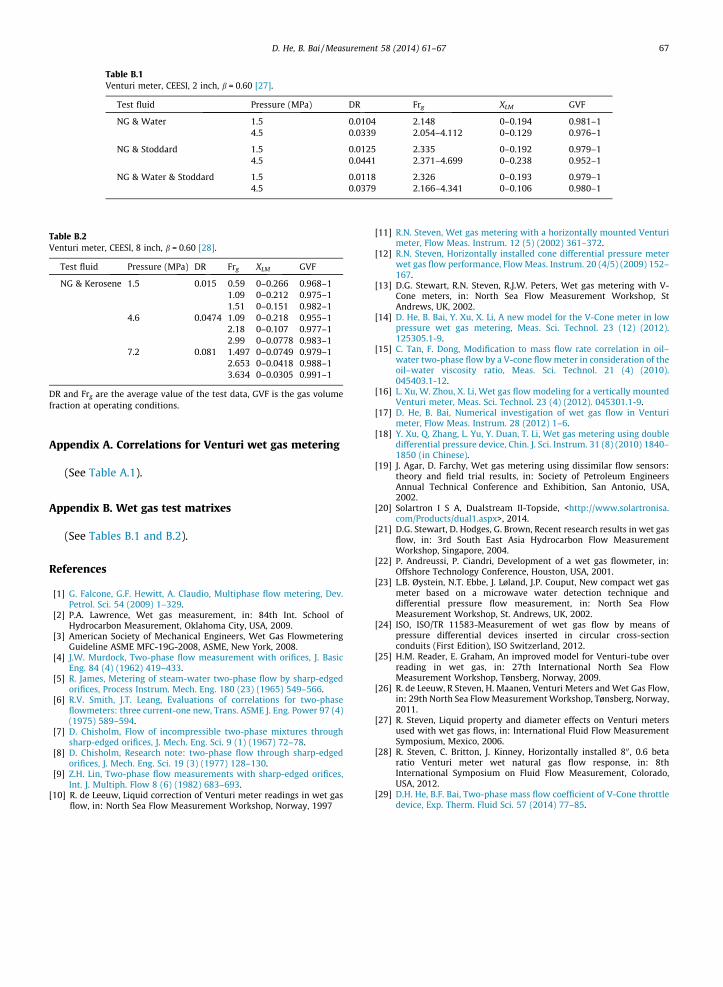
Table B.1Venturi meter, CEESI, 2 inch, b = 0.60 [27].
Test fluid Pressure (MPa) DR Frg XLM GVF
NG & Water 1.5 0.0104 2.148 0–0.194 0.981–14.5 0.0339 2.054–4.112 0–0.129 0.976–1
NG & Stoddard 1.5 0.0125 2.335 0–0.192 0.979–14.5 0.0441 2.371–4.699 0–0.238 0.952–1
NG & Water & Stoddard 1.5 0.0118 2.326 0–0.193 0.979–14.5 0.0379 2.166–4.341 0–0.106 0.980–1
Table B.2Venturi meter, CEESI, 8 inch, b = 0.60 [28].
Test fluid Pressure (MPa) DR Frg XLM GVF
NG & Kerosene 1.5 0.015 0.59 0–0.266 0.968–11.09 0–0.212 0.975–11.51 0–0.151 0.982–1
4.6 0.0474 1.09 0–0.218 0.955–12.18 0–0.107 0.977–12.99 0–0.0778 0.983–1
7.2 0.081 1.497 0–0.0749 0.979–12.653 0–0.0418 0.988–13.634 0–0.0305 0.991–1
DR and Frg are the average value of the test data, GVF is the gas volumefraction at operating conditions.
D. He, B. Bai / Measurement 58 (2014) 61–67 67
Appendix A. Correlations for Venturi wet gas metering
(See Table A.1).
Appendix B. Wet gas test matrixes
(See Tables B.1 and B.2).
References
[1] G. Falcone, G.F. Hewitt, A. Claudio, Multiphase flow metering, Dev.Petrol. Sci. 54 (2009) 1–329.
[2] P.A. Lawrence, Wet gas measurement, in: 84th Int. School ofHydrocarbon Measurement, Oklahoma City, USA, 2009.
[3] American Society of Mechanical Engineers, Wet Gas FlowmeteringGuideline ASME MFC-19G-2008, ASME, New York, 2008.
[4] J.W. Murdock, Two-phase flow measurement with orifices, J. BasicEng. 84 (4) (1962) 419–433.
[5] R. James, Metering of steam-water two-phase flow by sharp-edgedorifices, Process Instrum. Mech. Eng. 180 (23) (1965) 549–566.
[6] R.V. Smith, J.T. Leang, Evaluations of correlations for two-phaseflowmeters: three current-one new, Trans. ASME J. Eng. Power 97 (4)(1975) 589–594.
[7] D. Chisholm, Flow of incompressible two-phase mixtures throughsharp-edged orifices, J. Mech. Eng. Sci. 9 (1) (1967) 72–78.
[8] D. Chisholm, Research note: two-phase flow through sharp-edgedorifices, J. Mech. Eng. Sci. 19 (3) (1977) 128–130.
[9] Z.H. Lin, Two-phase flow measurements with sharp-edged orifices,Int. J. Multiph. Flow 8 (6) (1982) 683–693.
[10] R. de Leeuw, Liquid correction of Venturi meter readings in wet gasflow, in: North Sea Flow Measurement Workshop, Norway, 1997
[11] R.N. Steven, Wet gas metering with a horizontally mounted Venturimeter, Flow Meas. Instrum. 12 (5) (2002) 361–372.
[12] R.N. Steven, Horizontally installed cone differential pressure meterwet gas flow performance, Flow Meas. Instrum. 20 (4/5) (2009) 152–167.
[13] D.G. Stewart, R.N. Steven, R.J.W. Peters, Wet gas metering with V-Cone meters, in: North Sea Flow Measurement Workshop, StAndrews, UK, 2002.
[14] D. He, B. Bai, Y. Xu, X. Li, A new model for the V-Cone meter in lowpressure wet gas metering, Meas. Sci. Technol. 23 (12) (2012).125305.1-9.
[15] C. Tan, F. Dong, Modification to mass flow rate correlation in oil–water two-phase flow by a V-cone flow meter in consideration of theoil–water viscosity ratio, Meas. Sci. Technol. 21 (4) (2010).045403.1-12.
[16] L. Xu, W. Zhou, X. Li, Wet gas flow modeling for a vertically mountedVenturi meter, Meas. Sci. Technol. 23 (4) (2012). 045301.1-9.
[17] D. He, B. Bai, Numerical investigation of wet gas flow in Venturimeter, Flow Meas. Instrum. 28 (2012) 1–6.
[18] Y. Xu, Q. Zhang, L. Yu, Y. Duan, T. Li, Wet gas metering using doubledifferential pressure device, Chin. J. Sci. Instrum. 31 (8) (2010) 1840–1850 (in Chinese).
[19] J. Agar, D. Farchy, Wet gas metering using dissimilar flow sensors:theory and field trial results, in: Society of Petroleum EngineersAnnual Technical Conference and Exhibition, San Antonio, USA,2002.
[20] Solartron I S A, Dualstream II-Topside, <http://www.solartronisa.com/Products/dual1.aspx>, 2014.
[21] D.G. Stewart, D. Hodges, G. Brown, Recent research results in wet gasflow, in: 3rd South East Asia Hydrocarbon Flow MeasurementWorkshop, Singapore, 2004.
[22] P. Andreussi, P. Ciandri, Development of a wet gas flowmeter, in:Offshore Technology Conference, Houston, USA, 2001.
[23] L.B. Øystein, N.T. Ebbe, J. Løland, J.P. Couput, New compact wet gasmeter based on a microwave water detection technique anddifferential pressure flow measurement, in: North Sea FlowMeasurement Workshop, St. Andrews, UK, 2002.
[24] ISO, ISO/TR 11583-Measurement of wet gas flow by means ofpressure differential devices inserted in circular cross-sectionconduits (First Edition), ISO Switzerland, 2012.
[25] H.M. Reader, E. Graham, An improved model for Venturi-tube overreading in wet gas, in: 27th International North Sea FlowMeasurement Workshop, Tønsberg, Norway, 2009.
[26] R. de Leeuw, R Steven, H. Maanen, Venturi Meters and Wet Gas Flow,in: 29th North Sea Flow Measurement Workshop, Tønsberg, Norway,2011.
[27] R. Steven, Liquid property and diameter effects on Venturi metersused with wet gas flows, in: International Fluid Flow MeasurementSymposium, Mexico, 2006.
[28] R. Steven, C. Britton, J. Kinney, Horizontally installed 800 , 0.6 betaratio Venturi meter wet natural gas flow response, in: 8thInternational Symposium on Fluid Flow Measurement, Colorado,USA, 2012.
[29] D.H. He, B.F. Bai, Two-phase mass flow coefficient of V-Cone throttledevice, Exp. Therm. Fluid Sci. 57 (2014) 77–85.