Embed Size (px)
Citation preview
WRITTEN BY:
Betheny GrossSivan TuchmanSusan Patrick
A National Landscape Scan of Personalized Learning in K-12 Education in the United States

A National Landscape Scan of Personalized Learning in K-12 Education in the United StatesJUNE 2018
WRITTEN BY: Betheny Gross, Sivan Tuchman, Susan Patrick
iNACOL drives the transformation of education systems and accelerates the advancement of breakthrough policies and practices to ensure high-quality learning for all. It is a national organization dedicated to sharing research, trends and promising practices and policies to advance personalized, competency-based education. Through this project, iNACOL provides an evidence-based sector analysis of personalized learning and a national landscape analysis.
This report is based on research funded by the Bill & Melinda Gates Foundation. The findings and conclusions contained within are those of the authors and do not necessarily reflect positions or policies of the Bill & Melinda Gates Foundation.
iNACOL www.inacol.org
Please refer to this paper as Gross, B., Tuchman, S., & Patrick, S. (2018). A National Landscape Scan of Personalized Learning in K-12 Education in the United States. iNACOL, Vienna, Virginia. Content in this report is licensed under a Creative Commons Attribution 4.0 International license.
™
About LEAP Innovations:LEAP Innovations is a national organization headquartered in Chicago that connects innovation and education to transform how students learn. LEAP works directly with educators and innovators to discover, pilot and scale personalized learning technologies and innovative practices. In just over four years, LEAP has worked directly with more than 125 schools across Chicago to implement personalized learning, from classroom-level innovation in the Pilot Network to whole-school transformation in Breakthrough Schools. LEAP’s work is anchored by the LEAP Learning Framework, a suite of resources that educators across the country are using to define, design, and implement personalized learning models. Visit leapinnovations.org for more information.
About the Center on Reinventing Public Education:CRPE is a research and policy analysis center at the University of Washington Bothell. Our mission is to reinvent the public education delivery model to prepare all American students to solve tomorrow’s challenges. We develop, test, and support evidence-based, systemwide solutions to address the most urgent problems in K-12 public education. Since 1993, CRPE has been an objective and nonpartisan source of information and analysis for informed policy deliberation and debate. Our work is supported by multiple foundations, contracts, and the U.S. Department of Education.
About NORC at the University of Chicago:NORC at the University of Chicago is an objective, non-partisan research institution that delivers reliable data and rigorous analysis to guide critical programmatic, business, and policy decisions. Since 1941, NORC has conducted groundbreaking studies, created and applied innovative methods and tools, and advanced principles of scientific integrity and collaboration. Today, government, corporate, and nonprofit clients around the world partner with NORC to transform increasingly complex information into useful knowledge.
Front cover images courtesy of LEAP Innovations, Parker-Varney Elementary School, Eminence Independent Schools, and the GripTape Youth Leadership Board.
Table of Contents
I. Introduction: Personalized Learning National Landscape Scan ........................................................................ 1
II. What Is Personalized Learning? .................................................................................................................................... 1
III. The Growth of Personalized Learning in Practice and Policy ............................................................................ 2
IV. Taking Stock of the Progress ........................................................................................................................................ 6
V. A National Scan of Personalized Learning: The Voices of Teachers and Students ................................... 6
VI. How Are U.S. Teachers and Students Engaging in Personalized Learning? ............................................... 8
VII. Looking Forward: What Are the Opportunities to Support Personalized Learning? ...........................21
VIII. Building Blocks for Personalized Learning ..........................................................................................................25
Resources ................................................................................................................................................................................27
Glossary ....................................................................................................................................................................................29
Acknowledgments ................................................................................................................................................................33
Endnotes ..................................................................................................................................................................................34
A National Landscape Scan of Personalized Learning in K-12 Education in the United States
1
I. Introduction: Personalized Learning National Landscape Scan
K-12 education is at the beginning of what many hope will be a systemic transformation toward personalized
learning. Across the nation, schools are experimenting with personalized learning to better meet each
student’s unique needs and ensure broader access to a world-class education.
Many of these experiments have been captured in individual case studies and other vivid narratives, but the
field lacks a broad-based understanding of how personalized learning is emerging in classrooms across
the United States. As a result, it is difficult to know the extent to which personalized learning is actually
taking hold across the country. The lack of systematic data on personalized learning also makes it hard for
advocates and others to identify the kinds of challenges policymakers and practitioners alike may need to
address in the years ahead.
To better understand how personalized learning is playing out across the nation, iNACOL partnered with the
Center on Reinventing Public Education (CRPE), NORC at the University of Chicago, and LEAP Innovations to
conduct a national survey of teachers and students. This report summarizes what these teacher and student
surveys revealed about how personalized learning is — and is not — taking hold nationwide.
II. What Is Personalized Learning?Personalized learning takes on slightly different meanings across schools and organizations but most
definitions converge around key elements embraced by iNACOL as “tailoring learning for each student’s
strengths, needs and interests — including enabling student voice and choice in what, how, when and where
they learn — to provide flexibility and supports to ensure mastery of the highest standards possible.”1
Personalized learning is an approach to a school’s pedagogical strategy for optimizing supports for each
student, drawing on research about learning, motivation and engagement. Schools that personalize learning
call on students to be active co-constructors, making choices in how they learn, co-creating their learning
experiences and pathways through learning, progressing through content as they demonstrate competence,
and engaging in their communities outside the school. This stands in contrast to prior expectations that all
students should progress along a set curriculum at roughly the same pace, and significantly advances more
recent differentiation work by placing student agency at the center of the process.
Personalized learning may complement a “whole-child” approach, which is an effort to transition from
narrowly defined academic achievement toward promoting the full development of all children. As students
move from passive consumers to active, self-regulated learners, the hope is they will be supported by their
schools to build knowledge and skills, engage in productive struggle, build habits of success and strengthen
their social-emotional skills.
A National Landscape Scan of Personalized Learning in K-12 Education in the United States
2
III. The Growth of Personalized Learning in Practice and Policy
New learning models and instructional approaches to personalize learning have emerged and taken
root in schools across the United States. What was once a handful of innovators in a few locales has
grown into thousands of classrooms and schools throughout the country. This expansion is fueled
by both the energy of teachers who are embracing the personalized vision for learning and the
emergence of supportive systems and policies.
The level of excitement for personalized learning in schools is high. Our organizations (iNACOL,
CRPE, and LEAP) have seen it in the many schools we have visited in the last two years. Collectively,
our organizations have visited more than 80 personalized learning schools located across urban,
suburban and rural communities, and LEAP alone is currently working with more than 125 Chicago
schools to implement personalized learning.2 We have also seen the excitement at conferences
and convenings. For example, the share of personalized learning-focused proposals to iNACOL’s
Annual Symposium has grown from 28 percent of all proposals in 2015 to 48 percent in 2017.
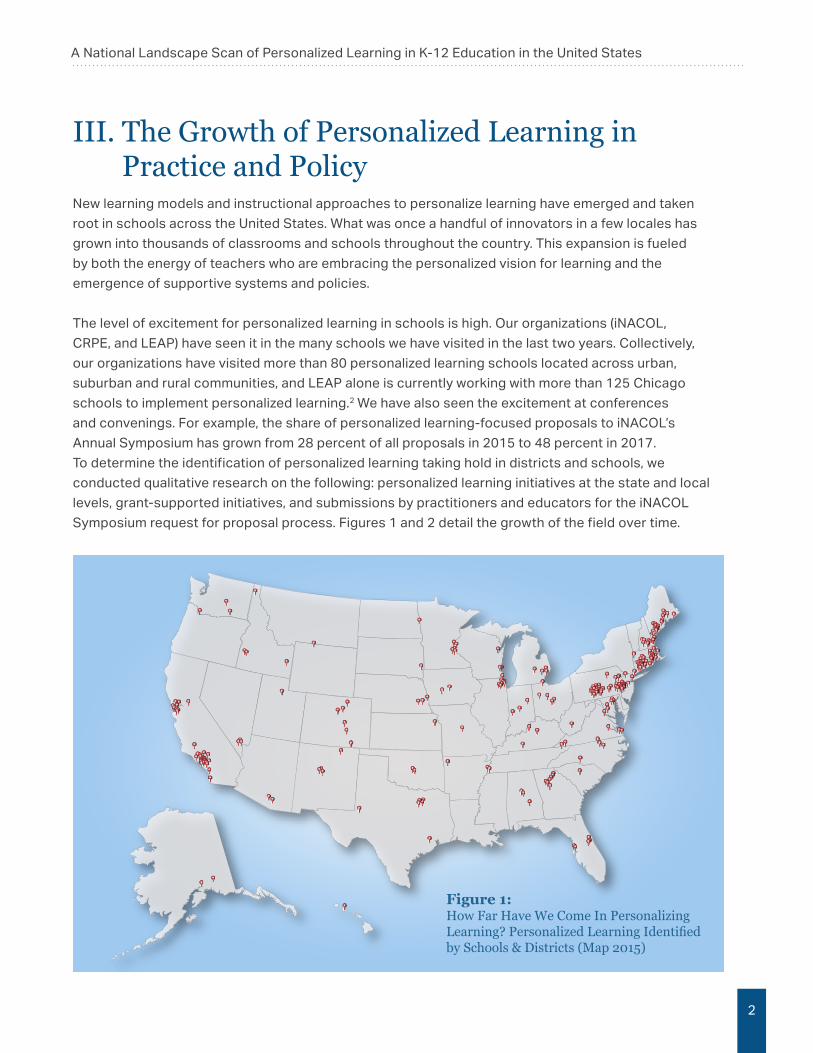
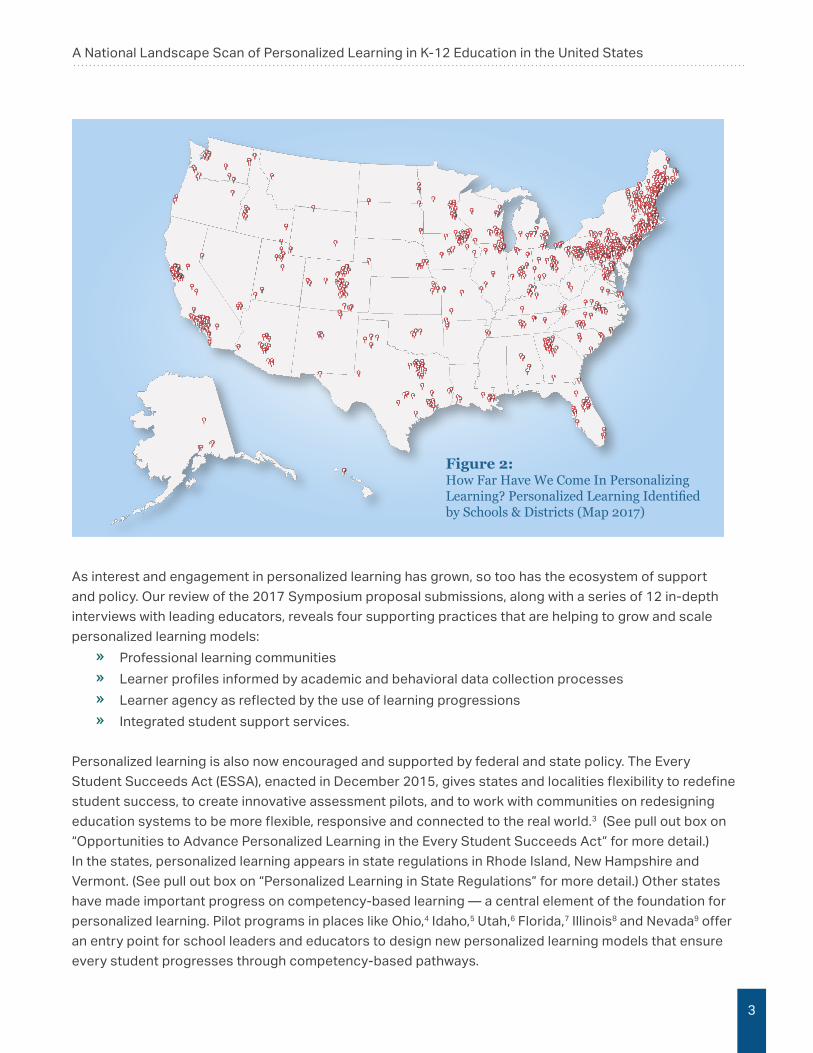
To determine the identification of personalized learning taking hold in districts and schools, we
conducted qualitative research on the following: personalized learning initiatives at the state and local
levels, grant-supported initiatives, and submissions by practitioners and educators for the iNACOL
Symposium request for proposal process. Figures 1 and 2 detail the growth of the field over time.
Figure 1: How Far Have We Come In Personalizing Learning? Personalized Learning Identified by Schools & Districts (Map 2015)
A National Landscape Scan of Personalized Learning in K-12 Education in the United States
3
As interest and engagement in personalized learning has grown, so too has the ecosystem of support
and policy. Our review of the 2017 Symposium proposal submissions, along with a series of 12 in-depth
interviews with leading educators, reveals four supporting practices that are helping to grow and scale
personalized learning models:
« Professional learning communities
« Learner profiles informed by academic and behavioral data collection processes
« Learner agency as reflected by the use of learning progressions
« Integrated student support services.
Personalized learning is also now encouraged and supported by federal and state policy. The Every
Student Succeeds Act (ESSA), enacted in December 2015, gives states and localities flexibility to redefine
student success, to create innovative assessment pilots, and to work with communities on redesigning
education systems to be more flexible, responsive and connected to the real world.3 (See pull out box on
“Opportunities to Advance Personalized Learning in the Every Student Succeeds Act” for more detail.)
In the states, personalized learning appears in state regulations in Rhode Island, New Hampshire and
Vermont. (See pull out box on “Personalized Learning in State Regulations” for more detail.) Other states
have made important progress on competency-based learning — a central element of the foundation for
personalized learning. Pilot programs in places like Ohio,4 Idaho,5 Utah,6 Florida,7 Illinois8 and Nevada9 offer
an entry point for school leaders and educators to design new personalized learning models that ensure
every student progresses through competency-based pathways.
Figure 2: How Far Have We Come In Personalizing Learning? Personalized Learning Identified by Schools & Districts (Map 2017)
A National Landscape Scan of Personalized Learning in K-12 Education in the United States
4
OPPORTUNITIES TO ADVANCE PERSONALIZED LEARNING IN THE EVERY STUDENT SUCCEEDS ACT (ESSA)
ESSA explicitly allows schools to use federal funding to support personalized learning in the following provisions.
« Under ESSA Sec. 1003A on “Direct Student Services,” states may reserve up to 3 percent of their Title I, Part A grant to distribute grants to local education agencies that can include “components of a personalized learning approach, which may include high-quality academic tutoring.”
« ESSA Title IV, Sec. 4106(d) on “Student Support and Academic Enrichment,” requires that local educational agencies receiving grant funding of at least $30,000 to conduct a comprehensive needs assessment and examine the needs for “access to personalized learning experiences supported by technology and professional development for the effective use of data and technology.” Furthermore, a portion of the program’s funds must be used to increasing effective use of technology to improve academic achievement, academic growth and digital literacy of students. Such activities include increasing capacity for educators to create blended learning and personalized learning strategies.
In addition, ESSA includes new opportunities that could be leveraged to support experimentation and innovation, such as:
« Allowing states to create statewide systems of assessments that better align to student centered learning with the possibility to measure individual student growth, include performance tasks, assess when ready with multiple assessments over time, and provide adaptive assessments that measure student knowledge and skills below, at and above grade level.
« For states that wish to pilot new systems of assessments in a subset of districts and schools before scaling statewide, ESSA provides in Section 1204 a new Innovative Accountability and Assessment Demonstration Authority. Initially, up to seven states may be approved to participate in this pilot program.
« There is an opportunity for states to rethink accountability models for continuous improvement, with multiple measures that could align to a new, more comprehensive definition of success, and unprecedented transparency to inform school transformation and encourage reciprocal accountability.
« In eliminating No Child Left Behind’s “Highly Qualified Teacher” provision, ESSA provides a chance for states to engage with stakeholders to define the educator and leader knowledge and skills necessary for supporting student success in personalized learning models.
A National Landscape Scan of Personalized Learning in K-12 Education in the United States
5
PERSONALIZED LEARNING IN STATE REGULATIONS « Rhode Island state regulations 204-RICR-20-00-06 require all middle and high
schools to implement strategies for creating personalized learning environments. Middle and high school educators must participate in at least 15 hours of professional development annually focused on the state’s priority areas, including graduation by proficiency and personalization. All middle and high schools must provide common planning time to teachers focused on the state’s priority areas, including graduation by proficiency and personalization.
« For almost two decades, New Hampshire has consistently and steadily supported systemwide transformation from traditional, one-size-fits-all education to personalized, competency-based approaches. New Hampshire adopted a rule change in 2008, Section Ed 306.27, which allows districts to create their own competencies and required high schools base academic credit on demonstrations of mastery. Districts building competency-based models could create opportunities for students to move at a flexible, personalized pace to progress and demonstrate their learning and provide access to anytime, anywhere learning opportunities.
« Vermont has pursued one of the most comprehensive statewide policy approaches to personalized learning. Vermont state law, Act 77, requires school districts to offer flexible pathways to students and create Personalized Learning Plans for every student in grades 7-12 that enable students to take advantage of these flexible pathways. Vermont’s Education Quality Standards (EQS) require supervisory unions and districts to implement proficiency-based graduation requirements, create balanced systems of assessments, participate in a collaborative continuous improvement process and develop educator and school leader capacity for personalized learning.
A National Landscape Scan of Personalized Learning in K-12 Education in the United States
6
IV. Taking Stock of the ProgressThe excitement about personalized learning is real. We also know from our school visits and meetings,
however, that shining examples and exemplars belie the reality that most schools and districts are only
dipping their toe into personalized learning. Schools are trying out new models, but they may only happen
in a handful of classrooms. Although teachers may be excited, they struggle to translate the ideas of
personalized learning into their day-to-day practice. This mix of excitement and variability makes now an
opportune time to take a look across the field at classrooms and schools and ask:
« How far have we come in personalizing learning?
« How comfortable are teachers in allowing students to shape their own pathways through learning?
« How often do students feel their learning reflects and responds to their talents, interests and needs?
V. A National Scan of Personalized Learning: The Voices of Teachers and Students
Beginning in May 2017, iNACOL, the Center on Reinventing Public Education (CRPE), LEAP Innovations and
NORC partnered to administer to teachers and students a series of questions from the LEAP Personalized
Learning Surveys for Teachers and Students™ probing the extent to which their classrooms reflected
the core elements of the LEAP Learning Framework™. The LEAP Learning Framework was developed
alongside leading experts, school leaders and teachers to provide educators with a clear definition of
personalized learning and the strategies to put it into practice. Closely tied to iNACOL’s definition of
personalized learning, the LEAP Learning Framework features the following foundational principles:10
« Learner Connected™ - Learning transcends location in relevant and valued ways, connected to
families, educators, communities and networks.
« Learner Focused™ - Empower learners to understand their needs, strengths, interests and
approaches to learning.
« Learner Demonstrated™ - Enable learners to progress at their own pace based on demonstrated
competencies.
« Learner Led™ - Entrust learners to take ownership of their learning.
The LEAP Personalized Learning Surveys are designed to capture three of these four foundational
principles and provide integrated scales on the first three elements — Learner Focused, Learner
Demonstrated and Learner Led. All survey questions are designed so that any teacher or student, whether
they were familiar with personalized learning or the LEAP Learning Framework or not, can answer the
questions. For example, one question that intended to capture an aspect of a Learner Demonstrated

A National Landscape Scan of Personalized Learning in K-12 Education in the United States
7
environment reads: How frequently can students demonstrate proficiency anytime during a unit to demonstrate their mastery of the concepts/skills? As a result, the surveys provide a picture of the
extent to which the classroom surveyed displays important behaviors and practices associated with
personalized learning.
Methodology and Sample(s) The analysis that follows examines a national sample of teachers and students intended to reflect the
patterns of practice across our nation’s schools. In addition, we also surveyed teachers in regions and
schools that have made explicit investments in personalized learning.
The national teacher sample includes more than 3,600 teachers whose contact information was available
via a national list of likely teachers. This national sample reflects teachers and classrooms across the
country and not just those involved in explicit efforts to personalize learning. Within the national sample,
we oversampled teachers in six regions that have recently made explicit investments in personalized
learning. These regions include California, Colorado, New England, Ohio, Texas and Wisconsin.
The national student sample includes more than 1,100 students drawn from NORC’s AmeriSpeak panel
who completed the student survey. NORC contacted students through their parents and required their
parents’ permission to complete the survey.
NORC computed statistical weights for teachers and students. These weights are applied to all analyses
reported below.
In addition to the national samples, CRPE and LEAP partnered to administer the LEAP Personalized
Learning Surveys at schools exploring personalized learning as part of the Bill & Melinda Gates
Foundation’s Next Generation Learning Challenge Regional Fund Initiative (NGLC) and the Next
Generation Systems Initiatives (NGSI). These grant programs provided school districts or regional
partners with funding to seed and scale personalized learning in local schools. In the winter of the 2016-
17 school year, NGLC and NGSI schools with explicit efforts to either pilot or adopt personalized learning
approaches were asked to participate in the LEAP Personalized Learning Teacher Survey. Schools from
10 of the 12 NGLC and NGSI grantees participated, though the number of schools from each varied.
In total, 908 teachers from 38 schools participated. This sample includes schools with a wide range of
levels of engagement (in terms of the number of participating teachers) and depth of engagement (in terms
of the length of engagement). However, all participating schools have had some explicit exposure to the
core elements of personalized learning and are being supported in some way to shift their practice toward
personalized learning. Results from this sample compared with the national sample are provided below.
A National Landscape Scan of Personalized Learning in K-12 Education in the United States
8
Though the items for the National Personalized Learning Scan are based on the LEAP Personalized
Learning Surveys, the national instruments and their administration differed in important ways. First, the full
LEAP survey includes several items that do not relate directly to the three components of the Framework.
To make the national survey shorter, we eliminated all items that do not fall into one of the three Framework
components for which scales are generated. Second, the National Scan was conducted in late spring for
teachers and over the summer for students. LEAP typically offers surveys during the fall and spring terms.
Though we made no changes to the teacher items, student items were re-written to be retrospective.
In addition, students were not asked to comment on their experience in a specific teacher’s class but
instead on their experience in either their math or language arts class. Third, the LEAP surveys are typically
administered through schools with multiple teachers and students per school completing them. The
National Scan, however, was administered at the individual level. Teachers and students responding to the
National Scan are unlikely to be from the same school or even city.
The implications of these differences cannot be fully known, but a few considerations are worth noting.
First, an aspect of the Learner Focused component of the Framework is the degree to which teachers feel
they know and understand the needs, interests and motivations of their students. Teachers responding at
the end of the year will have had more time to build these relationships than teachers responding during
the fall or winter. This issue is a particular concern when comparing the NGLC/NGSI sample with the
national sample. Second, asking students to reflect on experiences in their prior school year as opposed to
commenting on their current school year may distort their responses, though it is unclear in what direction.
The following discussion provides a descriptive account of the survey data. For individual survey items, we
report the weighted frequencies for individual items. When comparisons are made across sample groups,
we note when differences are significant at a 95 percent confidence level.
VI. How Are U.S. Teachers and Students Engaging in Personalized Learning?
The decades-long effort to increase academic standards reinforced with assessment has left its
imprint on classrooms across the country. Over the last 20 years, educators developed their capacity
to deliver on standards, track students’ progress on the standards and address learning gaps with data-
driven instruction and focused acceleration. Providing personalized pacing, marking progress through
competency, and allowing students to shape their own learning never fully disappeared but took a decided
back seat as teachers took on increasing demands to show students meeting standards.11

A National Landscape Scan of Personalized Learning in K-12 Education in the United States
9
Before diving into responses on individual survey questions, we consider aggregate scales reflecting
three central components of the LEAP Learning Framework: Learner Demonstrated, Learner Focused
and Learner Led. These scales show the extent to which each survey respondent’s answers reflect
the implementation of underlying principles of each of the framework components. The scaled scores
range from 200 to 300.12 Based on the judgments of an expert panel of instructors, a standard set of cut
points was defined within the scales indicating the level of progression achieved toward LEAP’s vision of
personalization for each component. The categories correspond with response patterns that the expert
panel would expect from teachers in which:
« personalization is just starting to show (emerging personalization),
« personalization is apparent but not a consistent presence (moderate (low) and moderate (high)
personalization), and
« personalization is consistently present in the classroom (high personalization).
It is important to remember that these judgments are based on the expectations and understanding of
personalized practice by the expert panel at that time. As we stand early in this effort, these judgments
are sure to be honed and refined over time.
The National Scan shows how deep the imprint of standards and assessment reform was pressed.
Looking across the three personalized learning components in the LEAP Learning Framework in Figure 3,
we see that teachers across the country create classrooms that are Learner Focused. That is, teachers
are creating environments in which they come to know their students individually and students have the
opportunity to understand themselves as individuals and as learners. Based on teachers’ responses from
the National Personalized Learning Scan, nearly 70 percent of teachers are providing moderate-to-high
levels of Learner Focused environments in their classrooms.13
When it comes to creating classroom environments that allow students to demonstrate their learning in
their own way and at their own pace and classroom environments in which students are shaping what
and how they learn, however, United States classrooms are well behind. Nearly 80 percent of elementary
and middle school classrooms across the country show few measurable signs that students can
proceed through content at their own pace (Learner Demonstrated) and slightly more than 60 percent of
classrooms show few measurable signs that students are enabled to take ownership of their learning so
that it can dynamically adjust to their skills, curiosity and goals (Learner Led) (See Figure 3).14
A National Landscape Scan of Personalized Learning in K-12 Education in the United States
10
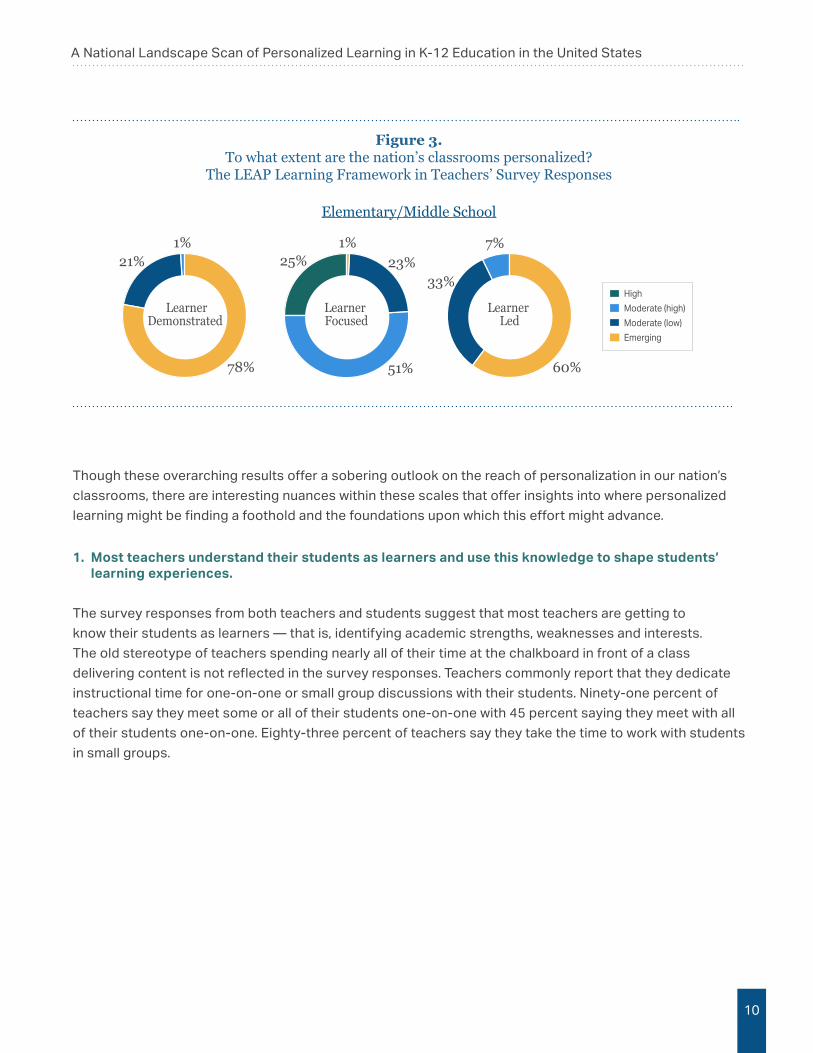
Figure 3. To what extent are the nation’s classrooms personalized?
The LEAP Learning Framework in Teachers’ Survey Responses
Elementary/Middle School
Though these overarching results offer a sobering outlook on the reach of personalization in our nation’s
classrooms, there are interesting nuances within these scales that offer insights into where personalized
learning might be finding a foothold and the foundations upon which this effort might advance.
1. Most teachers understand their students as learners and use this knowledge to shape students’ learning experiences.
The survey responses from both teachers and students suggest that most teachers are getting to
know their students as learners — that is, identifying academic strengths, weaknesses and interests.
The old stereotype of teachers spending nearly all of their time at the chalkboard in front of a class
delivering content is not reflected in the survey responses. Teachers commonly report that they dedicate
instructional time for one-on-one or small group discussions with their students. Ninety-one percent of
teachers say they meet some or all of their students one-on-one with 45 percent saying they meet with all
of their students one-on-one. Eighty-three percent of teachers say they take the time to work with students
in small groups.
25%
51%
23%1%
Figure 4: LEAP Scales -- ES/MS
Learner Focused
7%
33%
60%
Learner Led
1%21%
78%
Learner Demonstrated
High
Moderate (high)
Moderate (low)
Emerging
A National Landscape Scan of Personalized Learning in K-12 Education in the United States
11
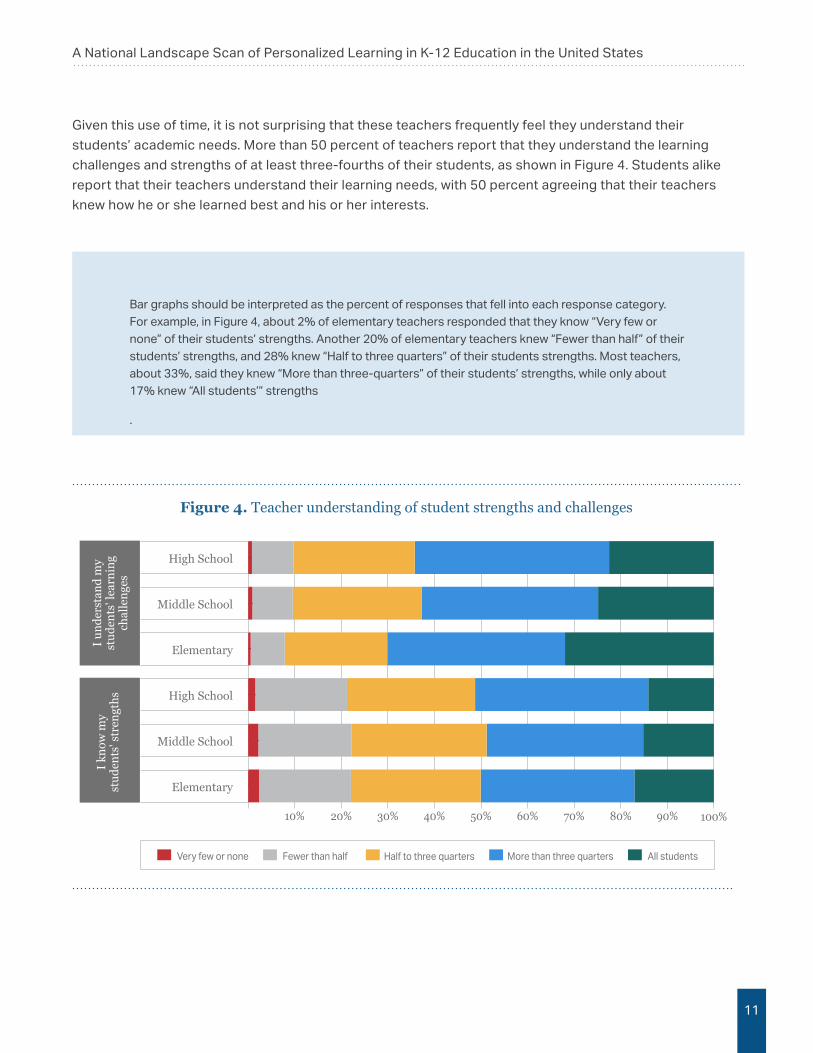
Given this use of time, it is not surprising that these teachers frequently feel they understand their
students’ academic needs. More than 50 percent of teachers report that they understand the learning
challenges and strengths of at least three-fourths of their students, as shown in Figure 4. Students alike
report that their teachers understand their learning needs, with 50 percent agreeing that their teachers
knew how he or she learned best and his or her interests.
Bar graphs should be interpreted as the percent of responses that fell into each response category. For example, in Figure 4, about 2% of elementary teachers responded that they know “Very few or none” of their students’ strengths. Another 20% of elementary teachers knew “Fewer than half” of their students’ strengths, and 28% knew “Half to three quarters” of their students strengths. Most teachers, about 33%, said they knew “More than three-quarters” of their students’ strengths, while only about 17% knew “All students’” strengths
.
Figure 4. Teacher understanding of student strengths and challengesFigure 5. Teacher understanding of student strengths and challenges
10% 20% 30% 40% 50% 60% 70% 80% 90% 100%
All studentsMore than three quartersHalf to three quartersFewer than halfVery few or none
Elementary
Middle School
High School
Elementary
Middle School
High School
I kn
ow m
yst
uden
ts' s
tren
gths
I un
ders
tand
my
stud
ents
' lea
rnin
gch
alle
nges
A National Landscape Scan of Personalized Learning in K-12 Education in the United States
12
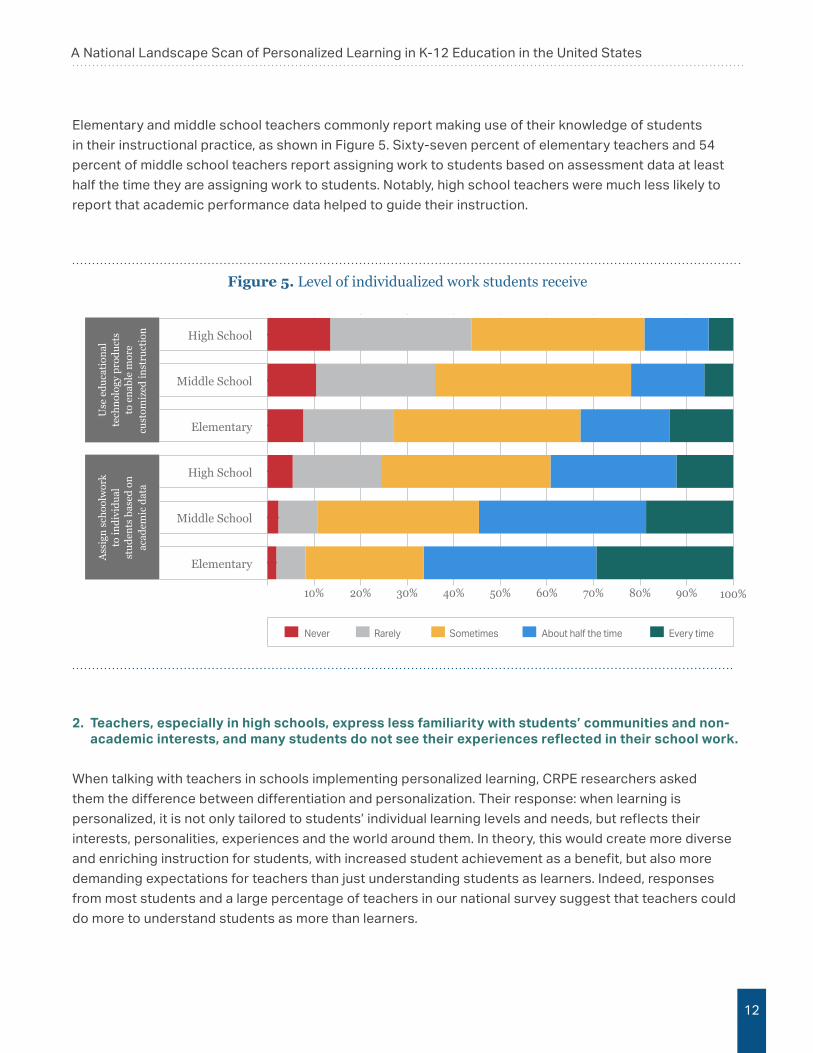
Elementary and middle school teachers commonly report making use of their knowledge of students
in their instructional practice, as shown in Figure 5. Sixty-seven percent of elementary teachers and 54
percent of middle school teachers report assigning work to students based on assessment data at least
half the time they are assigning work to students. Notably, high school teachers were much less likely to
report that academic performance data helped to guide their instruction.
Figure 5. Level of individualized work students receive
2. Teachers, especially in high schools, express less familiarity with students’ communities and non-academic interests, and many students do not see their experiences reflected in their school work.
When talking with teachers in schools implementing personalized learning, CRPE researchers asked
them the difference between differentiation and personalization. Their response: when learning is
personalized, it is not only tailored to students’ individual learning levels and needs, but reflects their
interests, personalities, experiences and the world around them. In theory, this would create more diverse
and enriching instruction for students, with increased student achievement as a benefit, but also more
demanding expectations for teachers than just understanding students as learners. Indeed, responses
from most students and a large percentage of teachers in our national survey suggest that teachers could
do more to understand students as more than learners.
Figure 6. Level of individualized work students receive
10% 20% 30% 40% 50% 60% 70% 80% 90% 100%
Never Rarely Sometimes About half the time Every time
Elementary
Middle School
High School
Elementary
Middle School
High School
Ass
ign
scho
olw
ork
to in
divi
dual
st
uden
ts b
ased
on
acad
emic
dat
a
Use
edu
cati
onal
tech
nolo
gy p
rodu
cts
to e
nabl
e m
ore
cust
omiz
ed in
stru
ctio
n
A National Landscape Scan of Personalized Learning in K-12 Education in the United States
13
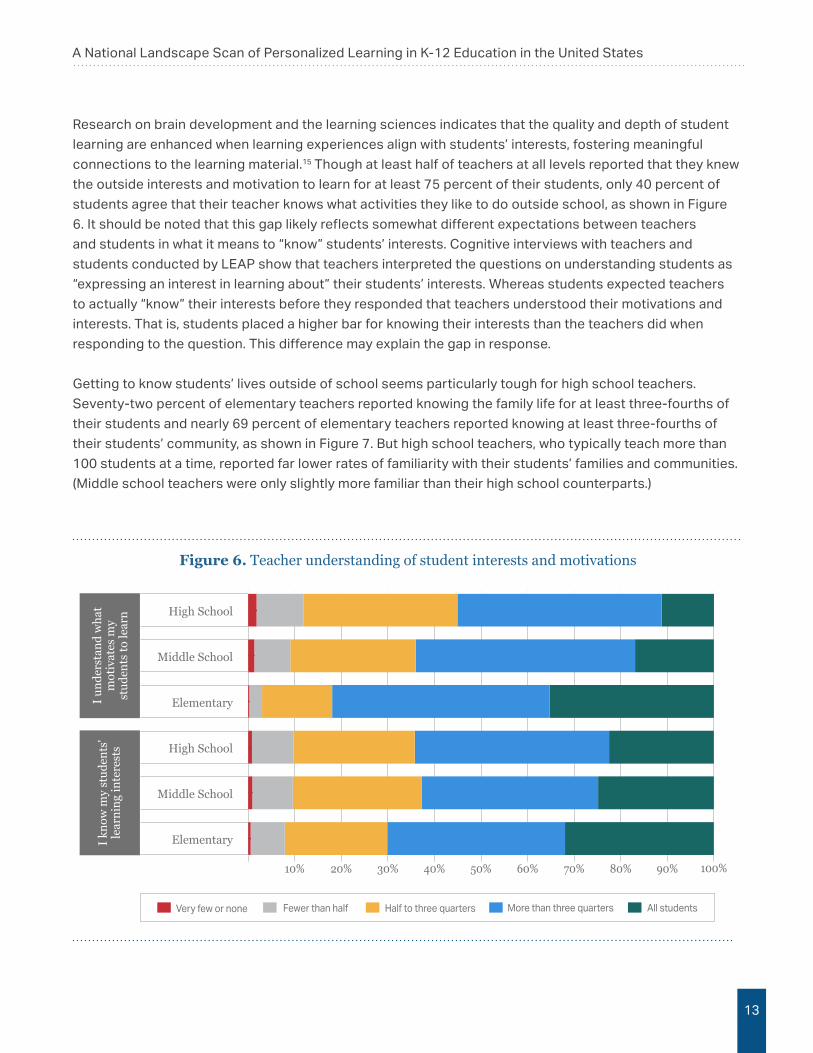
Research on brain development and the learning sciences indicates that the quality and depth of student
learning are enhanced when learning experiences align with students’ interests, fostering meaningful
connections to the learning material.15 Though at least half of teachers at all levels reported that they knew
the outside interests and motivation to learn for at least 75 percent of their students, only 40 percent of
students agree that their teacher knows what activities they like to do outside school, as shown in Figure
6. It should be noted that this gap likely reflects somewhat different expectations between teachers
and students in what it means to “know” students’ interests. Cognitive interviews with teachers and
students conducted by LEAP show that teachers interpreted the questions on understanding students as
“expressing an interest in learning about” their students’ interests. Whereas students expected teachers
to actually “know” their interests before they responded that teachers understood their motivations and
interests. That is, students placed a higher bar for knowing their interests than the teachers did when
responding to the question. This difference may explain the gap in response.
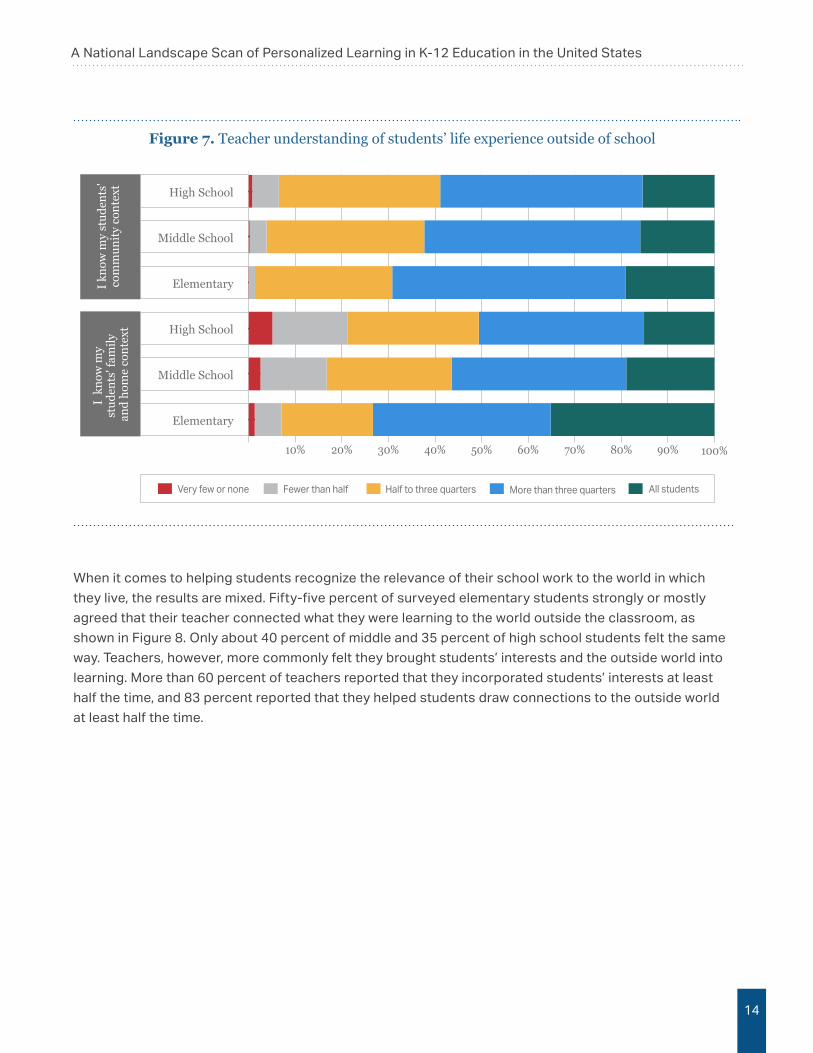
Getting to know students’ lives outside of school seems particularly tough for high school teachers.
Seventy-two percent of elementary teachers reported knowing the family life for at least three-fourths of
their students and nearly 69 percent of elementary teachers reported knowing at least three-fourths of
their students’ community, as shown in Figure 7. But high school teachers, who typically teach more than
100 students at a time, reported far lower rates of familiarity with their students’ families and communities.
(Middle school teachers were only slightly more familiar than their high school counterparts.)
Figure 6. Teacher understanding of student interests and motivationsFigure 7. Teacher understanding of student interests and motivations
10% 20% 30% 40% 50% 60% 70% 80% 90% 100%
All studentsMore than three quartersHalf to three quartersFewer than halfVery few or none
Elementary
Middle School
High School
Elementary
Middle School
High School
I kn
ow m
y st
uden
ts'
lear
ning
inte
rest
sI
unde
rsta
nd w
hat
mot
ivat
es m
yst
uden
ts to
lear
n
A National Landscape Scan of Personalized Learning in K-12 Education in the United States
14
Figure 8. Teacher understanding of students’ life experience outside of school
10% 20% 30% 40% 50% 60% 70% 80% 90% 100%
All studentsMore than three quartersHalf to three quartersFewer than halfVery few or none
Elementary
Middle School
High School
Elementary
Middle School
High School
I kn
ow m
y st
uden
ts'
com
mun
ity
cont
ext
I k
now
my
stud
ents
' fam
ily
and
hom
e co
ntex
tFigure 7. Teacher understanding of students’ life experience outside of school
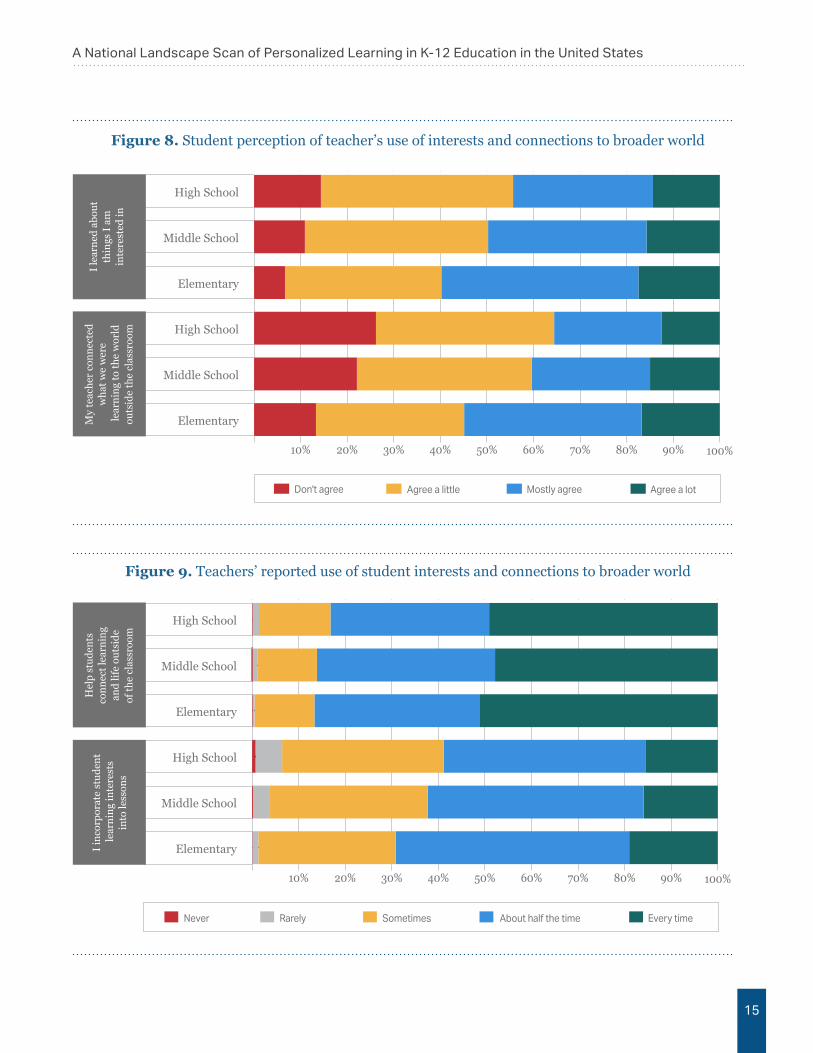
When it comes to helping students recognize the relevance of their school work to the world in which
they live, the results are mixed. Fifty-five percent of surveyed elementary students strongly or mostly
agreed that their teacher connected what they were learning to the world outside the classroom, as
shown in Figure 8. Only about 40 percent of middle and 35 percent of high school students felt the same
way. Teachers, however, more commonly felt they brought students’ interests and the outside world into
learning. More than 60 percent of teachers reported that they incorporated students’ interests at least
half the time, and 83 percent reported that they helped students draw connections to the outside world
at least half the time.
A National Landscape Scan of Personalized Learning in K-12 Education in the United States
15
Figure 8. Student perception of teacher’s use of interests and connections to broader world
Figure 9. Teachers’ reported use of student interests and connections to broader world
Figure 9. Student perception of teacher’s use of interests and connections to broader world
10% 20% 30% 40% 50% 60% 70% 80% 90% 100%
Agree a lotMostly agreeAgree a littleDon't agree
Elementary
Middle School
High School
Elementary
Middle School
High School
My
teac
her
conn
ecte
dw
hat w
e w
ere
lear
ning
to th
e w
orld
outs
ide
the
clas
sroo
m
I le
arne
d ab
out
thin
gs I
am
inte
rest
ed in
Figure 10. Teachers’ reported use of student interests and connections to broader world
10% 20% 30% 40% 50% 60% 70% 80% 90% 100%
Every timeAbout half the timeSometimesRarelyNever
Elementary
Middle School
High School
Elementary
Middle School
High School
Hel
p st
uden
ts
conn
ect l
earn
ing
and
life
outs
ide
of th
e cl
assr
oom
I in
corp
orat
e st
uden
t le
arni
ng in
tere
sts
into
less
ons

A National Landscape Scan of Personalized Learning in K-12 Education in the United States
16
3. Most teachers are reluctant to give students control of pacing, content and learning activities.
In personalized learning, students are expected to collaborate with their teachers to set the pace for their
progress and shape what and how they learn. However, giving students more control over pace, content
and learning activities is among the toughest transitions for teachers engaged in personalized learning.
In interviews, teachers told us that the pressure to meet learning standards, worries about classroom
management and uncertainty about students’ self-direction make the idea of turning control over to
students very risky. This natural reluctance to cede control is reflected in the National Personalized
Learning Scan.
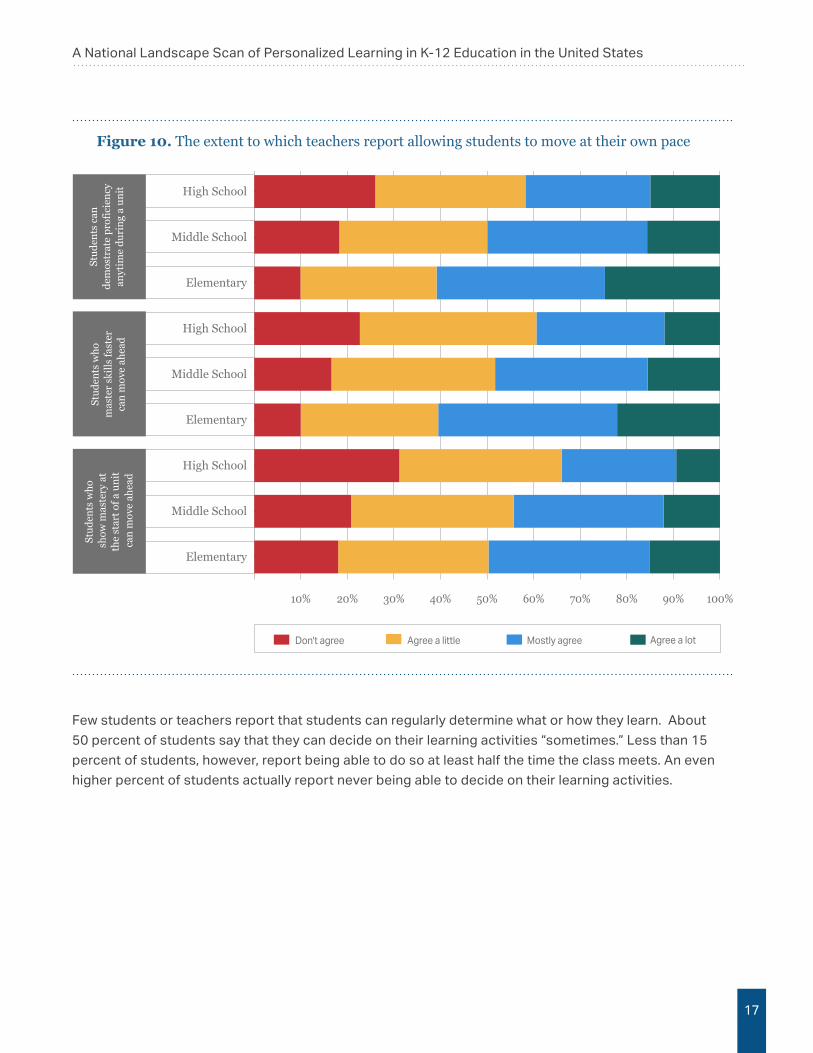
By and large, the unit structure (content divided into units that close with a test or an assessment) still
governs pacing in most classrooms, although there might be some flexibility within units. Only 20 percent
of students reported that their teachers would let them skip a topic if they could show they understand
it and only about 30 percent of students reported that they would be allowed to move ahead of other
students if they showed they understood the topic. Among teachers across all levels, as illustrated in
Figure 10, less than half said students who show mastery at the start of a unit could move ahead in the
curriculum. During a unit, more than 50 percent of elementary teachers report allowing students to
demonstrate proficiency any time and a similar percentage report that they would allow students who
master skills faster to move ahead of other students. High school teachers, however, are more reluctant to
flex pacing. Slightly more than 30 percent of teachers allow students to demonstrate mastery on units they
have already learned and move ahead to the next unit when ready. In our survey, only about 40 percent of
high school teachers give students the opportunity to test out of a unit any time or advance if they show
mastery faster than other students. (Again, the percent of middle school teachers flexing pacing in the
above mentioned ways fall between the high school and elementary teachers.)
A National Landscape Scan of Personalized Learning in K-12 Education in the United States
17
Figure 10. The extent to which teachers report allowing students to move at their own pace
Few students or teachers report that students can regularly determine what or how they learn. About
50 percent of students say that they can decide on their learning activities “sometimes.” Less than 15
percent of students, however, report being able to do so at least half the time the class meets. An even
higher percent of students actually report never being able to decide on their learning activities.
Figure 11. The extent to which teachers report allowing students to move at their own pace
Stud
ents
who
mas
ter
skill
s fa
ster
can
mov
e ah
ead
Stud
ents
who
s
how
mas
tery
at
the
star
t of a
uni
t c
an m
ove
ahea
d
Stud
ents
can
dem
ostr
ate
prof
icie
ncy
anyt
ime
duri
ng a
uni
t
10% 20% 30% 40% 50% 60% 70% 80% 90% 100%
Agree a lotMostly agreeAgree a littleDon't agree
Elementary
Middle School
High School
Elementary
Middle School
High School
Elementary
Middle School
High School

A National Landscape Scan of Personalized Learning in K-12 Education in the United States
18
Teachers also report that they tend to maintain control over how and what students learn. As shown in
Figure 11, between 36 and 42 percent of teachers allow students to decide their learning activities at
least half the time and only between 22 and 27 percent say they allow students to decide what they will
learn at least half the time.
Figure 11. How often teachers allow students to choose what and how they learn
In addition, students do not routinely shape their own learning goals or have their own unique set of
learning goals. About 32 percent of students say they set their learning goals at least half the time the
class meets. Between 22 and 36 percent of teachers, as found in Figure 12, say that students set their
own learning goals at least half the time they meet for class. Only between 19 and 29 percent of teachers
report that most or all of their students have unique learning goals. Similar to other queries, high school
teachers report lower uses of learning goals than teachers at other levels of schooling.
Figure 12. How often teachers allow students to choose what and how they learn
10% 20% 30% 40% 50% 60% 70% 80% 90% 100%
Every timeAbout half the timeSometimesRarelyNever
Elementary
Middle School
High School
Elementary
Middle School
High School
Stud
ents
mak
ech
oice
on
wh
at
to le
arn
in c
lass
Stud
ents
mak
ech
oice
on
how
to le
arn
in c
lass

A National Landscape Scan of Personalized Learning in K-12 Education in the United States
19
Figure 12. How often teachers personalize and allow students to shape learning goals
4. The student experience with personalized learning generally doesn’t appear to vary by race, ethnicity, or socioeconomic background.
Recently, researchers and advocates have raised concerns that low-income or students of color have
less access to non-traditional learning models like personalized learning. Whether due to cultural
traditions about what schools should look like or structural concerns such as the drive for test results
in schools serving a high concentration of students falling below grade level, critics have worried that
some students are being left out of these instructional innovations.16 However, the survey reveals some
encouraging signs.
Among the students we surveyed, we found only two statistically significant differences in the learning
experience by race, ethnicity or the socioeconomic status of students’ families. First, white students
were less likely than black or Hispanic students to say that they shaped their own learning goals at least
half the time, as shown in Figure 13. Second, black students were less likely to say that their teachers
connected their content to the outside world, as shown in Figure14. We saw no significant differences by
parents’ education, which we use as a proxy for the socioeconomic status of students’ families.
Figure 13. How often teachers personalize and allow students to shape learning goals
10% 20% 30% 40% 50% 60% 70% 80% 90% 100%
Every timeAbout half the timeSometimesRarelyNever
Elementary
Middle School
High School
Elementary
Middle School
High School
Stud
ents
cre
ate
goal
sfo
r th
eir
own
lear
ning
Stud
ents
hav
e a
uniq
ue
set o
f lea
rnin
g go
als

A National Landscape Scan of Personalized Learning in K-12 Education in the United States
20
Figure 13. Students report setting their own learning goal
Figure 14. Students report that teachers connect learning to the outside world
Figure 14. Students report setting their own learning goal
10% 20% 30% 40% 50% 60% 70% 80% 90% 100%
About every timeAbout half the timeSometimesRarelyNever
Other
Hispanic
Black
White
Figure 15. Students report that teachers connect learning to the outside world
10% 20% 30% 40% 50% 60% 70% 80% 90% 100%
Agree a lotMostly agreeAgree a littleDon't agree
Other
Hispanic
Black
White

A National Landscape Scan of Personalized Learning in K-12 Education in the United States
21
Importantly, our survey examines students’ learning experiences nationally and can only confirm if
students’ learning experiences typically incorporate personalized learning in ways that vary systematically
with students’ race, ethnicity, or socioeconomic status. Nationally, however, only a fraction of schools
are pursuing personalized learning or other non-traditional models with considerable intent, and we don’t
know if their student populations broadly mirror schools in general. It is still possible that minority and
low-income students are under-represented in the subset of schools pursuing personalized learning.
Although this analysis cannot tell us if low income and minority students are under-represented among
personalized learning schools, this question of equal access is a significant concern in our organizations
and for other national leaders. A serious and thorough examination of equitable access should be a
priority for future research.
VII. Looking Forward: What Are the Opportunities to Support Personalized Learning?
The discussion to this point shows that many central elements of a personalized learning environment are
still only emerging on the national landscape. The national scan, however, offers a few points of light that
could be leveraged to support a shift toward more personalized learning.
Technology and data seem widely available across classrooms, especially in high schools. Technology tools, which can facilitate independent pacing, differentiation to support students working
at different levels or with different challenges, assessment and content delivery, appear widely available
across classrooms, particularly high schools. Sixty percent of middle and high school teachers report that
students have access to one-to-one devices (such as laptops or tablets) in their classrooms. The rate is
lower in elementary schools but still as high as 52 percent.
Teachers also reported that they use technology to support differentiation and access to learning
content. Forty-six and 36 percent of elementary and middle school teachers, respectively, use software
to differentiate instruction at least half the time. High school teachers are less likely to use software to
differentiate instruction but more than 50 percent report that their class material is available to students
online, opening up opportunities for anytime, anywhere learning.
Teachers in “NextGen” schools are more likely to give students control over their pacing and learning. Since 2015, schools in six districts and six other areas supported by regional partners have sought
and tested new school, classroom and instructional models to personalize learning.17 Teachers in
these “NextGen” schools had access to a range of support from their central offices, regional partners,
consultants and national networks to learn about and implement strategies to do so. The NextGen schools
differ in their approaches to personalized learning. For example, some schools reconfigured their school
schedule to provide students with large blocks of flexible time that students use by their own design.
Some schools incorporated technology stations into classic station rotation models. Others restructured

A National Landscape Scan of Personalized Learning in K-12 Education in the United States
22
classes and staff to allow for flexible grouping across grade levels. Still, others advanced teachers’
capacity to deliver content through complex student-directed projects. Despite the different approaches, in
interviews, participating teachers across the initiative expressed a shared, underlying interest in providing
for tailored learning experiences that students had some hand in shaping.
As such, we might expect that these schools have more commitment or intention than the average school
in our national sample; indeed many of them define or market themselves explicitly as personalized learning
schools. But are teachers in NextGen schools more likely to incorporate LEAP’s Learning Framework
components into their practice? An earlier survey by RAND suggests that teacher practice in schools
explicitly seeking to personalize learning differs very little from the typical classroom teacher in the country.
Though the RAND survey was designed to capture a vision of personalized learning that drew more heavily
on technology than our National Personalized Learning Scan, and the national sample was drawn by a
different methodology, we too found that the national sample and NextGen sample reported comparably on
several items. When considering the aggregate scales on the three LEAP Learning Framework components,
the NextGen elementary and middle schools included in our study do not appear markedly different from
schools nationwide, except for appearing to focus less on student interests and background (Learner
Focused). (See Figure 15.)
Figure 15. To what extent are the NextGen classrooms personalized?
The LEAP Learning Framework in Teachers’ Survey Responses
Elementary/Middle School
17%
41% 37%
5%3%
25% 72%
Figure 16. To what extent are the NextGen classrooms personalized? The LEAP Learning Framework in Teachers’ Survey Responses
Learner Focused
7%
27%
66%
Learner Led
Learner Demonstrated
High
Moderate (high)
Moderate (low)
Emerging

A National Landscape Scan of Personalized Learning in K-12 Education in the United States
23
When we look at the items comprising these scales, however, we found compelling distinctions. Teachers
in NextGen and national samples reported that students have access to performance data at least 50
percent of the time the class meets. The samples also report giving students opportunities to reflect on
their work at similar frequencies. Teachers from NextGen schools were significantly more likely to report
giving students more flexibility and control in their learning. As shown in Figure 16, these teachers report
giving their students many opportunities to demonstrate their learning throughout units, allowing them
to move ahead once they demonstrate their understanding of topics, and giving students more time to
master topics if they need it. These differences are most pronounced among middle and high school
teachers, who in the national sample are least likely to allow this kind of flexibility. Teachers in NextGen
middle and high schools are also more likely to give their students more control over what and how they
learn, as shown in Figure 17.
Figure 16. The extent to which NextGen and national sample teachers give students flexibility in pacing (all grade levels)
Figure 17. The extent to which NextGen and national sample teachers give students flexibility in pacing (all grade levels)
0 1 2 3 4 5
NextGenNational
Know what to do for proficiency *
Can design or suggest how to show proficiency *
Choice over how to show proficiency *
Can show proficiency at any time *
Can move ahead if master skills faster *
More challenging work for faster students
Can take as much time as necessary *
Practice or review until understanding *
Start or move on based on mastery *
Retake assessments *
Notes: Values are the average scaled response for each sample (NextGen or National) from 1, “Don’t agree,” to 5, “Agree a lot.” * Indicates a statistically significant difference between the NextGen sample and the national sample.
A National Landscape Scan of Personalized Learning in K-12 Education in the United States
24
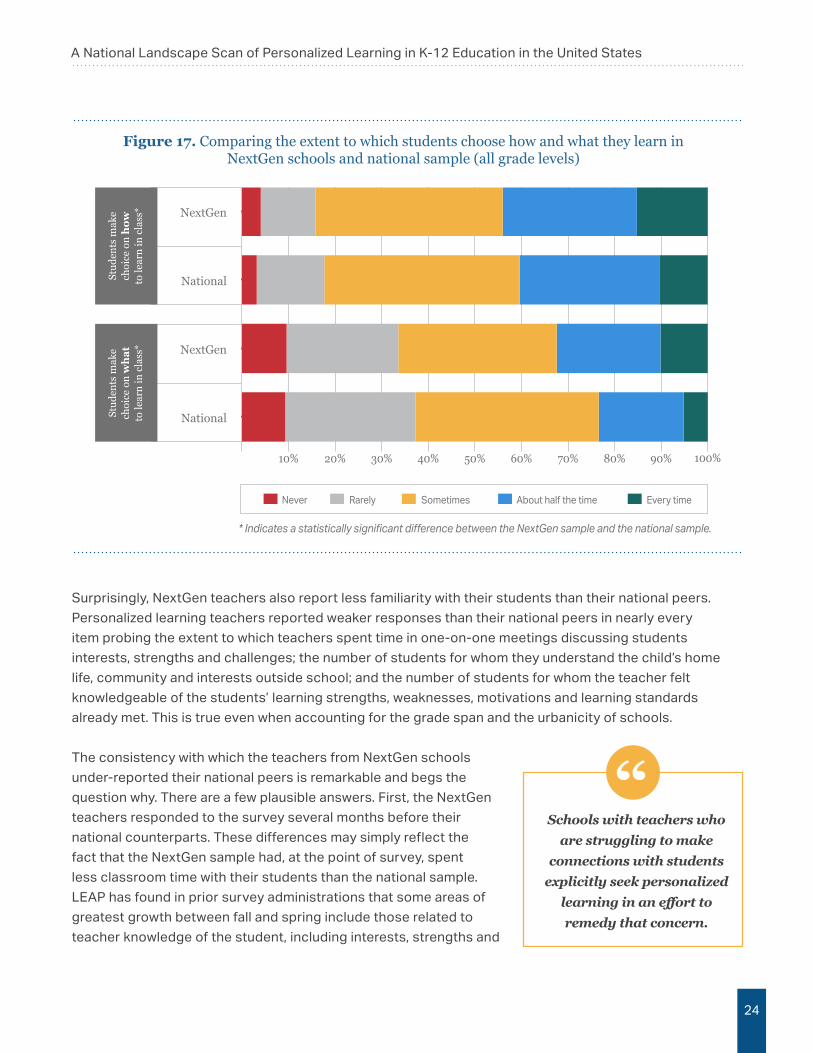
Figure 17. Comparing the extent to which students choose how and what they learn in NextGen schools and national sample (all grade levels)
Surprisingly, NextGen teachers also report less familiarity with their students than their national peers.
Personalized learning teachers reported weaker responses than their national peers in nearly every
item probing the extent to which teachers spent time in one-on-one meetings discussing students
interests, strengths and challenges; the number of students for whom they understand the child’s home
life, community and interests outside school; and the number of students for whom the teacher felt
knowledgeable of the students’ learning strengths, weaknesses, motivations and learning standards
already met. This is true even when accounting for the grade span and the urbanicity of schools.
The consistency with which the teachers from NextGen schools
under-reported their national peers is remarkable and begs the
question why. There are a few plausible answers. First, the NextGen
teachers responded to the survey several months before their
national counterparts. These differences may simply reflect the
fact that the NextGen sample had, at the point of survey, spent
less classroom time with their students than the national sample.
LEAP has found in prior survey administrations that some areas of
greatest growth between fall and spring include those related to
teacher knowledge of the student, including interests, strengths and
Figure 18. Comparing the extent to which students choose how and what they learn in NextGen schools and national sample (all grade levels)
10% 20% 30% 40% 50% 60% 70% 80% 90% 100%
Every timeAbout half the timeSometimesRarelyNever
National
NextGen
National
NextGen
Stud
ents
mak
ech
oice
on
how
to le
arn
in c
lass
*
Stud
ents
mak
ech
oice
on
wh
atto
lear
n in
cla
ss*
* Indicates a statistically significant difference between the NextGen sample and the national sample.
Schools with teachers who are struggling to make
connections with students explicitly seek personalized
learning in an effort to remedy that concern.

A National Landscape Scan of Personalized Learning in K-12 Education in the United States
25
needs. Second, teachers in NextGen schools may have a higher than average set of expectations about
what it means to know a child’s learning needs, motivations, community and family (especially if they have
been exposed to more training, examples, or planning time where they considered what this “looks like”
at a personalized learning school). A third conclusion is that schools with teachers who are struggling to
make connections with students explicitly seek personalized learning in an effort to remedy that concern.
Though the differences between the NextGen teachers and their national counterparts suggest a
relationship between committing to personalized learning and changes in classroom practice, it is
important to recognize that these surveys are a snapshot in time and can’t tell us if practice in these
personalized learning schools changed as a result of their engagement. Instead, these analyses show
us that teachers at NextGen schools committing to personalized learning are more likely to routinely
give students flexibility in their learning than is typical, though they also seem less likely to feel they
understand their students’ learning needs, personal background and interests.
VIII. Building Blocks for Personalized LearningAs we visited districts and schools, it was clear to us that many educators valued the goals of
personalized learning, even while fully acknowledging the lift these goals require. Personalized learning
aligns with “what it means to be a teacher” in profound ways; many educators linked their current
aspirations to deliver personalized and connected curriculum to all of their students back to their original
inspirations to become a teacher. These sentiments carried teachers forward, despite telling us that they
were spending long hours reworking lessons, building up a new quiver of strategies and dissecting and
rehashing both their failures and successes. But they remained motivated.
The landscape presented here shows that, nationally, most
classrooms are far from personalized, flexible and student-
centered. Nowhere is this more true than in our high schools
where teaching loads, traditions and expectations for
college preparation are all likely coming together to reinforce
more traditional, teacher-driven teaching models. A national
shift toward more personalized learning experiences will
challenge educators, school leaders, districts and partners
who come to the table. As much as policy and systems are
creating space for personalized learning, we will have to do
more to encourage teachers and school leaders to shift the
culture in their schools toward personalizing, to take the risk
of trying new strategies and to identify the supports needed
to move schools beyond tinkering.
Teachers across the sample reported knowing students as learners, and students in
large numbers reported being known as learners. The harder
work on flexible pacing, competency-based progression
and student-directed work is yet to be taken on fully.
A National Landscape Scan of Personalized Learning in K-12 Education in the United States
26
This National Personalized Learning Scan, however, also reveals a few building blocks from which
this movement could expand. Teachers across the sample reported knowing students as learners,
and students in large numbers reported being known as learners. The harder work on flexible pacing,
competency-based progression and student-directed work is yet to be taken on fully. Teachers in NextGen
districts and regions are reporting more flexibility in pacing and giving students more opportunities to
direct their learning. We’ll be watching to see if these early explorers’ efforts take hold systemically, and if
they lead educators across the country toward new, more personalized instructional designs that better
serve all students’ and help reach their full potential. Teachers are also using data and group work to
differentiate instruction to students’ skills and to incorporate students’ interests. Technology, which can
be a valuable tool for teachers looking to maximize their students’ time inside and outside school, is widely
available. Increasing educator capacity to personalize instruction and creating learning environments
toward greater student agency require building knowledge and skills to thrive and adapt (and learn how to
navigate) in modern contexts. These are all important foundations from which teachers can explore and
iterate to create more personalized learning environments.
A National Landscape Scan of Personalized Learning in K-12 Education in the United States
27
ResourcesPersonalized Learning
« iNACOL — Mean What You Say: Defining and Integrating Personalized, Blended and Competency
Education
« iNACOL — What’s Possible with Personalized Learning? An Overview of Personalized Learning for
Schools, Families and Communities
« iNACOL — Student-Centered Learning: Functional Requirements for Integrated Systems to
Optimize Learning
« KnowledgeWorks — The Shifting Paradigm of Teaching: Personalized Learning According to
Teachers
« LEAP Innovations — LEAP Learning Framework for Personalized Learning
« LEAP Innovations — Personalized Learning(s) from the Field: A Report from the LEAP Innovations
Pilot Network Cohort 2
« LEAP Innovations and Afton Partners — Sustaining Innovation and Preparing for Scale: Financial
Sustainability Research and Analysis of Personalized Learning School Models
« Next Generation Learning Challenges — Introduction and Overview of the MyWays Student
Success Series
« RAND Corporation — Designing Innovative High Schools: Implementation of the Opportunity by
Design Initiative After Two Years
« RAND Corporation — Continued Progress: Promising Evidence on Personalized Learning
Competency-Based Education
« Achieve — The Role of Learning Progressions in Competency-Based Pathways
« CompetencyWorks — What Is Competency Education?
« CompetencyWorks — Quality and Equity by Design: Charting the Course for the Next Phase of
Competency-Based Education
« CompetencyWorks — In Search of Efficacy: Defining the Elements of Quality in a Competency-
Based Education System
« CompetencyWorks — Meeting Students Where They Are
« CompetencyWorks — Implementing Competency Education in K-12 Systems: Insights from Local
Leaders
« CompetencyWorks — Maximizing Competency Education and Blended Learning: Insights from
Experts
« Great Schools Partnership — Proficiency-Based Learning
« Great Schools Partnership — Research Evidence for Proficiency-Based Learning
« Jobs for the Future — The Past and the Promise: Today’s Competency Education Movement
« Springpoint — Designing New School Models: A Practical Guide

A National Landscape Scan of Personalized Learning in K-12 Education in the United States
28
Equity
« CompetencyWorks — Designing for Equity: Leveraging Competency-Based Education to Ensure
All Students Succeed
« National Equity Project — Why Equity?
« Jobs for the Future — Equity in Competency Education: Realizing the Potential, Overcoming the
Obstacles
« OECD — Equity and Quality in Education: Supporting Disadvantaged Students and Schools
« UNESCO — Thematic Indicators to Monitor the Education 2030 Agenda: Technical Advisory Group
Proposal
State Policy to Support Personalized, Competency-Based Education
« American Institutes for Research — Lifelong Learning Skills for College and Career Readiness:
Considerations for Education Policy
« iNACOL — Current to Future State: Issues and Action Steps for State Policy to Support
Personalized, Competency-Based Learning
« iNACOL — Fit for Purpose: Taking the Long View on Systems Change and Policy to Support
Competency Education
« iNACOL — State Policy & K-12 Competency-Based Education
« iNACOL — Meeting The Every Student Succeeds Act’s Promise: State Policy to Support
Personalized Learning
« iNACOL — Promising State Policies for Personalized Learning
« KnowledgeWorks — A State Policy Framework for Scaling Personalized Learning
« KnowledgeWorks — A Visioning Toolkit for Better Assessments
« National Conference of State Legislatures — No Time to Lose: How to Build a World-Class
Education System State by State
A National Landscape Scan of Personalized Learning in K-12 Education in the United States
29
GlossaryWe find ourselves in a highly creative and visionary time of deconstruction and re-design. Terminology
is changing, refining, and expanding. Identifying points of intersection lead us to deeper understanding
of how concepts can be woven together. The innovations of practitioners lift our expectations and open
new doors. Thus, we offer the following terminology to help us communicate with each other with the
understanding that it is likely that many will use different terminology or assign different meaning.
Competency-Based Education
Competency-based education,18 also known as mastery-based, proficiency-based, or performance-
based, is a school- or district-wide structure that replaces the traditional structure to create a system that
is designed for students to be successful (as compared to sorted) and leads to continuous improvement.
In 2011, 100 innovators in competency education came together for the first time to develop a working
definition of high-quality competency education, which includes five elements:
• Students advance upon demonstrated mastery.
• Competencies include explicit, measurable, transferable learning objectives that empower
students.
• Assessment is meaningful and a positive learning experience for students.
• Students receive timely, differentiated support based on their individual learning needs.
• Learning outcomes emphasize competencies that include application and creation of knowledge,
along with the development of important skills and dispositions.
Curriculum There are many definitions of curriculum in education. Internationally, the term curriculum or curriculum
frameworks refers to the high-level knowledge and skills students are expected to learn and describe (i.e.,
competencies). The curriculum framework may include student learning objectives or learning standards.
In the United States, the term curriculum also refers to the resources that teachers use when designing
instruction and assessment to support student learning, including: the course syllabi, units and lessons
that teachers teach; the assignments and projects given to students; the materials (books, videos,
presentations, activities) used in a course, module, or unit; and the assessments used to evaluate student
learning and check for understanding.
iNACOL will use the term learning experiences to refer to the design of the learning process and the
accompanying set of resources to support student learning.
Educational Equity There are many definitions of equity in education. iNACOL will use the definition from the National Equity
Project:19
A National Landscape Scan of Personalized Learning in K-12 Education in the United States
30
Education equity means that each child receives what he or she needs to develop to his or her full
academic and social potential. Working toward equity involves:
1. Ensuring equally high outcomes for all participants in our educational system; removing the
predictability for success or failures that currently correlates with any social or cultural factor;
2. Interrupting inequitable practices, examining biases, and creating inclusive multicultural school
environments for adults and children; and
3. Discovering and cultivating the unique gifts, talents, and interests that every human possesses.
Equality Equality is related to the principles of fairness and justice. It refers to equal treatment and, in the past, has
been used to refer to equal inputs. iNACOL uses the term equality as an aspirational goal of all students
reaching their full potential.
Integrated Student Support ServicesIntegrated student support services refer to a wide variety of instructional methods, educational services
or school resources provided to students to accelerate their learning process, meet learning standards
and succeed in school.20 In competency-based systems, students receive timely, differentiated support
based on their individual learning needs. Understanding how to structure supports is important because
learning in a competency-based environment means that students and adults are often on the edge of
their comfort zone and competence — the learning edge. In the paper, The Learning Edge: Supporting
Student Success in a Competency-Based Learning Environment,21 you will learn how innovators
are designing school culture, embedding supports and organizing resources to ensure students are
progressing and on pace.
Learner Agency/Student Agency Student agency or student ownership of their education refers to the skills and the level of autonomy that
a student has to shape their learning experiences. Schools that want to develop student agency will need
strategies to coach students in the lifelong learning skills (growth mindset, meta-cognition, social and
emotional learning, and habits of work and learning) and to establish practices that allow students to have
choice, voice, opportunity for co-design and the ability to shape their learning trajectories.
Learner Profile/Student ProfileLearner profiles document the ways a student best learns. Learner profiles typically include a broad range
of data: demographic data, data about student interests, learning preferences, descriptions of the learning
environment student prefer, inter- and intra-personal skills, existing competencies and those that need
to be developed (in the personal, social-emotional, academic and career arenas). Profiles may initially be
compiled as a student enrolls in a school, through diagnostic data, intake inventories, conferences with
students and family members, analysis of previous school records, and school/classroom observation.
Profiles are dynamic documents, that should change in both the short- and long-term: students’ interests
will change, they will become competent in new areas, etc. The profiles sets the stage by which students
can begin to set goals and make plans to achieve them. It also provides adults with insight into ways they

A National Landscape Scan of Personalized Learning in K-12 Education in the United States
31
might best support students in their efforts. In advanced competency-based models, learner profiles
follow a student throughout their educational experience documenting evidence of student growth and
mastery of competencies over time (adapted from reDesignu.org).22
Learning Resources The materials explored during a course, module, unit, or activity: videos, images, audio, texts,
presentations, etc.
Learning Experiences The term learning experiences is used to convey the process and activities that students engage in to
learn skills and knowledge. The term refers to the package of outcomes and targets, activities, resources,
assessments, and pedagogical strategies that are associated with a course, module, or unit. In the United
States, this is generally referred to as curriculum. (See definition of Curriculum.)
Learning Progression Learning progressions are research-based approaches that map how students learn key concepts
and skills, as described in Achieve’s briefing, The Role of Learning Progressions in Competency-Based
Pathways.23
Learning Sciences Research The learning sciences are concerned with “the interdisciplinary empirical investigation of learning as it
exists in real-world settings.”24 Core components of learning sciences research include:
• Research on thinking: including how the mind works to process, store, retrieve and perceive
information;
• Research on learning processes: including how people use “constellations of memories, skills,
perceptions, and ideas” to think and solve problems, and the role that different types of literacies
play in learning; and
• Research on learning environments: including how people learn in different contexts other than
a direct instruction environment with a core principle of creating learner-centered learning
environments.25
Lifelong Learning Skills In the paper Lifelong Learning Skills for College and Career Readiness: Considerations for Education
Policy, the American Institutes for Research (AIR) describes lifelong learning skills as providing “the
foundation for learning and working. They broadly support student thinking, self management, and social
interaction, enabling the pursuit of education and career goals.”26 iNACOL uses the term to capture the
skills that enable students to be successful in life, navigating new environments, and managing their own
learning. This includes a growth mindset, habits of success, social and emotional skills, metacognitive
skills and higher order/deeper learning competencies.
A National Landscape Scan of Personalized Learning in K-12 Education in the United States
32
NextGen
This refers to the Next Generation Learning Challenge (NGLC)27 and Next Generation Systems Initiative
(NGSI) grantee schools tasked with creating innovative and personalized educations students. NGLCs are
non-profit organizations that supported grant receiving schools in their geographic region while NGSIs
are school districts that worked with their own grant-receiving schools. Schools, districts and non-profits
applied for and received grants from the Bill & Melinda Gates Foundation over the course of several years
as schools planned and implemented personalized learning.
Personalized Approach to Learning or Personalized Learning iNACOL defines personalized learning as “tailoring learning for each student’s strengths, needs and
interests – including enabling student voice and choice in what, how, when and where they learn – to
provide flexibility and supports to ensure mastery of the highest standards possible.”28 Personalized
learning takes into account students’ differing zones of proximal development with regards to academic
and cognitive skills, as well as within the physical, emotional, metacognitive and other domains.
Personalized learning consultants Barbara Bray and Kathleen McClaskey explain in the Personalization vs.
Differentiation vs. Individualization ( PDI) Chart29 that personalized learning is learner-centered, whereas the
related approaches of differentiation and individualization are teacher-centered. Thus, teachers may use a
personalized and differentiated approach to meet students where they are.
Professional Learning Community (PLC)A professional learning community (PLC) is a group of educators who meet regularly, share expertise, and
work collaboratively to improve teaching skills and the academic performance of students. Professional
learning communities tend serve two broad purposes: (1) improving the skills and knowledge of
educators through collaborative study, expertise exchange and professional dialogue, and (2) improving
the educational aspirations, achievement, and attainment of students through stronger leadership and
teaching. Professional learning communities often function as a form of action research — i.e., as a way
to continually question, reevaluate, refine and improve teaching strategies and knowledge (adapted from
edglossary.org).
Social and Emotional Learning
According to CASEL, “Social and emotional learning (SEL) is the process through which children and
adults acquire and effectively apply the knowledge, attitudes and skills necessary to understand and
manage emotions, set and achieve positive goals, feel and show empathy for others, establish and
maintain positive relationships and make responsible decisions.”30 They focus on the development of five
competencies: self-awareness, self-management, social awareness, relationship skills and responsible
decision-making.
Student Learning Trajectories iNACOL refers to trajectories as the unique personalized path each student travels to achieve learning
goals on the way to graduation. Educators apply what is known about learning progressions toward helping
students make progress on their trajectory.
A National Landscape Scan of Personalized Learning in K-12 Education in the United States
33
AcknowledgmentsWe are grateful for our partners in this project, the Center on Reinventing Public Education (CRPE),
LEAP Innovations, and NORC at the University of Chicago, for their collaborative spirit, support and
unwavering efforts to transform education. Special thanks go to Bruce Friend, Natalie Abel, Kendra
Rickerby, Scott Benson and Chris Sturgis for their critical feedback and important contributions to this
report. We extend our thanks and deepest appreciation to the teachers and students across the country
who contributed their time and experiences with personalized learning as part of this project. You inspire
us and provided invaluable insights into the ways in which personalized learning is developing in schools
across the country.

A National Landscape Scan of Personalized Learning in K-12 Education in the United States
34
Endnotes1 Patrick, S., Kennedy, K., & Powell, A. (2013). Mean What You Say: Defining and integrating personalized, blended and competency education. Vienna, VA: iNACOL. Retrieved from https://www.inacol.org/resource/mean-what-you-say-defining-and-integrating-personalized-blended-and-competency-education/.2 These schools include the Breakthrough Schools Chicago program, a LEAP-led regional fund of the national Next Generation Learning Challenges.3 Patrick, S., Worthen, M., Frost, D., & Gentz, S. (2016). Meeting the Every Student Succeeds Act’s promise: State policy to support personalized learning. Vienna, VA: iNACOL. Retrieved from https://www.inacol.org/resource/meeting-the-every-student-succeeds-acts-promise-state-policy-to-support-personalized-learning/. 4 Ohio House Bill No. 64, 131st G.A. (2015). Retrieved from http://education.ohio.gov/getattachment/Topics/Other-Resources/Competency-Based-Education-Pilot/hb64_Competency-Based-Education.pdf.aspx. 5 Idaho House Bill 110, 63rd Legislature (2015). Retrieved from http://legislature.idaho.gov/sessioninfo/billbookmark/?yr=2015&bn=H0110.6 Utah Senate Bill 143, Competency-Based Learning Amendments (2016). Retrieved from https://le.utah.gov/~2016/bills/static/SB0143.html. 7 Florida House Bill 1365 (2016). Retrieved from https://www.flsenate.gov/Session/Bill/2016/1365/BillText/er/PDF.8 Illinois House Bill 5729, Postsecondary and Workforce Readiness Act (2016). Retrieved from http://www.ilga.gov/legislation/publicacts/99/PDF/099-0674.pdf. 9 Nevada AB 110 (2017). Retrieved from https://www.leg.state.nv.us/Session/79th2017/Reports/history.cfm?BillName=AB110. 10 LEAP Learning Framework for Personalized Learning (2017). LEAP Innovations. Retrieved from http://leaplearningframework.org/. Learner Focused, Learner Demonstrated, Learner Led and Learner Connected are trademarks of LEAP Innovations, used under license.11 Marsh, J. A., Pane, J. F., & Hamilton, L. S. (2006). Making sense of data-driven decision making in education: Evidence from recent RAND research. Santa Monica, CA: RAND Corporation. Retrieved from https://www.rand.org/pubs/occasional_papers/OP170.html. 12 The 200 to 300 range was chosen to ensure that these scores would not be interpreted as percentile ranks. 13 LEAP Personalized Learning Survey scores are created by weighting and combining the responses to multiple items under a specific construct (e.g., Learner Led) using Rasch Methodology. These scores can be compared over time and across groups but standards are a way to interpret them independently. The standard-setting process is one in which experts use their knowledge of teacher practice, student experiences and the survey items themselves to recommend cut-scores associated with different levels of personalization.14 On average schools that fell into the levels of “high” or “moderate (high)” on the Learner Demonstrated scale indicated the highest response category in 82 percent of that scale’s questions. Schools considered “high” or “moderate (high)” on the Learner Focused scale responded in the highest response category for 85 percent of the questions in the scale. Only an average 50 percent of the questions in the highest response category on questions in the Learner Led scale resulted in schools being considered “moderate (high).”15 Jones, S., & Kahn, J. (2017). The Evidence base for how we learn: Supporting students’ social, emotional, and academic development. Washington, DC: The Aspen Institute. Retrieved from https://www.aspeninstitute.org/publications/evidence-base-learn/.16 See Noguera, P., Darling-Hammond, L., & Friedlaender, D. (2015). Equal opportunity for deeper Learning. Boston: Jobs for the Future. Retrieved from http://www.jff.org/publications/equal-opportunity-deeper-learning. Mehta, J. (2014). Deeper learning has a race problem. Education Week. Retrieved from http://blogs.edweek.org/edweek/learning_deeply/2014/06/deeper_learning_has_a_race_problem.html.17 Refer to Glossary on page 32 for a description of these two initiatives. 18 What Is Competency Education? CompetencyWorks. Retrieved from https://www.competencyworks.org/about/competency-education/.19 Why Equity? National Equity Project. Retrieved from http://nationalequityproject.org/about/equity. 20 Academic Support. The Glossary of Education Reform. Retrieved from https://www.edglossary.org/academic-support/. 21 C., & Shubilla, L. (2013). The Learning edge: Supporting student success in a competency-based learning environment. CompetencyWorks. Retrieved from https://www.inacol.org/resource/competency-works-the-learning-edge-supporting-student-success-in-a-competency-based-learning-environment/. 22 See reDesign at http://www.redesignu.org/. 23 Achieve. (2015). The Role of learning progressions in competency-based pathways. Retrieved from https://www.achieve.org/learningprogressionsinCBP.24 International Society of the Learning Sciences. Retrieved from https://www.isls.org.25 Hoadley, C. & Van Haneghan, J. P. “The Learning Sciences: Where They Came From and What It Means for Instructional

A National Landscape Scan of Personalized Learning in K-12 Education in the United States
35
Designers.” In R. A. Reiser & J. V. Dempsey (Eds.), Trends and Issues in Instructional Design and Technology (3rd ed., pp. 53-63). New York: Pearson, 2011. 26 McGarrah, Michael W. (2015). Lifelong Learning Skills for College and Career Readiness: Considerations for Education Policy. College & Career Readiness & Success Center at American Institutes for Research. Retrieved from https://ccrscenter.org/sites/default/files/CCRS%20Lifelong%20Learning%20Skills%20Policy%20Considerations_0.pdf.27 See Next Generation Learning Challenges at https://www.nextgenlearning.org/.28 Patrick, S., Kennedy, K., & Powell, A. (2013). Mean what you say: Defining and integrating personalized, blended and competency education. iNACOL. Retrieved from https://www.inacol.org/resource/mean-what-you-say-defining-and-integrating-personalized-blended-and-competency-education/. 29 Bray, B., McClaskey. (2014). Updated personalization vs. differentiation vs. individualization chart version 3. Personalize Learning. Retrieved from http://www.personalizelearning.com/2013/03/new-personalization-vs-differentiation.html.30 What is SEL? (2017). Collaborative for Academic, Social, and Emotional Learning. Retrieved from http://www.casel.org/what-is-sel/.

www.inacol.org
1934 Old Gallows Road, Suite 350Vienna, VA 22182
888.95.NACOL (888.956.2265) ph. 703.752.6216 / fx. [email protected]