Embed Size (px)
Citation preview
IEEE TRANSACTIONS ON INSTRUMENTATION AND MEASUREMENT, VOL. 59, NO. 6, JUNE 2010 1507
A Multisensor Intelligent Device for Real-TimeMultiphase Flow Metering in Oil Fields
Mahmoud Meribout, Member, IEEE, Nabeel Z. Al-Rawahi, Member, IEEE, Ahmed M. Al-Naamany,Ali Al-Bimani, Khamis Al-Busaidi, and Adel Meribout
Abstract—In this paper, a new multiphase flow metering devicefor real-time measurement of oil, gas, and water flow rates ispresented. It is composed of several electrical and acoustic sensorswhose signals are digitalized and processed by a multilayer neuralnetwork. This latest uses the physical models of multiphase fluidsto reduce the complexity of the parameter space while improvingits accuracy. Furthermore, to overcome the uncertainties of theelectrical sensors in the range of 40%–60% and above 90% wa-ter-cut (i.e., ranges where most of the multiphase flow meter fail),two rings of high- and low-frequency ultrasonic sensors are usedfor low and high gas fractions, respectively. The results of exper-iments that have been conducted in an in-house laboratory-scalemultiphase flow loop show that real-time classification for up to90% gas fraction can be achieved with less than 10% relative error.
Index Terms—Artificial intelligence, capacitance and conduc-tance probes, embedded systems design, gas flow rate measure-ment, multiphase flow metering, neural network, ultrasonic waves,water-cut measurement.
I. INTRODUCTION
R EAL-TIME measurement of the volumetric flow rate ofprocess fluids (e.g., flow rate of the mixture, individ-
ual phase flow rates, and fractional phase volumes) prior toseparation is widely acknowledged to be a critical parameterin process control within the petrochemical industries since itallows a more effective reservoir management. For example, inoffshore production consisting of several nearby wells (Fig. 1),flow data gathered along a pipeline section of a given well canhelp in identifying how this well contributes to the aggregateflow and, hence, may help in locating a production anomaly,such as a water or gas breakthrough in the actual well. Thisallows an easier localization of well stimulation or other well
Manuscript received March 13, 2009; revised April 30, 2009. First publishedSeptember 25, 2009; current version published May 12, 2010. The AssociateEditor coordinating the review process for this paper was Dr. Dario Petri.
M. Meribout was with the Department of Electrical and Computer Engi-neering, Sultan Qaboos University, Muscat 123, Oman. He is now with theDepartment of Electrical Engineering, Petroleum Institute, Abu Dhabi, UnitedArab Emirates (e-mail: [email protected]).
N. Z. Al-Rawahi is with the Department of Mechanical and IndustrialEngineering, Sultan Qaboos University, Muscat 123, Oman.
A. M. Al-Naamany is with the Department of Electrical and ComputerEngineering, Sultan Qaboos University, Muscat 123, Oman.
A. Al-Bimani is with the Department of Petroleum and Chemical Engineer-ing, Sultan Qaboos University, Muscat 123, Oman.
K. Al-Busaidi is with Petroleum Development Oman, Muscat 113, Oman.A. Meribout was with the Department of Electrical and Computer Engi-
neering, Sultan Qaboos University, Muscat 123, Oman. He is now with theDepartment of Instrumentation and Control, Sonatrach Corporation, Algiers2533, Algeria.
Color versions of one or more of the figures in this paper are available onlineat http://ieeexplore.ieee.org.
Digital Object Identifier 10.1109/TIM.2009.2028210
treatments, such as enhanced oil recovery, to be performed toincrease the well productivity. In another application, a down-hole monitoring of the multiphase flow allows well engineersto control more effectively the propagation of the oil from theactual well by adequately controlling the array of valves in thatwell (e.g., switching off the valve surrounded by high water-cut fluid). A suitable instrument for such applications should becapable of measuring the flow rates of each phase composingthe mixed fluid, which is usually oil, water, and gas. However,such instrument, called a multiphase flow meter (MPFM), iscomplex to design since it has to determine four unknownparameters (i.e., oil fraction, water fraction, gas fraction, andtotal flow rate), in addition to the fact that most of the availablesensing techniques cannot simultaneously deal with all the threephases. Thus, use of several complementary sensors is required.Dealing with three unknown parameters (i.e., oil fraction, waterfraction, and total flow rate) has been successfully achievedwith less than 5% error within the whole water-cut range[1]. These meters, however, are applicable only after completeliquid–gas separation using bulky and costly separation tanks.Consequently, they are impractical for applications such asmonitoring flows of individual wells or remote onshore oilfields. Thus, there is an increasing need for portable, cheap,and safe MPFMs to be widely deployed in oil fields worldwide.Following extensive research that has been done, most ofthe existing multiphase flow metering instruments belong tothe following two main technologies: 1) gamma-ray devicesand 2) dielectric-based devices. However, these devices areeither not safe (because of the use of radioactive sources) orinaccurate in the case of the 40%–60% water-cut (i.e., thepercentage of water in the mixed fluid) or above the 90% water-cut. This paper presents a new nonradioactive ultrasonic-basedintelligent multisensor (IMS) multiphase flow metering devicefor the determination of the volume flow rates of multiphasemixture components along a portion of a pipeline with differentflow regimes and without prior separation of gas. In additionto homogenizing the flow, some properties of fluid mechanicsare introduced into the pattern recognition algorithm and haveled to the decomposition of the complicated nonlinear multi-dimensional spaces into simpler 2-D nonlinear spaces that areeasily manageable with a dedicated multilayer neural networkalgorithm. The system, which is compact and easily portable,has been implemented and extensively tested on a laboratory-scale multiphase flow loop with various flow regimes, fluiddensities, and flow rates. Experimental results indicate that anerror rate of ±10% can be achieved for real-time classificationof up to 90% gas fraction.
0018-9456/$26.00 © 2009 IEEE
1508 IEEE TRANSACTIONS ON INSTRUMENTATION AND MEASUREMENT, VOL. 59, NO. 6, JUNE 2010
Fig. 1. Example of application of the MPFM in oil fields.
II. PREVIOUS RELATED WORKS
Multiphase flow is a complex phenomenon that is difficultto understand, predict, and model. Common single-phase char-acteristics, such as velocity profile, turbulence, and boundarylayer, are thus inappropriate for describing the nature of suchflows. Thus, most of the existing MPFMs [2]–[8] rely on theelectrical (e.g., dielectric properties) and/or other nonelectricalproperties (e.g., waves or energy propagation) of the individualphases that compose the mixed fluid to proceed with a propercalibration using either pattern recognition or lookup tabletechniques, but rarely with analytical equations.
MPFMs using gamma- or X-rays have been successfullytested in several oil fields [11], [14]–[17]. Their principle is toemit one or several waves to determine the fractions of eachindividual flow composing the mixed fluid. Thus, by knowingthe total flow rate of this fluid using the venturi meter, theindividual flow rates of oil, water, and gas can be determined.However, these meters are radioactive and, thus, are not safe tobe deployed in hazardous oil fields. In addition, their accuracygreatly decreases with the presence of gas (e.g., more than 20%error for more than 90% gas). The reason is that the onlinegas–liquid separator embedded in these meters may not entirelyseparate the gas phase from the liquid phase, inducing substan-tial errors to the water-cut meter, which is connected to the liq-uid outlet of the separator. To remedy the errors introduced bythe online separator, other MPFMs do not use any separator butinstead mix the flow using mechanical mixers in such a way thatthe slip velocity between all the three phases of the fluid becomenegligible, making the individual velocities approximatelyequal [9], [10]. However, this concept might be valid only if allcomponents of the fluid are in the liquid phase since the liquidflow rate is usually substantially different from the gas flow ratein normal multiphase transportation because of density differ-ence [4]. MPFMs using this approach [11] have achieved morethan 20% error in the experiments since the used equationsignored any interaction between the gas and the liquid phases.
Other nonradioactive commercially available meters, whichrely on the electrical properties of the mixed fluid, use thecapacitance and conductance readings to determine oil, gas, andwater fractions [18], [19]. In addition, they use pressure sensors,a temperature sensor, and cross correlation for liquid flow rate
measurement. These MPFMs have the advantage of being safe.However, their accuracy is weak in the water-cut range of40%–60%. The reason is that within this range, the mixed fluidis neither totally conductive nor an isolator, thus leading toalmost the same sensor outputs within this range. In addition,these meters are inaccurate for the water-cut range greater than90%. Another solution proposed in [12] uses a water-cut meterand a volumetric flow-meter for measuring the gas and liquidphases. This invention is complicated because it requires apositive displacement instrument so it can avoid the problem ofslip between the gas and liquid phases. In addition, this systemdoes not appear to be effective for liquid fractions below about10%. Another field-programmable-gate-array-based device ad-dressed in [5] has been presented to compute the total massflow rate of the fluid passing through it. The device has nomoving mechanical parts to wear out; therefore, its theoreticallifespan is almost infinite. However, the device cannot deliverthe flow rates of each individual phase constituting the fluid andbecomes inaccurate with the presence of the gas phase. Otherembedded and processor-based devices for the measurementof the quantity of the fuel in the engine have been proposedin [6] and [7], and their accuracy is claimed to be high andindependent of the fluid properties (e.g., viscosity, temperature,and density). However, these devices are only dedicated for onesingle phase and do not seem to be applicable for the gas phase.Thus, it is clear that, still, a substantial amount of developmentefforts is required, particularly in improving the accuracy levelsover the full range of flow multiphase flow conditions.
III. PROBLEM DEFINITION AND EXPERIMENTAL SETUP
As previously mentioned, multiphase flow metering remainsa challenging task for several research groups and companies(e.g., in addition to oil companies, food processing, watertreatment, and petrochemical companies need such device aswell) since it requires to find out four unknown parameters. Anideal meter would make independent direct measurements ofeach of these parameters, which is not possible. One alternativeis to use the data fusion of several sensors to compute thefractions α, β, and γ of gas, oil, and water, respectively. Then,knowing the total volume flow rate T (in liters per minute) using
MERIBOUT et al.: MULTISENSOR DEVICE FOR REAL-TIME MULTIPHASE FLOW METERING IN OIL FIELDS 1509
additional sensors, the individual flow rates FG, FO, and FW
of gas, oil, and water, respectively, can be computed using thefollowing equations:
FG (in liters per minute) =T × α
FO (in liters per minute) =T × β
FW (in liters per minute) =T × γ. (1)
Another alternative, in case the total volume flow rate may notbe possible to measure (e.g., in case one of the three phases iscompressible and, thus, does not exhibit a constant volume flowrate, which is the case of the gas phase), consists of measuringthe total mass flow rate M (since this parameter is alwaysconstant) to provide flow rates according to the followingequations:
FG (in liters per minute)
=M (in kilograms per minute) × α
ρG
FO (in liters per minute)
=M (in kilograms per minute) × β
ρO
FW (in liters per minute)
=M (in kilograms per minute) × γ
ρW(2)
where ρG, ρW, and ρO are the densities of gas, water, and oil,respectively, to be provided to the MPFM during its calibration.Thus, as mentioned previously, and to simplify the aboveequations, some meters integrate an online gas–liquid separa-tor to separately calculate the parameters α and (β, γ). Theother approach, which consists of mixing the flow to providesimilar individual flow rates, requires only the knowledge ofthe total volume flow rate T to solve the individual flow rates:FG (in liters per minute) = FO (in liters per minute) = FW
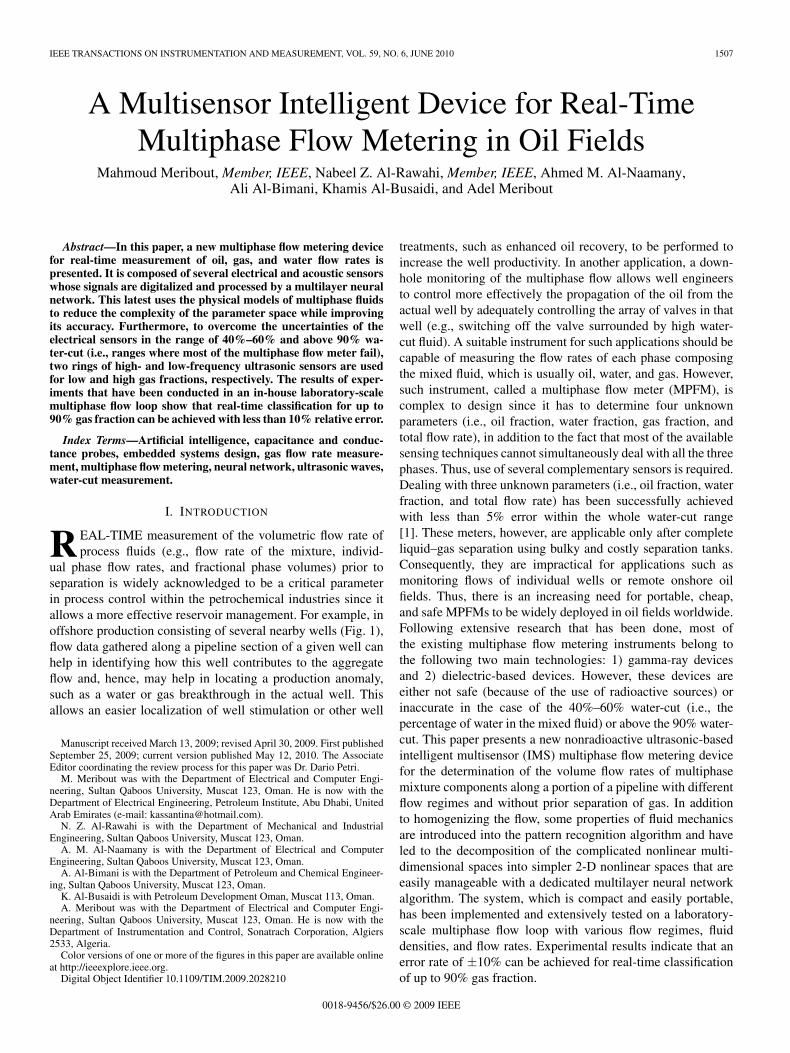
(in liters per minute) = T/3. However, both methods arehardly applicable in practice for the reasons already mentionedin Section I. The IMS-MPFM proposed in this paper consistsof solving the parameters α, β, and γ using four types ofsensors (i.e., capacitance, conductance, liquid ultrasonic, andair ultrasonic sensors), in addition to using the physical modelof the multiphase flow. The parameter M is solved usingventuri and differential pressure sensors. More details on thismeter are presented in Section V. The calibration and designof the algorithmic part of the meter required the design anddevelopment of a multiphase phase flow loop (Fig. 2), withinwhich extensive experiments have been done. In this flow loop,water and oil are carried out from two separate tanks of 2 m3
each under various regimes and flow rates, whereas the gasphase is provided by a gas compressor. These flows are thenmixed to cross the multiphase flow metering device under test.Before the mixing point of the loop, three single-phase flowmeters, namely, water, oil, and gas flow meters, are insertedafter the water tank, oil tank, and air compressor, respectively.These single-phase flow meters constitute the references for
Fig. 2. Block diagram of the three-phase flow loop.
the pattern recognition algorithm to provide the following fourreference parameters:
αa =FGa
FGa + FWa + FOa
βa =FOa
FGa + FWa + FOa
γa =FWa
FGa + FWa + FOa
Ma (in kilograms per minute)
= ρW × FWa + ρ0 × FOa + ρG × FGa (3)
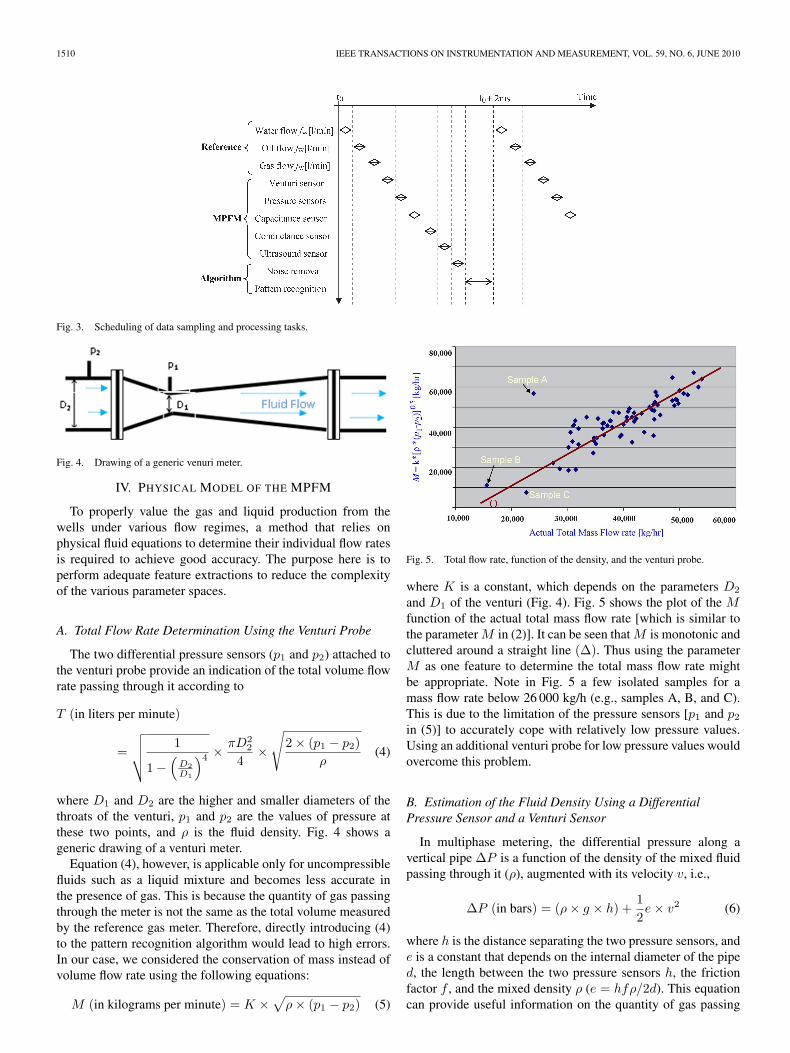
where FWa, FOa, and FGa are the actual values of the water, oil,and gas volume flow rates (in liters per minute), respectively,as indicated by the single-phase flow meters. The parametersαa, βa, and γa are the actual fractions of the gas, water, andoil, respectively, and Ma is the actual total mass flow rate.The goal here is to design an appropriate pattern recognitionalgorithm to generate in real time and with good accuracythe flow rates of each phase FW, FO, and FG as close aspossible to the actual fractions (i.e., FWa, FOa, and FGa,respectively). Hence, during the calibration phase, the operatorproceeds by adjusting the valves of the tanks and compressorto provide various combinations of the flow rates in (3). Foreach of these combinations, a host computer periodically grabsthe values of FWa, FOa, and FGa to compute the parametersαa, βa, and γa while simultaneously collecting data from allthe sensors of the IMS-MPFM. An offline calibration of thismeter is then performed to add new reference vectors into theparameter spaces. These latest are then explored by an adequatepattern recognition algorithm. Fig. 3 shows the scheduling ofdata sampling and processing tasks. The pattern recognitionprogram is regularly triggered by a timer interrupt to performdata acquisition of either one of the single-phase flow metersor one of the sensors of the IMS-MPFM. This is followed bya noise removal and pattern recognition algorithm. The wholeprocess corresponding to one sample takes 2 ms, which leadsto 500 samples/s, providing to our IMS-MPFM the feature tohandle total volume flow rates of up to 46 m3/h since thediameter of the pipes in the flow loop is 2 in.
1510 IEEE TRANSACTIONS ON INSTRUMENTATION AND MEASUREMENT, VOL. 59, NO. 6, JUNE 2010
Fig. 3. Scheduling of data sampling and processing tasks.
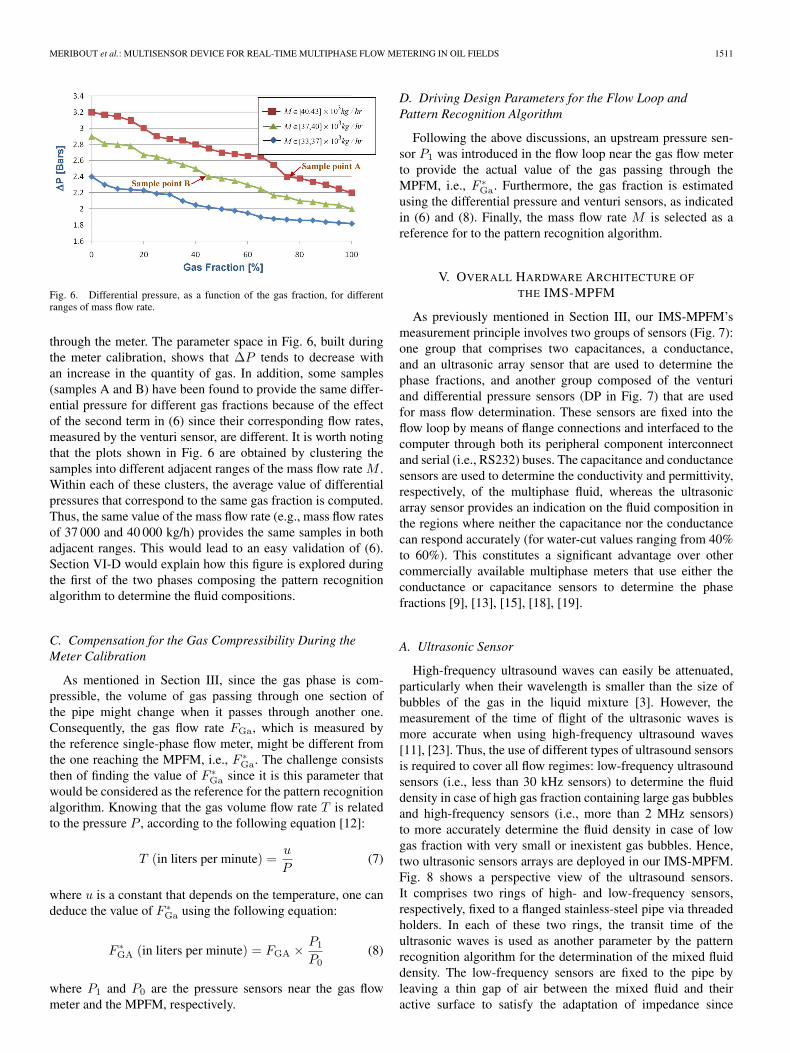
Fig. 4. Drawing of a generic venuri meter.
IV. PHYSICAL MODEL OF THE MPFM
To properly value the gas and liquid production from thewells under various flow regimes, a method that relies onphysical fluid equations to determine their individual flow ratesis required to achieve good accuracy. The purpose here is toperform adequate feature extractions to reduce the complexityof the various parameter spaces.
A. Total Flow Rate Determination Using the Venturi Probe
The two differential pressure sensors (p1 and p2) attached tothe venturi probe provide an indication of the total volume flowrate passing through it according to
T (in liters per minute)
=
√√√√ 1
1 −(
D2D1
)4 × πD22
4×
√2 × (p1 − p2)
ρ(4)
where D1 and D2 are the higher and smaller diameters of thethroats of the venturi, p1 and p2 are the values of pressure atthese two points, and ρ is the fluid density. Fig. 4 shows ageneric drawing of a venturi meter.
Equation (4), however, is applicable only for uncompressiblefluids such as a liquid mixture and becomes less accurate inthe presence of gas. This is because the quantity of gas passingthrough the meter is not the same as the total volume measuredby the reference gas meter. Therefore, directly introducing (4)to the pattern recognition algorithm would lead to high errors.In our case, we considered the conservation of mass instead ofvolume flow rate using the following equations:
M (in kilograms per minute) = K ×√
ρ × (p1 − p2) (5)
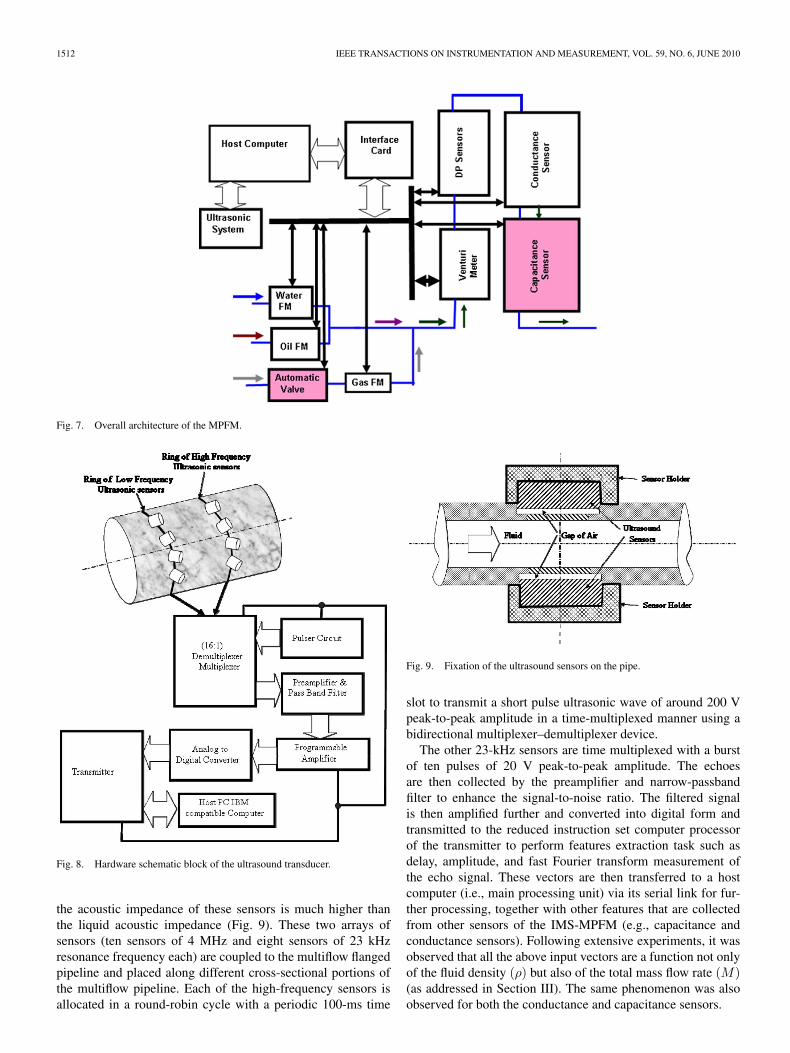
Fig. 5. Total flow rate, function of the density, and the venturi probe.
where K is a constant, which depends on the parameters D2
and D1 of the venturi (Fig. 4). Fig. 5 shows the plot of the Mfunction of the actual total mass flow rate [which is similar tothe parameter M in (2)]. It can be seen that M is monotonic andcluttered around a straight line (Δ). Thus using the parameterM as one feature to determine the total mass flow rate mightbe appropriate. Note in Fig. 5 a few isolated samples for amass flow rate below 26 000 kg/h (e.g., samples A, B, and C).This is due to the limitation of the pressure sensors [p1 and p2
in (5)] to accurately cope with relatively low pressure values.Using an additional venturi probe for low pressure values wouldovercome this problem.
B. Estimation of the Fluid Density Using a DifferentialPressure Sensor and a Venturi Sensor
In multiphase metering, the differential pressure along avertical pipe ΔP is a function of the density of the mixed fluidpassing through it (ρ), augmented with its velocity v, i.e.,
ΔP (in bars) = (ρ × g × h) +12e × v2 (6)
where h is the distance separating the two pressure sensors, ande is a constant that depends on the internal diameter of the piped, the length between the two pressure sensors h, the frictionfactor f , and the mixed density ρ (e = hfρ/2d). This equationcan provide useful information on the quantity of gas passing
MERIBOUT et al.: MULTISENSOR DEVICE FOR REAL-TIME MULTIPHASE FLOW METERING IN OIL FIELDS 1511
Fig. 6. Differential pressure, as a function of the gas fraction, for differentranges of mass flow rate.
through the meter. The parameter space in Fig. 6, built duringthe meter calibration, shows that ΔP tends to decrease withan increase in the quantity of gas. In addition, some samples(samples A and B) have been found to provide the same differ-ential pressure for different gas fractions because of the effectof the second term in (6) since their corresponding flow rates,measured by the venturi sensor, are different. It is worth notingthat the plots shown in Fig. 6 are obtained by clustering thesamples into different adjacent ranges of the mass flow rate M .Within each of these clusters, the average value of differentialpressures that correspond to the same gas fraction is computed.Thus, the same value of the mass flow rate (e.g., mass flow ratesof 37 000 and 40 000 kg/h) provides the same samples in bothadjacent ranges. This would lead to an easy validation of (6).Section VI-D would explain how this figure is explored duringthe first of the two phases composing the pattern recognitionalgorithm to determine the fluid compositions.
C. Compensation for the Gas Compressibility During theMeter Calibration
As mentioned in Section III, since the gas phase is com-pressible, the volume of gas passing through one section ofthe pipe might change when it passes through another one.Consequently, the gas flow rate FGa, which is measured bythe reference single-phase flow meter, might be different fromthe one reaching the MPFM, i.e., F ∗
Ga. The challenge consiststhen of finding the value of F ∗
Ga since it is this parameter thatwould be considered as the reference for the pattern recognitionalgorithm. Knowing that the gas volume flow rate T is relatedto the pressure P , according to the following equation [12]:
T (in liters per minute) =u
P(7)
where u is a constant that depends on the temperature, one candeduce the value of F ∗
Ga using the following equation:
F ∗GA (in liters per minute) = FGA × P1
P0(8)
where P1 and P0 are the pressure sensors near the gas flowmeter and the MPFM, respectively.
D. Driving Design Parameters for the Flow Loop andPattern Recognition Algorithm
Following the above discussions, an upstream pressure sen-sor P1 was introduced in the flow loop near the gas flow meterto provide the actual value of the gas passing through theMPFM, i.e., F ∗
Ga. Furthermore, the gas fraction is estimatedusing the differential pressure and venturi sensors, as indicatedin (6) and (8). Finally, the mass flow rate M is selected as areference for to the pattern recognition algorithm.
V. OVERALL HARDWARE ARCHITECTURE OF
THE IMS-MPFM
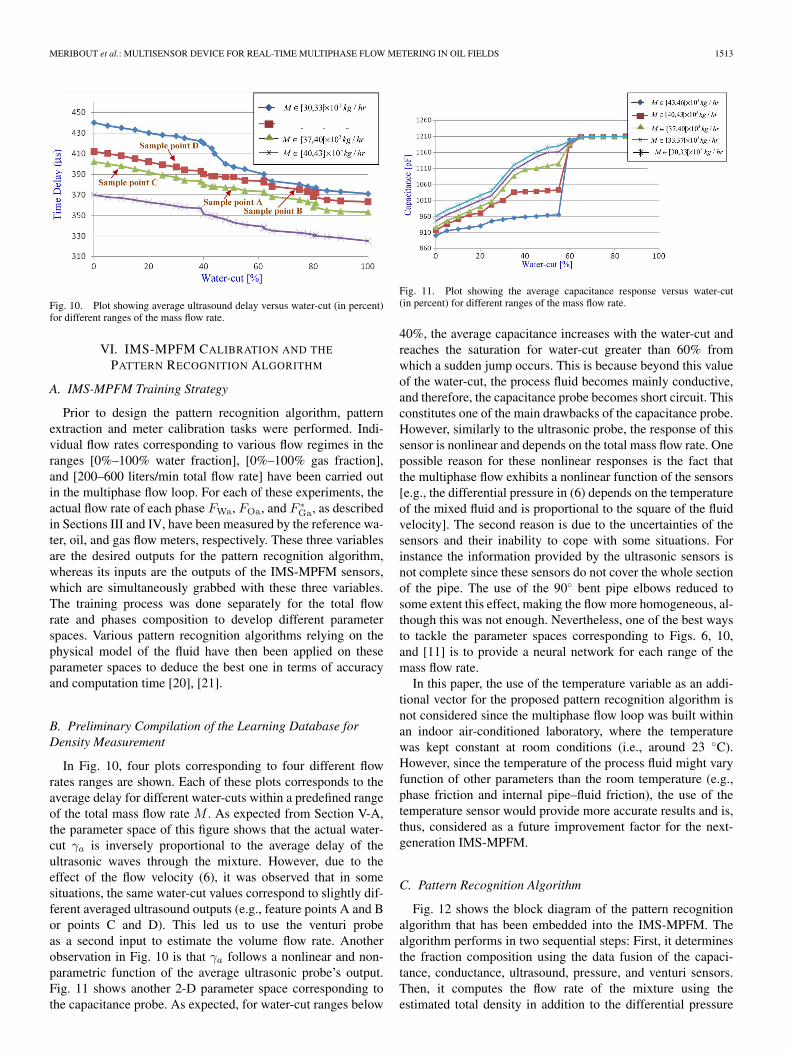
As previously mentioned in Section III, our IMS-MPFM’smeasurement principle involves two groups of sensors (Fig. 7):one group that comprises two capacitances, a conductance,and an ultrasonic array sensor that are used to determine thephase fractions, and another group composed of the venturiand differential pressure sensors (DP in Fig. 7) that are usedfor mass flow determination. These sensors are fixed into theflow loop by means of flange connections and interfaced to thecomputer through both its peripheral component interconnectand serial (i.e., RS232) buses. The capacitance and conductancesensors are used to determine the conductivity and permittivity,respectively, of the multiphase fluid, whereas the ultrasonicarray sensor provides an indication on the fluid composition inthe regions where neither the capacitance nor the conductancecan respond accurately (for water-cut values ranging from 40%to 60%). This constitutes a significant advantage over othercommercially available multiphase meters that use either theconductance or capacitance sensors to determine the phasefractions [9], [13], [15], [18], [19].
A. Ultrasonic Sensor
High-frequency ultrasound waves can easily be attenuated,particularly when their wavelength is smaller than the size ofbubbles of the gas in the liquid mixture [3]. However, themeasurement of the time of flight of the ultrasonic waves ismore accurate when using high-frequency ultrasound waves[11], [23]. Thus, the use of different types of ultrasound sensorsis required to cover all flow regimes: low-frequency ultrasoundsensors (i.e., less than 30 kHz sensors) to determine the fluiddensity in case of high gas fraction containing large gas bubblesand high-frequency sensors (i.e., more than 2 MHz sensors)to more accurately determine the fluid density in case of lowgas fraction with very small or inexistent gas bubbles. Hence,two ultrasonic sensors arrays are deployed in our IMS-MPFM.Fig. 8 shows a perspective view of the ultrasound sensors.It comprises two rings of high- and low-frequency sensors,respectively, fixed to a flanged stainless-steel pipe via threadedholders. In each of these two rings, the transit time of theultrasonic waves is used as another parameter by the patternrecognition algorithm for the determination of the mixed fluiddensity. The low-frequency sensors are fixed to the pipe byleaving a thin gap of air between the mixed fluid and theiractive surface to satisfy the adaptation of impedance since
1512 IEEE TRANSACTIONS ON INSTRUMENTATION AND MEASUREMENT, VOL. 59, NO. 6, JUNE 2010
Fig. 7. Overall architecture of the MPFM.
Fig. 8. Hardware schematic block of the ultrasound transducer.
the acoustic impedance of these sensors is much higher thanthe liquid acoustic impedance (Fig. 9). These two arrays ofsensors (ten sensors of 4 MHz and eight sensors of 23 kHzresonance frequency each) are coupled to the multiflow flangedpipeline and placed along different cross-sectional portions ofthe multiflow pipeline. Each of the high-frequency sensors isallocated in a round-robin cycle with a periodic 100-ms time
Fig. 9. Fixation of the ultrasound sensors on the pipe.
slot to transmit a short pulse ultrasonic wave of around 200 Vpeak-to-peak amplitude in a time-multiplexed manner using abidirectional multiplexer–demultiplexer device.
The other 23-kHz sensors are time multiplexed with a burstof ten pulses of 20 V peak-to-peak amplitude. The echoesare then collected by the preamplifier and narrow-passbandfilter to enhance the signal-to-noise ratio. The filtered signalis then amplified further and converted into digital form andtransmitted to the reduced instruction set computer processorof the transmitter to perform features extraction task such asdelay, amplitude, and fast Fourier transform measurement ofthe echo signal. These vectors are then transferred to a hostcomputer (i.e., main processing unit) via its serial link for fur-ther processing, together with other features that are collectedfrom other sensors of the IMS-MPFM (e.g., capacitance andconductance sensors). Following extensive experiments, it wasobserved that all the above input vectors are a function not onlyof the fluid density (ρ) but also of the total mass flow rate (M)(as addressed in Section III). The same phenomenon was alsoobserved for both the conductance and capacitance sensors.
MERIBOUT et al.: MULTISENSOR DEVICE FOR REAL-TIME MULTIPHASE FLOW METERING IN OIL FIELDS 1513
Fig. 10. Plot showing average ultrasound delay versus water-cut (in percent)for different ranges of the mass flow rate.
VI. IMS-MPFM CALIBRATION AND THE
PATTERN RECOGNITION ALGORITHM
A. IMS-MPFM Training Strategy
Prior to design the pattern recognition algorithm, patternextraction and meter calibration tasks were performed. Indi-vidual flow rates corresponding to various flow regimes in theranges [0%–100% water fraction], [0%–100% gas fraction],and [200–600 liters/min total flow rate] have been carried outin the multiphase flow loop. For each of these experiments, theactual flow rate of each phase FWa, FOa, and F ∗
Ga, as describedin Sections III and IV, have been measured by the reference wa-ter, oil, and gas flow meters, respectively. These three variablesare the desired outputs for the pattern recognition algorithm,whereas its inputs are the outputs of the IMS-MPFM sensors,which are simultaneously grabbed with these three variables.The training process was done separately for the total flowrate and phases composition to develop different parameterspaces. Various pattern recognition algorithms relying on thephysical model of the fluid have then been applied on theseparameter spaces to deduce the best one in terms of accuracyand computation time [20], [21].
B. Preliminary Compilation of the Learning Database forDensity Measurement
In Fig. 10, four plots corresponding to four different flowrates ranges are shown. Each of these plots corresponds to theaverage delay for different water-cuts within a predefined rangeof the total mass flow rate M . As expected from Section V-A,the parameter space of this figure shows that the actual water-cut γa is inversely proportional to the average delay of theultrasonic waves through the mixture. However, due to theeffect of the flow velocity (6), it was observed that in somesituations, the same water-cut values correspond to slightly dif-ferent averaged ultrasound outputs (e.g., feature points A and Bor points C and D). This led us to use the venturi probeas a second input to estimate the volume flow rate. Anotherobservation in Fig. 10 is that γa follows a nonlinear and non-parametric function of the average ultrasonic probe’s output.Fig. 11 shows another 2-D parameter space corresponding tothe capacitance probe. As expected, for water-cut ranges below
Fig. 11. Plot showing the average capacitance response versus water-cut(in percent) for different ranges of the mass flow rate.
40%, the average capacitance increases with the water-cut andreaches the saturation for water-cut greater than 60% fromwhich a sudden jump occurs. This is because beyond this valueof the water-cut, the process fluid becomes mainly conductive,and therefore, the capacitance probe becomes short circuit. Thisconstitutes one of the main drawbacks of the capacitance probe.However, similarly to the ultrasonic probe, the response of thissensor is nonlinear and depends on the total mass flow rate. Onepossible reason for these nonlinear responses is the fact thatthe multiphase flow exhibits a nonlinear function of the sensors[e.g., the differential pressure in (6) depends on the temperatureof the mixed fluid and is proportional to the square of the fluidvelocity]. The second reason is due to the uncertainties of thesensors and their inability to cope with some situations. Forinstance the information provided by the ultrasonic sensors isnot complete since these sensors do not cover the whole sectionof the pipe. The use of the 90◦ bent pipe elbows reduced tosome extent this effect, making the flow more homogeneous, al-though this was not enough. Nevertheless, one of the best waysto tackle the parameter spaces corresponding to Figs. 6, 10,and [11] is to provide a neural network for each range of themass flow rate.
In this paper, the use of the temperature variable as an addi-tional vector for the proposed pattern recognition algorithm isnot considered since the multiphase flow loop was built withinan indoor air-conditioned laboratory, where the temperaturewas kept constant at room conditions (i.e., around 23 ◦C).However, since the temperature of the process fluid might varyfunction of other parameters than the room temperature (e.g.,phase friction and internal pipe–fluid friction), the use of thetemperature sensor would provide more accurate results and is,thus, considered as a future improvement factor for the next-generation IMS-MPFM.
C. Pattern Recognition Algorithm
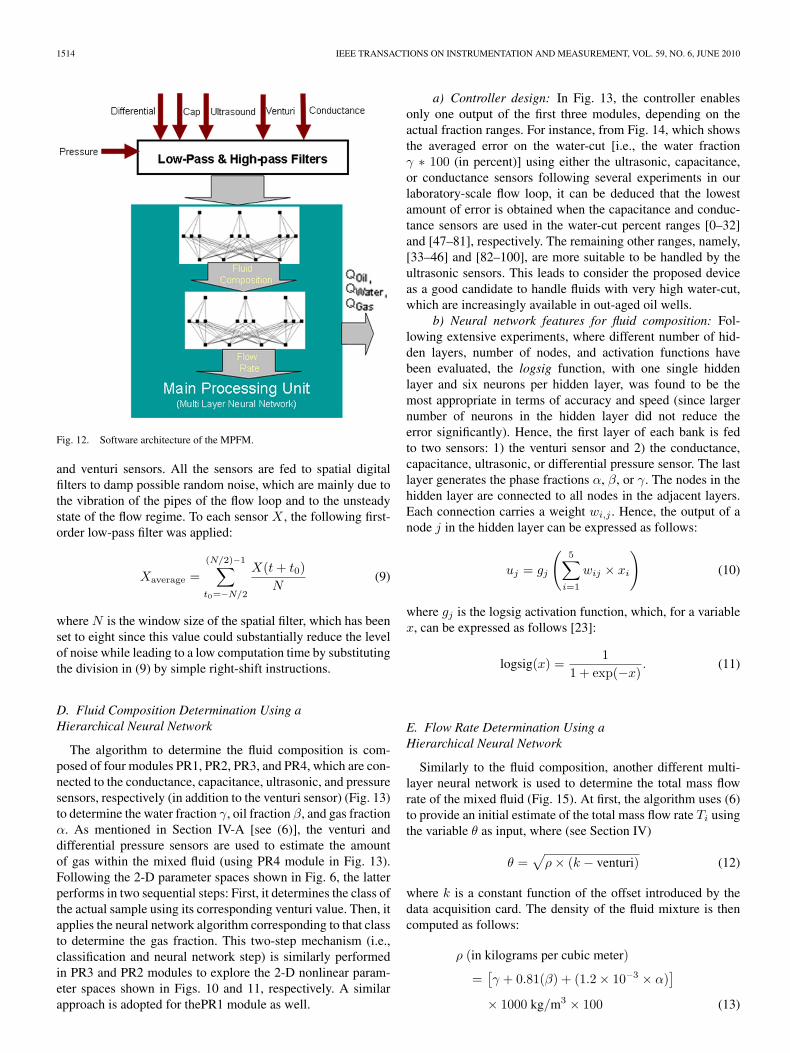
Fig. 12 shows the block diagram of the pattern recognitionalgorithm that has been embedded into the IMS-MPFM. Thealgorithm performs in two sequential steps: First, it determinesthe fraction composition using the data fusion of the capaci-tance, conductance, ultrasound, pressure, and venturi sensors.Then, it computes the flow rate of the mixture using theestimated total density in addition to the differential pressure
1514 IEEE TRANSACTIONS ON INSTRUMENTATION AND MEASUREMENT, VOL. 59, NO. 6, JUNE 2010
Fig. 12. Software architecture of the MPFM.
and venturi sensors. All the sensors are fed to spatial digitalfilters to damp possible random noise, which are mainly due tothe vibration of the pipes of the flow loop and to the unsteadystate of the flow regime. To each sensor X , the following first-order low-pass filter was applied:
Xaverage =(N/2)−1∑t0=−N/2
X(t + t0)N
(9)
where N is the window size of the spatial filter, which has beenset to eight since this value could substantially reduce the levelof noise while leading to a low computation time by substitutingthe division in (9) by simple right-shift instructions.
D. Fluid Composition Determination Using aHierarchical Neural Network
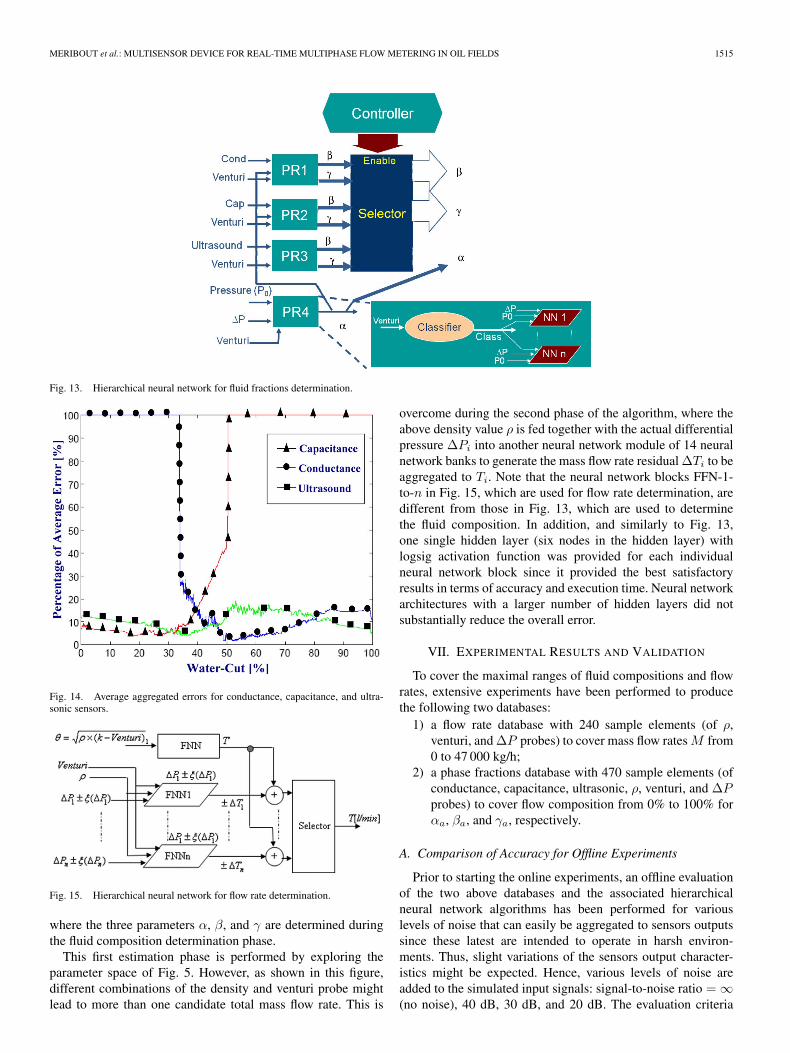
The algorithm to determine the fluid composition is com-posed of four modules PR1, PR2, PR3, and PR4, which are con-nected to the conductance, capacitance, ultrasonic, and pressuresensors, respectively (in addition to the venturi sensor) (Fig. 13)to determine the water fraction γ, oil fraction β, and gas fractionα. As mentioned in Section IV-A [see (6)], the venturi anddifferential pressure sensors are used to estimate the amountof gas within the mixed fluid (using PR4 module in Fig. 13).Following the 2-D parameter spaces shown in Fig. 6, the latterperforms in two sequential steps: First, it determines the class ofthe actual sample using its corresponding venturi value. Then, itapplies the neural network algorithm corresponding to that classto determine the gas fraction. This two-step mechanism (i.e.,classification and neural network step) is similarly performedin PR3 and PR2 modules to explore the 2-D nonlinear param-eter spaces shown in Figs. 10 and 11, respectively. A similarapproach is adopted for thePR1 module as well.
a) Controller design: In Fig. 13, the controller enablesonly one output of the first three modules, depending on theactual fraction ranges. For instance, from Fig. 14, which showsthe averaged error on the water-cut [i.e., the water fractionγ ∗ 100 (in percent)] using either the ultrasonic, capacitance,or conductance sensors following several experiments in ourlaboratory-scale flow loop, it can be deduced that the lowestamount of error is obtained when the capacitance and conduc-tance sensors are used in the water-cut percent ranges [0–32]and [47–81], respectively. The remaining other ranges, namely,[33–46] and [82–100], are more suitable to be handled by theultrasonic sensors. This leads to consider the proposed deviceas a good candidate to handle fluids with very high water-cut,which are increasingly available in out-aged oil wells.
b) Neural network features for fluid composition: Fol-lowing extensive experiments, where different number of hid-den layers, number of nodes, and activation functions havebeen evaluated, the logsig function, with one single hiddenlayer and six neurons per hidden layer, was found to be themost appropriate in terms of accuracy and speed (since largernumber of neurons in the hidden layer did not reduce theerror significantly). Hence, the first layer of each bank is fedto two sensors: 1) the venturi sensor and 2) the conductance,capacitance, ultrasonic, or differential pressure sensor. The lastlayer generates the phase fractions α, β, or γ. The nodes in thehidden layer are connected to all nodes in the adjacent layers.Each connection carries a weight wi,j . Hence, the output of anode j in the hidden layer can be expressed as follows:
uj = gj
(5∑
i=1
wij × xi
)(10)
where gj is the logsig activation function, which, for a variablex, can be expressed as follows [23]:
logsig(x) =1
1 + exp(−x). (11)
E. Flow Rate Determination Using aHierarchical Neural Network
Similarly to the fluid composition, another different multi-layer neural network is used to determine the total mass flowrate of the mixed fluid (Fig. 15). At first, the algorithm uses (6)to provide an initial estimate of the total mass flow rate Ti usingthe variable θ as input, where (see Section IV)
θ =√
ρ × (k − venturi) (12)
where k is a constant function of the offset introduced by thedata acquisition card. The density of the fluid mixture is thencomputed as follows:
ρ (in kilograms per cubic meter)
=[γ + 0.81(β) + (1.2 × 10⁻³ × α)
]× 1000 kg/m3 × 100 (13)
MERIBOUT et al.: MULTISENSOR DEVICE FOR REAL-TIME MULTIPHASE FLOW METERING IN OIL FIELDS 1515
Fig. 13. Hierarchical neural network for fluid fractions determination.
Fig. 14. Average aggregated errors for conductance, capacitance, and ultra-sonic sensors.
Fig. 15. Hierarchical neural network for flow rate determination.
where the three parameters α, β, and γ are determined duringthe fluid composition determination phase.
This first estimation phase is performed by exploring theparameter space of Fig. 5. However, as shown in this figure,different combinations of the density and venturi probe mightlead to more than one candidate total mass flow rate. This is
overcome during the second phase of the algorithm, where theabove density value ρ is fed together with the actual differentialpressure ΔPi into another neural network module of 14 neuralnetwork banks to generate the mass flow rate residual ΔTi to beaggregated to Ti. Note that the neural network blocks FFN-1-to-n in Fig. 15, which are used for flow rate determination, aredifferent from those in Fig. 13, which are used to determinethe fluid composition. In addition, and similarly to Fig. 13,one single hidden layer (six nodes in the hidden layer) withlogsig activation function was provided for each individualneural network block since it provided the best satisfactoryresults in terms of accuracy and execution time. Neural networkarchitectures with a larger number of hidden layers did notsubstantially reduce the overall error.
VII. EXPERIMENTAL RESULTS AND VALIDATION
To cover the maximal ranges of fluid compositions and flowrates, extensive experiments have been performed to producethe following two databases:
1) a flow rate database with 240 sample elements (of ρ,venturi, and ΔP probes) to cover mass flow rates M from0 to 47 000 kg/h;
2) a phase fractions database with 470 sample elements (ofconductance, capacitance, ultrasonic, ρ, venturi, and ΔPprobes) to cover flow composition from 0% to 100% forαa, βa, and γa, respectively.
A. Comparison of Accuracy for Offline Experiments
Prior to starting the online experiments, an offline evaluationof the two above databases and the associated hierarchicalneural network algorithms has been performed for variouslevels of noise that can easily be aggregated to sensors outputssince these latest are intended to operate in harsh environ-ments. Thus, slight variations of the sensors output character-istics might be expected. Hence, various levels of noise areadded to the simulated input signals: signal-to-noise ratio = ∞(no noise), 40 dB, 30 dB, and 20 dB. The evaluation criteria
1516 IEEE TRANSACTIONS ON INSTRUMENTATION AND MEASUREMENT, VOL. 59, NO. 6, JUNE 2010
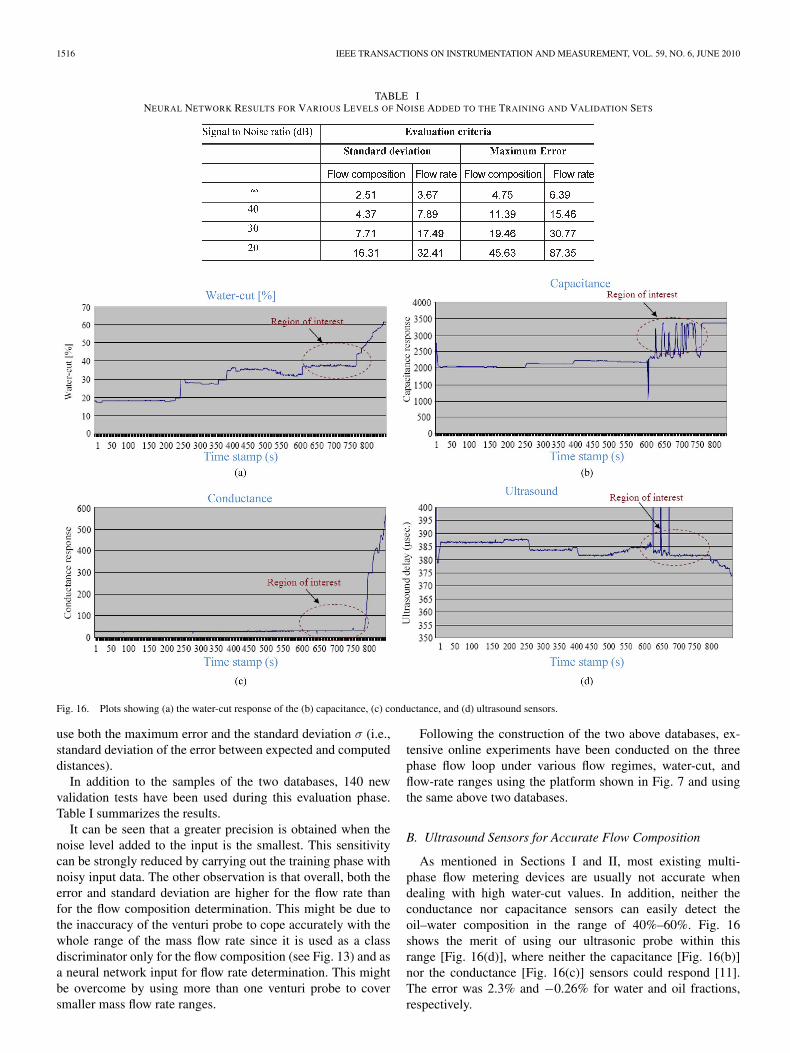
TABLE INEURAL NETWORK RESULTS FOR VARIOUS LEVELS OF NOISE ADDED TO THE TRAINING AND VALIDATION SETS
Fig. 16. Plots showing (a) the water-cut response of the (b) capacitance, (c) conductance, and (d) ultrasound sensors.
use both the maximum error and the standard deviation σ (i.e.,standard deviation of the error between expected and computeddistances).
In addition to the samples of the two databases, 140 newvalidation tests have been used during this evaluation phase.Table I summarizes the results.
It can be seen that a greater precision is obtained when thenoise level added to the input is the smallest. This sensitivitycan be strongly reduced by carrying out the training phase withnoisy input data. The other observation is that overall, both theerror and standard deviation are higher for the flow rate thanfor the flow composition determination. This might be due tothe inaccuracy of the venturi probe to cope accurately with thewhole range of the mass flow rate since it is used as a classdiscriminator only for the flow composition (see Fig. 13) and asa neural network input for flow rate determination. This mightbe overcome by using more than one venturi probe to coversmaller mass flow rate ranges.
Following the construction of the two above databases, ex-tensive online experiments have been conducted on the threephase flow loop under various flow regimes, water-cut, andflow-rate ranges using the platform shown in Fig. 7 and usingthe same above two databases.
B. Ultrasound Sensors for Accurate Flow Composition
As mentioned in Sections I and II, most existing multi-phase flow metering devices are usually not accurate whendealing with high water-cut values. In addition, neither theconductance nor capacitance sensors can easily detect theoil–water composition in the range of 40%–60%. Fig. 16shows the merit of using our ultrasonic probe within thisrange [Fig. 16(d)], where neither the capacitance [Fig. 16(b)]nor the conductance [Fig. 16(c)] sensors could respond [11].The error was 2.3% and −0.26% for water and oil fractions,respectively.
MERIBOUT et al.: MULTISENSOR DEVICE FOR REAL-TIME MULTIPHASE FLOW METERING IN OIL FIELDS 1517
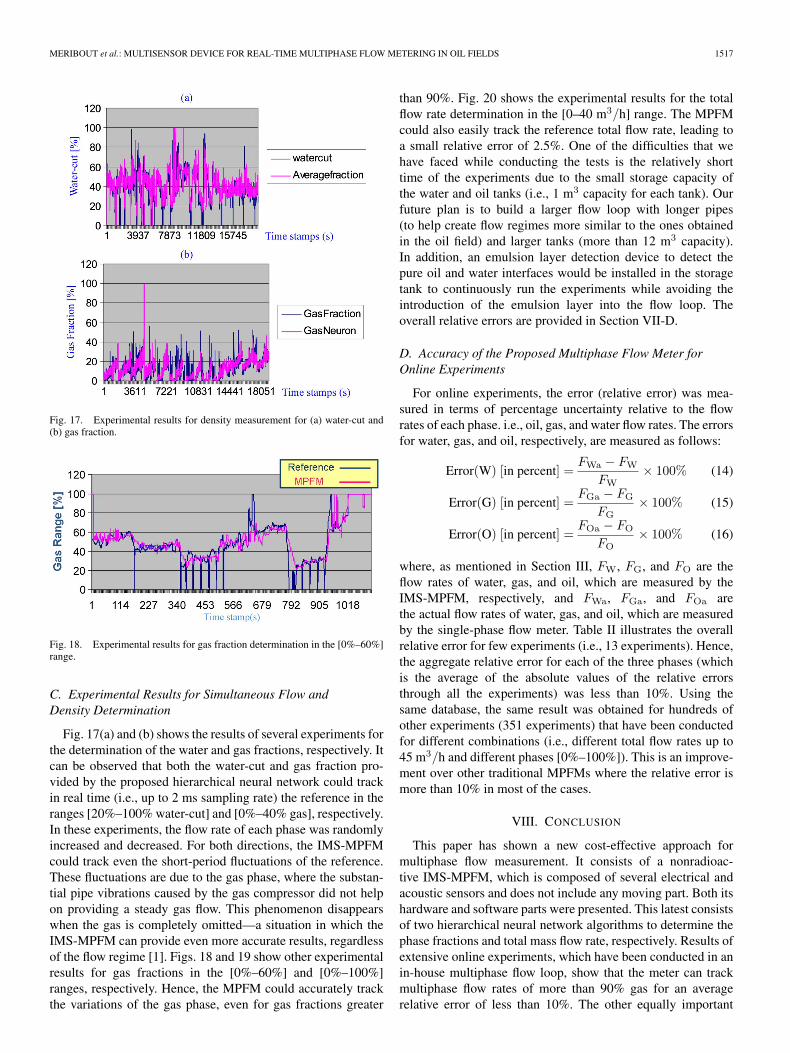
Fig. 17. Experimental results for density measurement for (a) water-cut and(b) gas fraction.
Fig. 18. Experimental results for gas fraction determination in the [0%–60%]range.
C. Experimental Results for Simultaneous Flow andDensity Determination
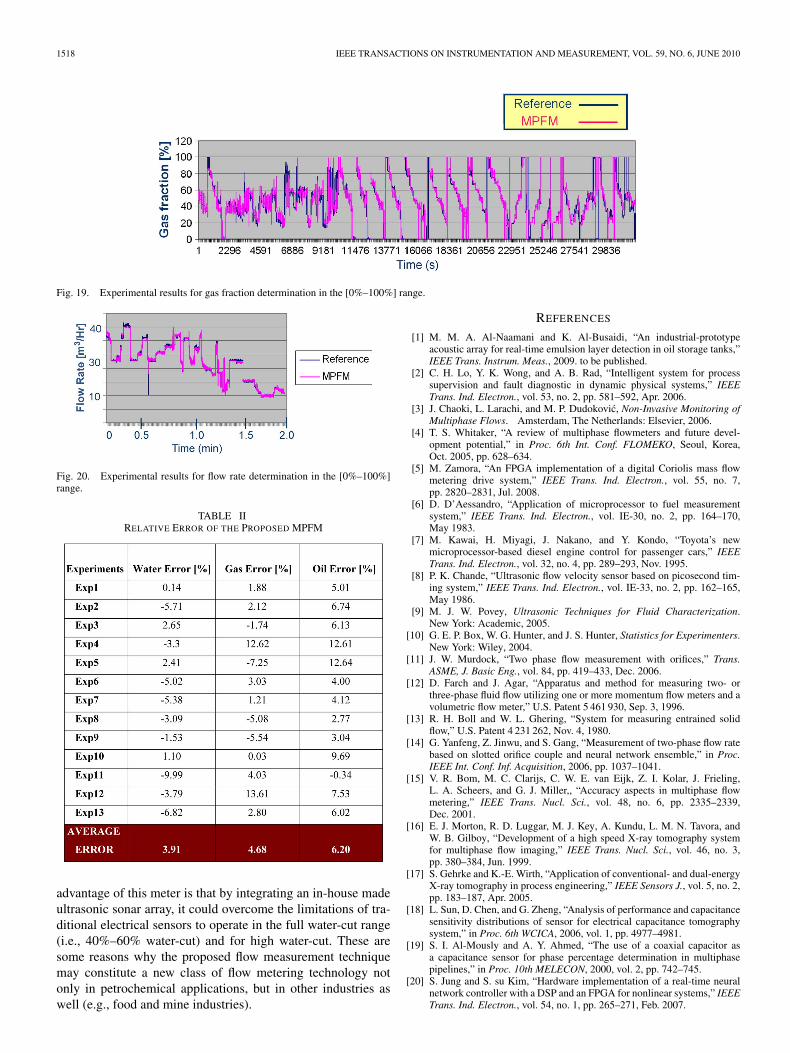
Fig. 17(a) and (b) shows the results of several experiments forthe determination of the water and gas fractions, respectively. Itcan be observed that both the water-cut and gas fraction pro-vided by the proposed hierarchical neural network could trackin real time (i.e., up to 2 ms sampling rate) the reference in theranges [20%–100% water-cut] and [0%–40% gas], respectively.In these experiments, the flow rate of each phase was randomlyincreased and decreased. For both directions, the IMS-MPFMcould track even the short-period fluctuations of the reference.These fluctuations are due to the gas phase, where the substan-tial pipe vibrations caused by the gas compressor did not helpon providing a steady gas flow. This phenomenon disappearswhen the gas is completely omitted—a situation in which theIMS-MPFM can provide even more accurate results, regardlessof the flow regime [1]. Figs. 18 and 19 show other experimentalresults for gas fractions in the [0%–60%] and [0%–100%]ranges, respectively. Hence, the MPFM could accurately trackthe variations of the gas phase, even for gas fractions greater
than 90%. Fig. 20 shows the experimental results for the totalflow rate determination in the [0–40 m3/h] range. The MPFMcould also easily track the reference total flow rate, leading toa small relative error of 2.5%. One of the difficulties that wehave faced while conducting the tests is the relatively shorttime of the experiments due to the small storage capacity ofthe water and oil tanks (i.e., 1 m3 capacity for each tank). Ourfuture plan is to build a larger flow loop with longer pipes(to help create flow regimes more similar to the ones obtainedin the oil field) and larger tanks (more than 12 m3 capacity).In addition, an emulsion layer detection device to detect thepure oil and water interfaces would be installed in the storagetank to continuously run the experiments while avoiding theintroduction of the emulsion layer into the flow loop. Theoverall relative errors are provided in Section VII-D.
D. Accuracy of the Proposed Multiphase Flow Meter forOnline Experiments
For online experiments, the error (relative error) was mea-sured in terms of percentage uncertainty relative to the flowrates of each phase. i.e., oil, gas, and water flow rates. The errorsfor water, gas, and oil, respectively, are measured as follows:
Error(W) [in percent] =FWa − FW
FW× 100% (14)
Error(G) [in percent] =FGa − FG
FG× 100% (15)
Error(O) [in percent] =FOa − FO
FO× 100% (16)
where, as mentioned in Section III, FW, FG, and FO are theflow rates of water, gas, and oil, which are measured by theIMS-MPFM, respectively, and FWa, FGa, and FOa arethe actual flow rates of water, gas, and oil, which are measuredby the single-phase flow meter. Table II illustrates the overallrelative error for few experiments (i.e., 13 experiments). Hence,the aggregate relative error for each of the three phases (whichis the average of the absolute values of the relative errorsthrough all the experiments) was less than 10%. Using thesame database, the same result was obtained for hundreds ofother experiments (351 experiments) that have been conductedfor different combinations (i.e., different total flow rates up to45 m3/h and different phases [0%–100%]). This is an improve-ment over other traditional MPFMs where the relative error ismore than 10% in most of the cases.
VIII. CONCLUSION
This paper has shown a new cost-effective approach formultiphase flow measurement. It consists of a nonradioac-tive IMS-MPFM, which is composed of several electrical andacoustic sensors and does not include any moving part. Both itshardware and software parts were presented. This latest consistsof two hierarchical neural network algorithms to determine thephase fractions and total mass flow rate, respectively. Results ofextensive online experiments, which have been conducted in anin-house multiphase flow loop, show that the meter can trackmultiphase flow rates of more than 90% gas for an averagerelative error of less than 10%. The other equally important
1518 IEEE TRANSACTIONS ON INSTRUMENTATION AND MEASUREMENT, VOL. 59, NO. 6, JUNE 2010
Fig. 19. Experimental results for gas fraction determination in the [0%–100%] range.
Fig. 20. Experimental results for flow rate determination in the [0%–100%]range.
TABLE IIRELATIVE ERROR OF THE PROPOSED MPFM
advantage of this meter is that by integrating an in-house madeultrasonic sonar array, it could overcome the limitations of tra-ditional electrical sensors to operate in the full water-cut range(i.e., 40%–60% water-cut) and for high water-cut. These aresome reasons why the proposed flow measurement techniquemay constitute a new class of flow metering technology notonly in petrochemical applications, but in other industries aswell (e.g., food and mine industries).
REFERENCES
[1] M. M. A. Al-Naamani and K. Al-Busaidi, “An industrial-prototypeacoustic array for real-time emulsion layer detection in oil storage tanks,”IEEE Trans. Instrum. Meas., 2009. to be published.
[2] C. H. Lo, Y. K. Wong, and A. B. Rad, “Intelligent system for processsupervision and fault diagnostic in dynamic physical systems,” IEEETrans. Ind. Electron., vol. 53, no. 2, pp. 581–592, Apr. 2006.
[3] J. Chaoki, L. Larachi, and M. P. Dudokovic, Non-Invasive Monitoring ofMultiphase Flows. Amsterdam, The Netherlands: Elsevier, 2006.
[4] T. S. Whitaker, “A review of multiphase flowmeters and future devel-opment potential,” in Proc. 6th Int. Conf. FLOMEKO, Seoul, Korea,Oct. 2005, pp. 628–634.
[5] M. Zamora, “An FPGA implementation of a digital Coriolis mass flowmetering drive system,” IEEE Trans. Ind. Electron., vol. 55, no. 7,pp. 2820–2831, Jul. 2008.
[6] D. D’Aessandro, “Application of microprocessor to fuel measurementsystem,” IEEE Trans. Ind. Electron., vol. IE-30, no. 2, pp. 164–170,May 1983.
[7] M. Kawai, H. Miyagi, J. Nakano, and Y. Kondo, “Toyota’s newmicroprocessor-based diesel engine control for passenger cars,” IEEETrans. Ind. Electron., vol. 32, no. 4, pp. 289–293, Nov. 1995.
[8] P. K. Chande, “Ultrasonic flow velocity sensor based on picosecond tim-ing system,” IEEE Trans. Ind. Electron., vol. IE-33, no. 2, pp. 162–165,May 1986.
[9] M. J. W. Povey, Ultrasonic Techniques for Fluid Characterization.New York: Academic, 2005.
[10] G. E. P. Box, W. G. Hunter, and J. S. Hunter, Statistics for Experimenters.New York: Wiley, 2004.
[11] J. W. Murdock, “Two phase flow measurement with orifices,” Trans.ASME, J. Basic Eng., vol. 84, pp. 419–433, Dec. 2006.
[12] D. Farch and J. Agar, “Apparatus and method for measuring two- orthree-phase fluid flow utilizing one or more momentum flow meters and avolumetric flow meter,” U.S. Patent 5 461 930, Sep. 3, 1996.
[13] R. H. Boll and W. L. Ghering, “System for measuring entrained solidflow,” U.S. Patent 4 231 262, Nov. 4, 1980.
[14] G. Yanfeng, Z. Jinwu, and S. Gang, “Measurement of two-phase flow ratebased on slotted orifice couple and neural network ensemble,” in Proc.IEEE Int. Conf. Inf. Acquisition, 2006, pp. 1037–1041.
[15] V. R. Bom, M. C. Clarijs, C. W. E. van Eijk, Z. I. Kolar, J. Frieling,L. A. Scheers, and G. J. Miller,, “Accuracy aspects in multiphase flowmetering,” IEEE Trans. Nucl. Sci., vol. 48, no. 6, pp. 2335–2339,Dec. 2001.
[16] E. J. Morton, R. D. Luggar, M. J. Key, A. Kundu, L. M. N. Tavora, andW. B. Gilboy, “Development of a high speed X-ray tomography systemfor multiphase flow imaging,” IEEE Trans. Nucl. Sci., vol. 46, no. 3,pp. 380–384, Jun. 1999.
[17] S. Gehrke and K.-E. Wirth, “Application of conventional- and dual-energyX-ray tomography in process engineering,” IEEE Sensors J., vol. 5, no. 2,pp. 183–187, Apr. 2005.
[18] L. Sun, D. Chen, and G. Zheng, “Analysis of performance and capacitancesensitivity distributions of sensor for electrical capacitance tomographysystem,” in Proc. 6th WCICA, 2006, vol. 1, pp. 4977–4981.
[19] S. I. Al-Mously and A. Y. Ahmed, “The use of a coaxial capacitor asa capacitance sensor for phase percentage determination in multiphasepipelines,” in Proc. 10th MELECON, 2000, vol. 2, pp. 742–745.
[20] S. Jung and S. su Kim, “Hardware implementation of a real-time neuralnetwork controller with a DSP and an FPGA for nonlinear systems,” IEEETrans. Ind. Electron., vol. 54, no. 1, pp. 265–271, Feb. 2007.
MERIBOUT et al.: MULTISENSOR DEVICE FOR REAL-TIME MULTIPHASE FLOW METERING IN OIL FIELDS 1519
[21] J. Chen, Z. Zhou, X. Zhang, and T. Yu, “Terahertz process tomog-raphy using in multiphase flow measurement,” in Proc. WCICA, 2004,pp. 3727–3729.
[22] L. C. Lynnworth, Ultrasonic Measurements for Process Control.New York: Academic, 2006.
[23] H. Zhuang, K.-S. Low, and W.-Y. Yau, “A pulsed neural network with on-chip learning and its practical applications,” IEEE Trans. Ind. Electron.,vol. 54, no. 1, pp. 34–42, Feb. 2007.
Mahmoud Meribout (S’85–M’91) received thePh.D. degree in electronics engineering from the Uni-versity of Technology of Compiegne, Compiegne,France, in January 3, 1995.
From November 1995 to October 2000, he waswith the NTT Corporation, Japan, and then with theNEC Corporation, Japan, where he has been involvedin several projects related to embedded systems de-sign. In November 2000, he joined the Department ofElectrical and Computer Engineering, Sultan QaboosUniversity, Muscat, Oman. Since August 2008, he
has been an Associate Professor with the Department of Electrical Engineering,Petroleum Institute, Abu Dhabi, United Arab Emirates. He is the holder ofseveral Japanese and American patents related to embedded system design.
Dr. Meribout received the NTT Best Award in 1998 for his research anddevelopment records.
Nabeel Z. Al-Rawahi (S’94–M’97) received thePh.D. degree in mechanical engineering from theUniversity of Michigan, Ann Arbor, in 2002.
He was an Assistant Professor with the Universityof Michigan, where he was involved in several in-dustrial and academic projects involving multiphaseflow and desalination. He is currently an AssistantProfessor with the Department of Mechanical andIndustrial Engineering, Sultan Qaboos University,Muscat, Oman. His research interests include multi-phase flow, computational fluid dynamics, desalina-
tion processes, and renewable energy.
Ahmed M. Al-Naamany received the B.Sc. degree(with honors) in multidisciplinary engineering fromWidener University, Chester, PA, in 1986, the M.Sc.degree in electrical engineering and computer con-trol from Drexel University, Philadelphia, PA, in1990, and the Ph.D. degree from the University ofManchester, Manchester, U.K., in 1995.
He lectured on computer architecture, computercontrol, and artificial intelligence applications. Since1996, he has been with the Department of Electricaland Computer Engineering, Sultan Qaboos Univer-
sity, Muscat, Oman, where he is currently an Assistant Professor.Dr. Al-Naamany is a member of the IEEE Computer Society and the IEEE
Control Systems Society. He was the recipient of a Fulbright Scholarship.
Ali Al-Bimani received the M.Sc. and Ph.D. degreesin petroleum engineering from the University ofSouthern California, Los Angeles.
He is currently an Associate Professor with heDepartment of Petroleum and Chemical Engineer-ing, Sultan Qaboos University, Muscat, Oman. Hisresearch interests include well testing, reservoir en-gineering, rock and fluid properties, and computerapplications in petroleum engineering.
Khamis Al-Busaidi received the M.Sc. and Ph.D. degrees in petroleum engi-neering from the University of Manchester, Manchester, U.K.
He is currently with Petroleum Development Oman (PDO), Muscat, Oman,where he has been involved in several industrial projects such as smart fieldsand multiphase flow meters. He has been active on introducing these technolo-gies to PDO and is an active consultant for Sultan Qaboos University, Muscat.
Adel Meribout received the B.Eng. degree in elec-trical and computer engineering from the Universityof Constantine, Constantine, Algeria, in 1995.
From January 2007 to February 2008, he was aResearch Assistant with the Department of Electricaland Computer Engineering, Sultan Qaboos Univer-sity, Muscat, Oman. He is currently with the De-partment of Instrumentation and Control, SonatrachCorporation, Algiers, Algeria (an Algerian oil com-pany), as an Engineer. His research interests includeembedded Instrumentation design and implementa-
tion in the areas of oil and gas.