Embed Size (px)
Citation preview
Page 1 of 13
State of the Markets: A Minsky Review By Ed Easterling April 19, 2005 All Rights Reserved Judging from the level of complacency in the stock market, some of you may not care to make it to the second paragraph of this article—Hyman Minsky warned us about times like this! Those of you that stay until the end will find a compelling case that four indicators portend a significant decline in the stock market and a rise in volatility before the end of next year. For those with financial exposure to the stock market today, you may be compelled to act. For those of you that have already hedged your positions, this article will provide the insights to know when to increase your exposure again. And for the complacent readers, save this for later reference to explain “why.” MINSKY’S INSIGHTS Professor Hyman P. Minsky (1919-1996) studied at the University of Chicago and Harvard. He became a leading economist and advanced our understanding of the linkages between the financial markets and the economy. His work was influenced by the wisdom of John Maynard Keynes, Irving Fisher, Henry Simons, and other prominent economists and scholars. Among his many achievements is the Financial Instability Hypothesis (FIH): that stability is destabilizing. Minsky found that financial systems naturally evolve from a position of stability to a vulnerable position of instability. Financial positions within the system evolve from “hedge” to “speculation” and finally to “Ponzi,” a bubble-like stage. This evolution occurs when participants become increasingly optimistic about the future and complacent to risk. The resulting stability generates a false confidence, ultimately leading to financial positions that are increasingly vulnerable to conditions or events that do not meet expectations. In the first stage, investors in pursuit of returns remain always cautious to the risks around them. The approach is vigilant against unwarranted risky exposure. Investors hedge by buying protection, actively diversifying, and maintaining cash reserves. In the second stage, during periods of low volatility and generally rising markets, investors become desensitized to potential risks and begin to increase their risk profile in order to enhance returns. This can be done by taking positions that are more concentrated, investing in high-risk securities, adding leverage through margin, and selling options. At times, yet not very often, investors disengage from rational investment thinking and make decisions based upon the expectation that someone else will buy their overvalued securities at even higher prices—this is stage three, the Ponzi phase…remember the recent bubble of the late 1990s?

Page 2 of 13
Most cycles never reach the Ponzi stage. Markets more often remind investors of this cycle during the “speculation” stage and restore balance in advance of the carnage from a bursting bubble. Today, spring 2005, we are well into the “speculation” stage and the conditions are ripe for realignment. Let’s explore the indicators. VULNERABLE MARKET CONDITIONS Background For this analysis, principles from my recent book, Unexpected Returns: Understanding Secular Stock Market Cycles, will be employed. The following article will include all of the charts and information needed to assess the current vulnerability and impending decline. For more information about the book, please visit www.UnexpectedReturns.com or Amazon.com for a direct link to information about the book. Unexpected Returns was developed to explore the messages of research published on the Crestmont Research website, and includes more than 60 full-color graphics as well as new material developed to highlight key issues. It is written in a style that is directed to casual investors as well as sophisticated scholars. Unexpected Returns is a unique combination of investment art and investment science that enables the reader to differentiate between irrational hope and a rational view of current market conditions. Four Categories There are four categories of indicators that signal an impending decline (bulls will call it a “pullback”) in the stock market. Because we are currently in a secular bear market (a bear-in-hibernation at the least), the market can be expected to act as it has during the past secular bear markets. Keep in mind: the market conditions are not positioned to provide another secular bull market at this time—it is not a sleeping bull. The current conditions reflect a secular bear or a bear-in-hibernation because the price/earnings ratio (“P/E”) is well above its historical average and cannot rationally be expected to rise from current levels. Without a rising P/E, future returns will be below average. For more information about secular cycles, chapter 5 of Unexpected Returns is titled “Secular Stock Market Cycles” and provides an in depth discussion of their characteristics and causes. The four categories include: (1) Secular Bear Market Profile, (2) Volatility, (3) Valuation, and (4) Anecdotal Evidence. Each will represent a piece of evidence that will build the case that the market is likely to experience a decline during 2005 or 2006.

Page 3 of 13
Secular Bear Market Profile The first, Secular Bear Market Profile, relates to the characteristics of the stock market during periods when P/E ratios start at relatively high levels and remain flat or decline. Figure 1, Selected Secular Market Profile Measures, compares the current secular bear market period (2000-2004) to the average historical secular bear market. For a more complete profile chart, you can visit www.CrestmontResearch.com or see Figure 5.1 in Unexpected Returns. Figure 1: Selected Secular Market Profile Measures
Thus far, the current secular cycle has experienced a near-average profile of positive and negative years. In addition, the current cycle has a near-average profile of positive and negative years in a row. The average secular bear has 42% of its years in positive territory and 58% in the red. The current period has presented 40% and 60% respectively. For years-in-a-row, the typical secular bear has an average trend of 2.1 positive years and 2.7 negative years; the current period is a very close 2.0 and 3.0 thus far. The divergence from the average secular bear market profile occurs in the magnitude measures—the average gains and average losses are well below average. This is further evident in Figure 2, Annual Dispersion of Market Changes, which presents the frequency that annual changes in the market occur either within or outside of key ranges. This figure is described in more detail in Unexpected Returns. For this article, note the general consistency between secular periods for the frequency inside both ranges. Historically, almost 30% of the years have annual changes between -10% and +10%. Further, almost 50% of the years have annual changes between -16% and +16%. Most notably, these frequencies occur during secular bull and secular bear periods as well as occurring in the aggregate. Yes, the inside-range occurrences are remarkably consistent. The differences occur outside the range—secular bull markets have a strong bias to upside occurrences and secular bear markets have a notable bias to downside occurrences.

Page 4 of 13
Figure 2: Annual Dispersion of Market Changes
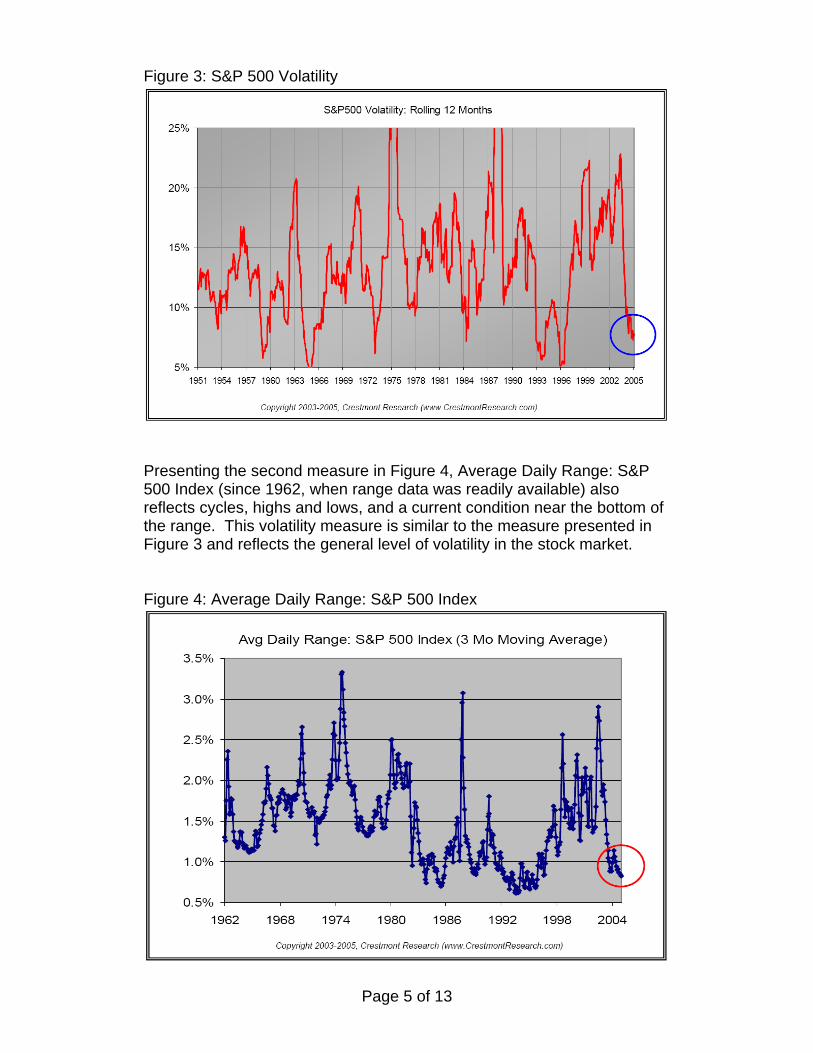
So far in this secular bear market cycle, the past five years have been atypically concentrated toward the center. More concerning, however, the frequency of large declines (more than -16%) is unusually low. Based upon the typical secular bear market profile, we appear susceptible to double digit moves, especially large declines. Volatility Volatility relates to the choppiness of the market and tends to cycle over time. The cycles are erratic and often violent. The level of volatility rarely remains constant for very long. There are a number of ways to measure volatility; two of which include (a) the statistic known as standard deviation and (b) the daily range from high to low measured as a percentage. Figure 3, S&P 500 Volatility, presents the rolling twelve-month standard deviation of the S&P 500 since 1951. It is obviously quite erratic, yet with defined cycles and extremes of low and high levels. It is noteworthy that extreme lows (near 5%) are generally followed by spikes to near 20% or more. Further, the current level of volatility (approximately 8%) is near historical cycle lows.
Page 5 of 13
Figure 3: S&P 500 Volatility
Presenting the second measure in Figure 4, Average Daily Range: S&P 500 Index (since 1962, when range data was readily available) also reflects cycles, highs and lows, and a current condition near the bottom of the range. This volatility measure is similar to the measure presented in Figure 3 and reflects the general level of volatility in the stock market. Figure 4: Average Daily Range: S&P 500 Index

Page 6 of 13
Why does volatility matter? As reflected in Figure 5, Volatility & Market Returns, there is a strong relationship between the level of volatility and the performance of the market. As volatility rises, there is a greater propensity for the stock market to experience losses. Volatility tends to decline as the stock market rises and tends to increase as the stock market falls. For example, in the top half of Figure 5, the average daily range for each month is grouped into four sets, known as quartiles, which are ranked from least volatile to most volatile. You will notice that the least volatile periods have the lowest frequency of down months. As the volatility increases across the quartiles, the frequency of down months consistently increases. Further, as the volatility increases, the magnitude of the loss during down months consistently increases. Higher volatility brings not only a greater chance of loss, but greater losses as they occur. The column on the right provides a summary measure of the expected return during each period. The expected return is determined by multiplying the chance of a gain times the average gain and subtracting the product of the chance of a loss times the average loss. As you can see in the table, the expected return consistently declines and becomes an expected loss in the most volatile markets. A similar analysis using annual data is provided on the bottom half of the table reflecting the same conclusions. Figure 5: Volatility & Market Returns

Page 7 of 13
Further, when the concepts of volatility are assessed in secular bull and secular bear markets, the characteristics that we saw in Figure 2 are apparent. In secular bull markets, the more volatile periods tend to occur on the upside. In secular bear markets, however, there is a higher percentage of downside volatility than upside volatility. As a result, the negative effects of volatility surges in secular bull markets can be overcome by strong market performance and the stock market can experience gains amidst the volatility. In secular bear markets, the downside volatility and negative effects of volatility create adverse market conditions. Figure 6, Volatility in Secular Bull and Bear Cycles, reflects the performance of the stock market during the volatility cycles presented earlier in Figure 3. Green shading has been added to reflect periods of secular bull markets and yellow shading reflects periods of secular bear markets. This will help to show that volatility surges have different effects on the market during secular bull periods and secular bear periods. As measured by the rolling standard deviation, there have been five surges in volatility from extreme low levels since 1951. Each of these volatility surges is noted on Figure 6 with black circles, lines, and arrows. In addition, a percentage value is presented next to each black line representing the annualized rate of change in the S&P 500 Index from the bottom to the top of the move in volatility. The average change in the stock market during volatility spikes is positive during secular bull periods and negative during secular bear periods, yet the gains and losses can be much more extreme at times within the period. Time, totals, and averages have the tendency to blur the magnitude of intra-cycle swings. Figure 6: Volatility in Secular Bull and Bear Cycles
Therefore, volatility represents the second indicator of an upcoming sharp stock market decline based upon (i) the currently low level of volatility, (ii) the tendency for upward spikes to follow extreme low volatility, (iii) the

Page 8 of 13
relationship of market direction to volatility trends, and (iv) the propensity for downside volatility during secular bear markets. Volatility could decline further and could remain low for some time longer; however, based upon history, it has not stayed low without subsequently spiking and, as it goes lower, the likelihood of a spike increases significantly. Valuation Generally, when valuations are relatively high, there is a greater propensity for a decline in value than a rise in value since there is a typical range of values and, in some cases, a natural limit to values. Two of the indicators of valuation in the financial markets include (a) price/earnings ratios (P/E) and (b) bond market credit spreads. As reflected in Figure 7, P/E Ratio: S&P 500 (1900-2004), the current level of the general market P/E is well above the average and near past cycle tops (excluding the bubble of the late 1990s). Clearly, the P/E is above the historical average. As a result, the market may be more vulnerable to a decline in valuation than it is susceptible to an increase in valuation. Figure 7: P/E Ratio: S&P 500 (1900-2004)
Beyond the stock market, the bond market also reflects a relatively high level of valuation. Further, the bond market is indicating a low perception of risk. One measure of valuation and risk assessment is credit spreads—the additional return available to an investor for owning a bond from a company with higher credit risk compared to a company with lower credit risk. As reflected in Figure 8, Historical Credit Spreads, we are near or

Page 9 of 13
below levels of the past decade. Keep in mind that the spread should never go below zero and, as it approaches zero, at some point no longer compensates the bondholder for the additional risk (some experts are saying that we are at that point now). Figure 8: Historical Credit Spreads
Regardless of whether we are at extreme levels or simply levels that reflect relatively high valuations in the financial markets, the third indicator of vulnerability and potential stock market decline is the relatively high level of valuation in the financial markets. Anecdotal Evidence There is plenty of evidence in the traditional press and offered from the traditional pundits that the current level of valuation is reasonable, that conditions are different this time, and that we are positioned for a strong bull market in stocks. The purpose of this subsection is to offer a few balancing anecdotal indicators as the intangible part of this article. Although the strength of the case could be made with the first three indicators alone, the following snippets further confirm that vulnerabilities and attitudes that Professor Minsky identified in his Financial Instability Hypothesis.

Page 10 of 13
As the financial market volatility has continued to decline, managers of hedge fund portfolios initially experienced the decline in volatility and then began to increase their risk profile and volatility (see Figure 9). As Minsky postulated, this essentially reflects the shift from the hedged stage to the speculative stage. Further, some investors and hedge fund managers have increased leverage to maintain returns in more stable environment. Figure 9: Typical Hedge Fund Portfolio Volatility
Over the past year as volatility has continued to decline, substantial capital has left certain “long-volatility” styles of investing and shifted to certain “short-volatility” styles. For example, substantial capital has been withdrawn from convertible arbitrage, a strategy that is highly dependent upon stock market volatility, and shifted to distressed debt hedge funds (which has profited handsomely as credit spreads have moved to historically low levels). Because the insurance of investing in “long-volatility” strategies has not paid off, investors have shifted to selling insurance by shifting to “short-volatility” strategies. Essentially, as market volatility has declined, investors have shifted from risk-averse positions to risk-accepting positions. Contrarians would say that this is a sign of upcoming market losses. Using the Lemmings Rule, indicating that investors—like furry little lemmings—tend to herd together and ignore disaster, we can look to Merrill Lynch’s recent survey of investors as reported in the Financial Times on March 16, 2005. Christopher Brown-Humes and Jennifer Hughes reported: “The latest monthly Merrill Lynch survey of fund
Page 11 of 13
managers shows a net 59 percent of participants are over-weighted in equities—the highest figure since Merrill began the survey in 1999.” This overly-aggressive bias for bullishness is another time-tested sign that the market may be vulnerable to a decline. A wise and experienced hedge fund manager with more than $3 billion under management recently wrote to his investors: “The last time arbitrage strategies were declared dead was in 1998, just before the Long Term Capital fiasco. The next two years produced great returns for those who managed their risk well during the market turmoil. The mindset that arbitrage and highly-hedged (or lower-risk) strategies are unattractive is potentially dangerous. Hedge funds are clearly taking more risk to maintain their returns both in the form of more market risk and more liquidity risk, and they have received a lot of encouragement from investors to do so. A fund manager takes a lot of business risk to follow the crowd down that path. We do not think adding risk is appropriate at this juncture and are willing to accept the business risk. We want to be around for the great years. This means focusing on investment risk when the crowd is focused on return.{emphasis added}” Using Professor Minsky’s concepts, once investors become complacent to risk and become overly-focus on return, the markets shift from a state of “hedged” to a state of “speculation” (before potentially moving to “Ponzi”). Such a shift creates a condition of vulnerability when stability can be destabilizing (the Financial Instability Hypothesis). Further evidence from other economic and financial indicators suggest that the tectonic-pressures in the financial markets are rising includes: (a) declines in the U.S. dollar, (b) rising commodity prices, (c) U.S. trade deficit, (d) U.S. budget deficit, (e) the VIX, a measure of expected stock market volatility, is at low levels, (f) earnings growth has peaked following the last recession, (g) oil prices have reached a plateau above $50 per barrel, and (h) for the superstitious, January’s loss in the stock market is believed to be a harbinger for the year. IMF REPORT The International Monetary Fund (IMF) assesses global financial market developments with the view to identifying potential systemic weaknesses and publishes a semi-annual Global Financial Stability Report. The most recent report, published in April 2005, received a fair amount of attention for its stark warnings of potential instability in the global financial markets. Quoting from the report: “If history is any guide, the single most important risk factor for financial markets in good times is complacency…current risk premiums for inflation and credit risks leave little or no margin for error in term of financial asset valuation.” (pg 1)

Page 12 of 13
Further, “Low short-term interest rates and low volatility are encouraging investors to move out along the risk spectrum in their search for relative value. The incentive to use leverage to boost returns is still strong. The premiums for inflation and credit risk appear compressed. There is little cushion for bad news regarding asset valuations if expectations for continued favorable fundamentals change.” (pg 8) Additionally, “Financial risk taking encouraged by a prolonged period of abundant liquidity may have created unsustainable valuations and pushed volatility across a wide range of markets to artificially low levels. Past tightening cycles have revealed hidden vulnerabilities as the incentive to reach for yield was withdrawn. The locus of such vulnerabilities has typically become fully apparent only after the fact.” (pg 9) Why are so few concerned about the vulnerabilities and bias toward disruptions in the financial markets? Minsky and the IMF agree: Complacency. CONCLUSION Four of the indicators that the stock market is vulnerable to a volatile and significant decline include:
1) The Secular Market Profile is underweighted with significant downside years
2) Volatility is near historical lows; spikes upward tend to accompany
market declines 3) Valuation in the financial markets is high and vulnerable to decline 4) Anecdotal evidence reinforces the vulnerabilities
The message from the indicators is reinforced by the extensive analysis included in the IMF’s recent report on global financial markets. Based upon history, these factors do not indicate that the decline will occur in 2005. It does indicate, however, that the current conditions are becoming increasingly vulnerable. If the increase in volatility and market decline does not occur in 2005, the probabilities of a market decline increase significantly for 2006. Be forewarned, just because it could occur in 2006 does not mean that it will not occur in 2005. These conditions are not unusual for periods that have relatively high stock market valuations and low interest rates—these conditions are the norm rather than the exception. It is as typical as winter following summer; it is a time for the superior, above-average period of the 1980s and 1990s to return to the average. Periods that start with above-average
Page 13 of 13
valuations (i.e. high P/Es and low interest rates) result in below-average returns, just as periods like the 1980s and 1990s that started with below-average valuations have produced above-average returns. For a more detailed explanation of these and other factors as well perspectives on investment strategies to address secular bear market conditions, please see Unexpected Returns: Understanding Secular Stock Market Cycles (www.UnexpectedReturns.com). The book is available internationally online or locally at a bookseller near you. Ed Easterling is the author of recently released Unexpected Returns: Understanding Secular Stock Market Cycles, President of an investment management firm, a member of the adjunct faculty in the Cox School of Business at SMU, and publisher of provocative research on the financial markets at www.CrestmontResearch.com.