Embed Size (px)
Citation preview
© 2021 The Author(s). Published by the Royal Society of Chemistry Mater. Adv., 2021, 2, 6339–6343 | 6339
Cite this: Mater. Adv., 2021,
2, 6339
A low-cost tabletop tensile tester with opticalextensometer†‡
Mogens Hinge, *a Jeremiah A. Johnson *b and Martin L. Henriksen *ab
High quality mechanical testing normally demands costly test equipment. This work presents a low cost
(B$500) fully customizable tensile tester that is designed from locally sourced and readily available
components and, together with custom made operation software, delivers data of similar quality to
commercial equipment. The instrument is small, light, and movable (e.g., it is suitable for a standard
fume hood) and should be of interest to laboratories with limited access to advanced characterization
facilities. All details are provided for future adaptation and customization.
Introduction
The need for basic mechanical property testing of new poly-mers and soft matter has increased over the past decade asresearchers seek functional1,2 and sustainable3–5 materials,polymers, and elastomers that can potentially replace existingmaterials. One key parameter for material evaluation is theYoung’s modulus (E), which can be determined from tensiletesting.6–9 The tensile testing experiment is normally per-formed on commercial equipment of very high quality thatgives useful data on materials with a wide range of E values.Nevertheless, the price and availability of such equipment maylimit its broad access to researchers, especially in academiclaboratories.10,11 Several factors (e.g., equipment rigidity, dataacquisition type, sampling rate) determine the optimal choiceof equipment, but for certain materials/fields (e.g., gels, tissueengineering, thin films, soft elastomers, etc.) equipmentdemand may not justify investment in existing commercialinstrumentation. Moreover, in chemical research laboratories,solvent evaporation from experimental materials (e.g., gels) maylimit where samples can be safely tested (e.g., in a fume hood).Finally, in the COVID-19 era, limited laboratory occupancy cancreate bottlenecks when multiple researchers seek to use asingle instrument; the ability to rapidly produce low-costalternative instrumentation could be transformative.
For laboratories and scientists who seek to add tensiletesting to their repertoire, or scale their tensile testing through-put, a small, low cost, locally sourced tensile testing instrumentwould be advantageous. Few alternatives are available,12–14 butthe price, complexity or lack of rigidity, documentation, orcalibration can be reasons for not pursuing the design. Herein,a Custom-Made low-cost Tensile Tester (CMTT) with a videoextensometer that can be built for B$500 is described (Fig. 1).This instrument was developed using the following designprinciples: (1) it should be cheap to source and build, (2) itshould use low-cost components made locally and with simpletooling, and (3) it must allow full access and control of rawdata. We believe that this low-cost CMTT instrument should bereadily available to researchers and significantly lower thebarrier-to-entry for those interested in developing or augment-ing their mechanical testing capabilities.
Experimental
The core of the CMTT is based on a Screw-Driven LinearActuator System (2000-Bundle, OpenBuilds, US) with a movingsledge. Custom-made grips are attached on the movingsledge and on a base mount, both of which are carefullyaligned to each other and fastened on an aluminum base plate(Fig. S1–S5, ESI†). The CMTT described here is designed with a100 N load cell (Parallel beam, TAL220, HT Sensor Technology).The sled is driven with a NEMA 17 stepper motor (1704HS168A)and controlled by a stepper motor driver (Big Easy Driver orPololu driver) connected to custom designed electronics. Twointer-changeable electronic solutions are proposed employing amicrocontroller (Uno or Nano, Arduino, IT). An industrialamplifier (HX711, Avia Semiconductor, CN) with internal 24bit A/D conversion is used to read the load cell and is connected
a Plastic and Polymer Engineering, Department of Biological and Chemical
Engineering, Aarhus University, Aabogade 40, Aarhus N, DK-8200, Denmark.
E-mail: [email protected], [email protected] Department of Chemistry, Massachusetts Institute of Technology, 77
Massachusetts Avenue, Cambridge, MA 02139-4307, USA.
E-mail: [email protected]
† Electronic supplementary information (ESI) available. See DOI: 10.1039/d1ma00598g‡ The data associated with this work is available through the Open Science FrameworkDOI: 10.17605/OSF.IO/CWP28 (link: https://osf.io/cwp28/).
Received 10th July 2021,Accepted 16th August 2021
DOI: 10.1039/d1ma00598g
rsc.li/materials-advances
MaterialsAdvances
PAPER
Ope
n A
cces
s A
rtic
le. P
ublis
hed
on 1
7 A
ugus
t 202
1. D
ownl
oade
d on
2/1
7/20
22 1
:49:
00 P
M.
Thi
s ar
ticle
is li
cens
ed u
nder
a C
reat
ive
Com
mon
s A
ttrib
utio
n 3.
0 U
npor
ted
Lic
ence
.
View Article OnlineView Journal | View Issue
6340 | Mater. Adv., 2021, 2, 6339–6343 © 2021 The Author(s). Published by the Royal Society of Chemistry
to the micro controller. An electronic schematic is provided forboth microcontroller solutions (Fig. S6 and S7, ESI†). A printedcircuit board solution for the Arduino NANO (Fig. S8 and S9,ESI†) and the microcontroller source code (SI: Arduino Code)are made in EAGLE (v 7.7.0 standard edition, CadSoft Compu-ter, GmbH) and Arduino IDE (Arduino v 1.8.5, IT), respectively.The Arduino is connected via RS232 to a computer (ThinkPadT650, Lenovo) running a standalone program (Open ObjectPascal, Lazarus IDE15) handling data acquisition from themicrocontroller, and a USB web camera (YoLuKe, CN) isapplied as a video extensometer. The same program enablesmanual control of the equipment as well as setup and executionof experiments. A bill of materials (BOM) for all mechanical and
electronic parts is provided in the ESI† together with a step-by-stepguide for assembly, calibration, and experimental execution.
Each image acquired by the web camera is timestamped andsaved for post-processing if necessary (SI: Post-processing byImageJ). Subsequently, the user-defined area of interest (AOI) iscropped out. To increase the signal-to-noise ratio, the croppedimage is converted into an 8 bit grey scale (BGray),16 and thepixel values (0–255) in the horizontal direction (x = 0 to x = n)are summed for each line of pixels (y = 0 to y = m) as givenby eqn (1).
BGrayy ¼
Xn
x¼10:299BRed
x þ 0:587BGreenx þ 0:114BBlue
x (1)
where BGray, BRed, BGreen, and BBlue are the bit values of the gray,red, green, and blue channels in the pixels, respectively.To minimize computation time, the absolute intensity differ-
ence between the previous line of pixels (BGrayn�1 ) and the given
pixel (BGrayn ) are calculated during the summation.
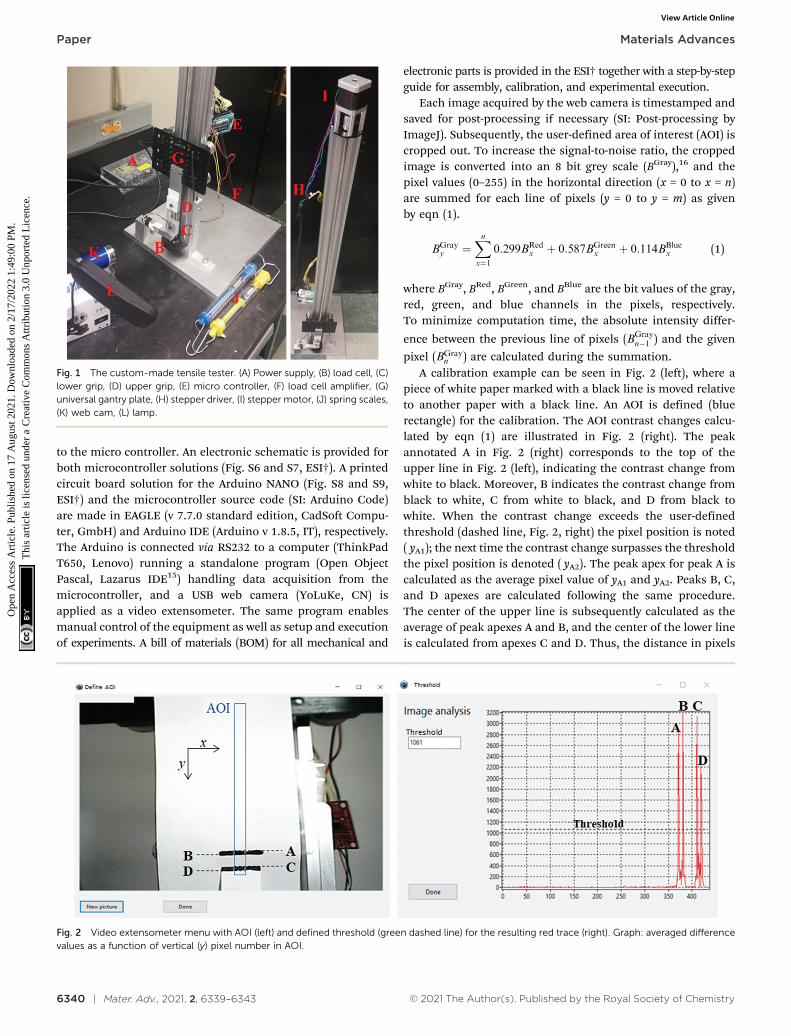
A calibration example can be seen in Fig. 2 (left), where apiece of white paper marked with a black line is moved relativeto another paper with a black line. An AOI is defined (bluerectangle) for the calibration. The AOI contrast changes calcu-lated by eqn (1) are illustrated in Fig. 2 (right). The peakannotated A in Fig. 2 (right) corresponds to the top of theupper line in Fig. 2 (left), indicating the contrast change fromwhite to black. Moreover, B indicates the contrast change fromblack to white, C from white to black, and D from black towhite. When the contrast change exceeds the user-definedthreshold (dashed line, Fig. 2, right) the pixel position is noted( yA1); the next time the contrast change surpasses the thresholdthe pixel position is denoted ( yA2). The peak apex for peak A iscalculated as the average pixel value of yA1 and yA2. Peaks B, C,and D apexes are calculated following the same procedure.The center of the upper line is subsequently calculated as theaverage of peak apexes A and B, and the center of the lower lineis calculated from apexes C and D. Thus, the distance in pixels
Fig. 2 Video extensometer menu with AOI (left) and defined threshold (green dashed line) for the resulting red trace (right). Graph: averaged differencevalues as a function of vertical (y) pixel number in AOI.
Fig. 1 The custom-made tensile tester. (A) Power supply, (B) load cell, (C)lower grip, (D) upper grip, (E) micro controller, (F) load cell amplifier, (G)universal gantry plate, (H) stepper driver, (I) stepper motor, (J) spring scales,(K) web cam, (L) lamp.
Paper Materials Advances
Ope
n A
cces
s A
rtic
le. P
ublis
hed
on 1
7 A
ugus
t 202
1. D
ownl
oade
d on
2/1
7/20
22 1
:49:
00 P
M.
Thi
s ar
ticle
is li
cens
ed u
nder
a C
reat
ive
Com
mon
s A
ttrib
utio
n 3.
0 U
npor
ted
Lic
ence
.View Article Online
© 2021 The Author(s). Published by the Royal Society of Chemistry Mater. Adv., 2021, 2, 6339–6343 | 6341
between the centers of the two lines can be used to calculate thestrain. Be aware, optics that produce distorted images withconvex or non-linear appearances (e.g., fisheye lenses) willdemand careful calibration.
The control system is designed so that the sampling rate islimited by the computer performing the image analysis anddata handling. The HX711 samples at 80 Hz in a runningaverage (n = 16) (excluding outliers) on the microcontrollerand transmits to the main program on request. All raw data aresaved at one Hz (maximum sample rate without failure was 3.33 Hz)in a semicolon separated ASCII file together with: date and time,time difference (ms), distance moved (steps), measured force (N),first line (pixel), last line (pixel), line difference (pixel).
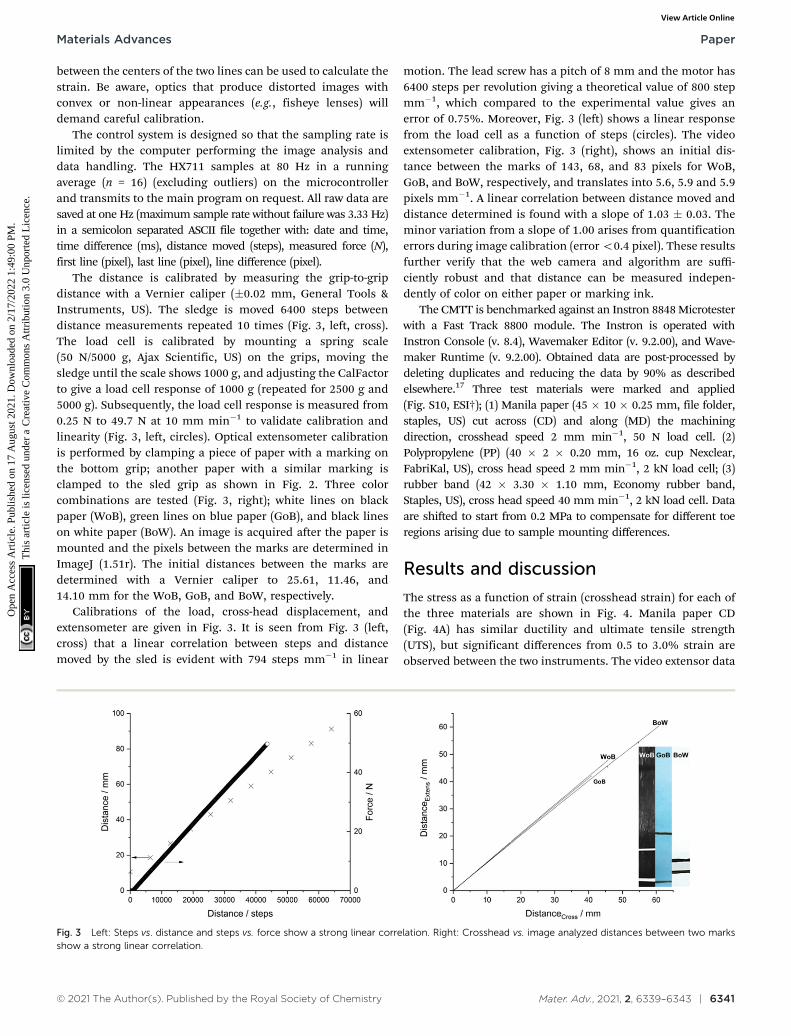
The distance is calibrated by measuring the grip-to-gripdistance with a Vernier caliper (�0.02 mm, General Tools &Instruments, US). The sledge is moved 6400 steps betweendistance measurements repeated 10 times (Fig. 3, left, cross).The load cell is calibrated by mounting a spring scale(50 N/5000 g, Ajax Scientific, US) on the grips, moving thesledge until the scale shows 1000 g, and adjusting the CalFactorto give a load cell response of 1000 g (repeated for 2500 g and5000 g). Subsequently, the load cell response is measured from0.25 N to 49.7 N at 10 mm min�1 to validate calibration andlinearity (Fig. 3, left, circles). Optical extensometer calibrationis performed by clamping a piece of paper with a marking onthe bottom grip; another paper with a similar marking isclamped to the sled grip as shown in Fig. 2. Three colorcombinations are tested (Fig. 3, right); white lines on blackpaper (WoB), green lines on blue paper (GoB), and black lineson white paper (BoW). An image is acquired after the paper ismounted and the pixels between the marks are determined inImageJ (1.51r). The initial distances between the marks aredetermined with a Vernier caliper to 25.61, 11.46, and14.10 mm for the WoB, GoB, and BoW, respectively.
Calibrations of the load, cross-head displacement, andextensometer are given in Fig. 3. It is seen from Fig. 3 (left,cross) that a linear correlation between steps and distancemoved by the sled is evident with 794 steps mm�1 in linear
motion. The lead screw has a pitch of 8 mm and the motor has6400 steps per revolution giving a theoretical value of 800 stepmm�1, which compared to the experimental value gives anerror of 0.75%. Moreover, Fig. 3 (left) shows a linear responsefrom the load cell as a function of steps (circles). The videoextensometer calibration, Fig. 3 (right), shows an initial dis-tance between the marks of 143, 68, and 83 pixels for WoB,GoB, and BoW, respectively, and translates into 5.6, 5.9 and 5.9pixels mm�1. A linear correlation between distance moved anddistance determined is found with a slope of 1.03 � 0.03. Theminor variation from a slope of 1.00 arises from quantificationerrors during image calibration (error o0.4 pixel). These resultsfurther verify that the web camera and algorithm are suffi-ciently robust and that distance can be measured indepen-dently of color on either paper or marking ink.
The CMTT is benchmarked against an Instron 8848 Microtesterwith a Fast Track 8800 module. The Instron is operated withInstron Console (v. 8.4), Wavemaker Editor (v. 9.2.00), and Wave-maker Runtime (v. 9.2.00). Obtained data are post-processed bydeleting duplicates and reducing the data by 90% as describedelsewhere.17 Three test materials were marked and applied(Fig. S10, ESI†); (1) Manila paper (45 � 10 � 0.25 mm, file folder,staples, US) cut across (CD) and along (MD) the machiningdirection, crosshead speed 2 mm min�1, 50 N load cell. (2)Polypropylene (PP) (40 � 2 � 0.20 mm, 16 oz. cup Nexclear,FabriKal, US), cross head speed 2 mm min�1, 2 kN load cell; (3)rubber band (42 � 3.30 � 1.10 mm, Economy rubber band,Staples, US), cross head speed 40 mm min�1, 2 kN load cell. Dataare shifted to start from 0.2 MPa to compensate for different toeregions arising due to sample mounting differences.
Results and discussion
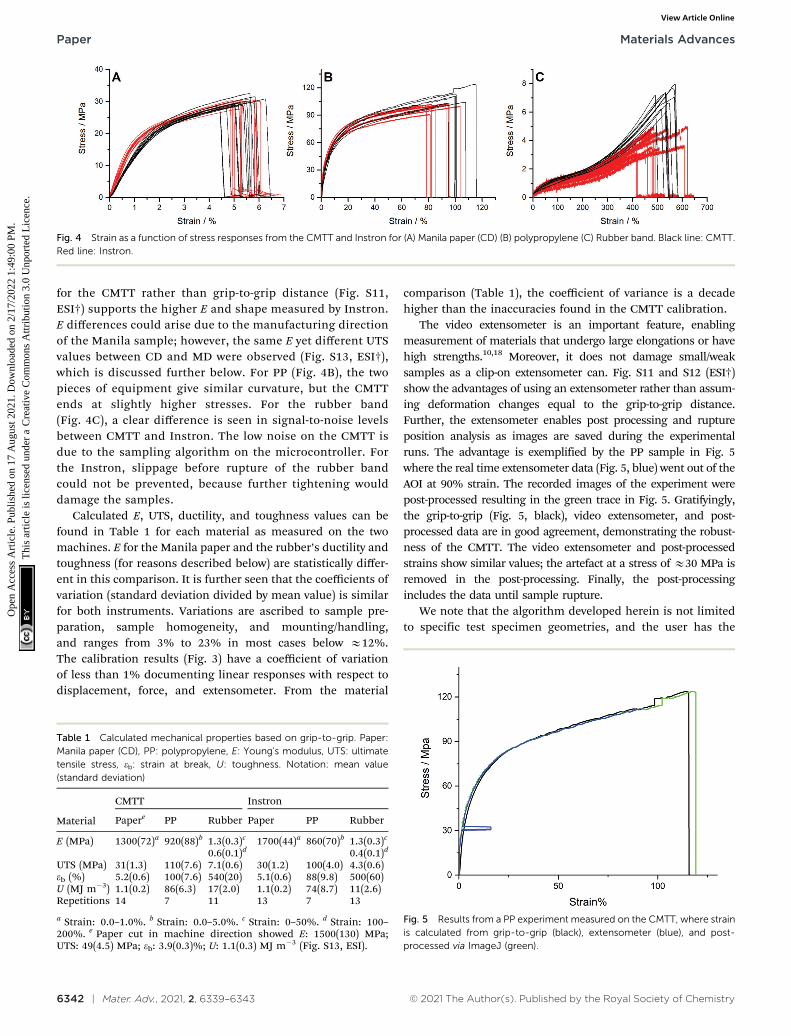
The stress as a function of strain (crosshead strain) for each ofthe three materials are shown in Fig. 4. Manila paper CD(Fig. 4A) has similar ductility and ultimate tensile strength(UTS), but significant differences from 0.5 to 3.0% strain areobserved between the two instruments. The video extensor data
Fig. 3 Left: Steps vs. distance and steps vs. force show a strong linear correlation. Right: Crosshead vs. image analyzed distances between two marksshow a strong linear correlation.
Materials Advances Paper
Ope
n A
cces
s A
rtic
le. P
ublis
hed
on 1
7 A
ugus
t 202
1. D
ownl
oade
d on
2/1
7/20
22 1
:49:
00 P
M.
Thi
s ar
ticle
is li
cens
ed u
nder
a C
reat
ive
Com
mon
s A
ttrib
utio
n 3.
0 U
npor
ted
Lic
ence
.View Article Online
6342 | Mater. Adv., 2021, 2, 6339–6343 © 2021 The Author(s). Published by the Royal Society of Chemistry
for the CMTT rather than grip-to-grip distance (Fig. S11,ESI†) supports the higher E and shape measured by Instron.E differences could arise due to the manufacturing directionof the Manila sample; however, the same E yet different UTSvalues between CD and MD were observed (Fig. S13, ESI†),which is discussed further below. For PP (Fig. 4B), the twopieces of equipment give similar curvature, but the CMTTends at slightly higher stresses. For the rubber band(Fig. 4C), a clear difference is seen in signal-to-noise levelsbetween CMTT and Instron. The low noise on the CMTT isdue to the sampling algorithm on the microcontroller. Forthe Instron, slippage before rupture of the rubber bandcould not be prevented, because further tightening woulddamage the samples.
Calculated E, UTS, ductility, and toughness values can befound in Table 1 for each material as measured on the twomachines. E for the Manila paper and the rubber’s ductility andtoughness (for reasons described below) are statistically differ-ent in this comparison. It is further seen that the coefficients ofvariation (standard deviation divided by mean value) is similarfor both instruments. Variations are ascribed to sample pre-paration, sample homogeneity, and mounting/handling,and ranges from 3% to 23% in most cases below E12%.The calibration results (Fig. 3) have a coefficient of variationof less than 1% documenting linear responses with respect todisplacement, force, and extensometer. From the material
comparison (Table 1), the coefficient of variance is a decadehigher than the inaccuracies found in the CMTT calibration.
The video extensometer is an important feature, enablingmeasurement of materials that undergo large elongations or havehigh strengths.10,18 Moreover, it does not damage small/weaksamples as a clip-on extensometer can. Fig. S11 and S12 (ESI†)show the advantages of using an extensometer rather than assum-ing deformation changes equal to the grip-to-grip distance.Further, the extensometer enables post processing and ruptureposition analysis as images are saved during the experimentalruns. The advantage is exemplified by the PP sample in Fig. 5where the real time extensometer data (Fig. 5, blue) went out of theAOI at 90% strain. The recorded images of the experiment werepost-processed resulting in the green trace in Fig. 5. Gratifyingly,the grip-to-grip (Fig. 5, black), video extensometer, and post-processed data are in good agreement, demonstrating the robust-ness of the CMTT. The video extensometer and post-processedstrains show similar values; the artefact at a stress of E30 MPa isremoved in the post-processing. Finally, the post-processingincludes the data until sample rupture.
We note that the algorithm developed herein is not limitedto specific test specimen geometries, and the user has the
Fig. 4 Strain as a function of stress responses from the CMTT and Instron for (A) Manila paper (CD) (B) polypropylene (C) Rubber band. Black line: CMTT.Red line: Instron.
Table 1 Calculated mechanical properties based on grip-to-grip. Paper:Manila paper (CD), PP: polypropylene, E: Young’s modulus, UTS: ultimatetensile stress, eb: strain at break, U: toughness. Notation: mean value(standard deviation)
Material
CMTT Instron
Papere PP Rubber Paper PP Rubber
E (MPa) 1300(72)a 920(88)b 1.3(0.3)c 1700(44)a 860(70)b 1.3(0.3)c
0.6(0.1)d 0.4(0.1)d
UTS (MPa) 31(1.3) 110(7.6) 7.1(0.6) 30(1.2) 100(4.0) 4.3(0.6)eb (%) 5.2(0.6) 100(7.6) 540(20) 5.1(0.6) 88(9.8) 500(60)U (MJ m�3) 1.1(0.2) 86(6.3) 17(2.0) 1.1(0.2) 74(8.7) 11(2.6)Repetitions 14 7 11 13 7 13
a Strain: 0.0–1.0%. b Strain: 0.0–5.0%. c Strain: 0–50%. d Strain: 100–200%. e Paper cut in machine direction showed E: 1500(130) MPa;UTS: 49(4.5) MPa; eb: 3.9(0.3)%; U: 1.1(0.3) MJ m�3 (Fig. S13, ESI).
Fig. 5 Results from a PP experiment measured on the CMTT, where strainis calculated from grip-to-grip (black), extensometer (blue), and post-processed via ImageJ (green).
Paper Materials Advances
Ope
n A
cces
s A
rtic
le. P
ublis
hed
on 1
7 A
ugus
t 202
1. D
ownl
oade
d on
2/1
7/20
22 1
:49:
00 P
M.
Thi
s ar
ticle
is li
cens
ed u
nder
a C
reat
ive
Com
mon
s A
ttrib
utio
n 3.
0 U
npor
ted
Lic
ence
.View Article Online

© 2021 The Author(s). Published by the Royal Society of Chemistry Mater. Adv., 2021, 2, 6339–6343 | 6343
ability to reprocess the data should something go wrong (i.e.varying light intensities or contrast changes) during the experi-ment. The most common challenges are poor contrast or highstrain rates, which cause the line pigment to spread over alarger area, thus reducing the contrast. Thus, the possibility ofpost-processing the data with a lower threshold will recover themeasurement.
In general, the stress versus strain curves have similar steepslopes at the begin for PP and the expected double plateau forrubbers (Fig. 4). The difference in E for Manila paper measuredon the CMTT and Instron could arise from the productiondirection of the paper. However, as noted above, the result fromthe different paper orientations in Fig. S13 (ESI†) gives thesame E but different UTS for CD and MD, respectively (Table 1).This difference in E (Fig. 4A) is ascribed to bending of thealuminium CMTT frame. For low strength materials (PP andrubber) the data from the CMTT and the commercial Instronare similar or better quality.
The CMTT presented here should enable further customiza-tion for various needs. For example, clamps or supporting padscan be 3D printed to expand the availability and usefulness, orthe electronics and GUI can be combined with a more powerfulload cell together with a more rigid frame (angle brackets, dualmotor actuator, etc.) to support testing of high-strength materi-als such as metals and composites. In addition to tensiletesting on the CMTT, the grips can be modified to enablecompression and three or four point bending tests. The algo-rithm for video analysis can be modified to accommodate thedifferent test tool settings. Testing samples under variousenvironmental conditions can be achieved by addition of, e.g.,a heat chamber, water bath, or placing the CMTT in a glove boxunder inert atmosphere. Finally, the scalable design and thealgorithms can hopefully assist other researchers in exploring,customizing and developing specialized equipment as foundfor in situ SEM19 and TEM20 characterization.
Conclusions
A low cost (B$500) tabletop tensile tester has been demon-strated. All design, electronic, and data handling algorithmsare accessible, customizable, and sourced locally. The perfor-mance is benchmarked against commercial equipment usingManila paper, polypropylene, and rubber; the results are notstatistically different, i.e., high quality data are obtained onthe simple and customizable tensile tester with extensometeradd-on. We believe that these results should spur the con-tinued development of low cost laboratory equipment formaterials characterization, which may reduce bottlenecks inmaterials research.
Author contributions
The manuscript was written through equally contributions ofall authors off which all have approved the final version of themanuscript.
Funding sources
Danish Innovation Foundation (FI No. 5152-00003A), Fulbright,Knud Højgaards Fond, Thomas B. Thriges Fond, AugustinusFonden, Fabrikant P. A. Fiskers Fond, Christian og OttiliaBrorsons Rejselegat, Reinholdt W. Jorck og Hustrus Fond,Dir. Einar Hansen og hustru fru Vera Hansens Fond, Carl ogEllen Hertz’ Videnskabslegat.
Conflicts of interest
There are no conflicts to declare.
Acknowledgements
The authors greatly acknowledge Dr Alan F. Schwartzman foraccess to the Instron at the NanoLab at MIT.
References
1 P. Shieh, W. Zhang, K. E. L. Husted, S. L. Kristufek, B. Xiong,D. J. Lundberg, J. Lem, D. Veysset, Y. Sun, K. A. Nelson,D. L. Plata and J. A. Johnson, Nature, 2020, 583, 542–547.
2 Z. Wang, L. Guo, H. Xiao, H. Cong and S. Wang, Mater.Horiz., 2020, 7, 282–288.
3 M. E. Lamm, L. Song, Z. Wang, M. A. Rahman, B. Lamm,L. Fu and C. Tang, Macromolecules, 2019, 52, 8967–8975.
4 P. Suvannasara, S. Tateyama, A. Miyasato, K. Matsumura,T. Shimoda, T. Ito, Y. Yamagata, T. Fujita, N. Takaya andT. Kaneko, Macromolecules, 2014, 47, 1586–1593.
5 M. A. Hillmyer, Science, 2017, 358, 868–870.6 J. R. Davis, Tensile Testing, ASM International, 2nd edn, 2004.7 ISO 527-(1-5):2012, Int. Organ. Stand.8 P. Hollman, M. Larsson, P. Hedenqvist and S. Hogmark,
Surf. Coat. Technol., 1997, 90, 234–238.9 R. J. Schaefer, in Harris’ Shock and Vibration Handbook, ed.
C. M. Harris and A. G. Piersol, McGraw-Hill, 5th edn, 2002.10 H. B. Motra, J. Hildebrand and A. Dimmig-Osburg, Int.
J. Eng. Sci. Res. Technol., 2014, 17, 260–269.11 K. Miller, J. Biomech., 2001, 34, 651–657.12 J. R. Amend and H. Lipson, Proceedings of the ASME Design
Engineering Technical Conference, American Society of Mechan-ical Engineers Digital Collection, 2011, vol. 6, pp. 685–693.
13 J. H. Arrizabalaga, A. D. Simmons and M. U. Nollert,J. Chem. Educ., 2017, 94, 530–533.
14 R. Wang, N. Leber, C. Buhl, N. Verdonschot, P. J. Dijkstraand M. Karperien, Polym. Adv. Technol., 2014, 25, 568–574.
15 Free Pascal IDE, 2018.16 ITU-R Recommendation BT.601-7, BT Ser.17 M. Hinge and M. L. Henriksen, Open Sci. Framework, 2018,
DOI: 10.17605/OSF.IO/XW9VG.18 D. L. Butler, E. S. Grood, F. R. Noyes, R. F. Zernicke and
K. Brackett, J. Biomech., 1984, 17, 579–596.19 L. Bodelot, L. Pavic, S. Hallais, J. Charliac and B. Lebental,
Sci. Rep., 2019, 9, 1–11.20 K. Nandy, D. W. Collinson, C. M. Scheftic and L. C. Brinson,
PLoS One, 2018, 13, e0197999.
Materials Advances Paper
Ope
n A
cces
s A
rtic
le. P
ublis
hed
on 1
7 A
ugus
t 202
1. D
ownl
oade
d on
2/1
7/20
22 1
:49:
00 P
M.
Thi
s ar
ticle
is li
cens
ed u
nder
a C
reat
ive
Com
mon
s A
ttrib
utio
n 3.
0 U
npor
ted
Lic
ence
.View Article Online