Embed Size (px)
Citation preview

139
A Logistic Regression Model for Personnel SelectionNambury S. RajuIllinois Institute of Technology
Stephen D. SteinhausAmeritech Services, Inc.
Jack E. Edwards
Navy Personnel Research and Development Center
Juyne DeLessioSaint Joseph College of Nursing
A two-parameter logistic regression model forpersonnel selection is proposed. In addition topresenting a theoretical basis for the model, a uni-fied approach is provided for studying selection,validity generalization, employee classification,selection bias, and utility-based fair selection. Thenew model was tested with a large database
(N = 84,808). Results show the logistic regressionmodel to be valid and also quite robust withrespect to direct and indirect range restriction onthe predictor. Index terms: logistic regression, per-sonnel selection, selection bias, utility-based fairselection, validity generalization.
Personnel psychologists are often interested in an applicant’s probability of success for a givenjob. To assess this probability, personnel psychologists traditionally have assumed that a certain trait(e.g., ability, aptitude, or personality trait) is functionally related to the probability of job success,and they have relied almost exclusively on the correlation coefficient to study the relationship. Un-fortunately, for several reasons, a correlation coefficient does not fully express this relationship (Gul-liksen, 1986; Linn, 1978). For example, a correlation coefficient does not result in a statement aboutthe probability of success. Currently, such a statement can only be formulated indirectly with thehelp of Taylor-Russell tables (Taylor & Russell, 1939) if bivariate normality exists between predictorand criterion.An alternative approach to personnel selection is proposed here that directly relates the probabili-
ty of job success to trait levels. This new approach is capable of simultaneously addressing such topicsas selection, validity generalization, employee classification, selection bias, and utility-based fair selec-tion when the probability of success is of primary concern.
.
A Model for Personnel Selection
The criterion (job performance) score and predictor (trait) score will be denoted as y and x, respec-tively. The joint probability density function (PDF) of y and x may then be denoted as H(y,x) and
where H(y 1 x) is the conditional PDF of y given x, and h(x) is the PDF of x. An applicant with y 2: y,,is considered successful, and similarly, anyone with x 2: Xo is selected. In view of these definitions,
Downloaded from the Digital Conservancy at the University of Minnesota, http://purl.umn.edu/93227. May be reproduced with no cost by students and faculty for academic use. Non-academic reproduction
requires payment of royalties through the Copyright Clearance Center, http://www.copyright.com/

140
the probability of success on a job given x [P(x)] can be written as
This equation is not very practical unless the specific form of H(y I x) is known. As a solution tothis problem, P(x) is proposed as a two-parameter logistic regression (LR) function:
where D is a constant that is usually set equal to 1.7 in order to make P(x) correspond to a normalogive, and a and b are the job parameters to be estimated (Lord & Novick, 1968). Unlike Equation2, Equation 3 does not contain yo. However, a person is considered successful if she or he scoresat or above y~. Therefore, Equation 3 also depends on yo, but its dependence is implicit. In Figure1, P(x) represents a job characteristic curve (icc).A JCC is thus comparable to an individual expectancy chart (McCormick & Ilgen, 1980). By defi-
nition (as well as in Figure 1), b is the level of the trait needed in order to have a 50% probabilityof job success, and a is proportional to the slope of the lCC at b. A theoretical justification for P(x)(Equation 3) is given in Appendix A.
Implications of the Proposed Model
Validity Generalization
lCCs are useful for studying validity generalization (VG; Callender & Osburn, 1980; Pearlman,Schmidt, & Hunter, 1980; Raju & Burke, 1983; Schmidt, Gast-Rosenberg, & Hunter, 1980; Schmidt& Hunter, 1977). If the same test is used to predict success on two similar jobs in two different loca-tions, the same a and b values should be expected at both locations. Failure to find approximatelythe same as and bs means that the lCCs are different for the two locations and that validity is
Figure 1An Example of a Job Characteristic Curve
Downloaded from the Digital Conservancy at the University of Minnesota, http://purl.umn.edu/93227. May be reproduced with no cost by students and faculty for academic use. Non-academic reproduction
requires payment of royalties through the Copyright Clearance Center, http://www.copyright.com/
141
not generalizable. This procedure can be extended easily to include more than two locations and differ-ent predictors that are designed to measure the same underlying trait-provided the predictors havecomparable metrics.
Employee Classification
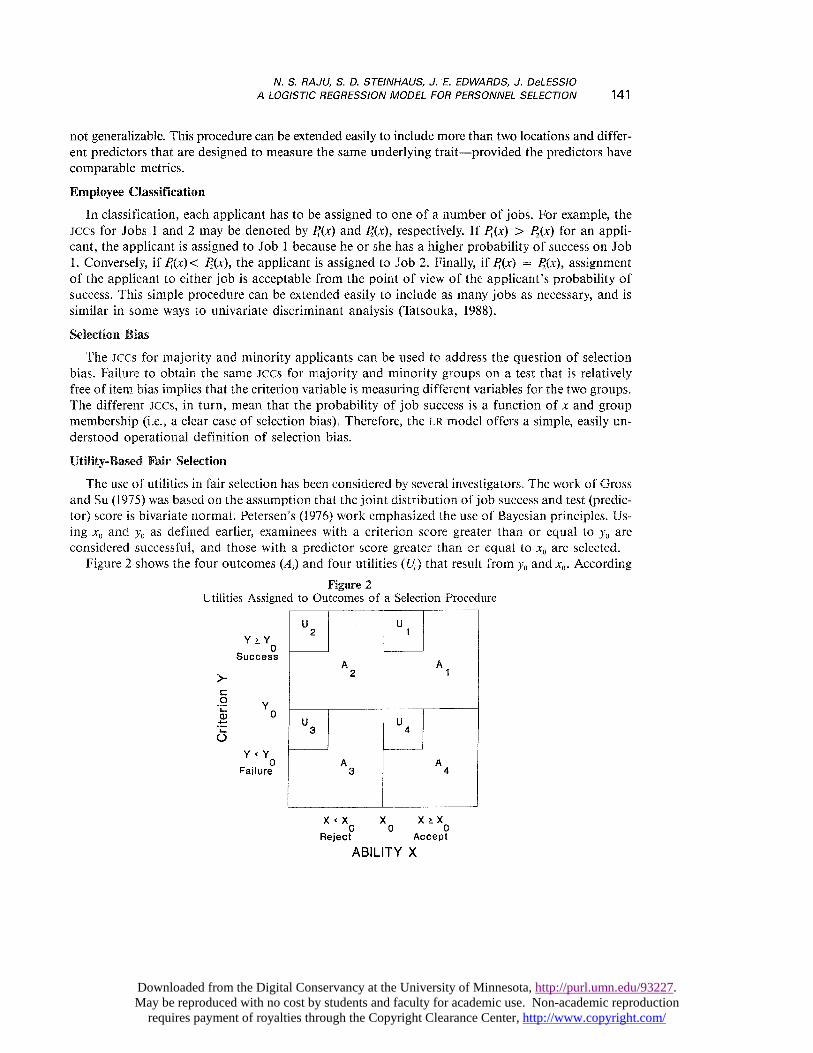
In classification, each applicant has to be assigned to one of a number of jobs. For example, thelCCS for Jobs 1 and 2 may be denoted by J?(x) and P(x), respectively. If P(x) > l§(x) for an appli-cant, the applicant is assigned to Job 1 because he or she has a higher probability of success on Job1. Conversely, if Pl(x)< P(x), the applicant is assigned to Job 2. Finally, if P(x) = P(x), assignmentof the applicant to either job is acceptable from the point of view of the applicant’s probability ofsuccess. This simple procedure can be extended easily to include as many jobs as necessary, and issimilar in some ways to univariate discriminant analysis (Tatsouka, 1988).
Selection Bias
The lCCs for majority and minority applicants can be used to address the question of selectionbias. Failure to obtain the same lCCs for majority and minority groups on a test that is relativelyfree of item bias implies that the criterion variable is measuring different variables for the two groups.The different lCCS, in turn, mean that the probability of job success is a function of x and groupmembership (i.e., a clear case of selection bias). Therefore, the LR model offers a simple, easily un-derstood operational definition of selection bias.
Utility-Based Fair Selection
The use of utilities in fair selection has been considered by several investigators. The work of Grossand Su (1975) was based on the assumption that the joint distribution of job success and test (predic-tor) score is bivariate normal. Petersen’s (1976) work emphasized the use of Bayesian principles. Us-ing x,, and y, as defined earlier, examinees with a criterion score greater than or equal to y~ areconsidered successful, and those with a predictor score greater than or equal to x, are selected.
Figure 2 shows the four outcomes (A,) and four utilities (tl ) that result from y, and x,,. According
Figure 2Utilities Assigned to Outcomes of a Selection Procedure
Downloaded from the Digital Conservancy at the University of Minnesota, http://purl.umn.edu/93227. May be reproduced with no cost by students and faculty for academic use. Non-academic reproduction
requires payment of royalties through the Copyright Clearance Center, http://www.copyright.com/
142
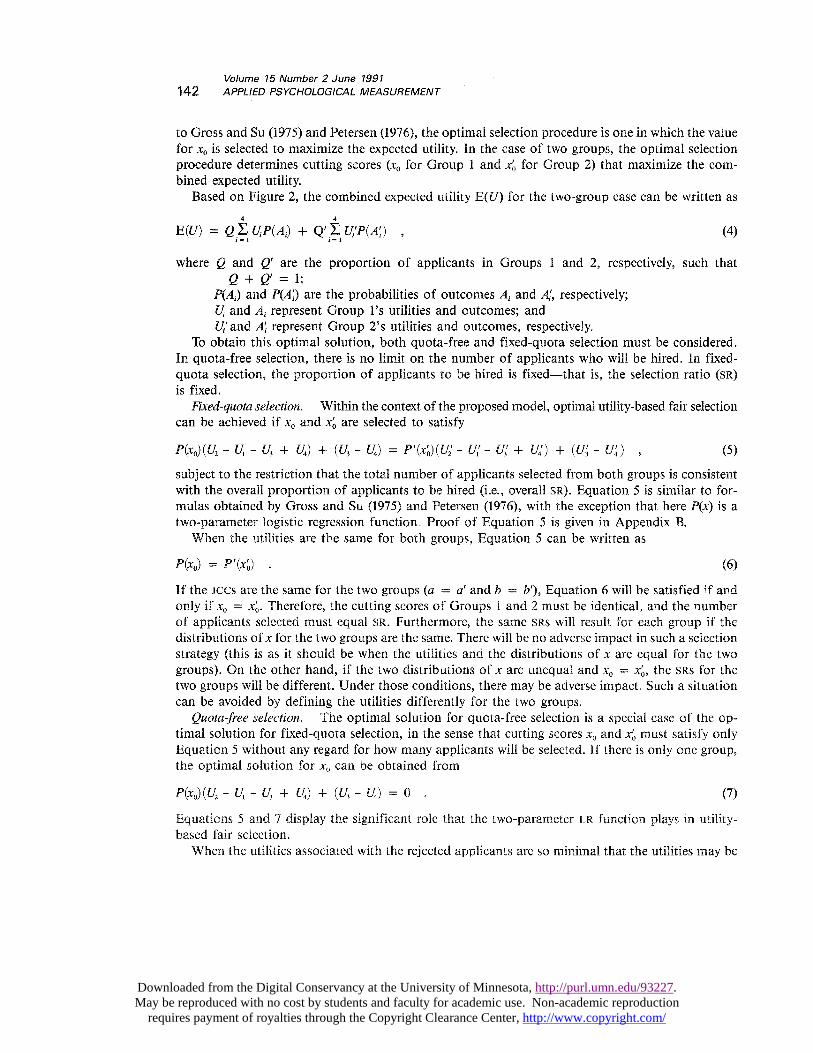
to Gross and Su (1975) and Petersen (1976), the optimal selection procedure is one in which the valuefor xo is selected to maximize the expected utility. In the case of two groups, the optimal selectionprocedure determines cutting scores (xo for Group 1 and xo for Group 2) that maximize the com-bined expected utility.
Based on Figure 2, the combined expected utility E(U) for the two-group case can be written as
where Q and Q’ are the proportion of applicants in Groups 1 and 2, respectively, such thatQ + Q’ = 1;
P(Al) and P(AD are the probabilities of outcomes A; and A,’, respectively;n and A; represent Group 1’s utilities and outcomes; and[1¡’ and A; represent Group 2’s utilities and outcomes, respectively.
To obtain this optimal solution, both quota-free and fixed-quota selection must be considered.In quota-free selection, there is no limit on the number of applicants who will be hired. In fixed-quota selection, the proportion of applicants to be hired is fixed-that is, the selection ratio (SR)is fixed.
Fixed-quota selection. Within the context of the proposed model, optimal utility-based fair selectioncan be achieved if xQ and x’ are selected to satisfy
subject to the restriction that the total number of applicants selected from both groups is consistentwith the overall proportion of applicants to be hired (i.e., overall SR). Equation 5 is similar to for-mulas obtained by Gross and Su (1975) and Petersen (1976), with the exception that here P(x) is atwo-parameter logistic regression function. Proof of Equation 5 is given in Appendix B.When the utilities are the same for both groups, Equation 5 can be written as
If the Jccs are the same for the two groups (a = c~’ and b = b’), Equation 6 will be satisfied if andonly if xo = xo. Therefore, the cutting scores of Groups 1 and 2 must be identical, and the numberof applicants selected must equal SR. Furthermore, the same SRs will result for each group if thedistributions of x for the two groups are the same. There will be no adverse impact in such a selectionstrategy (this is as it should be when the utilities and the distributions of x are equal for the twogroups). On the other hand, if the two distributions of x are unequal and xo = x’, the SRs for thetwo groups will be different. Under those conditions, there may be adverse impact. Such a situationcan be avoided by defining the utilities differently for the two groups.
Quota-free selection. The optimal solution for quota-free selection is a special case of the op-timal solution for fixed-quota selection, in the sense that cutting scores x, and x’ must satisfy onlyEquation 5 without any regard for how many applicants will be selected. If there is only one group,the optimal solution for x, can be obtained from
Equations 5 and 7 display the significant role that the two-parameter LR function plays in utility-based fair selection.When the utilities associated with the rejected applicants are so minimal that the utilities may be
Downloaded from the Digital Conservancy at the University of Minnesota, http://purl.umn.edu/93227. May be reproduced with no cost by students and faculty for academic use. Non-academic reproduction
requires payment of royalties through the Copyright Clearance Center, http://www.copyright.com/
143
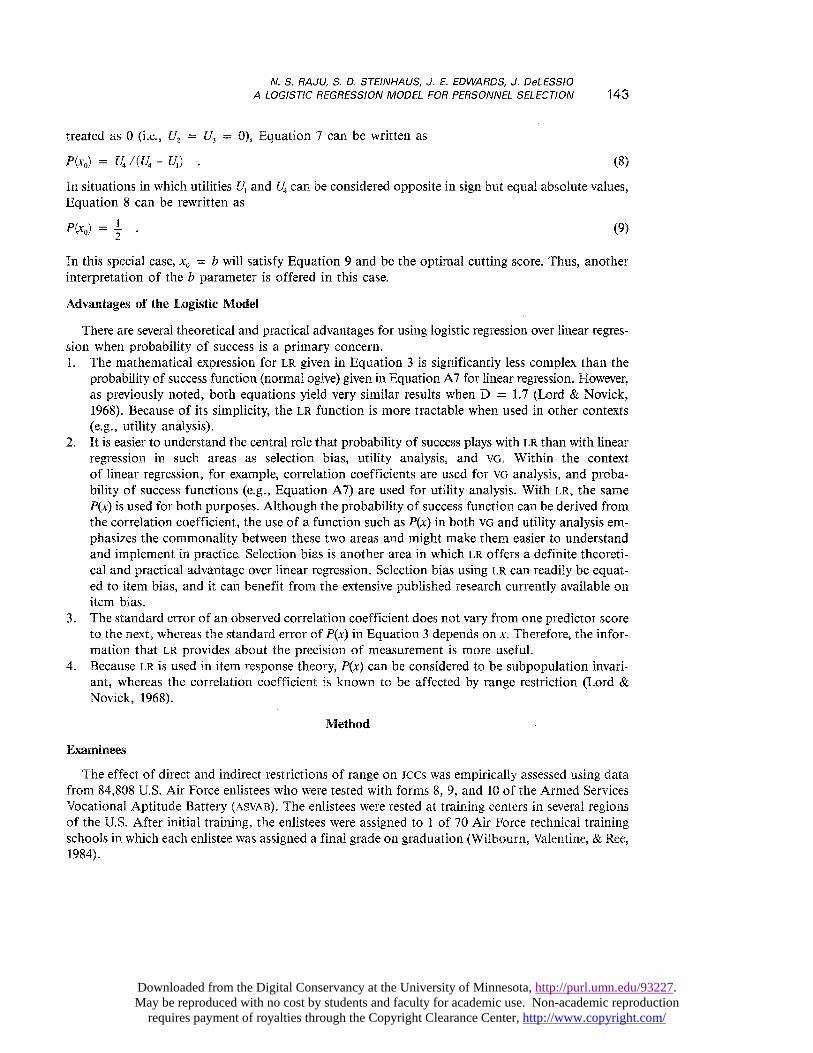
treated as 0 (i.e., U2 = Il3 = 0), Equation 7 can be written as
In situations in which utilities Ul and ~ can be considered opposite in sign but equal absolute values,Equation 8 can be rewritten as
In this special case, x,, = b will satisfy Equation 9 and be the optimal cutting score. Thus, anotherinterpretation of the b parameter is offered in this case.
Advantages of the Logistic Model
There are several theoretical and practical advantages for using logistic regression over linear regres-sion when probability of success is a primary concern.1. The mathematical expression for LR given in Equation 3 is significantly less complex than the
probability of success function (normal ogive) given in Equation A7 for linear regression. However,as previously noted, both equations yield very similar results when D = 1.7 (Lord & Novick,1968). Because of its simplicity, the LR function is more tractable when used in other contexts(e.g., utility analysis).
2. It is easier to understand the central role that probability of success plays with LR than with linearregression in such areas as selection bias, utility analysis, and VG. Within the context
of linear regression, for example, correlation coefficients are used for VG analysis, and proba-bility of success functions (e.g., Equation A7) are used for utility analysis. With LR, the sameP(x) is used for both purposes. Although the probability of success function can be derived fromthe correlation coefficient, the use of a function such as P(x) in both vG and utility analysis em-phasizes the commonality between these two areas and might make them easier to understandand implement in practice. Selection bias is another area in which LR offers a definite theoreti-cal and practical advantage over linear regression. Selection bias using LR can readily be equat-ed to item bias, and it can benefit from the extensive published research currently available onitem bias.
3. The standard error of an observed correlation coefficient does not vary from one predictor scoreto the next, whereas the standard error of P(x) in Equation 3 depends on x. Therefore, the infor-mation that LR provides about the precision of measurement is more useful.
4. Because LR is used in item response theory, F’(x) can be considered to be subpopulation invari-ant, whereas the correlation coefficient is known to be affected by range restriction (Lord &
Novick, 1968).
Method .
Examinees
The effect of direct and indirect restrictions of range on jccs was empirically assessed using datafrom 84,808 U.S. Air Force enlistees who were tested with forms 8, 9, and 10 of the Armed ServicesVocational Aptitude Battery (ASVAB). The enlistees were tested at training centers in several regionsof the U.S. After initial training, the enlistees were assigned to 1 of 70 Air Force technical trainingschools in which each enlistee was assigned a final grade on graduation (Wilbourn, Valentine, & Ree,1984).
Downloaded from the Digital Conservancy at the University of Minnesota, http://purl.umn.edu/93227. May be reproduced with no cost by students and faculty for academic use. Non-academic reproduction
requires payment of royalties through the Copyright Clearance Center, http://www.copyright.com/

144
Variables
ASVAB tests. The ASVAB was originally developed in 1976 around the national mbbilization popu-lation (i.e., males between the ages of 17 and 24). Each of the current forms (8, 9, and 10) was con-structed to be parallel in terms of number-correct scores. Each form contained 10 tests: General Science,Arithmetic Reasoning, Word Knowledge, Paragraph Comprehension, Numerical Operations, Cod-ing Speed, Auto and Shop Information, Math Knowledge, Mechanical Comprehension, and Elec-tronic Information.A composite of four ASVAB tests (called the Armed Forces Qualifying Test) is used to select potential
recruits for all four branches of the U.S. military. The Air Force then uses ASVAB-based aptitude in-dices to select and classify its enlistees for training and military jobs. As a result, the distributionsof test scores for a given technical school may be restricted on one or both ends. Low-scoring en-listees are screened into technical schools with less rigorous standards, and the highest-scoring en-listees are often assigned to technical schools with higher admission standards and a curriculum thatis relatively more difficult.
Final school grade (FSG). ASVAB Forms 8, 9, and 10 were validated using FSGs as the criterion.FSGs may vary for each school from 1 to 99, with a FSG below 70 indicating a failure. No FSG wasrecorded in the enlistee’s file if a failure occurred. Therefore, the distribution of criterion scores wasrestricted, because each of the 84,808 cases used in this study had a FSG.
Procedure
For the purposes of this study, FSGs at or above the 50th percentile (FSG a 84) for the total popu-lation were coded as successful. FSGs less than 84 were considered to be unsuccessful. Math Knowledgeand Mechanical Comprehension test scores and FSGs were used. Some summary data and the inter-correlations between the three measures are presented in Table 1. The Kuder-Richardson 20 estimatesof reliability for the 25-item Math Knowledge and 25-item Mechanical Comprehension tests were.87 and .85, respectively (Wilbourn et al., 1984). The Math Knowledge and Mechanical Comprehen-sion tests were selected for this study because their validities with FSGs (.39 and .31, respectively)were similar to the validity coefficients typically reported in the personnel psychology literature.
Phase 1. Using the dichotomous FSGs as the criterion and the Math Knowledge test as the predic-
Table 1Intercorrelations and Summary Descriptive Statistics for theMath Knowledge (MK) and Mechanical Comprehension
(MC) Tests and the FSG Criterion (N = 84,808)
Downloaded from the Digital Conservancy at the University of Minnesota, http://purl.umn.edu/93227. May be reproduced with no cost by students and faculty for academic use. Non-academic reproduction
requires payment of royalties through the Copyright Clearance Center, http://www.copyright.com/
145
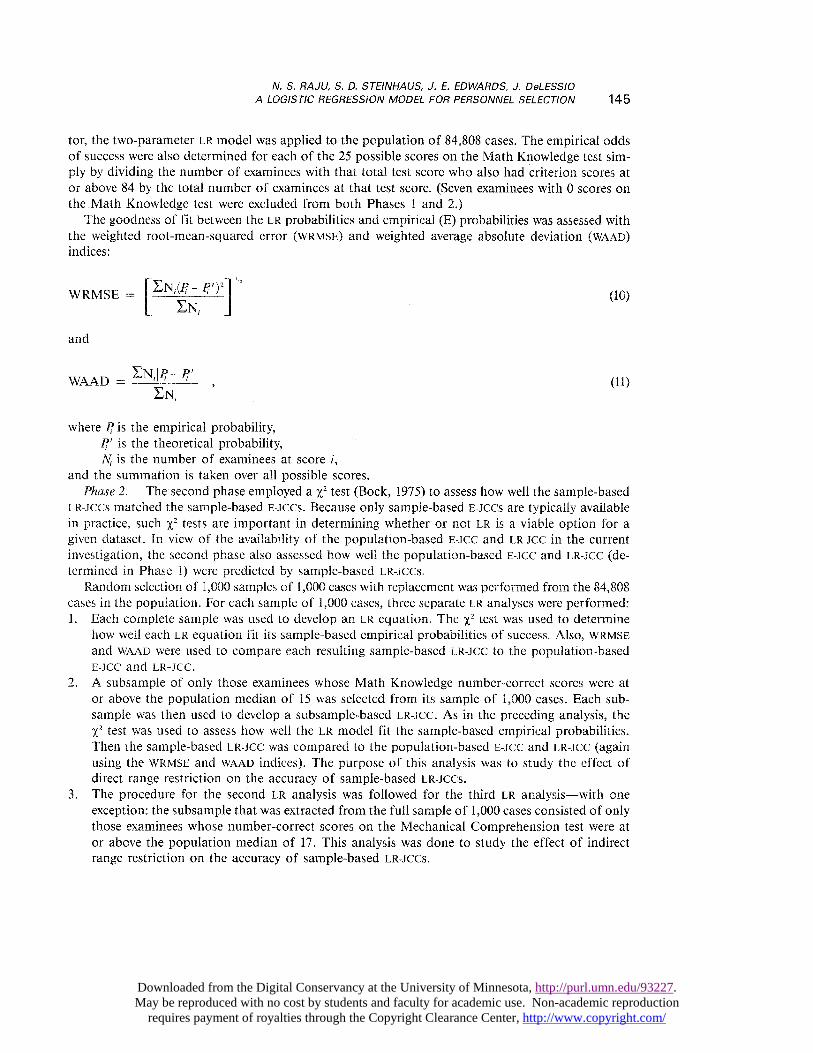
tor, the two-parameter LR model was applied to the population of 84,808 cases. The empirical oddsof success were also determined for each of the 25 possible scores on the Math Knowledge test sim-ply by dividing the number of examinees with that total test score who also had criterion scores ator above 84 by the total number of examinees at that test score. (Seven examinees with 0 scores onthe.Math Knowledge test were excluded from both Phases 1 and 2.)
The goodness of fit between the LR probabilities and empirical (E) probabilities was assessed withthe weighted root-mean-squared error (WRMSE) and weighted average absolute deviation (WAAD)indices:
and
where If is the empirical probability,If’ is the theoretical probability,N is the number of examinees at score i,
and the summation is taken over all possible scores.Phase 2. The second phase employed a XI test (Bock, 1975) to assess how well the sample-based
~,R-JCCS matched the sample-based E-Jccs. Because only sample-based E-Jccs are typically availablein practice, such X2 tests are important in determining whether or not LR is a viable option for agiven dataset. In view of the availability of the population-based E-JCC and LR-JCC in the currentinvestigation, the second phase also assessed how well the population-based E-JCC and LR-JCC (de-termined in Phase 1) were predicted by sample-based LR-JCCS.
Random selection of 1,000 samples of 1,000 cases with replacement was performed from the 84,808cases in the population. For each sample of 1,000 cases, three separate LR analyses were performed:1. Each complete sample was used to develop an LR equation. The X2 test was used to determine
how well each LR equation fit its sample-based empirical probabilities of success. Also, WRMSEand WAAD were used to compare each resulting sample-based LR-JCC to the population-basedE-JCC and LR-JCC.
2. A subsample of only those examinees whose Math Knowledge number-correct scores were ator above the population median of 15 was selected from its sample of 1,000 cases. Each sub-sample was then used to develop a subsample-based LR-JCC. As in the preceding analysis, thexz test was used to assess how well the LR model fit the sample-based empirical probabilities.Then the sample-based LR-JCC was compared to the population-based E-JCC and LR-JCC (againusing the WRMSE and WAAD indices). The purpose of this analysis was to study the effect ofdirect range restriction on the accuracy of sample-based LR-JCCs.
3. The procedure for the second LR analysis was followed for the third LR analysis-with oneexception: the subsample that was extracted from the full sample of 1,000 cases consisted of onlythose examinees whose number-correct scores on the Mechanical Comprehension test were ator above the population median of 17. This analysis was done to study the effect of indirectrange restriction on the accuracy of sample-based LR-JCCS.
Downloaded from the Digital Conservancy at the University of Minnesota, http://purl.umn.edu/93227. May be reproduced with no cost by students and faculty for academic use. Non-academic reproduction
requires payment of royalties through the Copyright Clearance Center, http://www.copyright.com/

146
Results and Discussion
Phase 1. Table 2 shows the observed frequencies of successful and unsuccessful examinees foreach number-correct score on the Math Knowledge test. The LR estimates of a and b were .086 and14.59, respectively. Table 2 also contains the population-based E and LR probabilities of success. Thegreatest difference between the E and LR probabilities occurred for scores from 1 through 6. For ex-ample, that difference was .16 for a score of 4. It should be noted that the number of successfuland unsuccessful examinees at those six points was quite small compared to the frequencies at otherscores. The differences for the highest two scores were also marked by differences greater than .05.In contrast, the greatest difference between empirical and theoretical probabilities was .04 for scoresof 7 through 23. Moreover, the median difference for scores in that middle range was .01.When the overall empirical and theoretical probability difference was examined, the WRMSE and
WAAD indices were .021 and .019, respectively. The .021 WRMSE means that, on average, the E andLR probabilities differed by approximately .02; a similar interpretation applies to the WAAD index.Thus, the magnitudes of the goodness-of-fit indices imply that the two-parameter LR model provid-ed a good fit for the empirical probabilities in the current dataset.
Phase 2. For the no-range-restriction condition, the average x2 between the sample-based LR-icc and the sample-based E-Jcc was 24.90 with degrees of freedom (df ) ranging from a minimumof 19 to a maximum of 22 (see Table 3). Of the 1,000 x2 values, 2% were significant at the .01 level.
. Table 2Observed Frequencies of Successful and Unsuccessful Examinees and Empirical and
Theoretical Probabilities From the Logistic Regression Analysis in Phase 1
(a = .086, b = 14.59, WRMSE = .021, and WAAD = .019)
Downloaded from the Digital Conservancy at the University of Minnesota, http://purl.umn.edu/93227. May be reproduced with no cost by students and faculty for academic use. Non-academic reproduction
requires payment of royalties through the Copyright Clearance Center, http://www.copyright.com/
147
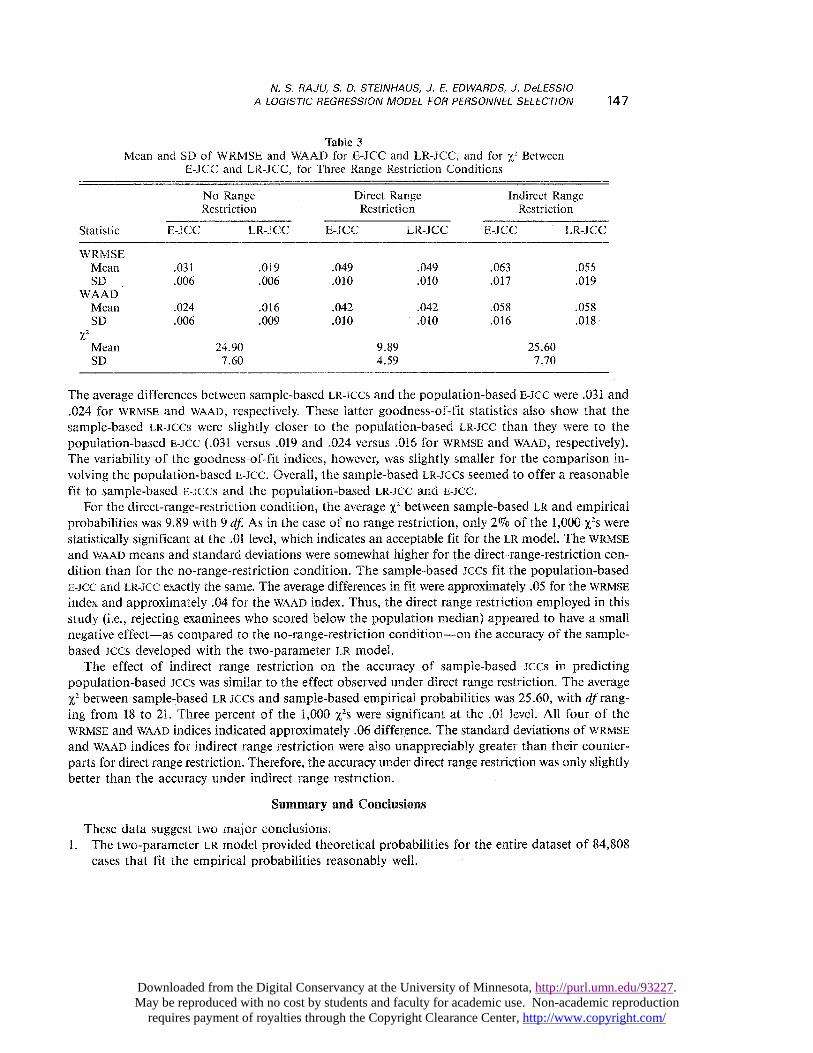
Table 3Mean and SD of WRMSE and WAAD for E-JCC and LR-JCC, and for X2 Between
E-JCC and LR-JCC, for Three Range Restriction Conditions
The average differences between sample-based LR-JCCs and the population-based E-JCC were .031 and.024 for WRMSE and WAAD, respectively. These latter goodness-of-fit statistics also show that thesample-based LR-JCCS were slightly closer to the population-based LR-JCC than they were to thepopulation-based E-JCC (.031 versus .019 and .024 versus .016 for WRMSE and WAAD, respectively).The variability of the goodness-of-fit indices, however, was slightly smaller for the comparison in-volving the population-based E-JCC. Overall, the sample-based ~,R-JCCs seemed to offer a reasonablefit to sample-based E-JCcs and the population-based ~,R-.~cC and E-JCC.
For the direct-range-restriction condition, the average x2 between sample-based LR and empiricalprobabilities was 9.89 with 9 df. As in the case of no range restriction, only 2Vo of the 1,000 x2s werestatistically significant at the .01 level, which indicates an acceptable fit for the LR model. The WRMSEand WAAD means and standard deviations were somewhat higher for the direct-range-restriction con-dition than for the no-range-restriction condition. The sample-based JCCs fit the population-basedE-JCC and LR-JCC exactly the same. The average differences in fit were approximately .05 for the WRMSEindex and approximately .04 for the WAAD index. Thus, the direct range restriction employed in thisstudy (i.e., rejecting examinees who scored below the population median) appeared to have a smallnegative effect-as compared to the no-range-restriction condition-on the accuracy of the sample-based JCCs developed with the two-parameter LR model.
The effect of indirect range restriction on the accuracy of sample-based JCCs in predictingpopulation-based JCCS was similar to the effect observed under direct range restriction. The averagex2 between sample-based LR-Jccs and sample-based empirical probabilities was 25.60, with clf rang-ing from 18 to 21. Three percent of the 1,000 ~Zs were significant at the .01 level. All four of the
WRMSE and WAAD indices indicated approximately .06 difference. The standard deviations of WRMSEand WAAD indices for indirect range restriction were also unappreciably greater than their counter-parts for direct range restriction. Therefore, the accuracy under direct range restriction was only slightlybetter than the accuracy under indirect range restriction.
Summary and Conclusions
These data suggest two major conclusions:1. The two-parameter LR model provided theoretical probabilities for the entire dataset of 84,808
cases that fit the empirical probabilities reasonably well.
Downloaded from the Digital Conservancy at the University of Minnesota, http://purl.umn.edu/93227. May be reproduced with no cost by students and faculty for academic use. Non-academic reproduction
requires payment of royalties through the Copyright Clearance Center, http://www.copyright.com/
148
2. When random samples were used, the fit between sample-based lCCS and population-based lCCScontinued to be good, as measured by the x2 statistic and the WRMSE and WAAD indices. Eventhough the observed percentages of significant x2s were higher than would be expected by chancealone, they did not appear to be excessive for the three conditions: 2% for no- and direct-range-restriction conditions and 3% for indirect-range-restriction conditions. As might be expected,the WRMSE and WAAD indices reflecting the fit of the sample-based Jccs to the population-basedlCCS for the directly and indirectly restricted samples were larger than those obtained for thefull random sample. However, the fit indices for the nonrandom samples may be acceptable.
Overall, the two-parameter LR model appeared to offer a promising alternative to studying the questionof the probability of success in selection.
The results of this study appear to support the proposed model, given three probable limitationsof the dataset. First, the probability of success in all Air Force jobs/training was examined, ratherthan the probability of success for a given family of jobs or technical schools. It may be the casethat training performance in many of the technical schools does not require Mechanical Comprehen-sion, and that to a lesser degree, it does not require Math Knowledge. This research could have beenlimited to those training programs for which the Math Knowledge and Mechanical Comprehensiontests were valid. However, such a study would likely result in a population size significantly smallerthan the 84,808 cases used here.
Second, the standards for the 1 to 99 FSGs may have varied across schools, in addition to the moretypical variability found in industry across raters. Third, the range of criterion scores was truncatedeven in the population. The absence of persons who were truly unsuccessful (FSG < 70) may have,in part, caused some of the differences between the empirical versus the LR-derived probabilities atthe lower score points. It should be noted, however, that the FSG data in Table 1 appear not to reflecta great deal of truncation, which indicates that the failure rate was probably minimal.
Given the success of the model in this study, other issues addressed by the model (i.e., validitygeneralization, employee classification, selection bias, and utility-based fair selection) need to be em-pirically investigated to determine if their theoretical bases hold up as well as the theoretical founda-tion for personnel selection. Furthermore, future studies using the two-parameter LR model of selectionshould pay careful attention to certain considerations.
Samples of 1,000 cases in Phase 2 were used for the no-range-restriction condition. The averagesubsample sizes across 1,000 replications for direct and indirect range restriction were 527 and 565,respectively. However, sample sizes for most validation studies are typically much smaller. Therefore,the question of what constitutes an adequate sample size for reliable estimates of LR-Jccs shouldbe investigated. Large sample sizes were used in the present investigation to test the proposed modelfor personnel selection with samples of adequate size.
The proposed model assumes that there is only one predictor variable. Because the criterion ofjob performance is usually considered to be multidimensional in nature (Smith, 1976), the currentmodel should be expanded to include multivariate logistic regression (Neter & Wasserman, 1974).Such an extension is straightforward, and computer packages such as SAS (1985) and spss-x (1988)can readily handle the data analyses required by the expanded model. An extension of the modelto situations in which the criterion variable is measured on a Likert-type scale is also needed. Same-jima’s (1969) two-parameter model for graded response data is a viable option in this context.
Sample-based lCCs in Phase 2 were compared here to the population-based iccs. Although suchcomparisons are appropriate and desirable, especially in evaluating a new model, the population-based JCCs are typically unavailable in most practical situations. When only sample data are availa-ble, it is essential that the goodness of fit between the sample-based LR-JCC and E-JCC be evaluated
Downloaded from the Digital Conservancy at the University of Minnesota, http://purl.umn.edu/93227. May be reproduced with no cost by students and faculty for academic use. Non-academic reproduction
requires payment of royalties through the Copyright Clearance Center, http://www.copyright.com/
149
statistically-as was done in the current investigation-prior to accepting the sample-based LR-JCC.Just as some observed correlations or validity coefficients may not be significantly different fromzero, the LR procedure may not yield an adequate fit for some datasets. The proposed LR model shouldnot be used if the goodness of fit is inadequate.
In spite of the general favorability of the findings, some caution seems warranted. Any generaliza-tion of the conclusions from this study must take into consideration the fact that both the dichotomi-zation of the FSG criterion and the introduction of direct and indirect range restriction were basedon the median scores for the three variables investigated. The degree to which alternative methodsof determining cutoffs affect the accuracy of the results obtained with the proposed model must stillbe investigated. The effectiveness of the proposed model should also be empirically evaluated withdatasets that are more typical of those encountered in personnel psychology.
Appendix A: Theoretical Justification for P(x)
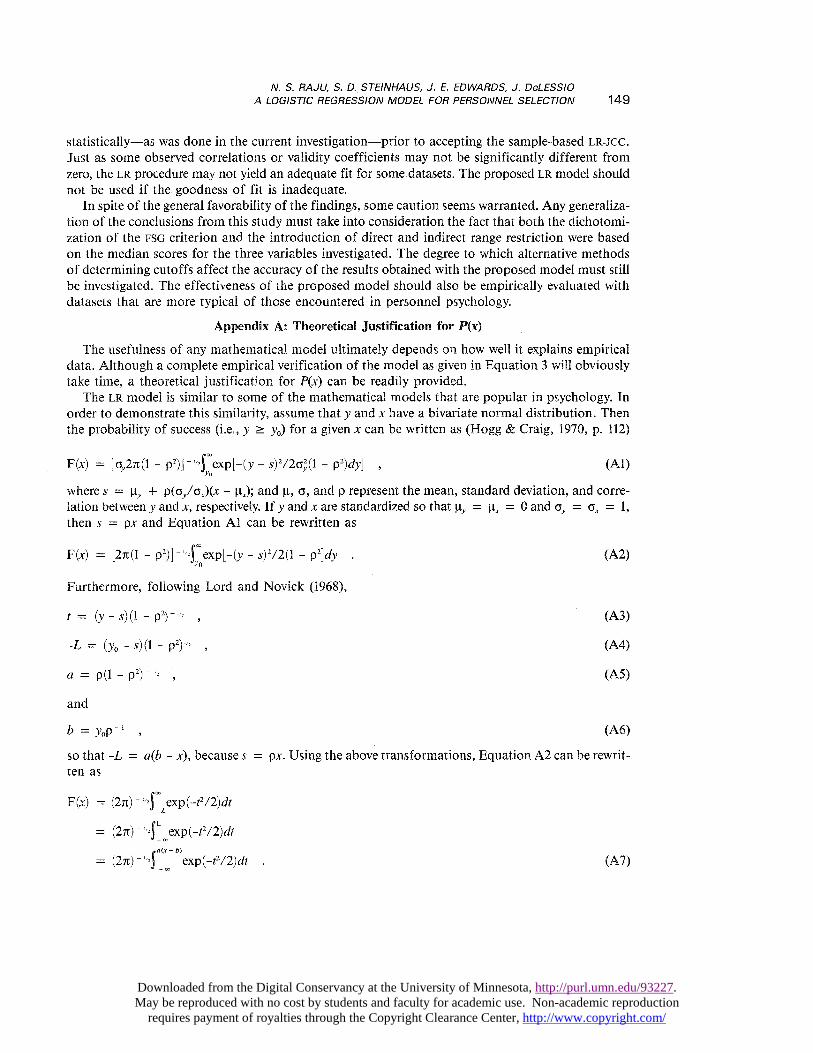
The usefulness of any mathematical model ultimately depends on how well it explains empiricaldata. Although a complete empirical verification of the model as given in Equation 3 will obviouslytake time, a theoretical justification for 1’(x) can be readily provided.
The LR model is similar to some of the mathematical models that are popular in psychology. Inorder to demonstrate this similarity, assume that y and x have a bivariate normal distribution. Thenthe probability of success (i.e., y a yo) for a given x can be written as (Hogg & Craig, 1970, p. 112)
where s = ~,,, + p(6,,/ax)(x - ~J; and ~, a, and p represent the mean, standard deviation, and corre-lation between y and x, respectively. If y and x are standardized so that jj~ = ~.X = 0 and 6y = 6x = 1,then s = px and Equation Al can be rewritten as
Furthermore, following Lord and Novick (1968),
and
so that -L = as - x), because s = px. Using the above transformations, Equation A2 can be rewrit-ten as
Downloaded from the Digital Conservancy at the University of Minnesota, http://purl.umn.edu/93227. May be reproduced with no cost by students and faculty for academic use. Non-academic reproduction
requires payment of royalties through the Copyright Clearance Center, http://www.copyright.com/
150
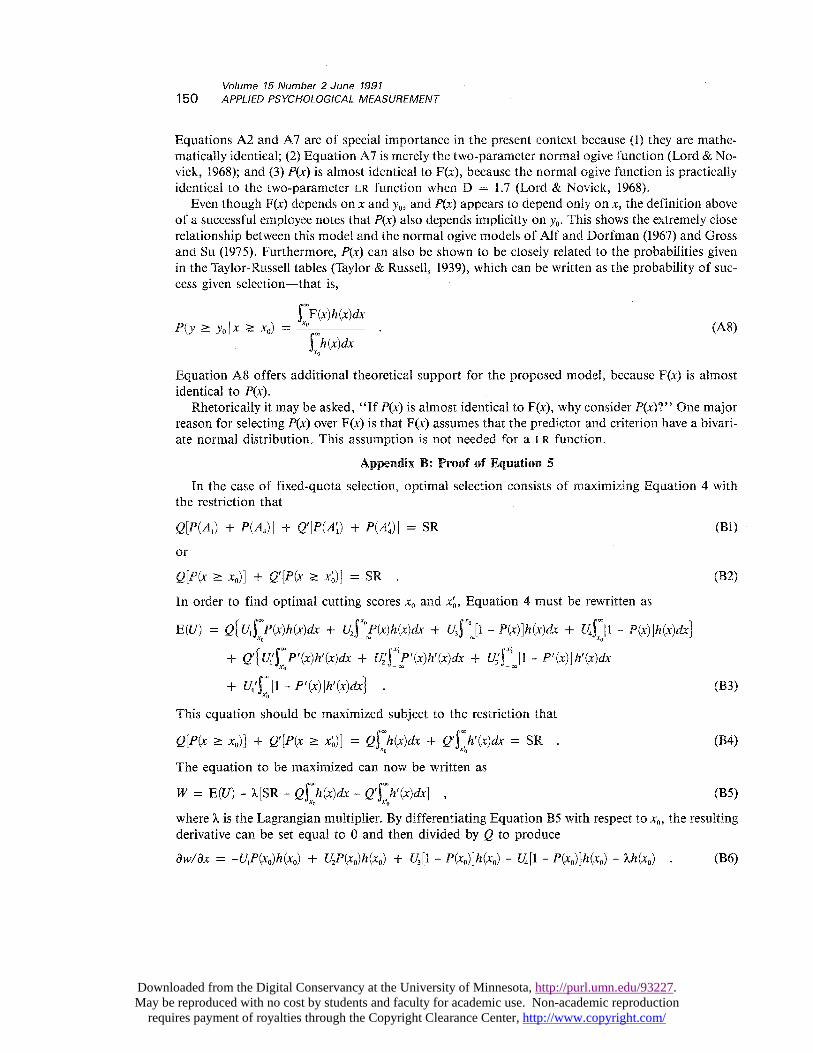
Equations A2 and A7 are of special importance in the present context because (1) they are mathe-matically identical; (2) Equation A7 is merely the two-parameter normal ogive function (Lord & No-
vick, 1968); and (3) 1’(x) is almost identical to F(x), because the normal ogive function is practicallyidentical to the two-parameter LR function when D = 1.7 (Lord & Novick, 1968).
Even though F(x) depends on x and y~, and P(x) appears to depend only on x, the definition aboveof a successful employee notes that P(x) also depends implicitly on y~. This shows the extremely closerelationship between this model and the normal ogive models of Alf and Dorfman (1967) and Grossand Su (1975). Furthermore, P(x) can also be shown to be closely related to the probabilities givenin the Taylor-Russell tables (Taylor & Russell, 1939), which can be written as the probability of suc-cess given selection-that is,
Equation A8 offers additional theoretical support for the proposed model, because F(x) is almostidentical to P(x).
Rhetorically it may be asked, &dquo;If P(x) is almost identical to F(x), why consider P(x)?&dquo; One majorreason for selecting P(x) over F(x) is that F(x) assumes that the predictor and criterion have a bivari-ate normal distribution. This assumption is not needed for a LR function.
Appendix B: Proof of Equation 5
In the case of fixed-quota selection, optimal selection consists of maximizing Equation 4 withthe restriction that
or
In order to find optimal cutting scores x,, and x’, Equation 4 must be rewritten as
This equation should be maximized subject to the restriction that
The equation to be maximized can now be written as
where X is the Lagrangian multiplier. By differentiating Equation B5 with respect to xo, the resultingderivative can be set equal to 0 and then divided by Q to produce
Downloaded from the Digital Conservancy at the University of Minnesota, http://purl.umn.edu/93227. May be reproduced with no cost by students and faculty for academic use. Non-academic reproduction
requires payment of royalties through the Copyright Clearance Center, http://www.copyright.com/

151
A simplification of Equation B6 is
Similarly, differentiating ~V with respect to xo and setting the resulting equation to 0 produces
Eliminating ), from Equations B7 and B8 results in
which is identical to Equation 5. The optimal fixed-quota selection procedure is therefore one in whichthe cutting scores are selected to satisfy Equation B9 subject to the restriction that
References
Alf, E. F., Jr., & Dorfman, D. D. (1967). The classifi-cation of individuals into two criterion groups onthe basis of a discontinuous payoff function. Psy-chometrika, 32, 115-123.
Bock, R. D. (1975). Multivariate statistical methods inbehavioral research. New York: McGraw-Hill.
Callender, J. C., & Osburn, H. G. (1980). Developmentand test of a new model for validity generalization.Journal of Applied Psychology, 65, 543-558.
Gross, A. L., & Su, W. (1975). Defining a fair or un-biased selection model: A question of utilities. Jour-nal of Applied Psychology, 60, 345-351.
Gulliksen, H. (1986). The increasing importance ofmathematics in psychological research (Part 3). TheScore, 9, 1-5.
Hogg, R. V., & Craig, A. T. (1970). Introduction tomathematical statistics. New York: MacMillan.
Linn, R. L. (1978). Single-group validity, differentialvalidity, and differential prediction. Journal of Ap-plied Psychology, 63, 507-512.
Lord, F. M., & Novick, M. R. (1968). Statistical theoriesof mental test scores. Reading MA: Addison-Wesley.
McCormick, E. J., & Ilgen, D. (1980). Industrial psy-chology (7th ed.). Englewood Cliffs NJ:Prentice-Hall.
Neter J., & Wasserman, W. (1974). Applied linearstatistical models. Homewood IL: Irwin.
Pearlman, K., Schmidt, F. L., & Hunter, J. E. (1980).Validity generalization results for tests used to
predict job proficiency and training success in cler-ical occupations. Journal of Applied Psychology, 65,373-406.
Petersen, N. S. (1976). An expected utility model for"optimal selection." Journal of Educational Statis-tics, 2, 333-358.
Raju, N. S., & Burke, M. J. (1983). Two new proce-dures for studying validity generalization. Journalof Applied Psychology, 68, 382-395.
Samejima, F. (1969). Estimation of latent ability usinga response pattern of graded scores. PsychometrikaMonograph Supplement, No. 17.
SAS. (1985). User’s guide: Statistics. Cary NC: SAS In-stitute, Inc.
Schmidt, F. L., Gast-Rosenberg, I. E., & Hunter, J.E. (1980). Test of a new model of validity generali-zation : Results for computer programmers. Jour-nal of Applied Psychology , 65, 643-661.
Schmidt, F. L., & Hunter, J. E. (1977). Developmentof a general solution to the problem of validitygeneralization. Journal of Applied Psychology, 62,529-540.
Smith, P. C. (1976). Behaviors, results, and organiza-tional effectiveness: The problem of criteria. In M.D. Dunnette (Ed.), Handbook of industrial and or-ganizational psychology (pp. 745-775). Chicago IL:Rand-McNally.
SPSS-X. (1988). User’s guide. Chicago IL: SPSS, Inc.Tatsouka, M. M. (1988). Multivariate statistics (2nd ed.).
New York: Macmillan.
Taylor, H. C., & Russell, J. T. (1939). The relationshipof validity coefficients to the practical effectivenessof tests in selection. Journal of Applied Psychology,23, 565-578.
Wilbourn, J. M., Valentine, L. D., & Ree, M. J. (1984).Relationship of the armed services vocational aptitudebattery (ASVAB) forms 8, 9, and 10 to the Air Forcetechnical final school grades (AFHRL-TP-84-8, AD-A144 213). Brooks Air Force Base TX: Manpowerand Personnel Division, Air Force HumanResources Laboratory.
Downloaded from the Digital Conservancy at the University of Minnesota, http://purl.umn.edu/93227. May be reproduced with no cost by students and faculty for academic use. Non-academic reproduction
requires payment of royalties through the Copyright Clearance Center, http://www.copyright.com/

152
Acknowledgments
The authors thank Malcolm Ree and Major Welsh fromthe Human Resources Laboratory at Brooks Air ForceBase, TX, for providing the data used in the present study.The authors also thank the Editor and two anonymousreviewers for their many valuable comments. The opin-ions expressed in this article are those of the authors and
do not necessarily reflect the views of the Navy De-partment.
l~uthor’s Address
Send requests for reprints or further information toNambury S. Raju, Department of Psychology, IllinoisInstitute of Technology, Chicago IL 60616, U.S.A.
Downloaded from the Digital Conservancy at the University of Minnesota, http://purl.umn.edu/93227. May be reproduced with no cost by students and faculty for academic use. Non-academic reproduction
requires payment of royalties through the Copyright Clearance Center, http://www.copyright.com/