Embed Size (px)
Citation preview
A High-throughput Approach for SubcellularProteomeIDENTIFICATION OF RAT LIVER PROTEINS USING SUBCELLULAR FRACTIONATION COUPLED WITHTWO-DIMENSIONAL LIQUID CHROMATOGRAPHY TANDEM MASS SPECTROMETRY ANDBIOINFORMATIC ANALYSIS*
Xiao-Sheng Jiang‡, Hu Zhou‡, Lei Zhang‡, Quan-Hu Sheng‡, Su-Jun Li‡§, Long Li‡,Pei Hao§, Yi-Xue Li§, Qi-Chang Xia‡, Jia-Rui Wu‡, and Rong Zeng‡¶
Four fractions from rat liver (a crude mitochondria (CM)and cytosol (C) fraction obtained with differential centrif-ugation, a purified mitochondrial (PM) fraction obtainedwith nycodenz density gradient centrifugation, and a totalliver (TL) fraction) were analyzed with two-dimensionalliquid chromatography tandem mass spectrometry anal-ysis. A total of 564 rat proteins were identified and werebioinformatically annotated according to their physico-chemical characteristics and functions. While most ex-treme alkaline ribosomal proteins were identified in the TLfraction, the C fraction mainly included neutral enzymesand the PM fraction enriched alkaline proteins and pro-teins with electron transfer activity or oxygen bindingactivity. Such characteristics were more apparent in pro-teins identified only in the TL, C, or PM fraction. TheSwiss-Prot annotation and the bioinformatic predictionresults proved that the C and PM fractions had enrichedcytoplasmic or mitochondrial proteins, respectively.Combination usage of subcellular fractionation with two-dimensional liquid chromatography tandem mass spec-trometry was proved to be a high-throughput, sensitive,and effective analytical approach for subcellular proteom-ics research. Using such a strategy, we have constructedthe largest proteome database to date for rat liver (564 ratproteins) and its cytosol (222 rat proteins) and mitochon-drial fractions (227 rat proteins). Moreover, the 352 pro-teins with Swiss-Prot subcellular location annotation in the564 identified proteins were used as an actual subcellularproteome dataset to evaluate the widely used bioinformat-ics tools such as PSORT, TargetP, TMHMM, and GRAVY.Molecular & Cellular Proteomics 3:441–455, 2004.
The proteome of any cell, tissue, or organism is a complexmixture of proteins that span a wide range of size, relative
abundance, acidity/basicity, and hydrophobicity. The separa-tion of the protein mixture into organelles or other multiproteincomplex fractions prior to a proteomics analysis is usually thefirst step to increase the probability of detecting low-copy-number proteins (1–5). Subcellular fractionation and purifica-tion of organelles provide attractive additions to protein sep-aration techniques commonly used in proteomic analysis.There has been a tendency to focus on subcellular proteomesconcerning specific subcellular compartments and macromo-lecular structures of the cell (6). Subcellular proteomics re-search cannot only provide information about subcellular lo-cation of certain protein and imply its function (2), but also tellus the whole-protein components of the specific subcellularfraction (organelle or other multiprotein complex) (3) and thenhelp understand their structures (4) and biological functions(5).
Chronologically, the most widely used method for the com-plex protein mixtures prior to mass spectrometry (MS)1 anal-ysis is two-dimensional polyacrylamide gel electrophoresis(2D-PAGE) (7–9), followed by enzymatic digestion of the sep-arated protein spots. 2D-PAGE is capable of detecting morethan 10,000 protein spots theoretically (10) and gives valuableadditional information on experimental pI and Mr values of theproteins to help in protein identification (11). Moreover, thevisible separation of protein isoforms on 2D-PAGE gels isoften the result of post-translational protein modifications(12). Although the resolving power of 2D-PAGE is excellent,the identification of individual spot requires a second analyt-ical step such as MS. The extraction, digestion, and analysisof each spot from 2D-PAGE are a tedious and time-consum-ing process. Automation of this process requires expensive
From the ‡Research Center for Proteome Analysis, Key Lab ofProteomics, Institute of Biochemistry and Cell Biology, ShanghaiInstitutes for Biological Sciences, Chinese Academy of Sciences,Shanghai 200031, China; and §Bioinformation Center, Shanghai In-stitutes for Biological Sciences, Chinese Academy of Sciences,Shanghai 200031, China
Received, November 7, 2003, and in revised form, December 20,2003
Published, MCP Papers in Press, January 22, 2004, DOI10.1074/mcp.M300117-MCP200
1 The abbreviations used are: MS, mass spectrometry; 2D-PAGE,two-dimensional polyacrylamide gel electrophoresis; IMP, integralmembrane proteins; MDLC, multidimensional liquid chromatography;2D-LC, two dimensional liquid chromatography; MS/MS, tandemmass spectrometry; DALPC, direct analysis of large protein com-plexes; MudPIT, multidimensional protein identification technology;CM, crude mitochondria; PM, purified mitochondria; C, cytosol; TL,total liver; TM, transmembrane; GRAVY, grand average hydrophobic-ity; GO, Gene Ontology; SCX, strong cation exchange; RP, reversedphase; ER, endoplasmic reticulum.
Research
© 2004 by The American Society for Biochemistry and Molecular Biology, Inc. Molecular & Cellular Proteomics 3.5 441This paper is available on line at http://www.mcponline.org
robotics to cut out and process the spots. The 2D-PAGE hasother limitations, concerning the detection of low-abundanceproteins, hydrophobic proteins, and proteins with extremesize and charge values (9, 13, 14). In particular, the analysis ofintegral membrane proteins (IMPs) remains a critical chal-lenge, although new detergents have been designed to en-hance membrane protein solubility for analysis by 2D-PAGE(15, 16).
An alternative approach to 2D-PAGE, multidimensional liq-uid chromatography (MDLC), has emerged to directly inter-face protein and peptide separations to mass spectrometers.Giddings demonstrated that the overall peak capacity of mul-tidimensional separations is the product of the peak capaci-ties in each independent dimension only if the separationdimensions are orthogonal and components separated in onedimension remain separated in any additional separation di-mension (17). To achieve this criterion, column chromatogra-phy with independent stationary phases has been coupledtogether in different system combinations such as LC-capil-lary electrophoresis or capillary isoelectric focusing-LC (18–21). One strategy employing multidimensional liquid separa-tions for protein identification in protein complexes is directanalysis of large protein complexes (DALPC) (22) by multidi-mensional protein identification technology (MudPIT) (20),which combines MDLC with electrospray ionization tandemmass spectrometry (MS/MS). The MDLC method integrates astrong cation exchange (SCX) resin and a reversed-phaseresin in a biphasic column. This strategy was employed to theproteome of Saccharomyces cerevisiae strain BJ5460 andidentified 1,484 proteins of which 131 have three or morepredicted transmembrane domains (23). Directly identifyingproteins from complexes bypasses the potential limitations ofgel electrophoresis, including protein insolubility, limited frac-tionation ranges, and limited recoveries of material. MudPITwas demonstrated a dynamic range of 10,000 to 1 betweenthe most abundant and least abundant proteins/peptides in acomplex peptide mixture (20). In addition, DALPC provides ahighly automatic system and rapid process for repeated anal-ysis of protein complexes.
Bioinformatics is an integral part of proteomics researchincluding MS data analysis and interpretation, analysis andstorage of the gel images to databases, gel comparison, andadvanced methods to study e.g. protein co-expression, pro-tein-protein interactions, as well as metabolic and cellularpathways (24). With experimentally verified information onprotein function lagging far behind, computational methodsare needed for reliable and large-scale functional annotationof proteins. Prediction of in vivo fates of proteins such asfunction (25), subcellular location (26–29), modification (28),hydrophobicity, and membrane protein structure has becomean even more important theme of bioinformatcs. The PSORTand TargetP programs have been popular tools used forprotein subcellular location prediction. The PSORT programcan localize proteins in 17 different subcellular localizations
(10), with a newer, retrained version called PSORT 2 that usesa slightly different decision algorithm and integrates a numberof pre-existing prediction programs as well as calculatedcharacteristics such as overall amino acid composition withina unified framework (29, 30). The TargetP predictor has morelimited prediction scope than PSORT and only classifies pro-teins to secretory, mitochondrial, chloroplast proteins (forplant only), and others. The method looks for N-terminal sort-ing signals by feeding the outputs from SignalP, ChloroP, andan analogous mitochondrial predictor into a “decision neuralnetwork” that makes the final choice between the differentcompartments (29, 31). The grand average hydrophobicity(GRAVY) values determined according to Kyte and Doolittle(32) provide an image of the hydrophobicity of the wholeprotein. GRAVY values usually vary in the range �2. Positivescores indicate hydrophobicity and negative scores indicatehydrophilicity. The TMHMM program (33) was based on ahidden Markov model and was used to predict the theoreticaltransmembrane (TM) domains. The TMHMM program wasclaimed to predict 97–98% of TM helices correctly and wasapplied to a number of proteome data (33).
The rat is a useful, widely used animal model for biologicaland toxicity studies. Rat liver is one of the most importantorgans involved in physiological, pathological, and toxicolog-ical activities. Proteomic research on rat liver has great sig-nificance. At present, many 2D-PAGE databases of rat liver(34, 35) or its subcellular fractions such as mitochondria (36,37), Golgi complex (38, 39), cytosol (35), nuclear pore com-plex (40), and mitochondrial ribosome (41) have been estab-lished. After 2D-PAGE separation of proteins followed byin-gel enzymatic digestion and MS identification, 113 uniqueproteins were identified from 163 protein spots among 5,222protein spots in 78 2D-PAGE gels for rat liver (34); 273 uniqueproteins were identified from the total liver and cytosolic fra-tions, 20% of which were detected only in the cytosol fraction(35); 192 unique proteins were identified from the mitochon-drial fraction (37); and 47 unique proteins were identified fromthe Golgi complex fraction (39). Though 2D-PAGE separationsproduced hundreds or even thousands of resolved spots, onlya few of them have been correlated to proteins. New strategyshould be applied in proteomics, especially subcellular pro-teomics, research.
In this work, we provided a high-throughput strategy forsubcellular proteomics research: identification of proteinsfrom subcellular fractions using 2D-LC-MS/MS followed bybioinformatics annotation. Such a strategy was applied to ratliver subcellular proteome research. The four fractions fromrat liver: crude mitochondria (CM) and cytosol (C) fractionsobtained with differential centrifugation, a purified mitochon-drial (PM) fraction obtained with nycodenz density gradientcentrifugation, and a total liver (TL) fraction, were analyzedwith 2D-LC-MS/MS analysis. A total of 564 rat proteins wereidentified and bioinformatically annotated according to theirphysicochemical characteristics such as molecular mass, pI,
2D-LC-MS/MS Analysis of Rat Liver Subcellular Fractions
442 Molecular & Cellular Proteomics 3.5
hydrophibicity, and TM domain, subcellular location anno-tated in Swiss-Prot database or predicted by PSORT or Tar-getP, and function family categorized from universal GeneOntology (GO) annotation terms. This strategy has proved tobe a high-throughput, sensitive, effective, and largely unbi-ased analytical approach for subcellular proteomics research.
EXPERIMENTAL PROCEDURES
Materials
Water was prepared using a Milli-Q system (Millipore, Bedford,MA). Nycodenz, formic acid, guanidine hydrochloride, sodium or-thovanadate (Na3VO4), and sodium fluoride (NaF) were obtained fromSigma (St. Louis, MO). Acetonitrile with high-performance LC gradewas obtained from Fisher (Fair Lawn, NJ). Trypsin (sequencing grade)was obtained from Roche (Mannheim, Germany). EDTA, EGTA, andphenylmethylsulfonyl fluoride were purchased from Amresco (Solon,OH). Adult male Sprague-Dawley rats were purchased from ShanghaiLaboratory Animal Center (Jiu-Ting, Shanghai, China).
Differential Centrifugation Separation of Rat LiverSubcellular Fractions
Subcellular fractionation of rat liver was performed according to theprocedure of Ayako and Fridovich (42) with minor modifications.Briefly, Sprague-Dawley rats were sacrificed and the livers werepromptly removed and placed in ice-cold homogenization buffer con-sisting of 200 mM mannitol, 50 mM sucrose, 1 mM EDTA, 0.5 mM
EGTA, and a mixture of protease inhibitor (1 mM phenylmethylsulfonylfluoride) and phosphatase inhibitors (0.2 mM Na3VO4, 1 mM NaF) and10 mM Tris-HCl at pH 7.4. After mincing with scissors and washing toremove blood, the livers were homogenized in a Potter-Elvejhemhomogenizer with a Teflon piston, using 10 ml of the homogenizationbuffer per 2 g of tissue. Centrifugation at successively higher speedsat 4 °C yielded the following fractions: crude nuclear fraction at1,000 � g for 10 min; mitochondria at 15,000 � g for 15 min; andmicrosomes at 144,000 � g for 90 min. The final supernatant was thecytosol fraction. Each successive pellet was washed three times withthe homogenization buffer. The centrifuges used were the Himac CR21G high-speed refrigerated centrifuge and Himac CP 80MX prepar-ative ultracentrifuge, both from Hitachi Koki Co. Ltd. (Tokyo, Japan).
Purification of Rat Liver Mitochondria through Nycodenz DensityGradient Centrifugation
The procedures recommended by Nycomed Pharma and Invitro-gen Life Technologies were followed (42). Nycodenz was dissolved to50% (w/v) in 5 mM Tris-HCl, pH 7.4, containing 1 mM EDTA, 0.5 mM
EGTA and a mixture of protease inhibitor and phosphatase inhibitorsas above. This stock solution was diluted with buffer containing 0.25M sucrose, 5 mM Tris-HCl, and 1 mM EDTA, 0.5 mM EGTA, and amixture of protease inhibitor and phosphatase inhibitors at pH 7.4.The crude mitochondrial pellets obtained from differential centrifuga-tion were suspended in 12 ml of 25% nycodenz and placed on thefollowing discontinuous nycodenz gradients: 5 ml of 34% and 8 ml of30%, and this was topped off with 8 ml of 23% and finally 3 ml of20%. The sealed tubes were centrifuged for 90 min at 52,000 � g at4 °C. The bands of particles seen after centrifugation have beenidentified by Nycomed Pharma and Invitrogen Life Technologies asfollows: nuclei at the 40/50% interface; peroxisomes at the 34/40%interface; mitochondria at the 25/30% interface, lysosomes at the15/20% interface, and Golgi membranes at the 10/15% interface(42). The band at the 25/30% interface was collected and diluted
with the same volume homogenization buffer and then centrifuged at15,000 � g for 20 min.
Protein Preparation
For preparation of the total protein extract of rat liver (TL), rat livertissue (1.0 g) was suspended in 10 ml of lysis buffer consisting of 8 M
urea, 4% 3-[(3-cholamidopropyl)dimethylammonio]-1-propanesul-fonate (CHAPS), 65 mM dithiothreitol, 40 mM Tris. The suspension washomogenized for �1 min, sonicated at 100 W for 30 s, and centri-fuged at 25,000 � g for 1 h. The supernatant contained the TLproteins solubilized in the isoelectric focusing-compatible agents.
For preparation of the mitochondrial fraction, the mitochondriapellets from differential centrifugation (CM) and nycodenz densitygradient purification (PM) were respectively suspended in lysis buffer,sonicated at 100 W for 30 s, and centrifuged at 25,000 � g for 1 h. Thesupernatants were collected as CM and PM fractions.
For preparation of the C fraction, the final supernatant obtainedfrom differential centrifugation separation of rat liver subcellular frac-tions was precipitated overnight with 5� volumes of �20 °C 50:50:0.1 volumes of ethanol:acetone:acetic acid. After being lyophilized todryness, the pellets were dissolved in lysis buffer, sonicated at 100 Wfor 30 s, and centrifuged at 25,000 � g for 1 h. The supernatant wascollected as the C fraction.
The protein concentration was determined by the Bradford assayfor all four fractions (TL, CM, PM, C). Then the four protein sampleswere directly used for 2D-PAGE or 2D-LC-MS/MS after another pre-cipitation and redissolving.
Trypsin Digestion of Each Protein Mixture
Appropriate volumes of protein sample for each fraction wereprecipitated as above, lyophilized to dryness, and redissolved inreducing solution (6 M guanidine hydrochloride, 100 mM ammoniumbicarbonate, pH 8.3) with the protein concentration adjusted to 3�g/�l. Next, 300 �g of protein sample for each fraction with 100-�lvolume was mixed with 1 �l of 1 M dithiothreitol. The mixture wasincubated at 37 °C for 2.5 h and then 5 �l of 1 M iodoacetamide wasadded and incubated for an additional 30 min at room temperature indarkness. The protein mixtures were exchanged into 100 mM ammo-nium bicarbonate buffer, pH 8.5, and incubated with trypsin (50:1) at37 °C overnight.
2D-LC-MS/MS
Orthogonal 2D-LC-MS/MS was performed using a ProteomeXwork station (Thermo Finnigan, San Jose, CA). The system was fittedwith a SCX column (320 �m ID � 100 mm, DEV SCX, ThermoHypersil-Keystone) and two C18 reversed-phase (RP) columns (180�m � 100 mm, BioBasic® C18, 5 �m, Thermo Hypersil-Keystone).The salt steps used were 0, 25, 50, 75, 100, 150, 200, 400, and 800mM NH4Cl synchronized with nine 140-min RP gradients. RP solventswere 0.1% formic acid in either water (A) or acetonitrile (B). Thesetting of the LCQ Deca Xplus ion-trap mass spectrometer is asfollows: one full MS scan was followed by three MS/MS scans on thethree most intense ions from the MS spectrum with dynamicexclusion.
SEQUEST Analysis
The SEQUEST algorithm was used to interpret MS/MS as de-scribed previously (20, 22, 23, 43, 44). Processed tandem massspectra of the four datasets were correlated with the combined hu-man, mouse, and rat database or only the rat database extracted froma nonredundant database comprised of Swiss-Prot, GenPept, andPIR entries and a six-way translation of dbEST downloaded from
2D-LC-MS/MS Analysis of Rat Liver Subcellular Fractions
Molecular & Cellular Proteomics 3.5 443

NCBI on March 1, 2003, using the program SEQUEST running on aDEC Alpha work station (43). SEQUEST results were interpreted usinga conservative criteria set according to Washburn et al. (23) withminor modification. Briefly, all accepted results had a �Cn of 0.1 orgreater, a value shown to lead to high confidence in a SEQUESTresult (43, 44). A singly charged peptide must be tryptic, and thecross-correlation score (Xcorr) had to be at least 1.8. Tryptic orpartially tryptic peptides with a charge state of �2 must have across-correlation score of at least 2.2. Triply charged tryptic or par-tially tryptic peptides with a �3 charge state were accepted if theXCorr was �3.7. When a protein was identified by four or more uniquepeptides possessing SEQUEST scores that passed the above criteria,no visual assessment of spectra was conducted and the protein wasconsidered present in the mixture. When a protein was identified bythree or fewer unique peptides possessing SEQUEST scores thatpassed the above criteria, at least one of SEQUEST results wasvisually assessed using criteria described previously to confirm ordeny the presence of a protein (22, 44). That is to say, proteinidentifications based on mass spectra correlating to one or moreunique tryptic peptides were considered as valid identifications. Sin-gle peptides that alone identify a protein were manually validated aftermeeting the following criteria. First, the SEQUEST cross-correlationscore must be �1.8 for a �1 tryptic peptide or �2.2 for a �2 trypticpeptide or�3.7 for a �3 tryptic peptide. Second, the MS/MS spec-trum must be of good quality with fragment ions clearly above base-line noise. Third, there must be some continuity to the b or y ionseries. Fourth, the y ions that correspond to a proline residue shouldbe intensive ions. Fifth, unidentified, intense fragment ions eithercorresponds to �2 fragment ions or the loss of one or two aminoacids from one of the ends of the peptide. After going through thisprocess, we are fairly confident of protein identification.
Bioinformatics Annotation Tools
The theoretical pI and molecular mass values of proteins weredefined by program pepstats (www.hgmp.mrc.ac.uk/Software/EM-BOSS). The protein subcellular location annotation was from Swiss-Prot and TrEMBL protein database (us.expasy.org/sprot/). TheGRAVY values were determined according to Kyte and Doolittle (32).The PSORT (psort.nibb.ac.jp/form2.html) (29, 30) and TargetP (ww-w.cbs.dtu.dk/services/TargetP/) (29, 31) tools were used to predictprotein subcellular location. The TMHMM (www.cbs.dtu.dk/services/TMHMM/) (33) was used to predict protein TM domains. The proteinfunction family was categorized according to GO annotation terms(45) extracted by InterPro (www.ebi.ac.uk/interpro/) (46).
RESULTS
High-throughput Identification of Rat Liver Proteins with2D-LC-MS/MS
The MS/MS spectra acquired from equivalent normalizedaliquots of the four respective subcellular fractions weresearched against the combined human, mouse, and rat non-redundant database or rat database extracted from Swiss-Prot, GenPept, and PIR entries and a six-way translation ofdbEST using the program SEQUEST running on a DECA workstation. Table I shows the results using different database andXcorr filters, which indicates the database and Xcorr filterscould affect the search results significantly. In order to avoidfalse-positive hits, first we used data only from rat database toeliminate the low confidence of identification resulted from thenonspecificity of the database; second, we referred to theparameters reported in previous studies and applied morestrict criteria for peptide identification (�1.8 for �1 trypticpeptide, �2.2 for �2 tryptic peptide, and �3.7 for �3 trypticpeptide) than those in most reported work (22, 47); third, wemanually checked the mass spectra of the identified peptidesusing different filters, which showed the current criteria couldgive good quality of the MS/MS spectra. This resulted inhighly confident identification of a total of 564 unique ratproteins (2,042 unique peptides) in the four fractions. Ofthese, 350 proteins (1,130 unique peptides) were character-ized in the TL fraction, 267 proteins (796 unique peptides) inthe CM fraction, 222 proteins (661 unique peptides) in the Cfraction, and 227 proteins (901 unique peptides) in the PMfraction (Table I). At the same time, 46 proteins were charac-terized in all the four fractions and 93 proteins were onlycharacterized in the TL fraction, 53 only in the C fraction, 55only in the CM fraction, and 61 only in the PM fraction (Fig.1A). Compared with the TL fraction, the subcellular fraction-ation (C, CM, and PM) provided additional identification of 214(37.9%) proteins. Table II shows the number of proteins iden-tified according to 1, 2, 3, and �3 unique peptides. About50% proteins in each fraction were identified from a uniquepeptide in a single run with 300 �g of proteins, consistent with
TABLE IPeptides and proteins identified in rat liver subcellular fractions using 2D-LC-MS/MS against different databases and Xcorr filters
FractionXcorr �1.8 (�1), 2.2 (�2), 3.7 (�3); �Cn �0.1 Xcorr �1.5 (�1), 2.0 (�2), 2.5 (�3); �Cn �0.1
Total peptides Unique peptides Unique proteins Total peptides Unique peptides Unique proteins
Rat protein databaseC 3,989 661 222 5,451 1,050 453CM 2,449 796 267 3,671 1,236 542PM 4,633 901 227 5,933 1,143 314TL 4,617 1,130 350 5,450 1,289 420Total 15,689 2,042 564 20,505 3,044 1,118
Human, mouse, and rat protein databaseC 4,938 1,040 692 7,847 2,360 1,803CM 7,292 1,419 775 11,124 3,076 2,131PM 5,650 1,258 579 7,707 1,974 1,097TL 5,045 1,352 767 7,059 2,088 1,278Total 22,925 3,261 1,816 33,737 7,192 4,979
2D-LC-MS/MS Analysis of Rat Liver Subcellular Fractions
444 Molecular & Cellular Proteomics 3.5
the previous study (48) in which 40–60% proteins were iden-tified according to a single peptide. The following bioinfor-matic analysis showing the good consistence of the experi-mental data and theoretical data also proved the confidence
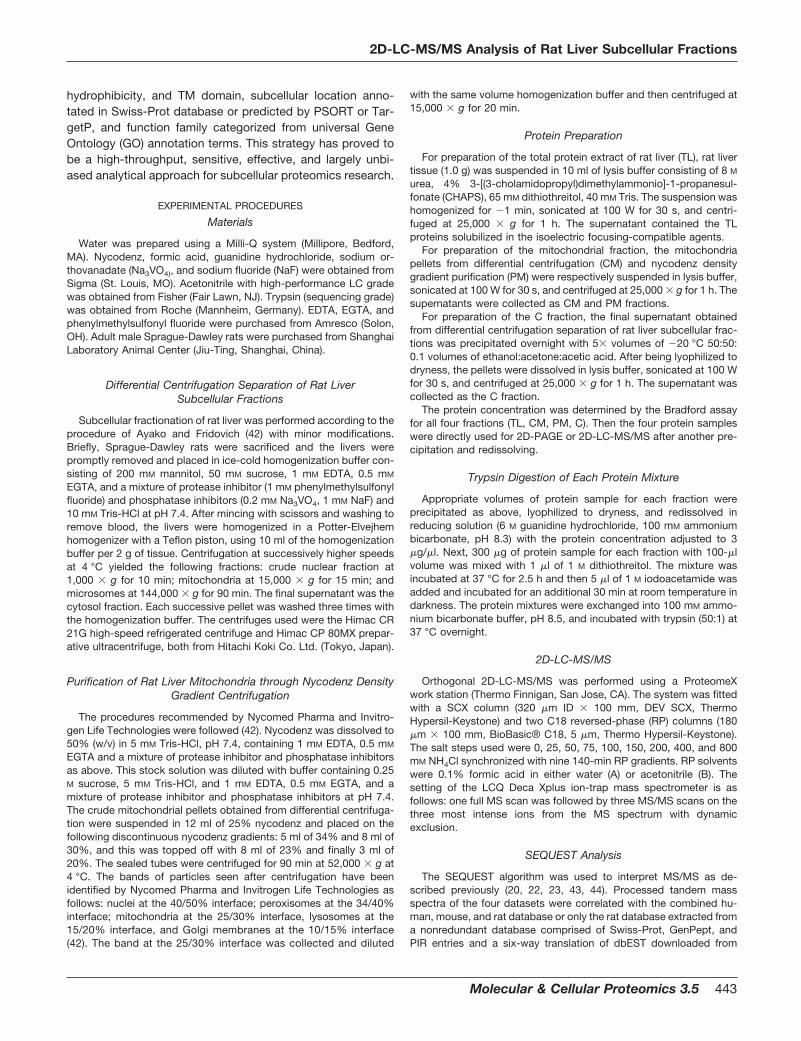
of the protein identification using current identification filtersand criteria. It is noted that most of the proteins identified bya single peptide are also only found in a certain fraction, whichindicates those proteins are low-abundant components in thecell and enriched after fractionation. On the other hand, pro-teins identified by �3 unique peptides account for 56% in thecommon proteins found in all fractions, which should behigh-abundant proteins (Table II). Only 300 �g of proteinswere loaded for 2D-LC-MS/MS, and only data from single runof 22 h were used in this work. The 564 proteins present thelargest database of rat liver proteome so far. Fig. 1, B and Cpresent the distribution of various physicochemical charac-teristics and functions of the 564 proteins. Compared with thetraditional 2D-PAGE method, the 2D-LC-MS/MS strategy pre-sents a number of data with very rapid speed and limitedsample consumption. Most importantly, the heart of “omics”is based on the large datasets. This shotgun assay we usedovercomes the low yields of unique gene products identifiedin 2D-PAGE resulting from multiple spots corresponding to asingle gene product (35, 37), which can provide large-scaleand extensive data for further bioinformatic analysis and eval-uation of the subcellular fractionation in our work.
Physicochemical Characteristics of the Identified Proteins
The 564 identified proteins were classified according todifferent physicochemical characteristics such as molecularmass, pI, hydrophobicity (GRAVY value), and TM domainpredicted by TMHMM. The protein distribution patterns of thefour fractions were compared with the results from the abovecharacteristics (Fig. 2).
In the present work, more proteins with molecular massabove 100 kDa and below 10 kDa were observed than using2D gel separation. The smallest and the largest molecularmass obtained are 1.3 kDa and 532.0 kDa, respectively. Forthe 564 proteins, 419 (74.3%) proteins distribute among10�60-kDa molecular mass intervals, which are compatiblewith general 1D-PAGE or 2D-PAGE, while there are 18 (3.2%)proteins with mass �10 kDa and 48 (8.5%) proteins withmass �100 kDa, beyond the general 1D-PAGE or 2D-PAGEseparation limits (Fig. 2A). It is more interesting that in theproteins only found in a certain fraction, the proteins withmass �10 kDa and �100 kDa are dramatically increased,which indicate those proteins also are low-abundant compo-nents and enriched after fractionation.
Regarding the pI distribution, the 564 proteins distributeacross a wide pI range (3.6�12.3). A total of 493 proteins(87.4%) distribute among pI 4�10 intervals but 14 (2.5%)proteins have pI � 4.3 and 65 (11.5%) proteins have pI � 10,also beyond the 2D-PAGE separation capability. Interestingly,the pI distribution patterns are very different within the fourrespective fractions (Fig. 2B). The TL fraction has a similar pIdistribution pattern to the total 564 proteins, most of whichdistribute among pI 4–9 except for a higher percentage
FIG. 1. A total of 564 rat proteins identified from the fourfractions of rat liver. A shows the percentage of the proteinsidentified from the each fraction and overlapping of different frac-tions. For example, TL represents the proteins identified only in theTL fraction; TL/C means in TL and C fractions but not in CM or PMfractions; TL/C/CM indicates in TL, C, and CM fractions but not inthe PM fraction, TL/C/CM/PM means in all the four fractions. Bpresents sensitivity to a wide variety of protein classes. The barsindicate the percentage of proteins identified in this study from avariety of protein classes. C indicates the functional classification of372 of the 564 identified proteins according to GO annotationterms.
2D-LC-MS/MS Analysis of Rat Liver Subcellular Fractions
Molecular & Cellular Proteomics 3.5 445

(15.4%) of proteins with pI � 10. Nearly half (44.2%) of theproteins identified in the C fraction distribute among pI 6–8intervals. On the contrary, among the proteins identified in thePM fraction, 93 (41.0%) proteins are within pI 8�10 and 17(7.5%) proteins have pI � 10.
Fig. 2B also shows the pI distribution of proteins only foundin different fractions. Most of the proteins only identified in theC fraction distributed in the pI 5�8 interval, consistent withthe traditional 2D-PAGE separation. Thirty-six of 93 (38.7%)proteins with pI � 10 only identified in the TL fraction are thelargest part of the TL-only proteins, while no protein with pI �
10 was detected in C-only proteins. On the other hand, thereare 7.3% and 8.2% components with pI � 10 found in CM-only and PM-only proteins, while PM has more proteins in pI8–10 than other fractions, especially proteins in pI 8–9. Thesubcellular fractionation enriched alkaline proteins (pI 8–10) inthe CM and PM fractions, and PM has such a pI pattern moretypically than the CM fraction. By the following subcellularlocation annotation, it is observed that about 90% of riboso-mal proteins have theoretical pI � 10 and contribute to thehigh percentage of proteins with pI � 10 in the TL fraction (seeTable V). About 50% of annotated mitochondria proteins aretheoretically in pI 8–10, consistent with the pI patterns of thePM fraction (see Table V).
The proteins detected in 2D-PAGE gels are generally hy-drophilic, thus with negative GRAVY values (35, 49). For the564 proteins we identified, their GRAVY values vary in therange of –2.04��0.72. Sixty-five (11.5%) proteins have pos-itive values. Additionally, more proteins with GRAVY value�–0.25 have been identified in the PM (55.1%) or CM (52.4%)fractions than in the C (46.8%) or TL (43.4%) fractions (Fig.2C). For the theoretical TM domains predicted by TMHMM, 70(12.4%) proteins of the total 564 proteins have one or morepredicted TM domain (Fig. 1B), of which 11 proteins havethree or more TM domains (Table III). In particular, eight of the11 proteins with three or more TM domains are all annotatedas IMPs, which mainly identified in the CM or PM fractions.Accordingly, more proteins with one or more TM domain wereidentified in the CM (17.2%) and PM (11.8%) fractions than inthe TL (9.4%) and C (4.0%) fractions (Fig. 2D). As expected,
more hydrophobic and TM components appear in C, CM, andPM-only proteins because they should be low-abundant pro-teins as well.
Subcellular Location Annotation
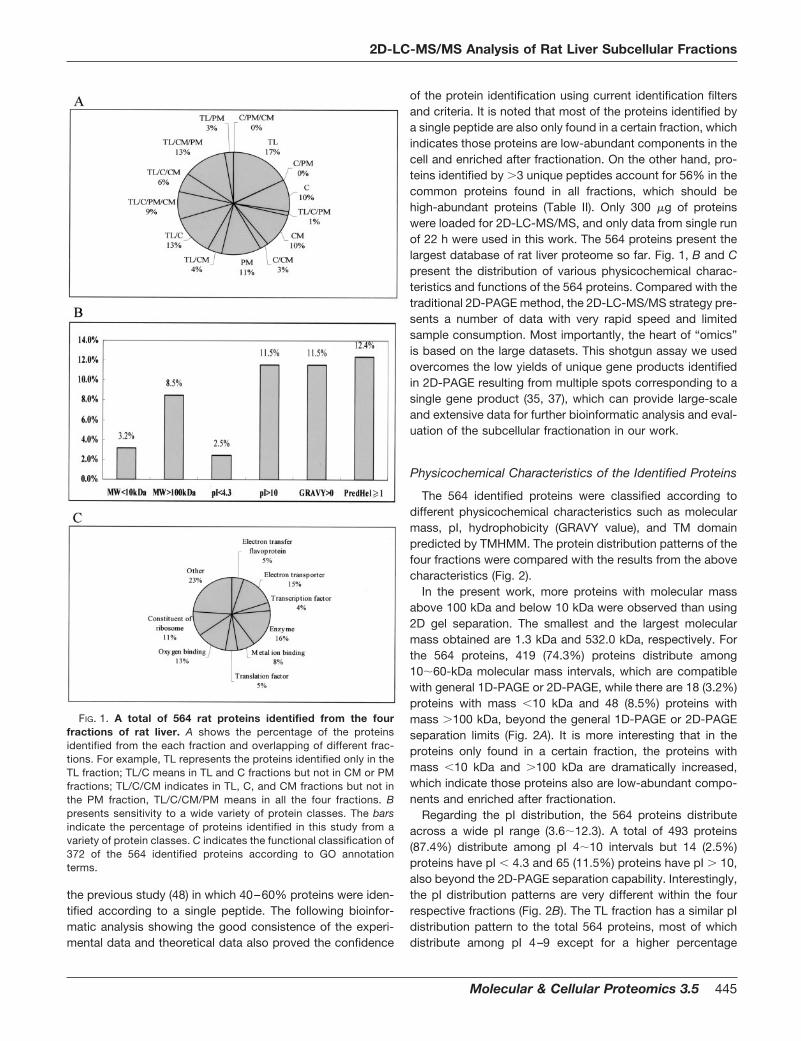
Swiss-Prot Annotation—About 62.4% (352/564) of the 564proteins obtained subcellular annotation results in the Swiss-Prot database. Eighty-two (23.3%) were located as cytoplas-mic, 78 (22.2%) as mitochondrial, 44 (12.5%) as ribosomal, 16(4.5%) as nuclear, and 57 (16.2%) as membrane proteins(including organellar membrane proteins) (Fig. 3A; Table IV).
In 240 TL fraction proteins with Swiss-Prot annotation, 57(23.8%) were annotated as cytoplasmic, 51 (21.3%) as mito-chondrial, 43 (17.9%) as ribosomal, and 12 (5.0%) as nuclear.One hundred twenty-nine C fraction proteins have subcellularlocation annotation, including 66 (51.2%) cytoplasmic pro-teins, 17 (13.2%) mitochondrial proteins, and 3 (2.3%) nuclearproteins. For the PM fraction, 150 proteins have subcellularlocation annotation, including 14 (9.3%) cytoplasmic proteins,74 (49.3%) mitochondrial proteins, and 4 (2.7%) nuclear pro-teins. As expected, cytoplasmic proteins are mainly identifiedin the C and TL fractions, and 94.9% (74/78) of the mitochon-drial proteins appear in the PM fraction. Many proteins anno-tated as endoplasmic reticulum (ER), peroxisomal, Golgi, ly-sosomal, and nuclear were also included in the CM fractionbut apparently decreased in the PM fraction. Most of theribosomal proteins locate on the ER, which was separatedfrom the cytoplasmic fraction in this work by density gradientcentrifugation. Therefore, few ribosomal proteins were de-tected in the cytoplasmic fraction, and almost all the riboso-mal proteins (43/44) were identified only in the TL fraction(Tables IV and V).
PSORT Prediction—In this work, PSORT was used to pre-dict the subcellular location of the total 564 proteins. Predic-tion results indicated that the total of 564 proteins includes54.6% cytoplasmic, 12.9% mitochondrial, and 8.7% extracel-lular proteins. However, the C fraction includes more cyto-plasmic proteins (65.3%) than the TL (576.1%), CM (48.7%),and PM (48.5%) fractions, while the PM fraction includes
TABLE IIProteins identified in rat liver subcellular fractions according to different number of unique peptides
UniquePeptides Totala
Fraction
TLb Cb CMb PMb TL/C/CM/PMc TL-onlyd C-onlyd CM-onlyd PM-onlyd
1 265 (47.0%) 164 (46.9%) 107 (48.2%) 145 (54.3%) 104 (45.8%) 9.75 (21.2%) 67 (72.0%) 45 (84.9%) 46 (83.6%) 46 (75.4%)2 100 (17.7%) 67 (19.1%) 28 (12.6%) 41 (15.4%) 44 (19.4%) 5.25 (11.4%) 20 (21.5%) 5 (9.4%) 7 (12.7%) 11 (18.0%)3 49 (8.7%) 33 (9.4%) 28 (12.6%) 24 (9.0%) 14 (6.2%) 5.25 (11.4%) 4 (4.3%) 2 (3.8%) 2 (3.6%) 2 (3.3%)�3 150 (26.6%) 86 (24.6%) 59 (26.6%) 57 (21.4%) 65 (28.6%) 25.75 (56.0%) 2 (2.2%) 1 (1.9%) 0 (0.0%) 2 (3.3%)Total 564 350 222 267 227 46 93 53 55 61a A total of 564 proteins identified in the four TL, C, CM, and PM fractions. The peptides attributed to the identification of certain protein in
different fractions were combined to calculate the unique peptides.b Proteins identified in certain fraction.c Proteins identified in all four TL, C, CM, and PM fractions. The protein numbers or percentages according to different unique peptides were
calculated as the average of the numbers or percentages for the four different fractions.d Proteins identified only in the TL, C, CM, or PM fractions.
2D-LC-MS/MS Analysis of Rat Liver Subcellular Fractions
446 Molecular & Cellular Proteomics 3.5

FIG. 2. Distribution of the proteins identified from different fractions in relation to their theoretical molecular mass (A), pI (B), GRAVY(C) values, and the number of predicted helices (PredHels) (D). TL-only, C-only, CM-only, or PM-only represents the proteins identified onlyin the TL, C, CM, or PM fractions; TL/C/CM/PM represents the proteins identified in all the four fractions. The bars indicate the percentage ofproteins in certain fractions.
2D-LC-MS/MS Analysis of Rat Liver Subcellular Fractions
Molecular & Cellular Proteomics 3.5 447

more mitochondrial proteins (25.6%) than the TL (14.3%), C(9.5%), and CM (14.6%) fractions (Fig. 3B).
TargetP Prediction—The total of 564 proteins includes20.7% mitochondrial, 17.6% secreted, and 61.7% other pro-teins predicted by TargetP (Fig. 3C). In accordance with theSwiss-Prot subcellular annotation and PSORT prediction re-sults, the TargetP prediction results indicated that the PMfraction included twice as many mitochondrial proteins(40.5%) as the TL fraction (19.1%) and the CM fraction(22.5%) and three times as many as the C fraction (12.2%). Inaddition, the CM fraction has more secreted proteins (29.6%)than other fractions (PM 18.1%, TL 15.4%, C 9.0%), whichmight resulted from contamination of the Golgi complex andER that are involved in the synthesis, maturation, and traffic ofthe secreted proteins.
Evaluation of the Bioinformatics Tools Using the 352Proteins with Swiss-Prot Annotation as a Test Dataset
It has been reported that TargetP has a sensitivity of 0.89and a specificity of 0.67 while PSORT has a sensitivity of 0.81and a specificity of 0.60 for mitochondrial protein prediction ina non-plant test dataset (31). However, many problems areinvolved in the prediction (27), and it is questionable whetherthe efficiency still holds when applied to proteome data (28).To evaluate the separation and purification effect and predic-tion efficiency, the 352 proteins with subcellular location an-notation in the Swiss-Prot database are used as a test datasetfor analyzing the sensitivity and specificity of subcellular frac-tionation and those predictors for separating or predictingcytoplasmic, mitochondrial, membrane, and ribosomal pro-teins. The results are shown in Table V. In this simple actualtest dataset, TargetP has a sensitivity of 0.71 and a specificityof 0.66 for mitochondrial protein prediction while PSORT hasa sensitivity of 0.45 and a specificity of 0.66 for mitochondrialprotein prediction and a sensitivity of 0.71 and a specificity of0.31 for cytoplasmic protein prediction. The values impliedthat the two tools had been overestimated. But surprisingly,
the combination usage of TargetP and PSORT has a highspecificity up to 0.86 for mitochondrial protein prediction. Theseparation and purification effect is again shown when com-pared to the sensitivity and specificity of a different fraction forexamining cytoplasmic, mitochondrial, membrane, or riboso-mal proteins (Table V). It is excitingly to find the PM fractionhas a high sensitivity up to 0.95 for examining the mitochon-drial proteins with specificity of 0.49, which indicates that thePM fraction has a lowered complexity and provides morespecific mitochondrial proteins.
Only 54% membrane proteins have one or more TM helicespredicted by TMHMM. But eight proteins with three or moreTM helices are all annotated as IMPs, which mainly identifiedin CM or PM fractions. So, when with three or more TMhelixes predicted by TMHMM, a protein would be intensivelyindicated as an IMP (Table III). Typically, 99% of cytoplasmicproteins have no TM domain predicted by TMHMM, and 89%of cytoplasmic proteins have a GRAVY value �0.
Functional Annotation
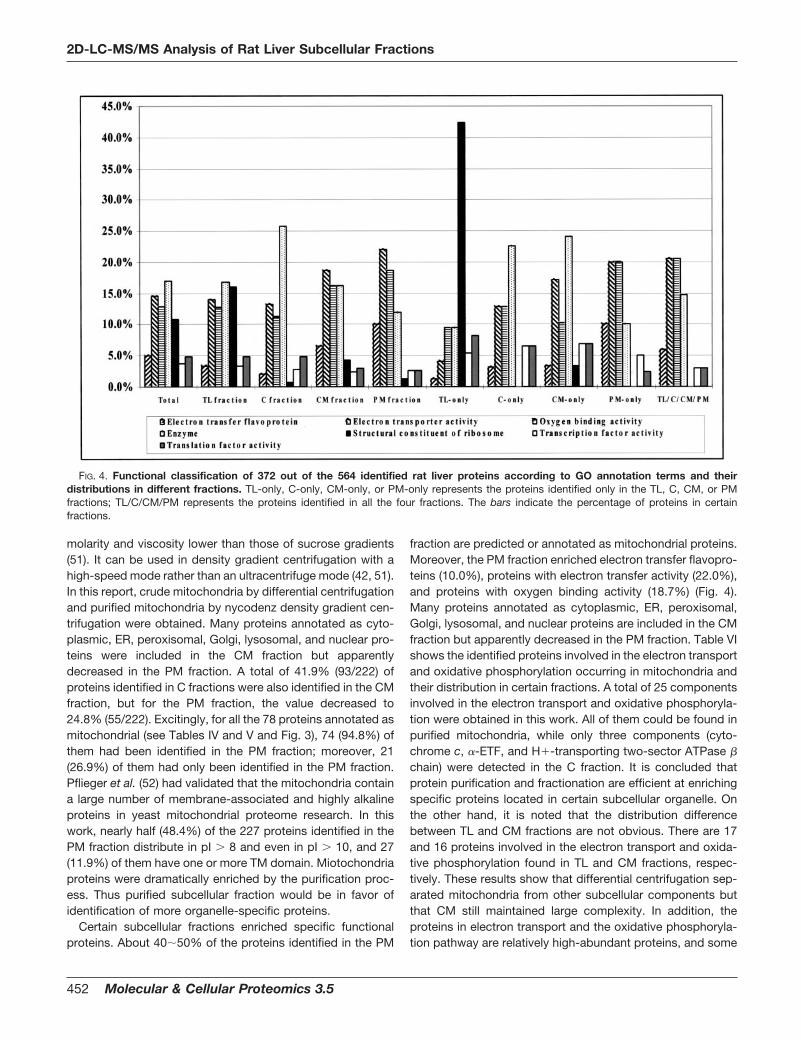
The identified proteins were functionally categorized basedon universal GO annotation terms (45). Three hundred seven-ty-two (66.0%) of the identified proteins were mapped to atleast one annotation term within the GO molecular functioncategory, including 19 (5.1%) electron transfer flavoproteins,54 (14.5%) proteins with electron transfer activity, 48 (12.9%)proteins with oxygen binding activity, 40 (10.8%) ribosomeconstituent proteins, 62 (16.7%) proteins with enzyme activ-ity, 28 (7.5%) proteins with metal ion binding activity, 14(3.8%) proteins with transcription factor activity, and 19(5.1%) proteins with translation factor activity (Fig. 1C). ThePM fraction enriched electron transfer flavoproteins (10.0%),proteins with electron transfer activity (22.0%), and proteinswith oxygen binding activity (18.7%), while the C fractionenriched more metabolic enzymes (Fig. 4). In each fraction-only protein, the functional classification presents more spec-ificity. In the TL-only fraction, ribosomal proteins are the major
TABLE IIIProteins identified with three or more transmembrane helices predicted by TMHMM
Protein PredHel GRAVYMolecular
mass(kDa)
pISwiss-Prot subcellular
location annotationSubcellular
fraction
Q62959 3 –0.170 130.8 6.1 Type I membrane protein CMP16970 3 –0.149 75.3 9.6 IMP, peroxisomal PM, CMI56573 4 0.006 36.1 9.9 NA CMQ07066 4 0.410 22.6 10.7 IMP, peroxisomal PMNP_113930 4 –0.183 108.3 7.8 NA CQ05962 4 0.035 33.0 10.3 IMP, mitochondrial inner
membranePM, TL
AAA99161 6 –0.070 132.2 7.2 NA CMQ9QX01 6 –0.066 87.6 8.0 IMP CMQ63269 7 –0.259 304.3 6.5 IMP, ER CP31647 10 0.430 69.9 7.0 IMP C, TLO70594 11 0.420 62.6 7.8 IMP TL
2D-LC-MS/MS Analysis of Rat Liver Subcellular Fractions
448 Molecular & Cellular Proteomics 3.5
part (42.5%). As before mentioned, ribosomal proteins locatein the ER, which was contained in the TL fraction but removedin the C fraction. On the other hand, several ribosomal pro-teins can be found in the CM-only fraction and none found inthe PM-only fraction. The CM fraction was from primary pu-rification by differential centrifugation, in which may contain
the ER component and thus are mixed with ribosomal pro-teins. After density gradient centrifugation, the ER componentwas removed more completely, resulting in none of the ribo-somal constituents that were detected in the PM-only pro-teins. In the C-only proteins, enzymes occupy the greatestnumber. After differential centrifugation, the CM-only fraction
FIG. 3. Subcellular location distribution patterns of different fractions according to Swiss-Prot annotations (A), PSORT predictionresults (B), and TargetP prediction results (C). TL-only, C-only, CM-only, or PM-only represents the proteins identified only in the TL, C, CM,or PM fractions; TL/C/CM/PM represents the proteins identified in all the four fractions. The bars indicate the percentage of proteins in certainfractions.
2D-LC-MS/MS Analysis of Rat Liver Subcellular Fractions
Molecular & Cellular Proteomics 3.5 449

still includes many enzyme proteins, whose coverage (24.1%)is even more than that of the whole CM fraction (16.3%) andC-only fraction (22.6%). The CM fraction may be contami-nated with ER and lysosome (as shown in Table IV), whichcontain many enzymes. After density gradient centrifugation,the enzyme proteins decrease obviously, while electron trans-fer flavoproteins, proteins with electron transfer activity andproteins with oxygen binding activity become the major partsof the PM-only proteins. These observations indicate that the2D-LC-MS/MS provide a fast and direct strategy to evaluatethe results of subcellular fractionation and assess the purity ofeach faction.
DISCUSSION
In our study, we first combined the differential centrifuga-tion, nycodenz density gradient centrifugation, and 2D-LC-MS/MS. Only one run of 2D-LC-MS/MS analysis of the tryp-sin-digested peptide mixtures from 300 �g of protein (which isfar lower than the usual 1�2 mg of protein loaded in prepar-ative 2D-PAGE gels) was performed for the four fractions (TL,C, CM and PM). With the strict and widely accepted SE-QUEST criterion and only the rat protein database, a total of564 unique rat proteins were identified in the four fractions, ofwhich 350 proteins were characterized in the TL fraction, 222proteins in the C fraction, and 227 proteins in the PM fraction(Table I). Although the number of proteins identified from all oreach rat liver fraction in our study are far from the theoreticalprotein number of rat liver, which may have suffered from alimited protein database for rat compared with those of hu-man and mouse, we have established the largest proteome
database for rat liver and its cytosol and mitochondrial frac-tions at the present time. Compared with 2D-PAGE-MS or1D-PAGE-LC-MS/MS, 2D-LC-MS/MS showed improved au-tomation and high-throughput (24, 26, 50).
Our strategy appears to give an overall understanding ofproteins in rat liver or their subcellular fractions, with littlerestrictions on the molecular mass, pI, hydrophobicity, andeven membrane proteins. The proteins detected in 2D-PAGEgels are in general hydrophilic with negative GRAVY values(35, 49). For the 170 proteins identified by Fountoulakis et al.(35) from 2D-PAGE gels of rat liver, only 14 proteins had lowpositive GRAVY values (below 0.21). In our study, 65 (11.5%)hydrophobic proteins with GRAVY value �0 (up to 0.72) wereidentified. Without specific methods for enrichment or treat-ment of membrane proteins, we still identified 70 (12.4%)proteins from the total of 564 proteins having one or morepredicted TM domain in which 11 proteins have three or moreTM domains (Fig. 1B). In particular, eight of the 11 proteinswith three or more TM domains are almost all known IMPsmainly identified in the CM or PM fraction (Table III). On thecontrary, in the 170 proteins identified in rat liver or its cytosolsample through 2D-PAGE (35), only one protein with three TMdomains has been identified. Furthermore, the 352 proteinswith Swiss-Prot subcellular location annotation were used asan actual subcellular proteome dataset to evaluate the widelyused bioinformatics tools for protein subcellular location predic-tion such as PSORT, TargetP, TMHMM, and GRAVY values.The sensitivity and specificity for each prediction tool mighthave been overevaluated previously according to our results.
Nycodenz is an iodinated density gradient media with os-
TABLE IVSubcellular annotation in Swiss-Prot of proteins identified from different fractions
Swiss-Prot location TotalFraction
TL C CM PM TL-only C-only CM-only PM-only TL/C/CM/PM
Cytoplasmic 82 57 66 32 14 7 14 6 1 8Cytoplasmic/nuclear 5 3 3 0 0 2 2 0 0 0Cytoplasmic/peroxisomal 2 1 2 1 0 0 1 0 0 0Cytoplasmic/secreted/lysosomal 1 1 1 0 0 0 0 0 0 0Cytoplasmic/secreted/membrane 1 1 0 1 0 0 0 0 0 0Cytoskeltal 14 11 8 3 3 4 2 0 1 1Endoplasmic reticulum 30 23 4 25 18 2 1 3 2 3Extracellular 5 3 0 4 1 1 0 2 0 0Golgi complex 3 0 2 1 0 0 2 1 0 0Lysosomal 10 1 0 9 4 0 0 6 1 0Membrane 19 11 7 6 5 4 1 3 4 0Mitochondrial 78 51 17 45 74 1 1 0 21 13Mitochondrial/cytoplasmic 2 1 1 1 2 0 0 0 1 1Mitochondrial/cytoplasmic/nuclear 1 1 1 1 1 0 0 0 0 1Mitochondrial/ER/peroxisomal 2 1 0 1 2 0 0 0 1 0Mitochondrial/cytoplasmic/peroxisomal 1 1 1 1 1 0 0 0 0 1Nuclear 16 12 3 4 4 8 0 1 2 1Peroxisomal 17 6 2 15 13 0 0 3 2 2Proteosome 2 1 0 1 0 1 0 1 0 0Ribosome 44 43 1 7 2 35 0 1 0 0Secreted 11 9 7 9 5 0 0 1 0 2Vesicle 6 2 3 3 1 0 2 2 0 0Proteins with annotation 352 240 129 170 150 65 26 30 36 33Total proteins 564 350 222 267 227 93 53 55 61 46
2D-LC-MS/MS Analysis of Rat Liver Subcellular Fractions
450 Molecular & Cellular Proteomics 3.5

TAB
LEV
Eva
luat
ion
ofth
eef
ficie
ncy
ofsu
bce
llula
rfr
actio
natio
nan
dP
SO
RT,
Targ
etP
,an
dTM
HM
Mp
red
ictio
nus
ing
the
352
pro
tein
sw
ithS
wis
s-P
rot
anno
tatio
nas
ate
std
atas
et
Test
dat
aset
Sub
cellu
lar
frac
tion
Met
hod
sof
pre
dic
tion
Mol
ecul
arm
ass
(kD
a)p
IP
SO
RT
Targ
etP
PS
OR
T/Ta
rget
PTM
HM
M(P
red
Hel
s)a
GR
AV
Yva
lue
Pro
tein
sw
ithS
wis
s-P
rot
anno
tatio
nT
LC
CM
PM
Cyt
o.b
Mit
o.c
Mit
o.
Mit
o.
0>
1>
2>
3<
0>
0<
2020
�60
60�
100
>10
0<
66�
88�
10>
10
Pro
tein
sin
test
dat
aset
352
240
129
170
150
186
5383
3730
151
188
312
4069
210
4924
9210
795
58
Cyt
opla
smic
8257
6632
1458
55
181
10
073
914
577
429
3518
0S
ensi
tivity
d0.
700.
800.
390.
170.
710.
060.
060.
010.
990.
010.
000.
000.
890.
110.
170.
700.
090.
050.
350.
430.
220.
00S
pec
ifici
tye
0.24
0.51
0.19
0.09
0.31
0.09
0.06
0.03
0.27
0.02
0.00
0.00
0.23
0.23
0.20
0.27
0.14
0.17
0.32
0.33
0.19
0.00
Mito
chon
dria
l78
5117
4574
3835
5532
6810
51
6117
1653
72
921
3711
Sen
sitiv
ity0.
650.
220.
580.
950.
490.
450.
710.
410.
870.
130.
060.
010.
780.
220.
210.
680.
090.
030.
120.
270.
470.
14S
pec
ifici
ty0.
210.
130.
260.
490.
200.
660.
660.
860.
230.
200.
280.
130.
200.
180.
230.
250.
140.
080.
100.
200.
390.
19M
emb
rane
f57
2713
2530
//
//
2631
158
4710
827
157
1222
185
Sen
sitiv
ity0.
470.
230.
440.
530.
460.
540.
260.
140.
820.
180.
140.
470.
260.
120.
210.
390.
320.
09S
pec
ifici
ty0.
110.
100.
150.
200.
090.
610.
831.
000.
150.
250.
120.
130.
310.
290.
130.
210.
190.
09R
ibos
omal
4443
17
230
26
044
00
043
124
200
03
02
39S
ensi
tivity
0.98
0.02
0.16
0.05
0.68
0.05
0.14
0.00
1.00
0.00
0.00
0.00
0.98
0.02
0.55
0.45
0.00
0.00
0.07
0.00
0.05
0.89
Sp
ecifi
city
0.18
0.01
0.04
0.01
0.16
0.04
0.07
0.00
0.15
0.00
0.00
0.00
0.14
0.03
0.35
0.10
0.00
0.00
0.03
0.00
0.02
0.67
Tota
lPro
tein
s56
435
022
226
722
730
773
117
5049
470
2411
499
6511
232
579
4814
919
915
165
aP
reH
el,
pre
dic
ted
helic
es.
bC
yto.
,cy
top
lasm
ic.
cM
ito.,
mito
chon
dria
l.d
Per
cent
age
ofth
ep
rote
ins
anno
tate
das
cyto
pla
smic
,m
itoch
ond
rial,
mem
bra
ne,
orrib
osom
alp
rote
ins
that
wer
eid
entif
ied
ind
iffer
ent
frac
tions
orp
red
icte
db
yd
iffer
ent
bio
info
rmat
ics
tool
s,re
spec
tivel
y.e
Per
cent
age
ofth
ep
rote
ins
iden
tifie
din
diff
eren
tfr
actio
nsor
pre
dic
ted
by
diff
eren
tb
ioin
form
atic
sth
atw
ere
anno
tate
das
cyto
pla
smic
,m
itoch
ond
rial,
mem
bra
ne,
orrib
osom
alp
rote
ins,
resp
ectiv
ely.
fIn
clud
esm
emb
rane
pro
tein
san
nota
ted
asor
gane
llem
emb
rane
pro
tein
s.
2D-LC-MS/MS Analysis of Rat Liver Subcellular Fractions
Molecular & Cellular Proteomics 3.5 451
molarity and viscosity lower than those of sucrose gradients(51). It can be used in density gradient centrifugation with ahigh-speed mode rather than an ultracentrifuge mode (42, 51).In this report, crude mitochondria by differential centrifugationand purified mitochondria by nycodenz density gradient cen-trifugation were obtained. Many proteins annotated as cyto-plasmic, ER, peroxisomal, Golgi, lysosomal, and nuclear pro-teins were included in the CM fraction but apparentlydecreased in the PM fraction. A total of 41.9% (93/222) ofproteins identified in C fractions were also identified in the CMfraction, but for the PM fraction, the value decreased to24.8% (55/222). Excitingly, for all the 78 proteins annotated asmitochondrial (see Tables IV and V and Fig. 3), 74 (94.8%) ofthem had been identified in the PM fraction; moreover, 21(26.9%) of them had only been identified in the PM fraction.Pflieger et al. (52) had validated that the mitochondria containa large number of membrane-associated and highly alkalineproteins in yeast mitochondrial proteome research. In thiswork, nearly half (48.4%) of the 227 proteins identified in thePM fraction distribute in pI � 8 and even in pI � 10, and 27(11.9%) of them have one or more TM domain. Miotochondriaproteins were dramatically enriched by the purification proc-ess. Thus purified subcellular fraction would be in favor ofidentification of more organelle-specific proteins.
Certain subcellular fractions enriched specific functionalproteins. About 40�50% of the proteins identified in the PM
fraction are predicted or annotated as mitochondrial proteins.Moreover, the PM fraction enriched electron transfer flavopro-teins (10.0%), proteins with electron transfer activity (22.0%),and proteins with oxygen binding activity (18.7%) (Fig. 4).Many proteins annotated as cytoplasmic, ER, peroxisomal,Golgi, lysosomal, and nuclear proteins are included in the CMfraction but apparently decreased in the PM fraction. Table VIshows the identified proteins involved in the electron transportand oxidative phosphorylation occurring in mitochondria andtheir distribution in certain fractions. A total of 25 componentsinvolved in the electron transport and oxidative phosphoryla-tion were obtained in this work. All of them could be found inpurified mitochondria, while only three components (cyto-chrome c, �-ETF, and H�-transporting two-sector ATPase �
chain) were detected in the C fraction. It is concluded thatprotein purification and fractionation are efficient at enrichingspecific proteins located in certain subcellular organelle. Onthe other hand, it is noted that the distribution differencebetween TL and CM fractions are not obvious. There are 17and 16 proteins involved in the electron transport and oxida-tive phosphorylation found in TL and CM fractions, respec-tively. These results show that differential centrifugation sep-arated mitochondria from other subcellular components butthat CM still maintained large complexity. In addition, theproteins in electron transport and the oxidative phosphoryla-tion pathway are relatively high-abundant proteins, and some
FIG. 4. Functional classification of 372 out of the 564 identified rat liver proteins according to GO annotation terms and theirdistributions in different fractions. TL-only, C-only, CM-only, or PM-only represents the proteins identified only in the TL, C, CM, or PMfractions; TL/C/CM/PM represents the proteins identified in all the four fractions. The bars indicate the percentage of proteins in certainfractions.
2D-LC-MS/MS Analysis of Rat Liver Subcellular Fractions
452 Molecular & Cellular Proteomics 3.5
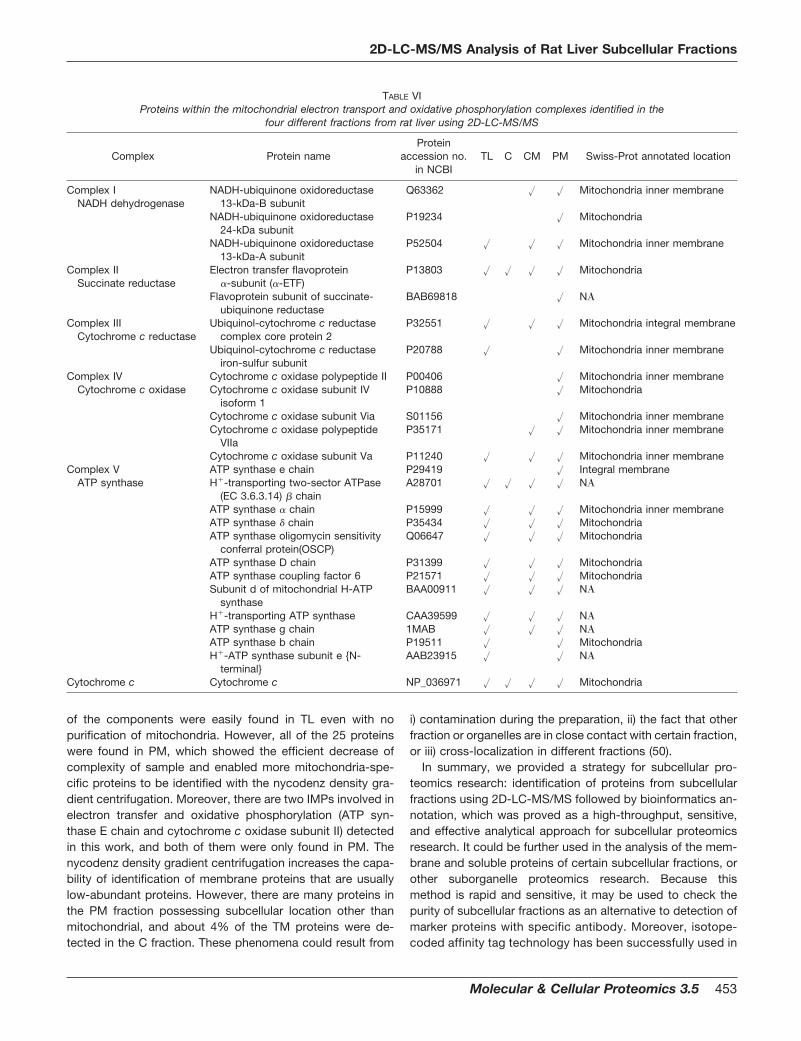
of the components were easily found in TL even with nopurification of mitochondria. However, all of the 25 proteinswere found in PM, which showed the efficient decrease ofcomplexity of sample and enabled more mitochondria-spe-cific proteins to be identified with the nycodenz density gra-dient centrifugation. Moreover, there are two IMPs involved inelectron transfer and oxidative phosphorylation (ATP syn-thase E chain and cytochrome c oxidase subunit II) detectedin this work, and both of them were only found in PM. Thenycodenz density gradient centrifugation increases the capa-bility of identification of membrane proteins that are usuallylow-abundant proteins. However, there are many proteins inthe PM fraction possessing subcellular location other thanmitochondrial, and about 4% of the TM proteins were de-tected in the C fraction. These phenomena could result from
i) contamination during the preparation, ii) the fact that otherfraction or organelles are in close contact with certain fraction,or iii) cross-localization in different fractions (50).
In summary, we provided a strategy for subcellular pro-teomics research: identification of proteins from subcellularfractions using 2D-LC-MS/MS followed by bioinformatics an-notation, which was proved as a high-throughput, sensitive,and effective analytical approach for subcellular proteomicsresearch. It could be further used in the analysis of the mem-brane and soluble proteins of certain subcellular fractions, orother suborganelle proteomics research. Because thismethod is rapid and sensitive, it may be used to check thepurity of subcellular fractions as an alternative to detection ofmarker proteins with specific antibody. Moreover, isotope-coded affinity tag technology has been successfully used in
TABLE VIProteins within the mitochondrial electron transport and oxidative phosphorylation complexes identified in the
four different fractions from rat liver using 2D-LC-MS/MS
Complex Protein nameProtein
accession no.in NCBI
TL C CM PM Swiss-Prot annotated location
Complex INADH dehydrogenase
NADH-ubiquinone oxidoreductase13-kDa-B subunit
Q63362 � � Mitochondria inner membrane
NADH-ubiquinone oxidoreductase24-kDa subunit
P19234 � Mitochondria
NADH-ubiquinone oxidoreductase13-kDa-A subunit
P52504 � � � Mitochondria inner membrane
Complex IISuccinate reductase
Electron transfer flavoprotein�-subunit (�-ETF)
P13803 � � � � Mitochondria
Flavoprotein subunit of succinate-ubiquinone reductase
BAB69818 � N
Complex IIICytochrome c reductase
Ubiquinol-cytochrome c reductasecomplex core protein 2
P32551 � � � Mitochondria integral membrane
Ubiquinol-cytochrome c reductaseiron-sulfur subunit
P20788 � � Mitochondria inner membrane
Complex IVCytochrome c oxidase
Cytochrome c oxidase polypeptide II P00406 � Mitochondria inner membraneCytochrome c oxidase subunit IV
isoform 1P10888 � Mitochondria
Cytochrome c oxidase subunit Via S01156 � Mitochondria inner membraneCytochrome c oxidase polypeptide
VIIaP35171 � � Mitochondria inner membrane
Cytochrome c oxidase subunit Va P11240 � � � Mitochondria inner membraneComplex V
ATP synthaseATP synthase e chain P29419 � Integral membraneH�-transporting two-sector ATPase
(EC 3.6.3.14) � chainA28701 � � � � N
ATP synthase � chain P15999 � � � Mitochondria inner membraneATP synthase � chain P35434 � � � MitochondriaATP synthase oligomycin sensitivity
conferral protein(OSCP)Q06647 � � � Mitochondria
ATP synthase D chain P31399 � � � MitochondriaATP synthase coupling factor 6 P21571 � � � MitochondriaSubunit d of mitochondrial H-ATP
synthaseBAA00911 � � � N
H�-transporting ATP synthase CAA39599 � � � NATP synthase g chain 1MAB � � � NATP synthase b chain P19511 � � MitochondriaH�-ATP synthase subunit e {N-
terminal}AAB23915 � � N
Cytochrome c Cytochrome c NP_036971 � � � � Mitochondria
2D-LC-MS/MS Analysis of Rat Liver Subcellular Fractions
Molecular & Cellular Proteomics 3.5 453

quantitative and differential analysis of complex proteinmixtures (53–57). Combination of isotope-coded affinity tagwith subcellular fractionation may promote the quantitativeand differential study between different subcellular fractionsunder different physiology or pathology states.
* This work was supported by National High-Technology Project(2001AA233031, 2002BA711A11) and Basic Research Foundation(2001CB210501). The costs of publication of this article were de-frayed in part by the payment of page charges. This article musttherefore be hereby marked “advertisement” in accordance with 18U.S.C. Section 1734 solely to indicate this fact.
¶ To whom correspondence should be addressed: Research Cen-ter for Proteome Analysis, Institute of Biochemistry and Cell Biology,Shanghai Institutes for Biological Sciences, Chinese Academy ofSciences, 320 YueYang Road, Shanghai 200031, China. Tel.: 86-21-54920170; Fax: 86-21-54920171; E-mail: [email protected].
REFERENCES
1. Rabilloud, T., Kieffer, S., Procaccio, V., Louwagie, M., Courchesne, P. L.,Patterson, S. D., Martinez, P., Garin, J., and Lunardi. J. (1998) Two-dimensional electrophoresis of human placental mitochondria and pro-tein identification by mass spectrometry: Toward a human mitochondrialproteome. Electrophoresis 19, 1006–1014
2. Neubauer. G., King, A., Rappsilber, J., Calvio, C., Watson, M., Ajuh, P.,Sleeman, J., Lamond, A., and Mann, M. (1998) Mass spectrometry andEST-database searching allows characterization of the multi-protein spli-ceosome complex. Nature Genet. 20, 46–50
3. Taylor, R. S., Wu, C. C., Hays, L., Eng, J. K., Yate, J. R., and Howell, K. E.(2000) Proteomics of rat liver Golgi complex: Minor proteins are identifiedthrough sequential fractionation. Electrophoresis 21, 3441–3459
4. Cronshaw, J. M., Krutchinsky, A. N., Zhang, W., Chait, B. T., and Matunis,M. J. (2002) Proteomics analysis of the mammalian nuclear pore com-plex. J. Cell Biol. 158, 915–927
5. Andersen, J. S., Lyon, C. E., Fox, A. H., Leung, A. K. L., Lam, Y. W., Steen,H., Mann, M., and Lamond, A. I. (2002) Directed proteomic analysis of thehuman nucleolus. Curr. Biol. 12, 1–11
6. Jung, E., Heller, M., Sanchez, J. C., and Hochstrasser, D. F. (2000) Pro-teomics meets cell biology: The establishment of subcellular proteomes.Electrophoresis 21, 3369–3377
7. O’Farrell, P. H. (1975) High resolution two-dimensional electrophoresis ofproteins. J. Biol. Chem. 250, 4007–4021
8. Harry, J., Wilkins, M. R., Herbert, B. R., Packer, N. H., Gooly, A. A., andWilliams, K. L. (2000) Proteomics: Capacity versus utility. Electrophoresis21, 1071–1081
9. Gygi, S. G., Corthalas, G. L., Zhang, Y., Rochon, Y., and Aebersold, R.(2000) Evaluation of two-dimensional gel electrophoresis-based pro-teome analysis technology. Proc. Natl. Acad. Sci. U. S. A. 97,9390–9395
10. Klose, J., and Kobalz, U. (1995) Two-dimensional electrophoresis of pro-teins: an updated protocol and implications for a functional analysis ofthe genome. Electrophoresis 16, 1034–1059
11. Willkins, M. R., Pasquali, C., Appel, R. D., Ou, K., Golaz, O., Sanchez, J. C.,Yan, J. X., Gooley, A. A., Hughs, G., Humphery-Smith, I., Williams, K. L.,and Hochstrasser D. F. (1996) From proteins to proteomes: large scaleprotein identification by two-dimensional electrophoresis and amino acidanalysis. Biotechnology 14, 61–65
12. Packer, N. H., Lawson, M. A., Jardine, D. R., Sanchez, J. C., and Gooley,A. A. (1998) Analyzing glycoproteins separated by two-dimensional gelelectrophoresis. Electrophoresis 19, 981–988
13. Oh-Ishi, M., Satoh, M., and Maeda, T. (2000) Preparative two-dimensionalgel electrophoresis with agarose gels in the first dimension for highmolecular mass proteins. Electrophoresis 21, 1653–1669
14. Corthals, G. L., Wasinger, V. C., Hochstrasser, D. F., and Sanchez, J. C.(2000) The dynamic range of protein expression: A challenge for pro-teomic research. Electrophoresis 21, 1104–1115
15. Rabilloud, T., Adessi, C., Giroudel, A., and Lunardi, J. (1997) Improvementof the solubilization of proteins in two-dimensional electrophoresis with
immobilized pH gradients. Electrophoresis 18, 307–31616. Chevallet, M., Santoni, V., Poinas, A., Rouquie, D., Fuchs, A., Kieffer, S.,
Rossignol, M., Lunardi, J., Garin, J., and Rabilloud T. (1998) New zwit-terionic detergents improve the analysis of membrane proteins by two-dimensional electrophoresis. Electrophoresis 19, 1901–1909
17. Giddings, J. C. (1987) Concepts and comparisons in multidimensionalseparation. J. High Resolut. Chromatogr. Commun. 10, 319–323
18. Opitek, G. J., Jorgenson, J. W., and Anderegg, R. J. (1997) Two-dimen-sional SEC/RPLC coupled to mass spectrometry for the analysis ofpeptides. Anal. Chem. 69, 2283–2291
19. Tong, W., Link, A., Eng, J. K., and Yates, J. R., III (1999) Identification ofproteins in complexes by solid-phase microextraction/multistep elution/capillary electrophoresis/tandem mass spectrometry. Anal. Chem. 71,2270–2278
20. Wolters D. A., Washburn M. P., and Yates, J. R., III (2001) An automatedmultidimensional protein identification technology for shotgun proteom-ics. Anal. Chem. 73, 5683–5690
21. Wagner, K., Miliotis, T., Marko-Varga, G., Bischoff, R., and Unger, K. (2002)An automated on-line multidimensional HPLC system for protein andpeptide mapping with integrated sample preparation. Anal. Chem. 74,809–820
22. Link, A. J., Eng, J., Schieltz, D. M., Carmack, E., Mize, G. J., Morris, D. R.,and Garvik, B. M., and Yates, J. R. III (1999) Direct analysis of proteincomplexes using mass spectrometry. Nat. Biotechnol. 17, 676–682
23. Washburn, M. P., Wolters, D., and Yates, J. R., III (2001) Large-scaleanalysis of the yeast proteome by multidimensional protein identificationtechnology. Nat. Biotechnol. 19, 242–247
24. Vihinen, M. (2001) Bioinformatics in proteomics. Biomol. Engineering 18,241–248
25. Wu, C. H., Huang, H., Yeh, L. S., and Barker, W. C. (2003) Protein familyclassification and function annotation. Comput. Biol. Chem. 27, 37–47
26. Nakai, K. (2000) Protein sorting signals and prediction of subcellular local-ization. Adv. Protein Chem. 54, 277–344
27. Fen, Z. P. (2002) An overview on predicting the subcellular location of aprotein. In Silico Biol. 2, 291–303
28. Nakai, K. (2001) Review: Prediction of in vivo fates of proteins in the era ofgenomics and proteomics. J. Struct. Biol. 134, 103–116
29. Emanuelsson, O., and Heijne, G. V. (2001) Prediction of organellar targetingsignals. Biochim. Biophys. Acta 1541, 114–119
30. Nakai, K., and Horton, P. (1999) PSORT: a program for detecting sortingsignals in proteins and predicting their subcellular localization. TrendsBiochem. Sci. 24, 34–35
31. Emanuelsson, O., Nielsen, H., Brunak, S., and von Heijne, G. (2000) Pre-dicting subcellular localization of proteins based on their N-terminalamino acid sequence. J. Mol. Biol. 300, 1005–1016
32. Kyte, J., and Doolittle, R. F. (1982) A simple method for displaying thehydropathic character of a protein. J. Mol. Biol. 157, 105–132
33. Krogh, A., Larsson, B., von Heijne, G., and Sonnhammer, E. L. L. (2001)Predicting transmembrane protein topology with a hidden Markov mod-el: Application to complete genomes. J. Mol. Biol. 305, 567–580
34. Thome-Kromer, B., Bonk, I., Klatt, M., Nebrich, G., Taufmann, M., Bryant,S., Wacker, U., and Kopke, A. (2003) Toward the identification of livertoxicity markers: A proteome study in human cell culture and rats.Proteomics 3, 1835–1862
35. Fountoulakis, M., and Suter, L. (2002) Proteomic analysis of the rat liver.J. Chromatogr. B. 782, 197–218
36. Lopez, M. F., Kristal, B. S., Chernokalskaya, E., Lazarev, A., Shestopalov,A. I., Bogdanova, A., and Robinson, M. (2000) High-throughput profilingof the mitochondrial proteome using affinity fractionation and automa-tion. Electrophoresis 21, 3427–3440
37. Fountoulakis, M., Berndt, P., Langen, H., and Suter, L. (2002) The rat livermitochondrial proteins. Electrophoresis 23, 311–328
38. Taylor, R. S., Fialka, I., Jones, S. M., Huber, L. A., and Howell, K. E. (1997)Two-dimensional mapping of the endogenous proteins of the rat hepa-tocyte Golgi complex cleared of proteins in transit. Electrophoresis 18,2601–2612
39. Taylor, R. S., Wu, C. C., Hays, L. G., Eng, J. K., Yate, J. R., and Howell, K. E.(2000) Proteomics of rat liver Golgi complex: Minor proteins are identifiedthrough sequential fractionation. Electrophoresis 21, 3441–3459
40. Cronshaw, J. M., Krutchinsky, A. N., Zhang, W., Chait, B. T., and Matunis,M. J. (2002) Proteomics analysis of the mammalian nuclear pore com-
2D-LC-MS/MS Analysis of Rat Liver Subcellular Fractions
454 Molecular & Cellular Proteomics 3.5
plex. J. Cell Biol. 158, 915–92741. Cahill, A., Baio, D. L., and Cunningham, C. C. (1995) Isolation and charac-
terization of rat liver mitochondrial ribosomes. Anal. Biochem. 232, 47–5542. Ayako, O. M., and Fridovich, I. (2002) Subcellular distribution of superoxide
dismutases (SOD) in rat liver. J. Biol. Chem. 276, 38388–3839343. Eng, J. K., McCormack, A. L., and Yates, J. R., III (1994) An approach to
correlate tandem mass-spectral data of peptides with amino-acid-se-quences in a protein database. J. Am. Soc. Mass Spectrom. 5, 976–989
44. Yates, J. R., III, Carmack, E., Hays, L., Link, A. J., and Eng, J. K. (1999)Automated protein identification using microcolumn liquid chromatogra-phy-tandem mass spectrometry. Methods Mol. Biol. 112, 553–569
45. Ashburner, M., Ball, C. A., Blake, J. A., Botstein, D., Butler, H., Cherry, J. M.,Davis, A. P., Dolinski, K., Dwight, S. S., Eppig, J. T., Harris, M. A., Hill,D. P., Issel-Tarver, L., Kasarskis, A., Lewis, S., Matese, J. C., Richardson,J. E., Ringwald, M., Rubin, G. M., and Sherlock, G. (2000) Gene Ontol-ogy: Tool for the unification of biology. The Gene Ontology Consortium.Nat. Genet. 25, 25–29
46. Mulder, N. J., Apweiler, R., Attwood, T. K., Bairoch, A., Barrell, D., Bateman,A., Binns, D., Biswas, M., Bradley, P., Bork, P., Bucher, P., Copley, R. R.,Courcelle, E., Das, U., Durbin, R., Falquet, L., Fleischmann, W., Griffiths-Jones, S., Haft, D., Harte, N., Hulo, N., Kahn, D., Kanapin, A., Krestya-ninova, M., Lopez, R., Letunic, I., Lonsdale, D., Silventoinen, V., Orchard,S. E., Pagni, M., Peyruc, D., Ponting, C. P., Selengut, J. D., Servant, F.,Sigrist, C. J. A., Vaughan, R., and Zdobnov, E. M. (2003) The InterProDatabase, 2003 brings increased coverage and new features. NucleicAcids Res. 31, 315–318
47. Peng, J., Elias, J. E., Thoreen, C. C., Licklider, L. J., and Gygi, S. P. (2003)Evaluation of multidimensional chromatography coupled with tandemmass spectrometry (LC/LC-MS/MS) for large-scale protein analysis: theyeast proteome. J. Proteome Res. 2, 43–50
48. Mawuenyega, K. G., Kaji, H., Yamuchi, Y., Shinkawa. T., Saito, H., Taoka,M., Takahashi, N., and Isobe, T. (2003) Large-scale identification of
Caenorhabditis elegans proteins by multidimensional liquid chromatog-raphy-tandem mass spectrometry. J. Proteome Res. 2, 23–35
49. Fountoulakis, M., and Takacs, B. (2001) Effect of strong detergents andchaotropes on the detection of proteins in two-dimensional gels. Elec-trophoresis 22, 1593–1602
50. Taylor, S. W., Warnock, D. E., Glenn, G. M., Zhang, B., Fahy, E., Gaucher,S. P., Capaldi, R. A., Gibson, B. W., and Ghosh, S. S. (2002) An alter-native strategy to determine the mitochondrial proteome using sucrosegradient fractionation and 1D PAGE on highly purified human heartmitochondria. J. Proteome Res. 1, 451–458
51. Graham, J. M., Ford, T., and Rickwood, D. (1990) Isolation of the majorsubcellular organelles from mouse liver using nycodenz gradients with-out the use of ultracentrifuge. Anal. Biochem. 187, 318–323
52. Pflieger, D., Le Caer, J.-P., Lemaire, C., Bernard, B. A., Dujardin, G., andRossier, J. (2002) Systematic identification of mitochondrial proteins byLC-MS/MS. Anal. Chem. 74, 2400–2406
53. Gygi, S. P., Rist, B., Gerber, S. A., Turecek, F., Gelb, M. H., and Aebersold,R. (1999) Quantitative analysis of complex protein mixtures using iso-tope-coded affinity tags. Nat. Biotechnol. 17, 994–999
54. Han, D. K., Eng, J., Zhou, H., and Aebersold, R. (2001) Quantitative profilingof differentiation-induced microsomal proteins using isotope-coded af-finity tags and mass spectrometry Nat. Biotechnol. 19, 946–951
55. Zhou, H., Ranish, J. A., Watts, J. D., and Aebersold, R. (2002) Quantitativeproteome analysis by solid-phase isotope tagging and mass spectrom-etry. Nat. Biotechnol. 20, 512–515
56. Ranish, J. A., Yi, E. C., Leslie, D. M., Purvine, S. O., Goodlett, D. R., Eng, J.,and Aebersold, R. (2003) The study of macromolecular complexes byquantitative proteomics. Nat. Genet. 33, 349–355
57. Wu, C. C., MacCoss, M. J., Howell, K. E., and Yates, J. R. (2003) A methodfor the comprehensive proteomic analysis of membrane proteins. Nat.Biotechnol. 21, 532–538
2D-LC-MS/MS Analysis of Rat Liver Subcellular Fractions
Molecular & Cellular Proteomics 3.5 455