Embed Size (px)
Citation preview
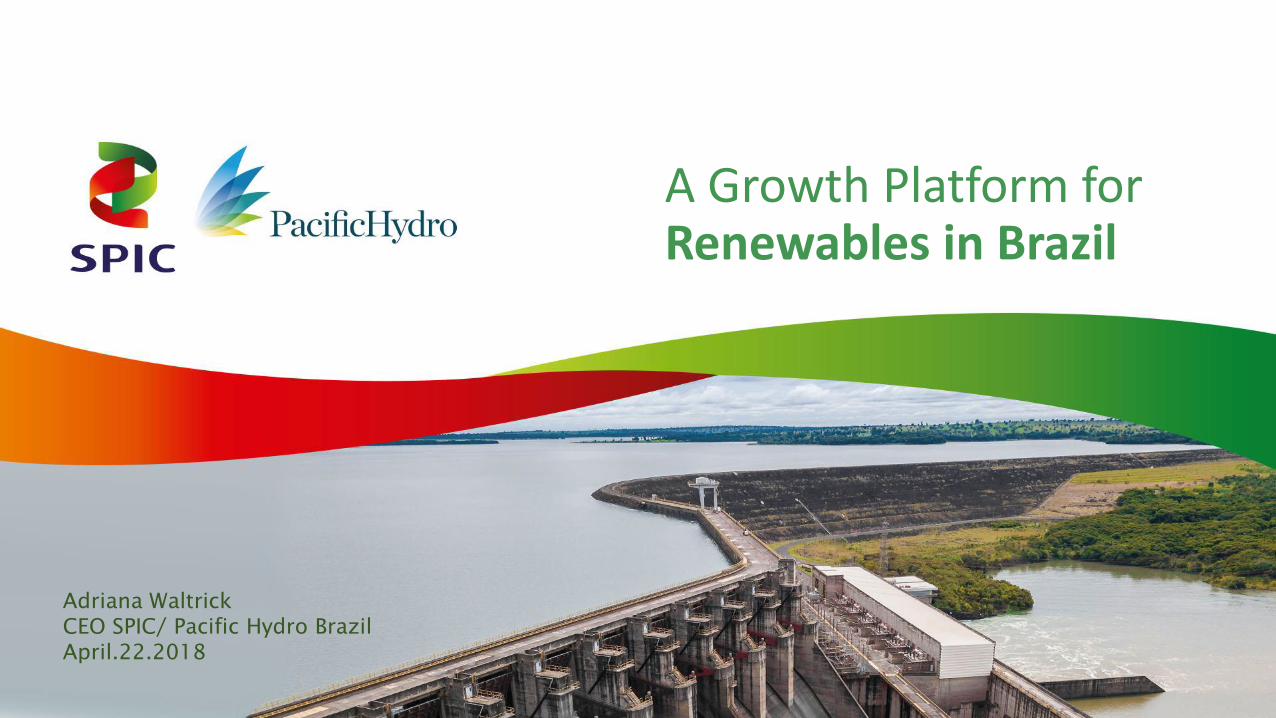
Adriana Waltrick
CEO SPIC/ Pacific Hydro Brazil
April.22.2018
A Growth Platform for Renewables in Brazil

1. Our Group: SPIC and Pacific Hydro
2. Business Context

SPIC Pacific Hydro - Brazil
Mataraca , PB – Brazil

Pacific Hydro Brasil – Wind
August
2005
November
2006
April - November
2007
Pacific Hydro
acquires Vale
dos Ventos and
Millennium
projects
November
2007
March
2009
Pacific Hydro
opens the
office in Brazil
Pacific Hydro
structures
Project Finance
with BNB and
BNDES
10.2 MW inst
Millennium
starts
operations
48 MW inst
Vale dos
Ventos starts
operations
Timeline: key events

Long term project finance funding by local development banks
• Vale dos Ventos obtained a 16 year loan from BNDES (Brazilian Development Bank) and Millennium a 19 year loan from
BNB
Fully contracted quality operating portfolio
20 year PPAs with Eletrobras under PROINFA Program, price indexed to IGP-M inflation (steady cash flows)
PPA in the free market with anticipated commissioning of wind farms
All contracts liquidated on CCEE platform
Outstanding reputation and track record with strong HSE culture
Assets availability 98% historically (one of the highest in the market)
Both assets are ISO 14001 and OHSAS 18001 certified
Zero accidents in the last 60 months
Pacific Hydro Brasil

Pacific Hydro Brasil
Vale dos Ventos Millennium
Installed capacity 48 MW 10 MW
Annual generation 119 GWh 32 GWh
COD 2007 2009
# Turbines 60 13
Homes Supplied
(equiv) 100,000 40,000
Carbon abatement
(tonnes pa) 17,000 40,000
Project Finance BNDES BNB
PPA PROINFA
Eletrobras
PROINFA
Eletrobras
Location Mataraca-PB Mataraca-PB
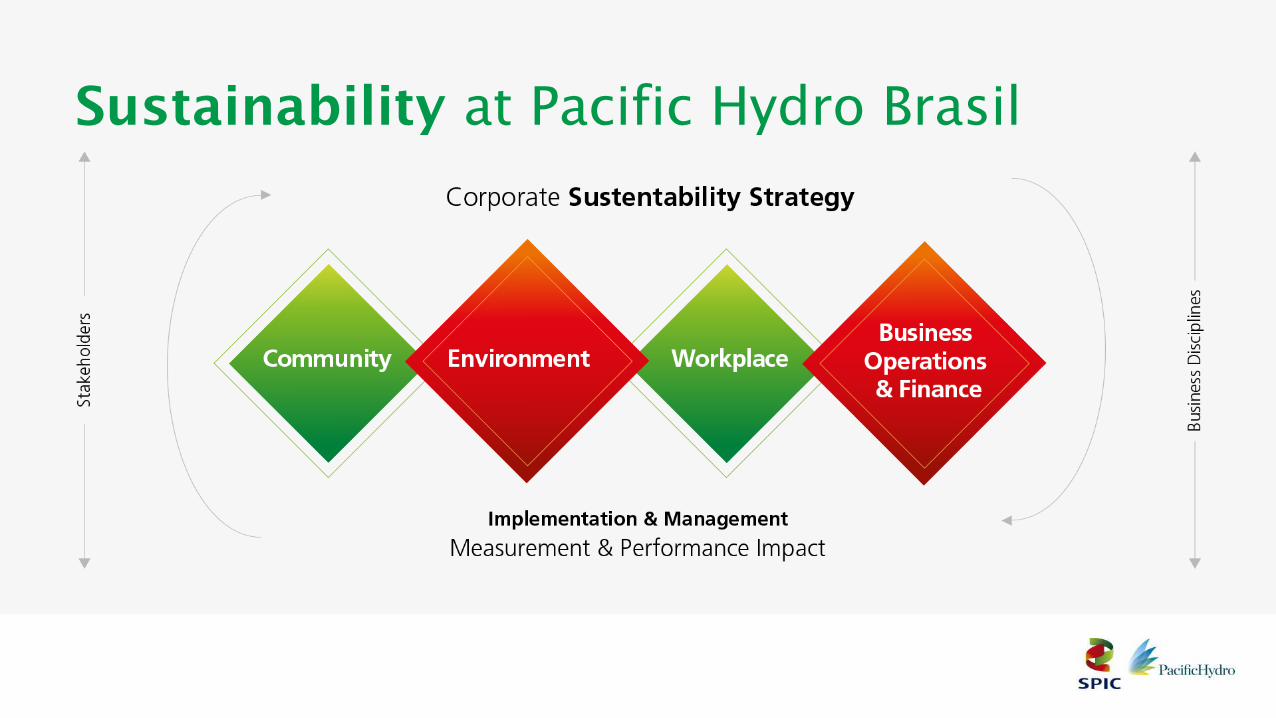
Sustainability at Pacific Hydro Brasil

Community Programs at Pacific Hydro Brasil
Cidadania ao alcance de todos
- Objectives : Together city hall and local
institutions promote “Ação Cidadania”
citizenship event providing services to the
population, such as documents issuance,
educational workshops, entertainment and
health assessment
- Maintenance of essential local roads to keep
villagers’ ability to attend schools, seek
medical treatment and access other essential
services
Project Barra Limpa
- Objectives: Educate local population
about sustainability /environment
protection
– In partnership with the municipal schools,
promote educational activities
environmental protection
– Activities : upcycling in handicrafts,
population engagement on debates and
lectures on renewable energy
Project Portas Abertas
– Objectives: provide transparency on
Company’s activities in the region, with
organized site visits to wind farms
– Local community is invited to visit wind farms,
learn about all its sustainable practices and
technologies that contribute for a better
environment, promoting awareness for
sustainable development

Growth Platform
São Simão , GO/MG – Brazil

Shareholder’s Overview
Top 5 energy
generators in China
Present 41 countries
140,000
employees
SPIC acquired PHB in 2017

SPIC growth plan through PHB Platform
Acquisition of Pacific Hydro
April 2017
Acquisition of HPP São Simão
Sept 2017 Business Expansion
SPIC acquired assets
Pacific Hydro Brazil
Wind farms Northeastern Brazil
58 MW of installed capacity
• Hydro Concessions
• Auctions
• M&A
SPIC won 30 year concession of São
Simão hydroelectric plant,
the largest of power plant
offered at the last privatization auction,
1,710 MW inst capacity

SPIC Brasil
São Simão HPP
Installed capacity 1,710 MW
Annual generation 10,538 GWh
Commencement/COD date 1973/1978
Units 6
Unit capacity 285 MW
Turbine discharge 425 m3/s
Average annual flow 2,306 m3/s
Spillway capacity 24,100 m3/s
Dam length 3,440 m
Dam height 127 m
Fall head 72 m
Reservoir area 703.29 km2

SPIC Brasil 2018
Leading Private Renewable Generation Companies – Operating Capacity (GW)
Source: Itaú BBA and Companies. Note: 1 Considers consolidate group capacity in the country

1. Our Group: SPIC and Pacific Hydro
2. Business Context

Brazil Business Context
Market turn around of recession
Consumption and population profile
demonstrate growth potential
Stable Sector Rules (Auctions, PPAs, Funding )
Regulated auctions as main Sector
expansion mechanism (Long Term PPAs)
Free Market PPAs as opportunity for greenfield PPAs

Investment Thesis
Stable and inflation protected cash flows
- Transparent public auctions for all regulated energy contracting
- Long term PPAs, inflation indexed
PPAs with Free Market (ACL)
- Partnership opportunities with large off takers (Industrials,
Trading Cos) for wind and solar PPAs
Debt Financing
- Long term funding with federal banks (BNDES, BNB, BRDE)
- Loans from Foreign Developing Banks
Abundant high quality development pipeline, privatizations
and M&A Opportunities
- Market for projects by independent developers

Thank You!
谢谢

BRAZILIAN MARKET OPERATOR CCEE – CÂMARA DE COMERCIALIZAÇÃO DE ENERGIA ELÉTRICA
Roberto Castro
Administration Board
Download our APP
April 22, 2018

Brazilian Market
Market operator
Centralized Spot price calculation and contractual position settlement
Auctions for Generation Expansion
System operator
Centralized dispatch of power plants and Transmission System
Centralized System and Market Operation

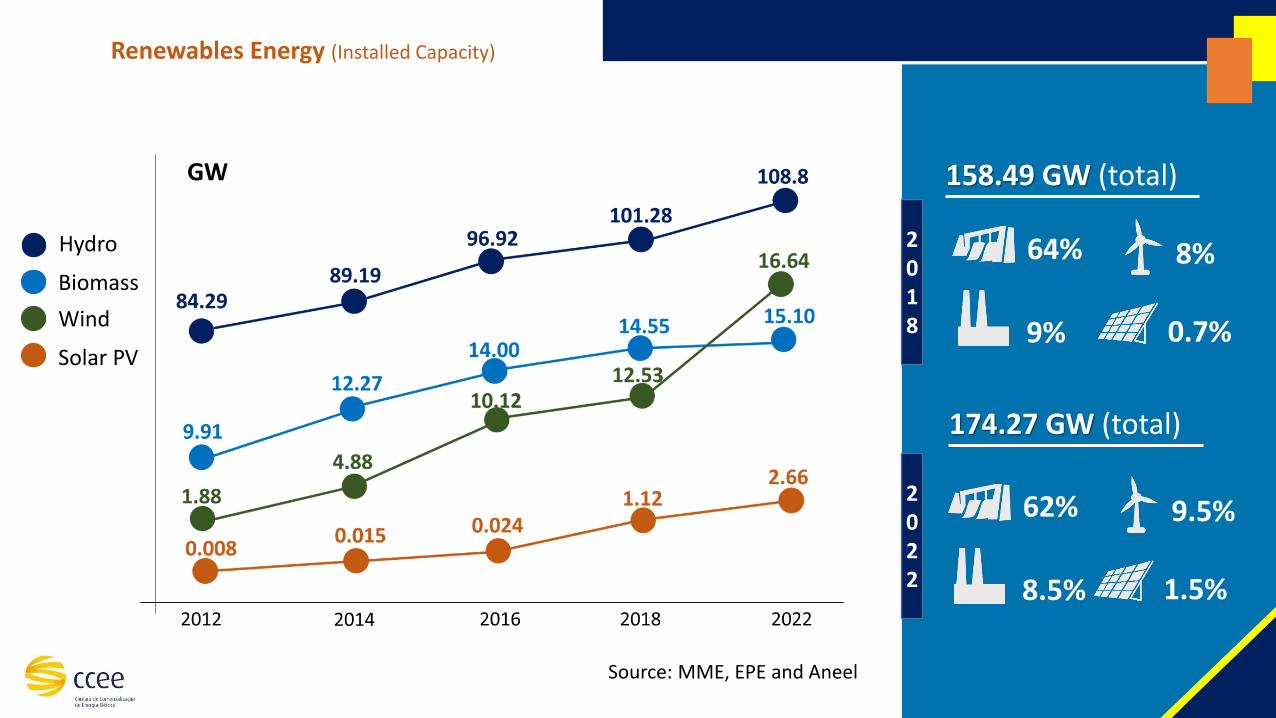
Installed Capacity
Renewable is about 80% of the Brazilian electricity matrix
Hydro
Biomass
Wind
Solar PV
Renewables Energy (Installed Capacity)
GW
2018
2022
158.49 GW (total)
64%
9%
8%
0.7%
174.27 GW (total)
62%
8.5%
9.5%
1.5%
Source: MME, EPE and Aneel

Hydro
43,937 MWavg
Wind
4,618
Thermal
13,540
71%
7.5%
22%
Solar PV
44.5
0.1%
Biomass:
Generation – 62,141 MWavg (2017)
MWavg
MWavg
MWavg
2,908 MWavg
4.5%
83% Renewable

Sellers: Generators, IPP´s, Traders and
Self-Generators
Auctions for Reserve Energy
Regulated Market:
Distributors Companies (DISCOS) supplying captive consumers
Free Market:
Free Consumers, Special Consumers,
Traders
Free Bilateral Contracts
Auctions for Regulated Market Supply
Reserve Energy:
Amount defined by MME in order to increase supply security. Its is paid by a surcharge over all loads
Sellers: Generators, IPP
Current Brazilian Market Design - Main Figures

73 auctions held
USD 525 billions* traded
USD 38.4 billions* investment
9.3 TWh contracted
Energy Auctions
*1 USD = 3.3138995 BRL / Currency in Apr 03, 2018 Source: Central Bank of Brazil

Prices by technology (auction)
Source: EPE

Prices by technology (auctions)
(USD/MWh) *
Solar PV Wind Hydro Biomass Thermal
$ 75
$ 51 $ 48
$ 70 $ 75
*1 USD = 3.31 BRL R$ Exchange rate as in Apr 03, 2018
Source: Brazilian Central Bank

Conclusion
Previsibility
Atractive Environment
for Investors

1 Comerc Energy Trading:
“from pioneer in the market to one of the largest energy trading companies in Brazil”
Cristopher Vlavianos

Our organization
Brazil
We are present
nation-wide
+250 Experts

4
800Provides energy management for more than
800 brazilian and multinational companies
1,600 Management for 1,600 consumer units
2,000 Management of 2,000 GWh each month
#1 Leader in energy management in Brazil
730 GWh traded each month
10,000 More than 10,000 GWh traded until 2021
450MM Annual revenue
5% Comerc is responsible for the management
of 5% of total energy consumption in Brazil
15% Market share in the free market
Our figures

Regulated vs. Free Market

The free energy market in Brazil
Source: CCEE
85%
15%
Comerc leads in number of
clients, with 15% market share.
Market share in the free market
30%
70%
The free market accounts for 30% of the Brazilian energy consumption
Free market Regulated market
7

Free energy market growth2004 - 2017
34
470 613
684
459
445
485
514
595
613
623
629
718 874
194
221 4
55 587
992 1142
1168
1169
2019
4318
63.500
97.446
112.969
123.770 119.805
106.224
123.148
129.937
135.563 140.589 135.141
131.654
128.082
146.882
-
20.000
40.000
60.000
80.000
100.000
120.000
140.000
160.000
0
500
1000
1500
2000
2500
3000
3500
4000
4500
5000
2004 2005 2006 2007 2008 2009 2010 2011 2012 2013 2014 2015 2016 2017
Consu
mptio
n in
GW
h
# o
f sp
ecia
l and f
ree c
onsu
mers
Free Consumer Special Consumer Consumption (GWh)Source: CCEE 8

Total consumption vs. renewable energy consumption in the free market2012 - 2018
129.937 135.563
140.589 135.141
131.654 128.082
146.882
12.822 16.562 16.609 15.615
22.380
36.424 39.884
-
20.000
40.000
60.000
80.000
100.000
120.000
140.000
160.000
2012 2013 2014 2015 2016 2017 2018
Consu
mpti
on in G
Wh
Total consumption Renewable sources consumption
Source: CCEE 9

Generation Capacity Expansion

Installed Capacity by Source
Source: ANEEL
90.680
158.499
2004 2018
MW
Hydro Thermal Small Hydro Nuclear Wind
Evolution of installed capacity2004 x 2018
MW 2004 2018
Hydro 67.778 95.619
Thermal 19.556 41.551
Small Hydro 1.310 5.672
Nuclear 2.007 1.990
Wind 29 12.538
Photovoltaic 0 1.129
95.619 60%
41.551 26%
5.672 4%
1.990 1%
12.538 8%
1.129 1%
67.778 75%
1.310 1%
2.007 2%
19.55622%
11
2004
2018

Renewable EnergyRegulated Market Auction Prices
12
Current prices
for Solar (PV)
and Wind Power
are at the lowest
levels since the
beginning of the
Auctions
Biomass and SHP
prices are stable
Source: CCEE Design: COMERC
0
10
20
30
40
50
60
70
80
90
100
2010 2011 2012 2013 2014 2015 2016 2017 2018
Pri
ce in U
S$/M
Wh
Biomass SHP Wind Solar

Brazilian Wind Power Potential
Recent studies with new
technologies and 100-meter
towers estimate the Brazilian
wind power potential as 522 GW.
Source: Brazilian Wind Power Potential
Source: National Institute of Science and Technology
Instituto Nacional de Ciências e Tecnologia (in Portuguese)
In 2001, the estimated
Brazilian wind power potential
was 143 GW, assuming average
wind speed of 7 m/s and 50-
meter towers.
143 GW
522 GW

Wind Power in the Northeast of Brazil
Drivers:
• Land leases generate extra household income for families in poor regions
• New Jobs
• ABEEólica estimates 15 new Jobs/new megawatt installed
• More than 150,000 new Jobs in 2016
• Avoided CO2 emissions in 2017 equivalent to the annual emission of more than 13 million cars
Source: ABBeólica
1,29 0,93 0,99
1,25 1,37 1,60
2,02 2,19
2,55 2,44
1,96 1,87
jan feb mar apr may jun jul aug sep oct nov dec
Tons
of
CO
2
Avoided CO2 emissions in 2017
15

MHDI improves in Cities with Wind Power
Macau (RN) Caetité (BA) Paracuru (CE) Amontada (CE) Aracati (CE) J. Câmara (RN) M. do Chapéu (BA) Afrânio (PE) R. do Fogo (RN) Araripe (CE) F. de Noronha (PE)
%(2010/2000) 20% 38% 39% 43% 25% 30% 36% 52% 43% 52% 14%
*São Caetano do Sul (SP) - City with the highest MHDI in Brazil
0,556
0,454 0,4570,423
0,523
0,457 0,4330,386 0,398
0,371
0,6940,665
0,625 0,6370,606
0,6550,595 0,588 0,588 0,569 0,564
0,7880,820
0,862
Macau (RN) Caetité (BA) Paracuru (CE) Amontada(CE)
Aracati (CE) João Câmara(RN)
Morro doChapéu (BA)
Afrânio (PE) Rio do Fogo(RN)
Araripe (CE) Fernando deNoronha (PE)
MH
DI
Municipal Human Development Index (MHDI) - Cities with wind power
2000 2010 São Caetano do Sul (SP) São Caetano do Sul (SP)

Solar Power Forecast in Brazil Brazilian Matrix in 2040 - BNEF Forecast
Source: BNEF 2016.
18
126 GW32%
117 GW29%
48 GW12%
44 GW11%
36 GW9%
20 GW5%
Solar Hydro Wind Flexible Capacity Biomass Natural Gas Coal Nuclear Oil

Renewable Energy Certificate
In 2011 we created the Comerc-Sinerconsult Renewable Energy Certificate for the amount of
greenhouse gases avoided through the use of renewable energy from small hydro plants (PCH),
thermal plants burning sugarcane biomass, wind farms or solar power plants.
All calculations used are fully compliant with the requirements defined in the GHG Protocol
Corporate Standard.
"GHG Protocol” is the methodology most widely used by governments and corporations to quantify
and manage greenhouse gas emissions. The “Comerc Sinerconsult Renewable Energy Certificate”
itself does not generate carbon credits.
20

Financing Power Generation

PPA for Regulated and Free Market in Brazil – How has it worked until now?
22
5 to 6 years15 to 30 yearsPPA Term
IPCA or IGP-MIPCAPPA Price Index
-BNDESMain Lender
-TJLP(subsidized rate)
Loan Interest Rate
NoYesEnables Generation
Expansion?
REGULATED70% of the Electrical Market
FREE MARKET30% of the Electrical Market
Accounts receivable serve as
collateral for bank loans
PPA term not long enough for
financing
Subsidized rate

4
6
8
10
12
14
16
Jan
-10
May
-10
Sep
-10
Jan
-11
May
-11
Sep
-11
Jan
-12
May
-12
Sep
-12
Jan
-13
May
-13
Sep
-13
Jan
-14
May
-14
Sep
-14
Jan
-15
May
-15
Sep
-15
Jan
-16
May
-16
Sep
-16
Jan
-17
May
-17
Sep
-17
Jan
-18
% p
er y
ear
Selic x TJLP x TLP - Brazilian Interest Rates
Selic TJLP TLP
Interest Rates on Loans
23Sources: Central Bank of Brazil; Brazilian Development Bank (BNDES) Design: COMERC
Unsubsidized interest rates help enhance
credit offer
Subsidized rates
Unsubsidized rates

PPA for Regulated and Free Markets in Brazil – How should it work in the future?
5 to 6 years15 to 30 yearsPPA Term
IPCA or IGP-MIPCAPPA Price Index
BNDES (and other banks)
BNDESMain Lender
TLPTLPLoan Interest Rate
YesYesEnables Generation
Expansion?
REGULATED70% of the Electrical Market
FREE MARKET30% of the Electrical Market
10 years
70% USD / 30% IPCA
International Credit
Lines
International Interest
Rates
Yes
Accounts receivable serve as
collateral for bank loans
Accounts receivable serve as
collateral for bank loans
BNDES assumes R$ 90/MWh as
the minimum price for electrical
energy
24

São Paulo
Av. Pres. Juscelino Kubitschek, 1909
21° andar - Torre Norte
Vila Nova Conceição
04543 907 - São Paulo - SP
T. 55 (11) 4573-0000
Florianópolis
Av. Trompowsky, 291
1° andar - Torre 2 - Centro
88015 300 - Florianópolis - SC
T. 55 (48) 3333-1444
Ribeirão Preto
Av. Braz Olaia Acosta, 727
Conj. 1009 / 1010
Jardim Califórnia
14026 040 - Ribeirão Preto - SP
T. 55 (16) 3442-4055
Bento Gonçalves
Rua Carlos Flores, 259
Sala 201 - São Bento
95700 000 - Bento Gonçalves - RS
T. 55 (51) 3500-1660
São José dos Campos
Rua Carlos Maria Auricchio, 70
Salas 1204 / 1205
Royal Park - 12246 876
São José dos Campos - SP
T. 55 (11) 4573-0269
Campinas
Av. Dr. José Bonifácio C. Nogueira, 214
Salas 438 / 440 - Jardim Madalena
13091 611 - Campinas - SP
T. 55 (11) 4573-0269
Manaus
Av. Jornalista Humberto
Calderaro Filho, 455
Salas 603 / 604 - Adrianópolis
69057 015 - Manaus - AM
T. 55 (92) 3090-1550
3508-3688