Embed Size (px)
Citation preview
A functionalised nickel cyclam catalyst for CO2 reduction: electrocatalysis,
semiconductor surface immobilisation and light-driven electron transfer
Gaia Neri,a,b
James J. Walsh,a,b
Calum Wilson,b Anna Reynal,
c Jason Y. C. Lim,
c Li Xaoe,
c
Andrew J. P. White,c Nicholas J. Long,
c James R. Durrant
c and Alexander J. Cowan
b
Electronic supplementary information
Contents:
1. Experimental
1.1 Materials
1.2 Apparatus
1.3 Synthesis of catalysts
1.4 Film preparation
1.5 Electrocatalysis
2. Catalyst Characterisation
2.1 CV of solution phase of [Ni(cyclam-CO2H)]2+
on GCE
2.2 CV of solution phase of [Ni(cyclam-CO2H)]2+
on HMDE under argon
2.3 Scan rate dependence on HMDE
2.4 CPE of [Ni(cyclam-CO2H)]2+
on Hg-Au amalgam
2.5 Spectroscopic characterization of [Ni(cyclam-CO2H)]2+
2.6 Crystallographic data
3. Film characterization
3.1 TiO2 cyclic voltammetry
3.2 Adsorption experiments
3.3 XRD and SEM of TiO2, ZrO2 and Ti0.8Zr0.2O2 films
Electronic Supplementary Material (ESI) for Physical Chemistry Chemical Physics.This journal is © the Owner Societies 2014
3.4 Spectroelectrochemistry of TiO2 and Ti0.8Zr0.2O2 films
3.5 Ti0.8Zr0.2O2 TAS and spectroelectrochemical data
1. Experimental:
1.1 Materials: 1,4,8,11-tetraazacyclotetradecane-6-carboxylic acid was purchased from
Chematech. All other starting materials including 4,8,11-tetraazacyclotetradecane,
NiCl2.6H2O and solvents for the synthesis were purchased from Sigma Aldrich, Fisher
Scientific or VWR and were used without further purification unless otherwise specified.
Milli-Q water (18.2 MΩ) was used for all aqueous solutions. CO2 and argon (CP grade) were
purchased from BOC. Helium (N6.0) was purchased from BOC. The calibrant gas for the GC
was a custom ordered mixture of 500 ppm H2 and 200 ppm CO in helium and was purchased
from STG.
1.2 Apparatus: All electrochemistry was performed using a PalmSens3 potentiostat. Gas
chromatography was performed using an Agilent 6890N employing N6 helium as the carrier
gas (5 ml.min-1
). A 5 Å molecular sieve column (ValcoPLOT, 30 m length, 0.53 mm ID) and
a pulsed discharge detector (D-3-I-HP, Valco Vici) were employed. CO and H2 peak areas
were quantified with multiple calibrant gas injections and were re-calibrated daily. ESI-MS
and elemental analyses were performed by the University of Liverpool analytical services.
FTIR samples were prepared by depositing a TiO2 film (vide infra) on a CaF2 slide followed
by dipping in a 2 mM solution of 2 in ethanol for 48 hours. FTIR spectra were recorded with
a Bruker Vertex 70V Fourier-transform infrared spectrometer using a MIR globar source,
KBr beamsplitter and a liquid nitrogen-cooled HgCdTe detector, at a resolution of 2 cm-1
.
ATR-FTIR measurements of the powder were carried out on a Nicolet iS50 FTIR (with iS50
ATR attachment) spectrometer (Thermo Fisher Scientific) using reflectance mode in a N2
filled glove box. Profilometry was measured using an Ambios Technology XP200. UV-Vis
spectra were recorded on a Shimadzu UV-2600 spectrophotometer.
Spectroelectrochemical measurements were performed in a homemade PTFE cell
with quartz windows, using an Autolab potentiostat (PGSTAT12) to apply voltage while
measuring the absorption of the sample with a Perkin Elmer Lambda 35 UV/vis
spectrophotometer. A three-electrode configuration was employed, with a nanostructured
film deposited onto FTO as working electrode, a Pt wire as the counter electrode and a
Ag/AgCl (sat. KCl) reference electrode (E0 = + 0.197 V vs. NHE). The absorption of the
semiconductors as a function of the voltage applied was monitored at λabs = 780 nm,
corresponding to the absorption of electrons in the conduction band of TiO2 and Ti0.8Zr0.2O2.
Scanning electron microscopy (SEM) images were obtained with a Philips XL-30
field emission gun scanning electron microscope. Samples were coated with Au (2 nm) prior
to observation. SEM was used to determine the morphology of the Ti0.8Zr0.2O2 particles and
films. The thickness of the mesoporous nanostructured films was 4 μm, measured by
profilometry (Tencor Instruments). The Ti0.8Zr0.2O2 particles had a diameter of ~ 20 nm. X-
Ray diffraction (XRD) measurements were made on a Philips PW1710 diffractometer with
monochromatic Cu radiation.
The microsecond-second transient absorption decays were measured using a Nd:YAG
laser (Big Sky Laser Technologies Ultra CFR Nd:YAG laser system, 6 ns pulse width). The
third harmonic of the laser, corresponding to 355 nm, at a frequency of 1 Hz, was used as the
excitation pulse. Typical excitation densities of 350 μJ/cm2 were used, unless otherwise
stated. A liquid light guide with a diameter of 0.5 cm was used to transmit the laser pulse to
the sample. The probe light source was a tungsten lamp (Bentham IL1 tungsten lamp) and the
probing wavelength was selected by using a monochromator OBB-2001 dual grating, Photon
Technology International) placed prior to the sample. Transient absorption data were
collected with a Si photodiode (Hamamatsu S3071). The information was passed through an
amplifier box (Costronics) and recorded using a Tektronics TDS 2012c oscilloscope
(microsecond to millisecond timescale) and a National Instruments (NI USB-6211) DAQ
card (millisecond to second timescale). The decays observed are the average between 500 and
1000 laser pulses. The data was processed using home-built software based on Labview.
1.3 Synthesis of catalysts: [Ni(cyclam)]Cl2 (1) was prepared according to literature
procedures.1
[Ni(cyclam-CO2H)]Cl2 (2): NaHCO3 (250 mg, 3 mmol) was added to a solution of 1,4,8,11-
tetraazacyclotetradecane-6-carboxylic acid (130 mg, 0.5 mmol) in water (10 ml). When gas
evolution had stopped, NiCl2∙H2O (130 mg, 0.55 mmol) was added. The mixture turned
orange in a matter of minutes, and was stirred at room temperature for two hours. The solvent
was evaporated to dryness under reduced pressure. The residual solid was dissolved in
ethanol (20 ml) and the pale-green powder was filtered off, to give a light purple solution.
The solvent was evaporated to dryness and the mauve, crystalline solid thus obtained was
dried under vacuum overnight. Obtained: 83 mg, yield 45 %; ATR-IR: 3184 (br), 2915,
2856, 1580 (s), 1451, 1400, 1390, 1365, 1090, 945, 879 cm-1
; ESI-MS: 301 [M+-2Cl]; CHN
microanalysis: Anal. calcd. for C11H24Cl2N4NiO2.0.5H2O
.0.5C2H5OH: C, 35.50; H, 6.95; N,
13.80. Found: C, 35.45; H, 6.68; N, 14.03.
1.4 Film preparation: Films for electrochemistry: Anatase TiO2 films2 were prepared by
depositing TiO2 colloidal paste (average particle diameter = 20 nm) on fluorine-doped tin
oxide (FTO) slides. The slides were sonicated in ethanol for 20 minutes before deposition.
The paste was deposited on the films and spread with a glass rod. The thickness was
controlled by using scotch tape and was measured via profilometry to be an average of 3 μm.
The films were allowed to dry before the slides were heated at 450°C for 30 minutes. The
slides were cut so that the geometric surface area of the TiO2 films was 1 cm2.
Films for TAS: Anatase TiO2 and Ti0.8Zr0.2O2 films were deposited onto microscope or
fluorine-doped tin oxide (FTO) coated glass from their respective colloidal pastes using the
doctor-blading technique and calcined in a furnace at 450°C for 30 min. The anatase TiO2
paste was prepared as described in the literature.2
Ti0.8Zr0.2O2 colloidal paste was prepared as
follows:3 Acetic acid (2.4 g) and titanium isopropoxide (Ti(iPrO)4, 10.53 mL), were mixed
under nitrogen with vigorous stirring (700 rpm) until a pale yellow colour appeared.
Zr(iPrO)4 (Zr(iPrO)4–IPA, 3.45 g) pre-dissolved in 16 mL anhydrous isopropanol solution
was added. After stirring for 10 min, the mixture was poured into a conical flask containing
63 mL of 0.1 M HNO3 solution at room temperature. The resulting milky mixed oxide
suspension was subsequently stirred at 80°C for 8 h. Finally, the mixture was poured into a
Teflon inlet inside a stainless steel reactor and heated at 240°C for 12 h. Polyethylene glycol
(PEG) 20,000 (50% of Ti1-xZrxO2 by weight) was added to the above colloidal solution to
prevent subsequent film cracking during heat treatment and to enhance film porosity.
Immobilization of the catalyst on the TiO2 films was obtained by dip-coating the
slides in a 2 mM solution of 2 in EtOH for 48 hours, followed by thorough rinsing with
ethanol. The adsorption of the catalyst was monitored by UV-Vis spectroscopy.
1.5 Electrocatalysis: The electrolyte used for aqueous electrochemistry was NaClO4. The
solutions were adjusted to pH 5 by addition of either NaOH or HClO4. TiO2 film
electrochemistry was carried out in dry acetonitrile (spectrophotometric grade, ≥ 99.5 %,
Sigma Aldrich) with tetra-n-butylammonium hexafluorophosphate, (But)4NPF6, as the
supporting electrolyte. Cyclic voltammograms of the catalyst in solution were carried out in a
pear-shaped flask with a hanging mercury drop working electrode (geometric surface area =
0.023 cm2, measured by averaging the weight of several drops and accounting for the density
of mercury), or a glassy carbon disk working electrode (BASi, geometric surface area =
0.0717 cm2). A Pt coil was used as the counter electrode and a Ag/AgCl (3 M NaCl) as the
reference electrode (BASi). The flask was purged with either argon or CO2 for 20 minutes
prior to experiments. Controlled potential electrolysis (CPE) was performed in a custom
made pyrex H-cell with the two compartments separated by a fine glass frit. The working
electrode was a mercury/gold amalgam wire freshly prepared for each experiment. A 80 x 0.5
mm gold wire (Goodfellow) was polished with fine grit polishing pad (BASi) and rinsed with
water and acetone. When dry, it was dipped in a mercury pool for 3 minutes and the excess
mercury was removed. The geometric surface area of the electrode was estimated to be ~ 2.54
cm2, approximately half of which was submerged in the electrolyte solution during
experiments. The wire was recovered after each experiment by dipping the electrode in
concentrated nitric acid for 30 seconds and rinsing with water several times and then with
acetone. The counter electrode was kept in the second compartment to minimise re-oxidation
of CO or other reaction products. Both compartments were magnetically stirred throughout
the CPE reaction. Results presented are based on an average of at least two independent
measurements, with typical variability of ~ ± 10 % in product yields. The Faradaic
efficiencies (FE) achieved were calculated by taking the measured product yields (by GC
headspace analysis) and charge passed (Q) and accounting for the requirement of 2 electrons
to produce one CO molecule.
𝐹𝐸𝐶𝑂 (%) =
[
CO (𝑚𝑜𝑙)
[𝑄(𝐶)
2 × 96485 (𝐶 𝑚𝑜𝑙−1)⁄ ]
]
× 100
𝑇𝑂𝑁𝐶𝑂 = CO (𝑚𝑜𝑙)
𝑒𝑙𝑒𝑐𝑡𝑟𝑜𝑎𝑐𝑡𝑖𝑣𝑒 𝑐𝑎𝑡𝑎𝑙𝑦𝑠𝑡 (𝑚𝑜𝑙)
2. Catalyst Characterisation
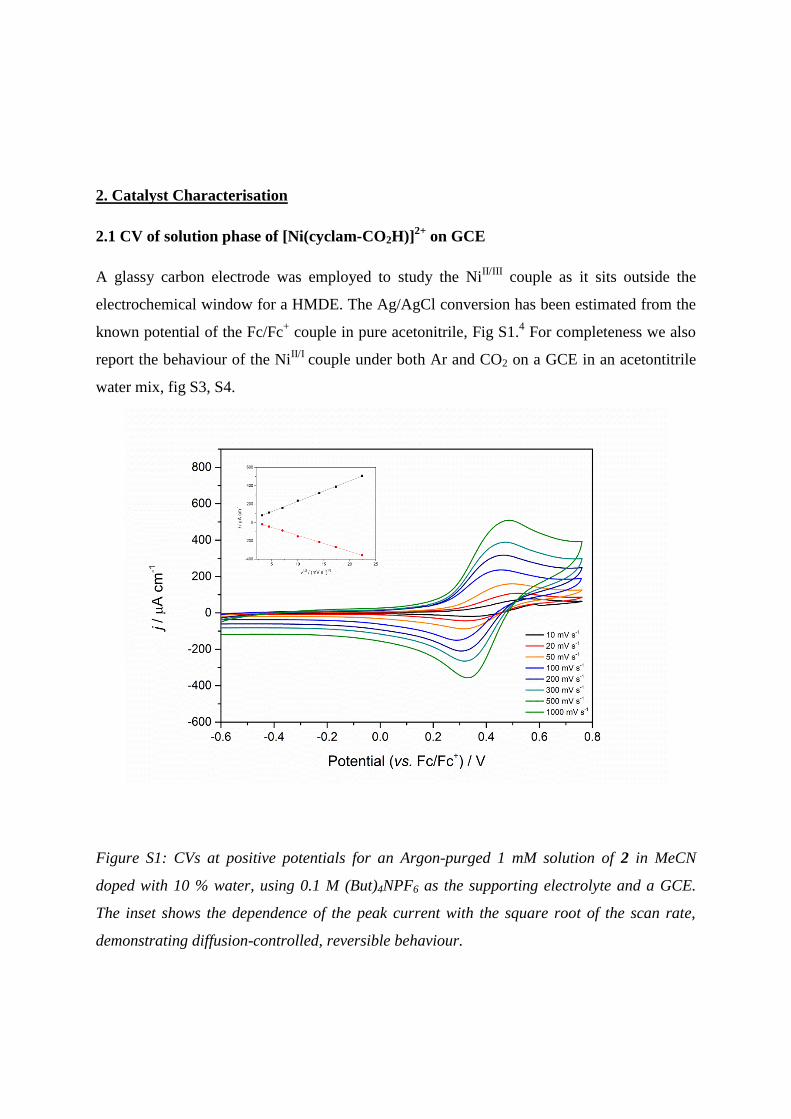
2.1 CV of solution phase of [Ni(cyclam-CO2H)]2+
on GCE
A glassy carbon electrode was employed to study the NiII/III
couple as it sits outside the
electrochemical window for a HMDE. The Ag/AgCl conversion has been estimated from the
known potential of the Fc/Fc+ couple in pure acetonitrile, Fig S1.
4 For completeness we also
report the behaviour of the NiII/I
couple under both Ar and CO2 on a GCE in an acetontitrile
water mix, fig S3, S4.
Figure S1: CVs at positive potentials for an Argon-purged 1 mM solution of 2 in MeCN
doped with 10 % water, using 0.1 M (But)4NPF6 as the supporting electrolyte and a GCE.
The inset shows the dependence of the peak current with the square root of the scan rate,
demonstrating diffusion-controlled, reversible behaviour.
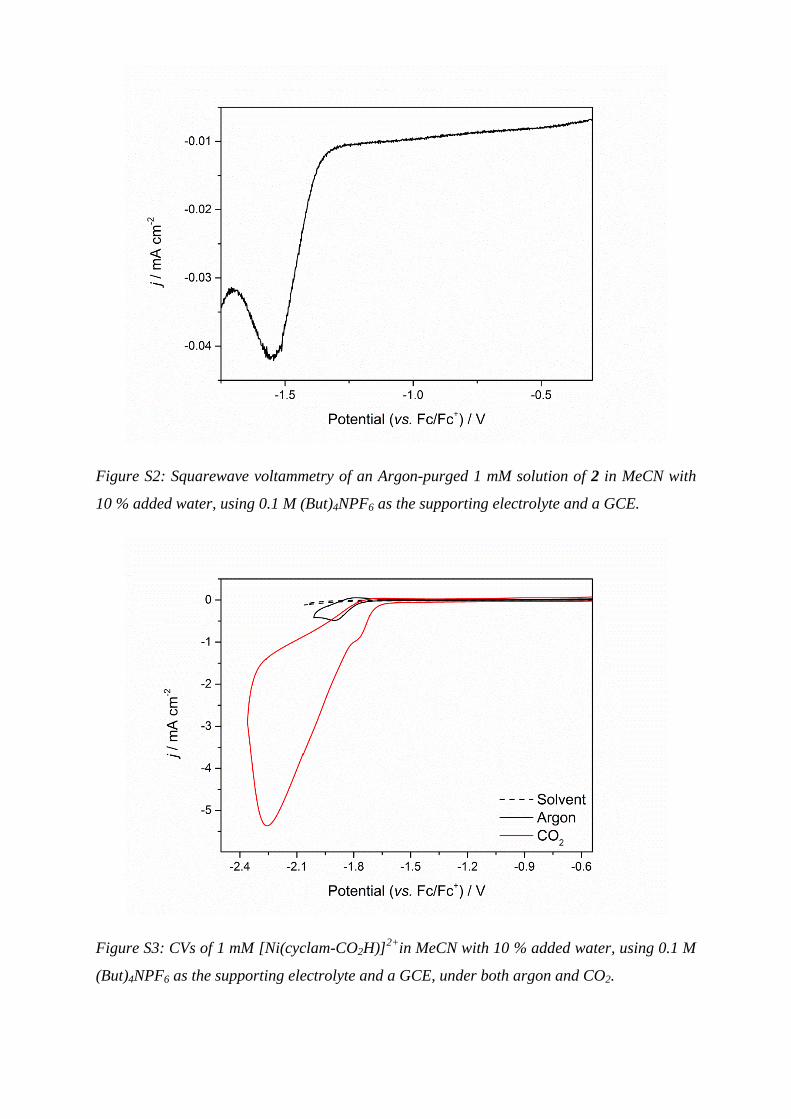
Figure S2: Squarewave voltammetry of an Argon-purged 1 mM solution of 2 in MeCN with
10 % added water, using 0.1 M (But)4NPF6 as the supporting electrolyte and a GCE.
Figure S3: CVs of 1 mM [Ni(cyclam-CO2H)]2+
in MeCN with 10 % added water, using 0.1 M
(But)4NPF6 as the supporting electrolyte and a GCE, under both argon and CO2.
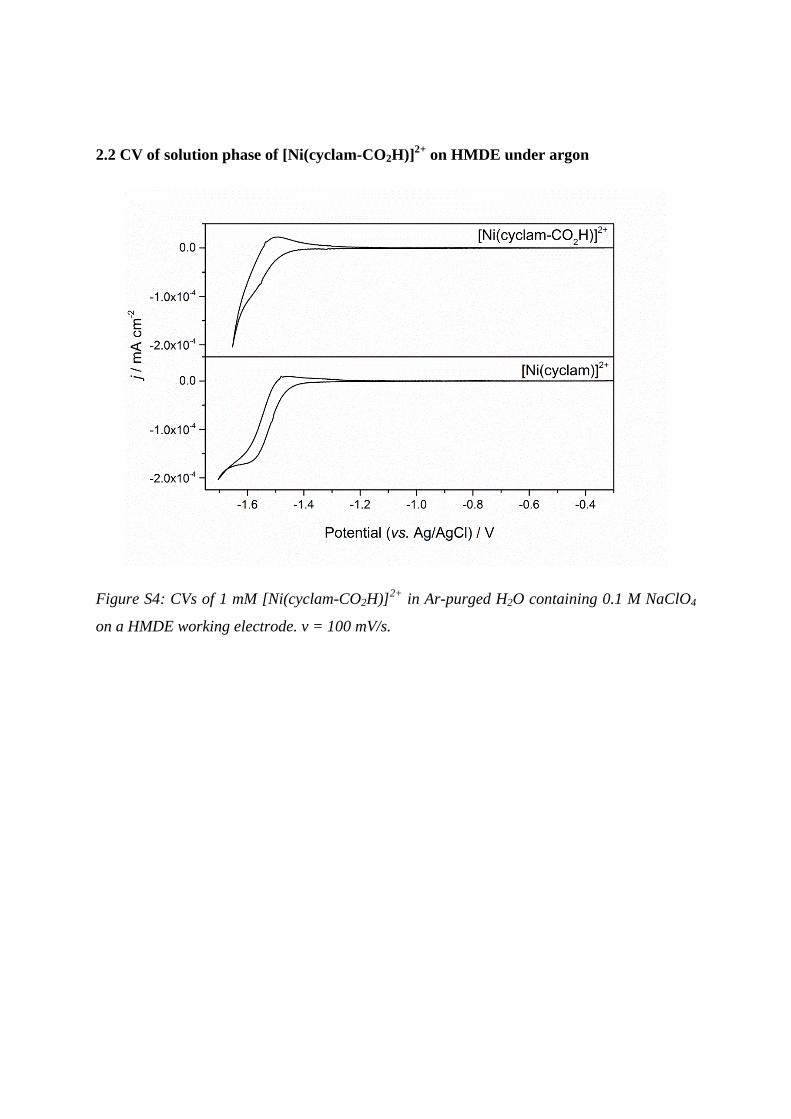
2.2 CV of solution phase of [Ni(cyclam-CO2H)]2+
on HMDE under argon
Figure S4: CVs of 1 mM [Ni(cyclam-CO2H)]2+
in Ar-purged H2O containing 0.1 M NaClO4
on a HMDE working electrode. v = 100 mV/s.
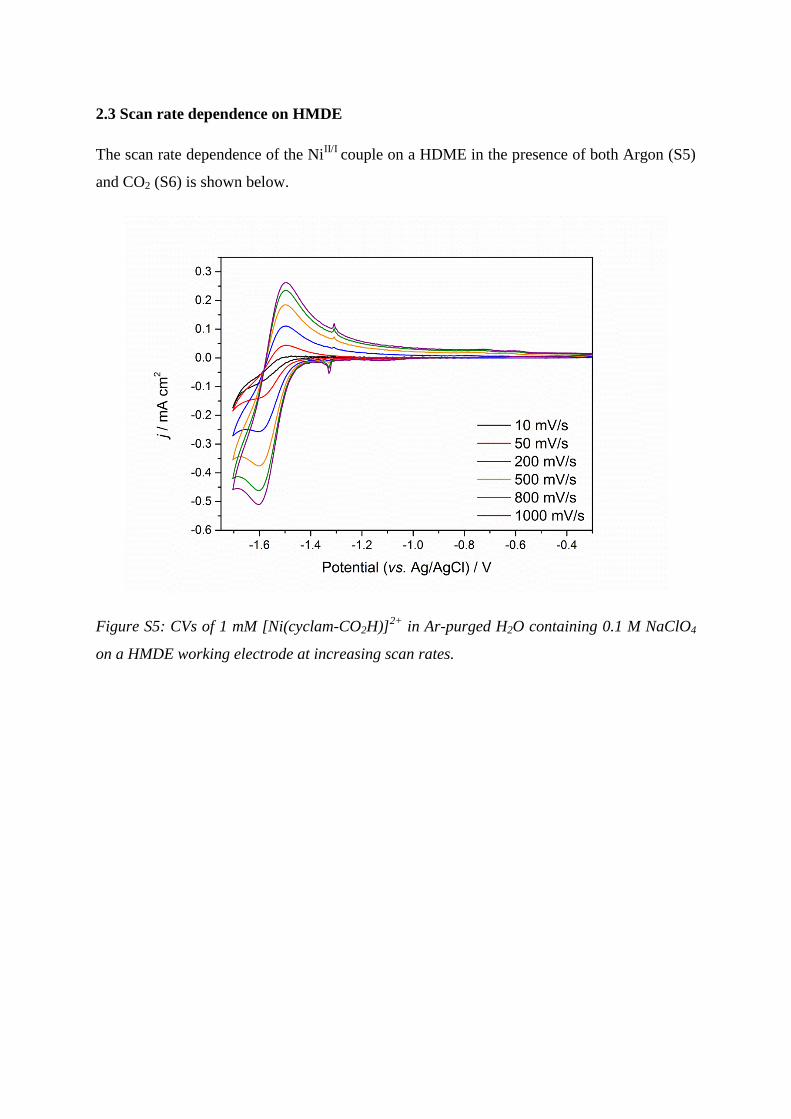
2.3 Scan rate dependence on HMDE
The scan rate dependence of the NiII/I
couple on a HDME in the presence of both Argon (S5)
and CO2 (S6) is shown below.
Figure S5: CVs of 1 mM [Ni(cyclam-CO2H)]2+
in Ar-purged H2O containing 0.1 M NaClO4
on a HMDE working electrode at increasing scan rates.
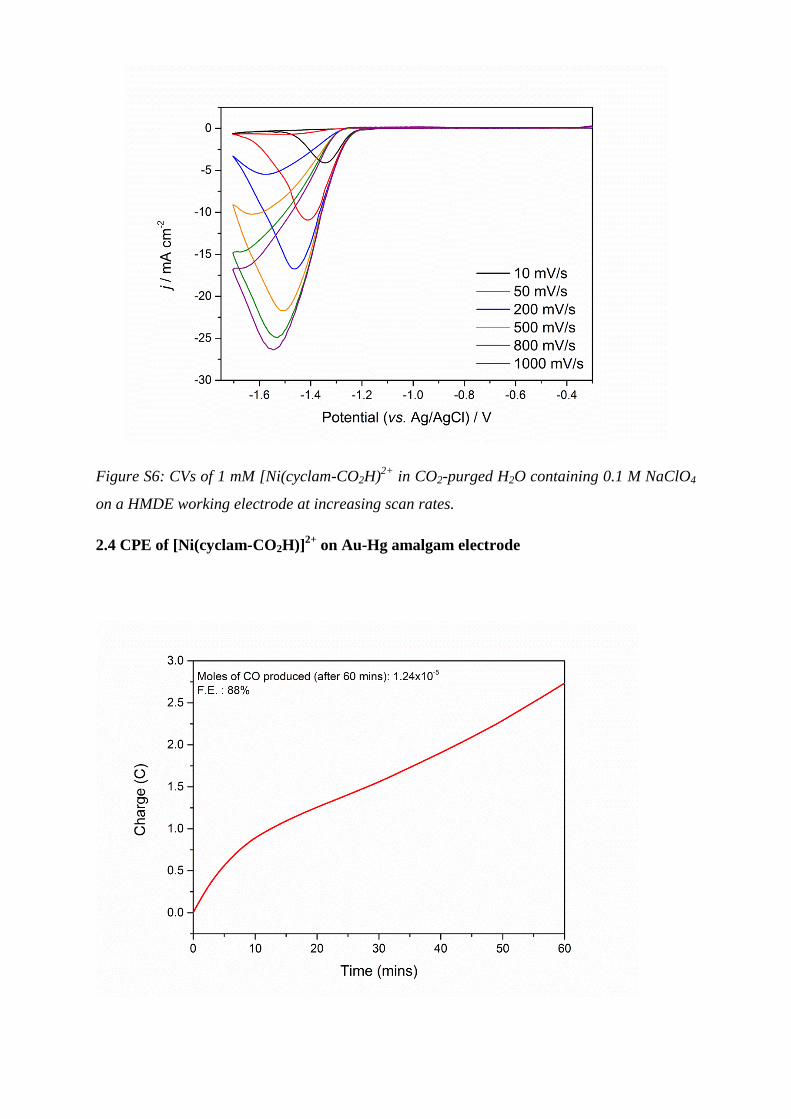
Figure S6: CVs of 1 mM [Ni(cyclam-CO2H)2+
in CO2-purged H2O containing 0.1 M NaClO4
on a HMDE working electrode at increasing scan rates.
2.4 CPE of [Ni(cyclam-CO2H)]2+
on Au-Hg amalgam electrode
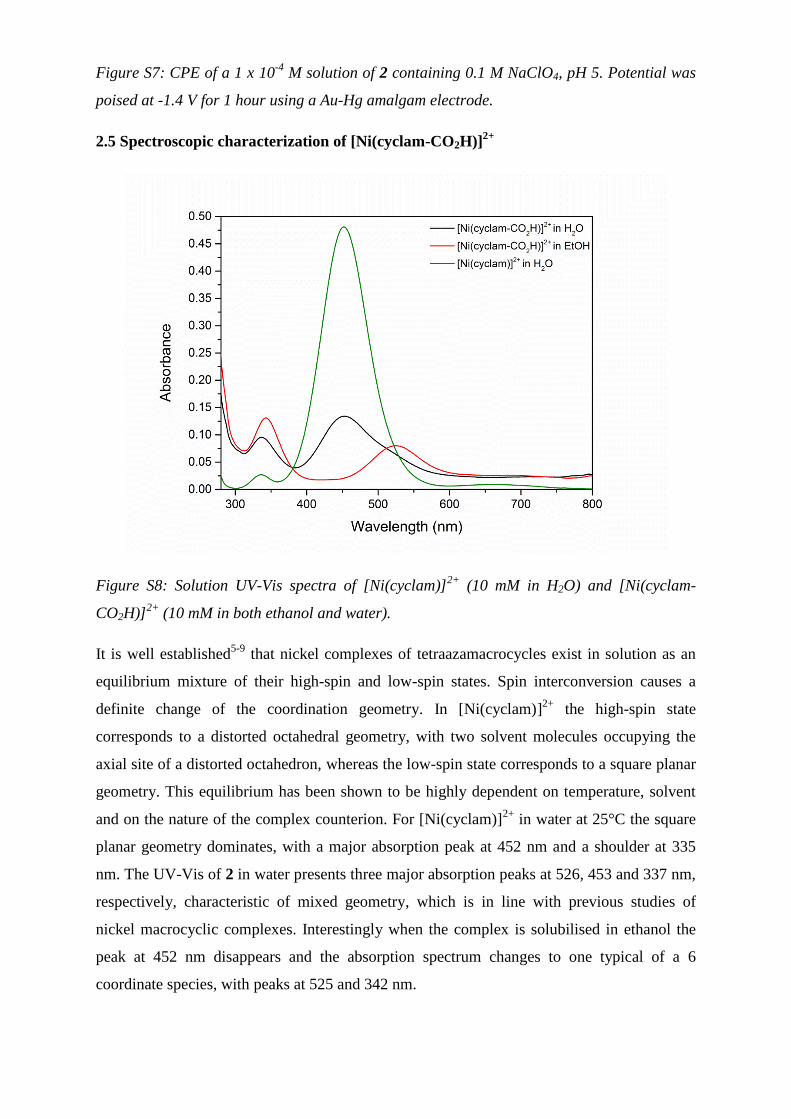
Figure S7: CPE of a 1 x 10⁻⁴
M solution of 2 containing 0.1 M NaClO4, pH 5. Potential was
poised at -1.4 V for 1 hour using a Au-Hg amalgam electrode.
2.5 Spectroscopic characterization of [Ni(cyclam-CO2H)]2+
Figure S8: Solution UV-Vis spectra of [Ni(cyclam)]2+
(10 mM in H2O) and [Ni(cyclam-
CO2H)]2+
(10 mM in both ethanol and water).
It is well established5-9
that nickel complexes of tetraazamacrocycles exist in solution as an
equilibrium mixture of their high-spin and low-spin states. Spin interconversion causes a
definite change of the coordination geometry. In [Ni(cyclam)]2+
the high-spin state
corresponds to a distorted octahedral geometry, with two solvent molecules occupying the
axial site of a distorted octahedron, whereas the low-spin state corresponds to a square planar
geometry. This equilibrium has been shown to be highly dependent on temperature, solvent
and on the nature of the complex counterion. For [Ni(cyclam)]2+
in water at 25°C the square
planar geometry dominates, with a major absorption peak at 452 nm and a shoulder at 335
nm. The UV-Vis of 2 in water presents three major absorption peaks at 526, 453 and 337 nm,
respectively, characteristic of mixed geometry, which is in line with previous studies of
nickel macrocyclic complexes. Interestingly when the complex is solubilised in ethanol the
peak at 452 nm disappears and the absorption spectrum changes to one typical of a 6
coordinate species, with peaks at 525 and 342 nm.
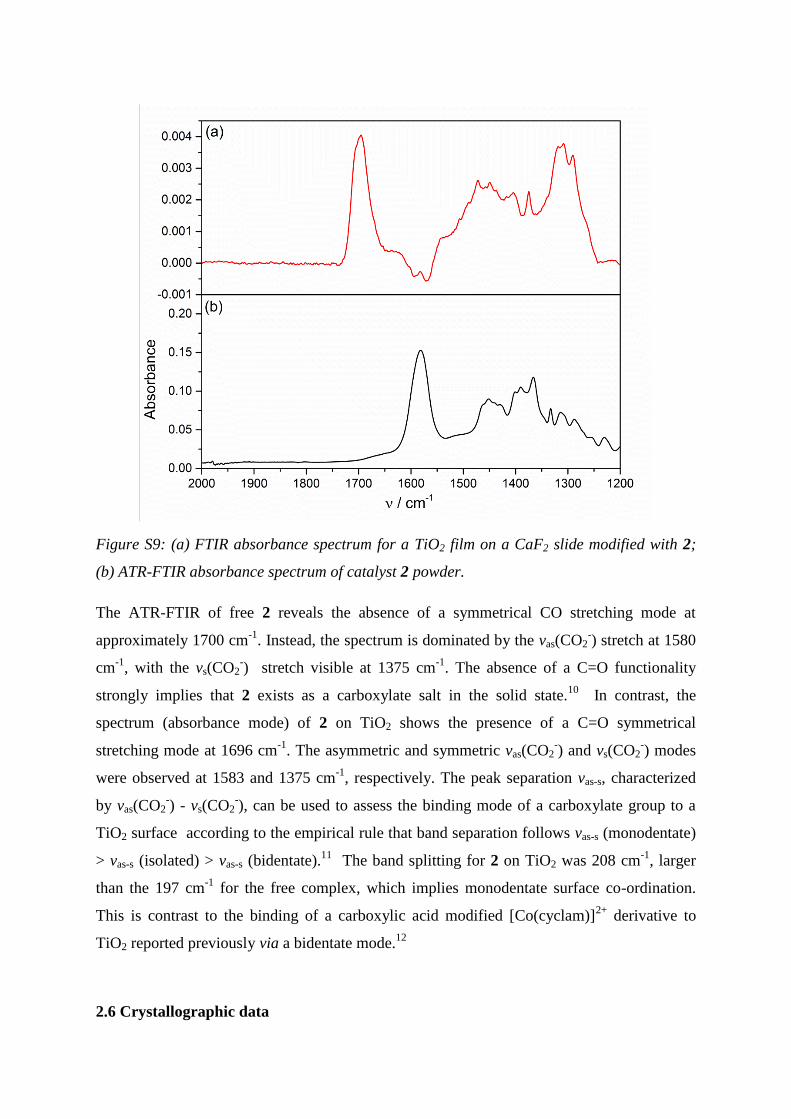
Figure S9: (a) FTIR absorbance spectrum for a TiO2 film on a CaF2 slide modified with 2;
(b) ATR-FTIR absorbance spectrum of catalyst 2 powder.
The ATR-FTIR of free 2 reveals the absence of a symmetrical CO stretching mode at
approximately 1700 cm-1
. Instead, the spectrum is dominated by the vas(CO2-) stretch at 1580
cm-1
, with the vs(CO2-) stretch visible at 1375 cm
-1. The absence of a C=O functionality
strongly implies that 2 exists as a carboxylate salt in the solid state.10
In contrast, the
spectrum (absorbance mode) of 2 on TiO2 shows the presence of a C=O symmetrical
stretching mode at 1696 cm-1
. The asymmetric and symmetric vas(CO2-) and vs(CO2
-) modes
were observed at 1583 and 1375 cm-1
, respectively. The peak separation vas-s, characterized
by vas(CO2-) - vs(CO2
-), can be used to assess the binding mode of a carboxylate group to a
TiO2 surface according to the empirical rule that band separation follows vas-s (monodentate)
> vas-s (isolated) > vas-s (bidentate).11
The band splitting for 2 on TiO2 was 208 cm-1
, larger
than the 197 cm-1
for the free complex, which implies monodentate surface co-ordination.
This is contrast to the binding of a carboxylic acid modified [Co(cyclam)]2+
derivative to
TiO2 reported previously via a bidentate mode.12
2.6 Crystallographic data
The X-ray crystal structure of 2
Crystal data for 2: C11H24Cl2N4NiO2·H2O, M = 391.97, monoclinic, P21/n (no. 14), a =
6.66207(9), b = 17.0552(2), c = 15.01109(19) Å, β = 102.4162(13)°, V = 1665.71(4) Å3, Z =
4, Dc = 1.563 g cm–3
, μ(Cu-Kα) = 4.767 mm–1
, T = 173 K, pale purple blocks, Oxford
Diffraction Xcalibur PX Ultra diffractometer; 3260 independent measured reflections (Rint =
0.0239), F2 refinement,
13 R1(obs) = 0.0365, wR2(all) = 0.1031, 2954 independent observed
absorption-corrected reflections [|Fo| > 4σ(|Fo|), 2θmax = 145°], 219 parameters. CCDC
1028579.
The seven N–H and O–H hydrogen atoms in the structure of 2 were found from ΔF maps and
refined freely subject to N–H and O–H distance constraints of 0.90 Å.
3. Film characterization
3.1 TiO2 cyclic voltammetry
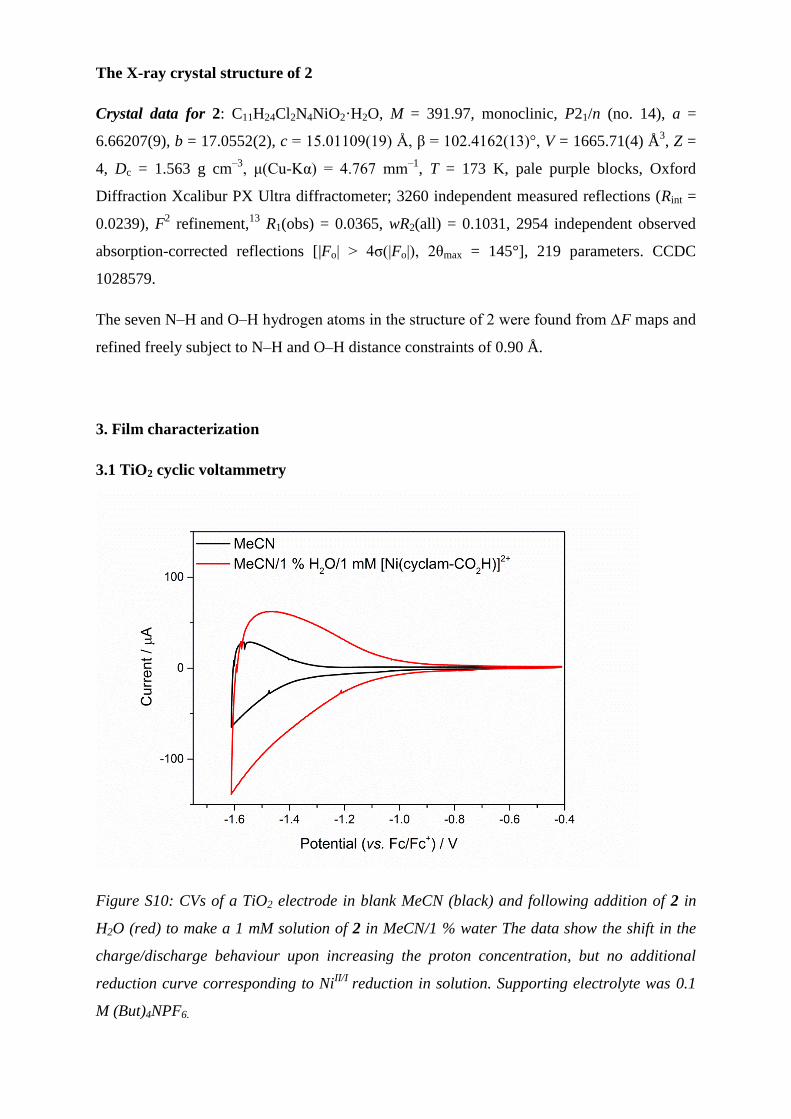
Figure S10: CVs of a TiO2 electrode in blank MeCN (black) and following addition of 2 in
H2O (red) to make a 1 mM solution of 2 in MeCN/1 % water The data show the shift in the
charge/discharge behaviour upon increasing the proton concentration, but no additional
reduction curve corresponding to NiII/I
reduction in solution. Supporting electrolyte was 0.1
M (But)4NPF6.
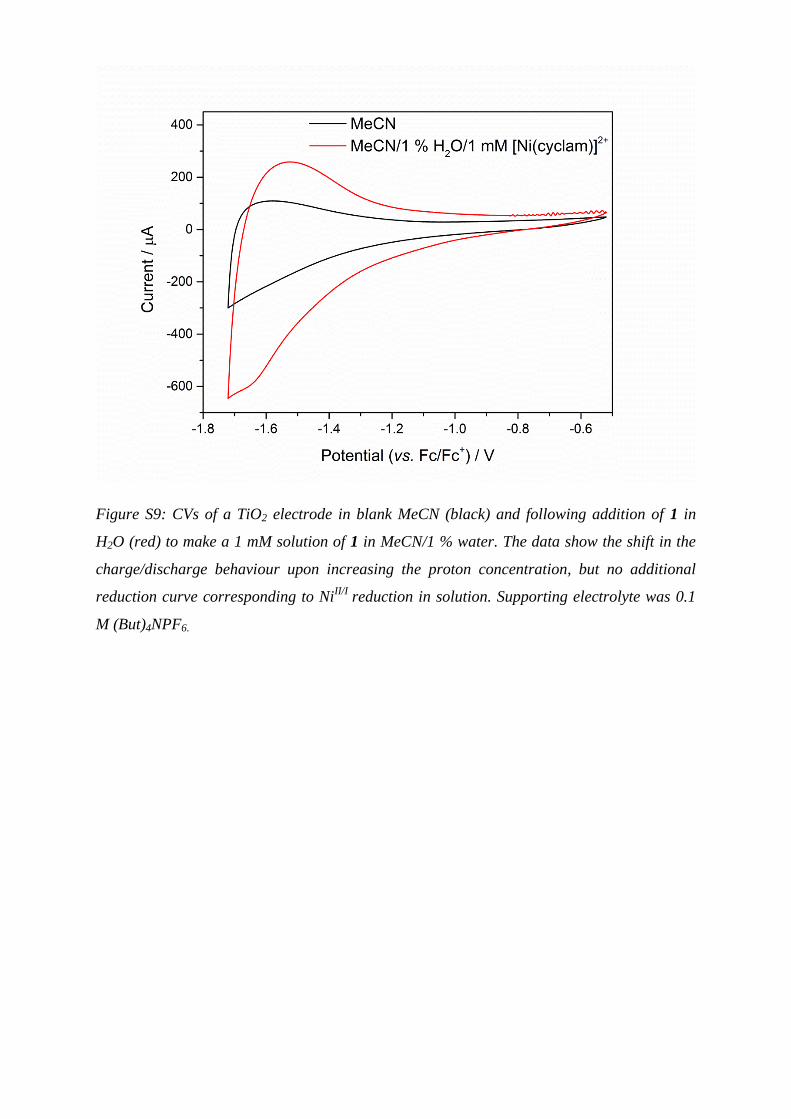
Figure S9: CVs of a TiO2 electrode in blank MeCN (black) and following addition of 1 in
H2O (red) to make a 1 mM solution of 1 in MeCN/1 % water. The data show the shift in the
charge/discharge behaviour upon increasing the proton concentration, but no additional
reduction curve corresponding to NiII/I
reduction in solution. Supporting electrolyte was 0.1
M (But)4NPF6.
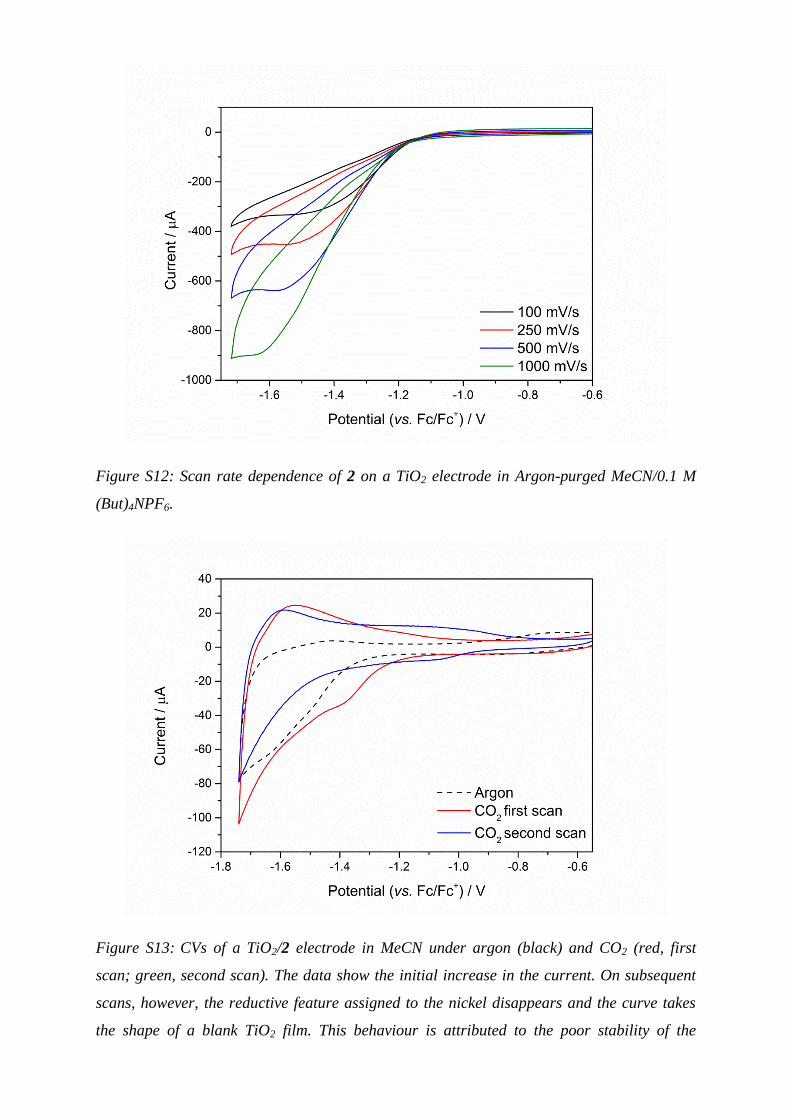
Figure S12: Scan rate dependence of 2 on a TiO2 electrode in Argon-purged MeCN/0.1 M
(But)4NPF6.
Figure S13: CVs of a TiO2/2 electrode in MeCN under argon (black) and CO2 (red, first
scan; green, second scan). The data show the initial increase in the current. On subsequent
scans, however, the reductive feature assigned to the nickel disappears and the curve takes
the shape of a blank TiO2 film. This behaviour is attributed to the poor stability of the
complex bond to the semiconductor under CO2. The supporting electrolyte was 0.1 M
(But)4NPF6.
3.2 Adsorption experiments
The quantity of catalyst adsorbed on the TiO2 surface was calculated using a recently
reported method by soaking a 2-modified film in 1 M NaOH solution for 4 hours and
comparing the UV-Vis to that of a 2 mM solution of 2 in 1 M NaOH.14
For a 6 x 1 cm film
with a thickness of 3 μm the number of molecules adsorbed was found to be 1.7 x 10¹⁷
.14
The
number of TiO2 particles in the film was found by taking into account the average radius of
the nanoparticles and the volume of the film.
The volume of one particle is: 4
3𝜋(10𝑥10−9)3 = 4.2𝑥10−24𝑚3
The volume of the film is 𝐴𝑓𝑖𝑙𝑚 ∙ 𝐿𝑓𝑖𝑙𝑚 ∙ (1 − 𝑃𝑓𝑖𝑙𝑚) = 6𝑥10−4𝑚2 ∙ 3𝑥10−6𝑚 ∙ (1 − 0.6) =
7.2𝑥10−10𝑚3
The ratio between the volume of the film and the volume of one particle thus gives the total
number of particles in the film: #𝑝𝑎𝑟𝑡𝑖𝑐𝑙𝑒𝑠 =7.2𝑥10−10
4.2𝑥10−24 = 1.7𝑥1014
The surface coverage is given by the total number of molecules adsorbed divided by the total
number of nanoparticles in the film: 1.7𝑥1017
1.7𝑥1014 = 1000 𝑚𝑜𝑙𝑒𝑐𝑢𝑙𝑒𝑠/𝑛𝑎𝑛𝑜𝑝𝑎𝑟𝑡𝑖𝑐𝑙𝑒
3.3 XRD and SEM of TiO2, ZrO2 and Ti0.8Zr0.2O2 films
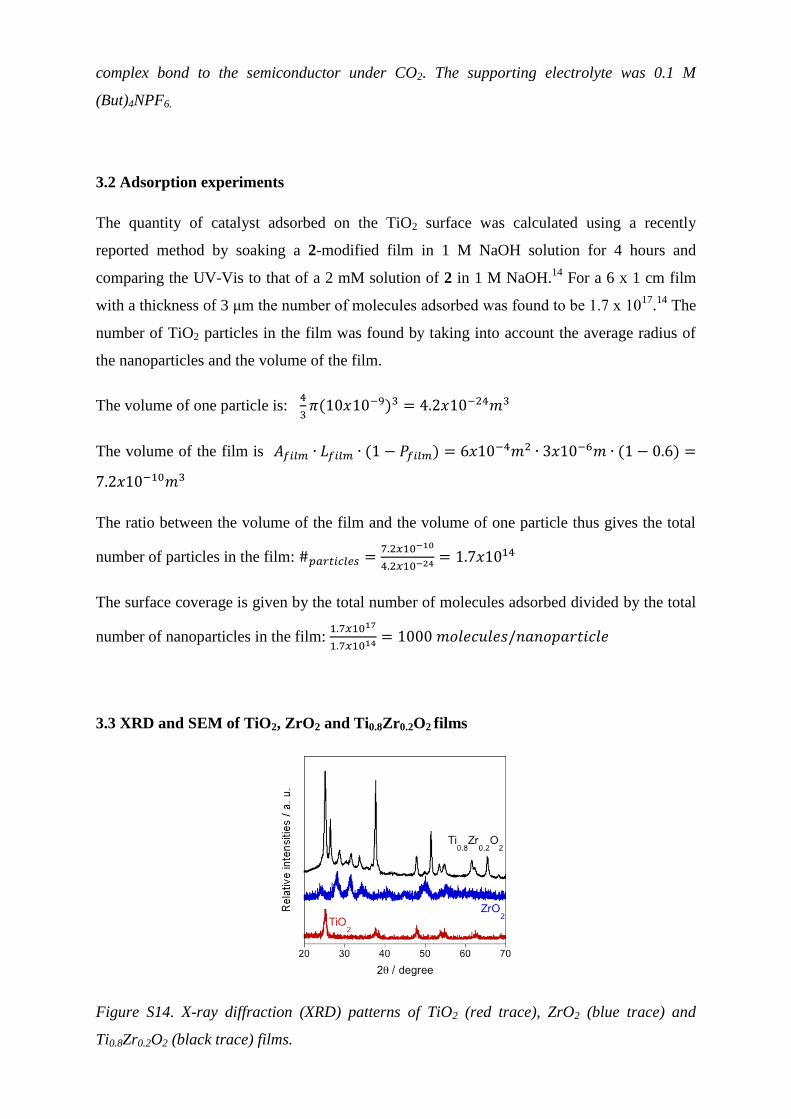
Figure S14. X-ray diffraction (XRD) patterns of TiO2 (red trace), ZrO2 (blue trace) and
Ti0.8Zr0.2O2 (black trace) films.
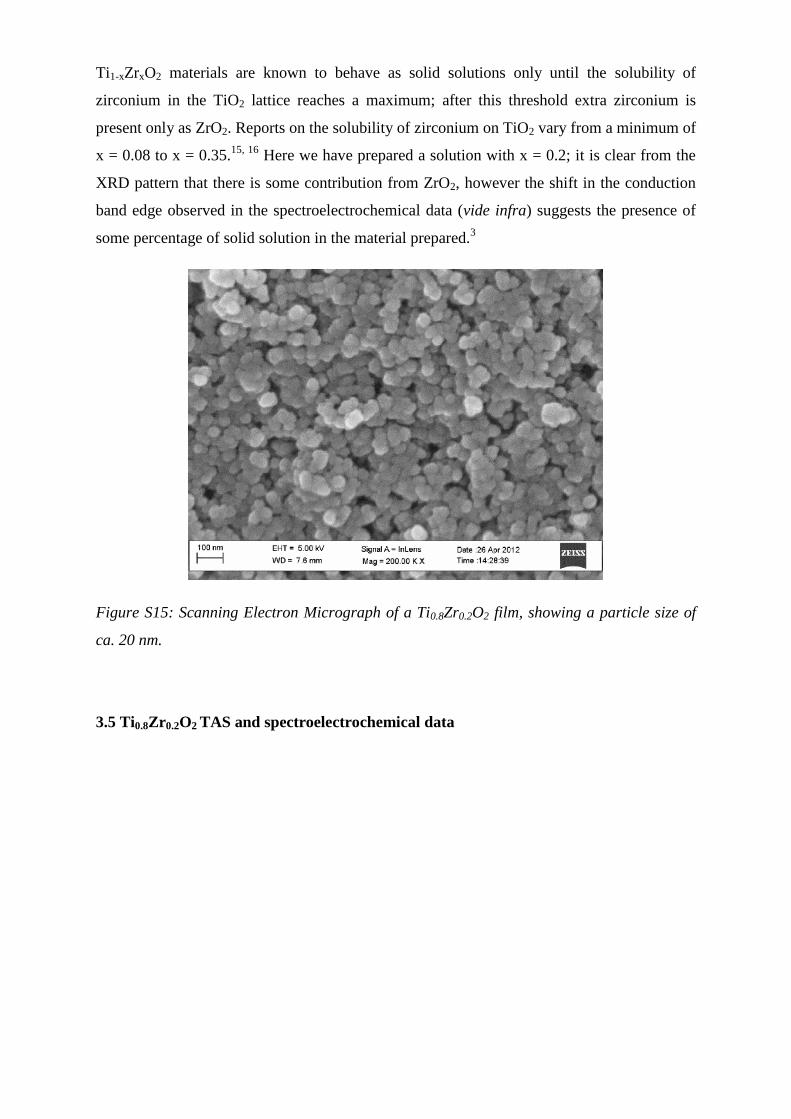
Ti1-xZrxO2 materials are known to behave as solid solutions only until the solubility of
zirconium in the TiO2 lattice reaches a maximum; after this threshold extra zirconium is
present only as ZrO2. Reports on the solubility of zirconium on TiO2 vary from a minimum of
x = 0.08 to x = 0.35.15, 16
Here we have prepared a solution with x = 0.2; it is clear from the
XRD pattern that there is some contribution from ZrO2, however the shift in the conduction
band edge observed in the spectroelectrochemical data (vide infra) suggests the presence of
some percentage of solid solution in the material prepared.3
Figure S15: Scanning Electron Micrograph of a Ti0.8Zr0.2O2 film, showing a particle size of
ca. 20 nm.
3.5 Ti0.8Zr0.2O2 TAS and spectroelectrochemical data
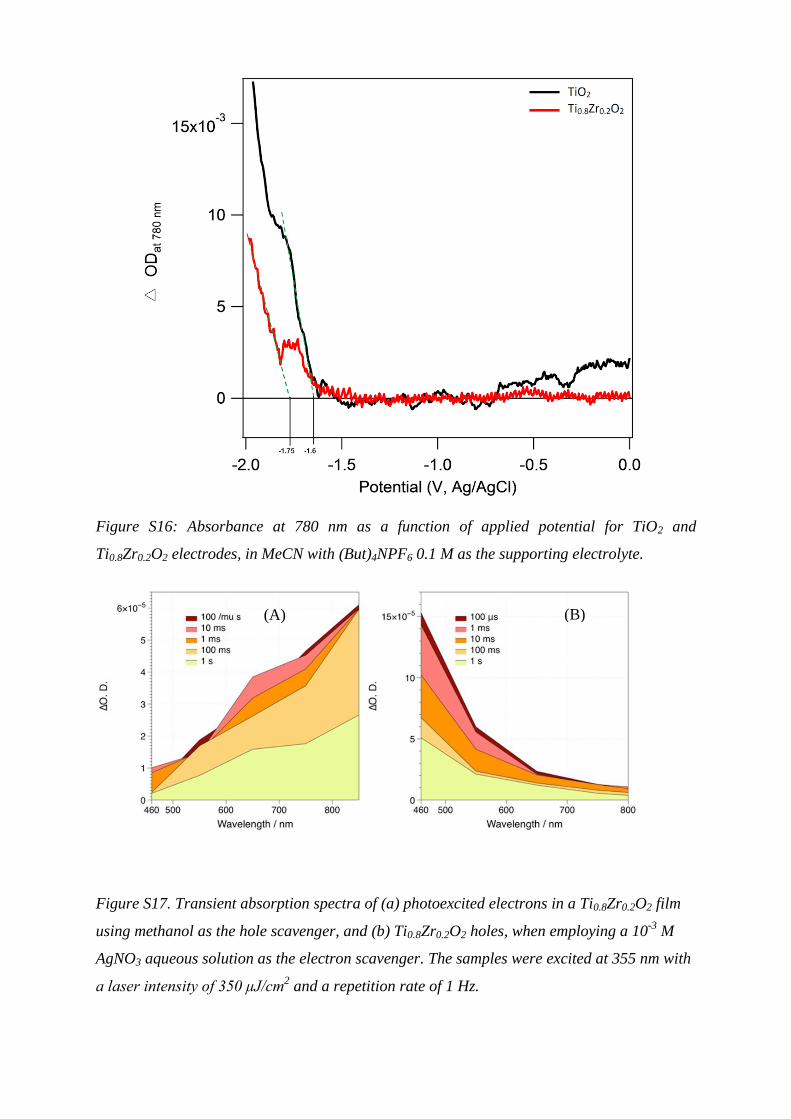
Figure S16: Absorbance at 780 nm as a function of applied potential for TiO2 and
Ti0.8Zr0.2O2 electrodes, in MeCN with (But)4NPF6 0.1 M as the supporting electrolyte.
Figure S17. Transient absorption spectra of (a) photoexcited electrons in a Ti0.8Zr0.2O2 film
using methanol as the hole scavenger, and (b) Ti0.8Zr0.2O2 holes, when employing a 10-3
M
AgNO3 aqueous solution as the electron scavenger. The samples were excited at 355 nm with
a laser intensity of 350 μJ/cm2 and a repetition rate of 1 Hz.
(A) (B)
Semiconductor Conduction Band Edgea
(V Fc/Fc+)
TiO2/2 NiII/I
(V Fc/Fc+)
ΔG
(eV, estimatedb)
t50%
(s)c
nc-TiO2 -2.0 -1.5 -0.5 1.2x10⁻³
TiO0.8Zr0.2 -2.15 -1.5 -0.65 0.8x10⁻³
Table S1: Potentials of electron transfer processes.
a Estimated from the onset of the 780 nm
absorption edge by spectroelectrochemistry in CH3CN/(But)4NPF6 (Figure S16). b
Assuming
that the reduction potential of 2 is not significantly altered upon binding to TiO0.8Zr0.2 when
compared to TiO2. c Rate of photoelectron transfer from semiconductor to molecular catalyst,
measured by TAS (Fig 5).
References
1. J. D. Froehlich and C. P. Kubiak, Inorg. Chem., 2012, 51, 3932-3934.
2. S. Ito, T. N. Murakami, P. Comte, P. Liska, C. Grätzel, M. K. Nazeeruddin and M. Grätzel,
Thin Solid Films, 2008, 516, 4613-4619.
3. M. Durr, S. Rosselli, A. Yasuda and G. Nelles, J Phys Chem B, 2006, 110, 21899-21902.
4. V. V. Pavlishchuk and A. W. Addison, Inorg. Chim. Acta, 2000, 298, 97-102.
5. B. Bosnich, M. L. Tobe and G. A. Webb, Inorg. Chem., 1965, 4, 1109-1112.
6. A. Anichini, L. Fabbrizzi, P. Paoletti and R. M. Clay, Inorg. Chim. Acta, 1977, 24, L21-L23.
7. L. Y. Martin, C. R. Sperati and D. H. Busch, J. Am. Chem. Soc., 1977, 99, 2968-2981.
8. E. J. Billo, P. J. Connolly, D. J. Sardella, J. P. Jasinski and R. J. Butcher, Inorg. Chim. Acta,
1995, 230, 19-28.
9. M. Boiocchi, L. Fabbrizzi, F. Foti and M. Vazquez, Dalton T., 2004, 2616-2620.
10. D. A. Long, Journal of Raman Spectroscopy, 2004, 35, 905-905.
11. C. Bauer, G. Boschloo, E. Mukhtar and A. Hagfeldt, J. Phys. Chem. B, 2002, 106, 12693-
12704.
12. P. V. Bernhardt, G. K. Boschloo, F. Bozoglian, A. Hagfeldt, M. Martinez and B. Sienra, New
Journal of Chemistry, 2008, 32, 705-711.
13. G. Sheldrick, Acta Crystallographica Section A, 2008, 64, 112-122.
14. A. Reynal, J. Willkomm, N. M. Muresan, F. Lakadamyali, M. Planells, E. Reisner and J. R.
Durrant, Chem. Commun., 2014, 50, 12768-12771.
15. J. C. Yu, J. Lin and R. W. M. Kwok, J. Phys. Chem. B, 1998, 102, 5094-5098.
16. B. F. Gao, Y. Ma, Y. A. Cao, Z. J. Gu, G. J. Zhang and J. N. Yao, Chinese J. Chem., 2007,
25, 484-489.


![Alkynyl-functionalised and linked bicyclo[1.1.1]pentanes of ...1 Electronic Supplementary Information Alkynyl-functionalised and linked bicyclo[1.1.1]pentanes of group 14 Timo Augenstein,](https://img.dokumen.tips/doc/110x75/60b6afdb534a927c0d375c0a/alkynyl-functionalised-and-linked-bicyclo111pentanes-of-1-electronic-supplementary.jpg)