Embed Size (px)
Citation preview
Journal of Computer Science 10 (1): 178-189, 2014 ISSN: 1549-3636 © 2014 Science Publications doi:10.3844/jcssp.2014.178.189 Published Online 10 (1) 2014 (http://www.thescipub.com/jcs.toc)
Corresponding Author: Sundaradhas Selva Nidhyananthan, Department of Electronics and Communication Engineering, Mepco Schlenk Engineering College, Sivakasi, India
178 Science Publications
JCS
A FRAMEWORK FOR MULTILINGUAL TEXT- INDEPENDENT SPEAKER IDENTIFICATION SYSTEM
Sundaradhas Selva Nidhyananthan and Ramapackiam Shantha Selva Kumari
Department of Electronics and Communication Engineering, Mepco Schlenk Engineering College, Sivakasi, India
Received 2013-07-08; Revised 2013-08-24; Accepted 2013-11-13
ABSTRACT
This article evaluates the performance of Extreme Learning Machine (ELM) and Gaussian Mixture Model (GMM) in the context of text independent Multi lingual speaker identification for recorded and synthesized speeches. The type and number of filters in the filter bank, number of samples in each frame of the speech signal and fusion of model scores play a vital role in speaker identification accuracy and are analyzed in this article. Extreme Learning Machine uses a single hidden layer feed forward neural network for multilingual speaker identification. The individual Gaussian components of GMM best represent speaker-dependent spectral shapes that are effective in speaker identity. Both the modeling techniques make use of Linear Predictive Residual Cepstral Coefficient (LPRCC), Mel Frequency Cepstral Coefficient (MFCC), Modified Mel Frequency Cepstral Coefficient (MMFCC) and Bark Frequency Cepstral Coefficient (BFCC) features to represent the speaker specific attributes of speech signals. Experimental results show that GMM outperforms ELM with speaker identification accuracy of 97.5% with frame size of 256 and frame shift of half of frame size and filter bank size of 40. Keywords: GMM, ELM, MFCC, Filter Bank, Multi Lingual Speaker Identification
1. INTRODUCTION
In automatic speaker recognition, an algorithm plays the listener’s role in decoding the speech into a hypothesis concerning the speaker’s identity. Speaker identification is the task of the determination of a given speaker out of a set of known speakers using the speaker specific characteristics extracted from their voice signal. Voiced speech is produced when the vcal folds vibrate during airflow from lungs to vocal cords and the unvoiced speech is produced when these vocal folds does not vibrate (Justin and Vennila, 2013). Only the voiced segment contains more information of the vocal source production than unvoiced speech (Salam et al., 2009). Speaker identification involves extraction of the acoustic features of the speakers, model the features and perform the identity test. The acoustic patterns of acoustic features reflect both anatomy and learned behavioral
patterns. The speaker identification process consists of two phases training and testing. During training, the speaker’s voice is recorded and typically a number of features are extracted to form a voice print model. This is called as enrollment. In the testing phase, a speech sample or utterance is compared against multiple voice print models in the feature database and the most likelihood pattern is identified. If the text uttered is different for enrollment and verification this is called text-independent speaker identification otherwise it is called text-dependant speaker identification.
The proposed speaker identification task uses LP residual Cepstral Coefficients, MFCC features and its variants. LP (Prathosh et al., 2013) analysis of speech assumes the source-filter model, means adaptively filtering the formants required to synthesize the speech (Tiun et al., 2012). The LP residual signal could be derived even for noisy signals. The residual signal is used
S.S. Nidhyananthan and R.S. Selva Kumari / Journal of Computer Science 10 (1): 178-189, 2014
179 Science Publications
JCS
to excite the time-varying all-pole filter to generate the enhanced speech. MFCC features show discriminative ability (Hasan et al., 2012) for the coefficients that is important in Speaker Identification applications. Analysis of speaker identification with features extracted for different frame sizes (Jayanna and Prasanna, 2009) helps in improving the speaker identification accuracy. Various technologies used to process and store voice prints include frequency estimation, Hidden Markov Models (HMM) (Justin and Vennila, 2013) Gaussian Mixture Models (GMM) (Quiros and Wilson, 2012), Student’s-t mixture model (tMM), pattern matching algorithms, Neural Networks (NN) (Al-Ani et al., 2007), matrix representation, Vector Quantization (VQ) and wavelet transform. Extreme Learning Machine (ELM) modeling technique is used to provide better performance than the traditional tuning-based learning methods (Bharathi and Natarajan, 2011). It provides the best generalization performance at extremely fast learning speed. It is a new learning algorithm based on Single hidden Layer Feed forward neural Networks. Also GMM performs better for text-independent speaker identification. The Input weights and hidden neurons or kernel parameters are not necessarily tuned.
This study focuses on both text independent and multilingual speaker identification, where there is no constraint on what the speaker speaks and what language the speaker speaks. The languages that are used in this work include Tamil, English, Telugu and Hindi. This study aims at: • Achieving higher speaker identification accuracy
with varying frame and filter bank sizes • Increasing the speed of speaker identification
performance using Extreme learning machine • Analyzing multilingual speaker identification
This study is organized as follows: Section 2 describes the materials and methods. Section 3 gives results of various methods. In section 4 results are discussed elaborately. Finally Section 6 concludes the work.
2. MATERIALS AND METHODS
2.1. Database Description
The materials used are speech databases. The database used for this work encompasses both synthesized voices from jyamagis (jyamagis homepages) tool kit and recorded voices. The total size of the speaker data base is 50 which consisting of recorded speech of 25
speakers and synthesized speech of another 25 speakers from (jyamagis) toolkit. The speech is recorded using a high quality microphone in a sound proof booth at a sampling frequency of 16 kHz, with a session interval of one month between recordings. This speech is designed to have a rich phonetic content in four different languages Tamil, English, Telugu and Hindi and four sessions for each language are recorded. Gold wave software is used to record the voices in mono recording mode with a sampling frequency of 16 KHz. The recorded voice is encoded using PCM encoding. The voices are generated from the ‘jyamagis-the center for speech technology and research’ for 25 speakers belonging to 6 different categories of Scottish, English and American male and female.
2.2. Feature Extraction
After preprocessing the speech signal by silence removal, wavelet based denoising, pre-emphasis, frame blocking and windowing processes, the features of the speech signal are extracted. Transforming the input data into the set of features is called feature extraction. In this work LPRCC, MFCC, MMFCC and BFCC feature extraction techniques are used.
2.3. Residual Cepstral Coefficient
LP analysis of speech estimates a residual, representing the excitation source of the speaker. The prediction error is also referred to as residual signal. In the linear predictive modeling of speech, a speech sample s(n) is approximated as the weighted sum of a limited number of past samples. The residual signal r(n) is obtained for each frame y(n) of the signal s(n). Predicted version for the frame y(n) is y’(n) and is given by Equation 1:
p
kk=1
y'(n)= a y(n - k)∑ (1)
where, ak are LP coefficients for k = 1, 2…,p. p is the length of the signal.
The LP residual signal is given by Equation 2 and 3: r(n)= y(n)- y'(n) (2)
p
kk=1
r(n)= y(n)- a y(n - k)∑ (3)
Weighted LP introduces a temporal weighting of the
squared residual in model coefficient optimization. This study proposes calculating log energies to each frame of the LP residual signal r(n) and subjecting it to the
S.S. Nidhyananthan and R.S. Selva Kumari / Journal of Computer Science 10 (1): 178-189, 2014
180 Science Publications
JCS
Gaussian Mel scale filter bank and Cosine transform to arrive at LP residual Cepstral Coefficients (LPRCC).
2.4. Mel Frequency Cepstral Coefficient
Mel is a unit of pitch. Pairs of sounds perceptually equidistant in pitch are separated by an equal number of mels. Mel frequency of a given signal is given as Equation 4:
fmel (f)= 2595 1+
700
(4)
where, mel (f) is the subjective pitch in mels corresponding to the actual frequency in Hz.
The bandwidth of human speech communication is approximately the frequency range upto 7KHz (Dhanaskodi and Arumugam, 2011), because both the production and perception organs are most efficient at these low frequencies. Here the actual frequency of the speech signal f is considered as 8KZ, assuming high frequency portion of the speech signal is also carrying some minimum amount of speaker specific information.
Mel-Frequency Cepstrum (MFC) is a representation of the short-term power spectrum of a sound, based on a linear cosine transform of a log power spectrum on a nonlinear Mel scale of frequency (Bharathi and Shanthi, 2012). MFCCs are then calculated by taking N point DFT for each frame y(n) as Equation 5:
N
n=1
2jπkNY(k)= y(n).e
∑ (5)
Whose energy spectrum is |Y(k)|2 where 1 ≤ k ≤ N. Triangular filter bank is reshaped to Gaussian filter to
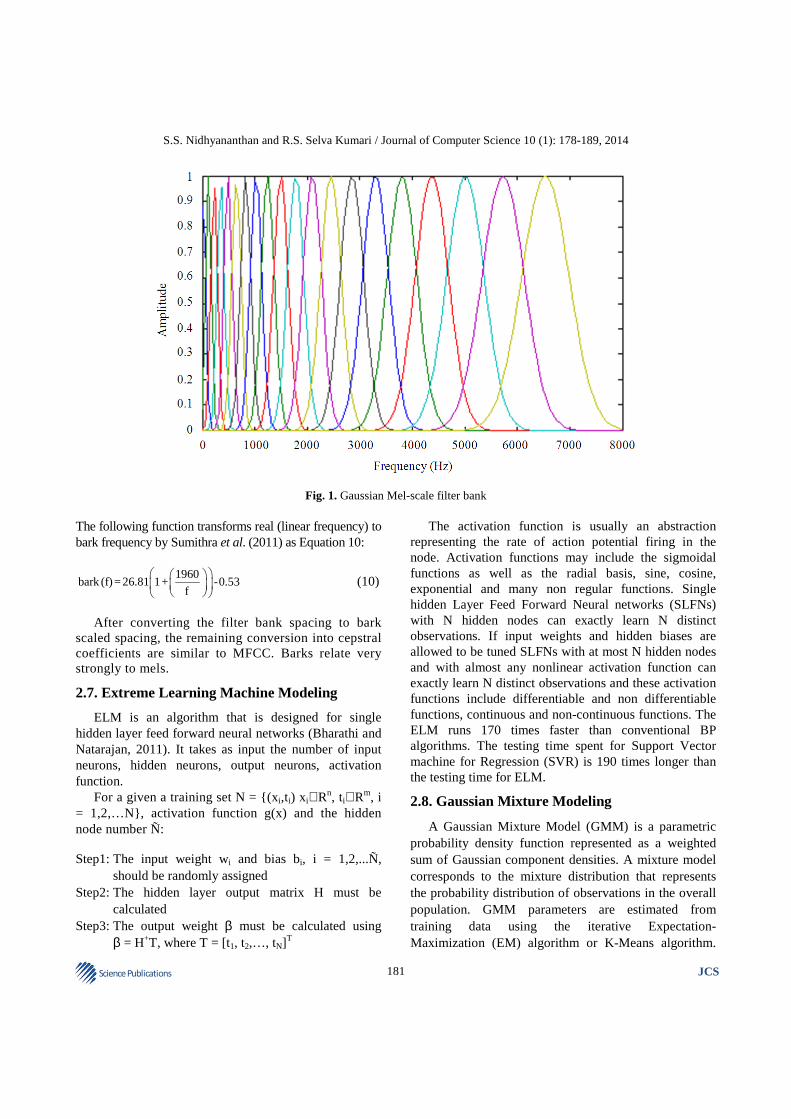
make higher correlation with adjacent sub bands. A triangular filter provides crisp partitions in an energy spectrum by providing non-zero weights to the portion covered by it while giving zero weight outside it. The phenomena cause loss of correlations between a sub band output and the adjacent spectral components that are present in the other sub band, whereas Gaussian shaped filters shown in Fig. 1 can provide much smoother transition from one sub band to other preserving most of the correlation between them.
The Cepstral mean subtracted MFCC coefficients are calculated as follows Equation 6:
( )Q-1
i=0
g gMFCC MFCCm 2c = log e i +1 .
Q
2l -1 πcos m. .
2 Q
∑ (6)
where, 1≤ i≤ Q , Q is the number of filters of the bank:
0 ≤ m ≤ R-1 R is the number of cepstral features.
2.5. Modified Mel Frequency Cepstral Coefficient
A Modified Mel-Frequency Cepstral Coefficient (MMFCC) is the improvised version of conventional MFCC. MMFCC uses compensation based on the magnitude of spread, through a frame based weighting function to preserve the speaker dependent information in different frames. The intensity/loudness at different segments of a spoken word may influence the magnitude of the coefficients affecting cluster formation in parameter space variation of for a speaker. MMFCC is a frame-based technique to reduce these effects through normalization of coefficients in each frame by its total spread, so that coefficients of all the frames are brought to same level of spread. The cepstral mean subtraction procedure is followed by normalization as follows Equation 7:
N
k =1
Sweep= log Mi(k)∑ (7)
Weighting function is defined as Equation 8:
iψ (k)w (i)= log
Sweep
(8)
The modification in above through the weighting
function gives the Modified MFCC coefficients as given by Equation 9:
( ) ( )Q-1
i=0
g gMFCC MFCCm 2 2l -1 πc = log e i +1 w i .cos m. .
Q 2 Q
∑ (9)
2.6. Bark Frequency Cepstral Coefficient
The Bark scale provides an alternative perceptually motivated scale to the Mel scale. The Bark is a unit based on critical band boundaries. Speech intelligibility perception in humans begins with spectral analysis performed by the Basilar Membrane (BM). Each point on the BM can be considered as a band pass filter having a bandwidth equal to one critical bandwidth or one Bark (Singh, 2010). The bandwidth of several auditory filters were empirically observed and used to formulate the Bark scale.
S.S. Nidhyananthan and R.S. Selva Kumari / Journal of Computer Science 10 (1): 178-189, 2014
181 Science Publications
JCS
Fig. 1. Gaussian Mel-scale filter bank The following function transforms real (linear frequency) to bark frequency by Sumithra et al. (2011) as Equation 10:
1960bark (f)=26.81 1+ -0.53
f
(10)
After converting the filter bank spacing to bark
scaled spacing, the remaining conversion into cepstral coefficients are similar to MFCC. Barks relate very strongly to mels.
2.7. Extreme Learning Machine Modeling
ELM is an algorithm that is designed for single hidden layer feed forward neural networks (Bharathi and Natarajan, 2011). It takes as input the number of input neurons, hidden neurons, output neurons, activation function.
For a given a training set N = {(xi,ti) xi∈Rn, ti∈Rm, i = 1,2,…N}, activation function g(x) and the hidden node number Ñ: Step1: The input weight wi and bias bi, i = 1,2,...Ñ,
should be randomly assigned Step2: The hidden layer output matrix H must be
calculated Step3: The output weight β must be calculated using
β = H+T, where T = [t1, t2,…, tN]T
The activation function is usually an abstraction representing the rate of action potential firing in the node. Activation functions may include the sigmoidal functions as well as the radial basis, sine, cosine, exponential and many non regular functions. Single hidden Layer Feed Forward Neural networks (SLFNs) with N hidden nodes can exactly learn N distinct observations. If input weights and hidden biases are allowed to be tuned SLFNs with at most N hidden nodes and with almost any nonlinear activation function can exactly learn N distinct observations and these activation functions include differentiable and non differentiable functions, continuous and non-continuous functions. The ELM runs 170 times faster than conventional BP algorithms. The testing time spent for Support Vector machine for Regression (SVR) is 190 times longer than the testing time for ELM.
2.8. Gaussian Mixture Modeling
A Gaussian Mixture Model (GMM) is a parametric probability density function represented as a weighted sum of Gaussian component densities. A mixture model corresponds to the mixture distribution that represents the probability distribution of observations in the overall population. GMM parameters are estimated from training data using the iterative Expectation-Maximization (EM) algorithm or K-Means algorithm.
S.S. Nidhyananthan and R.S. Selva Kumari / Journal of Computer Science 10 (1): 178-189, 2014
182 Science Publications
JCS
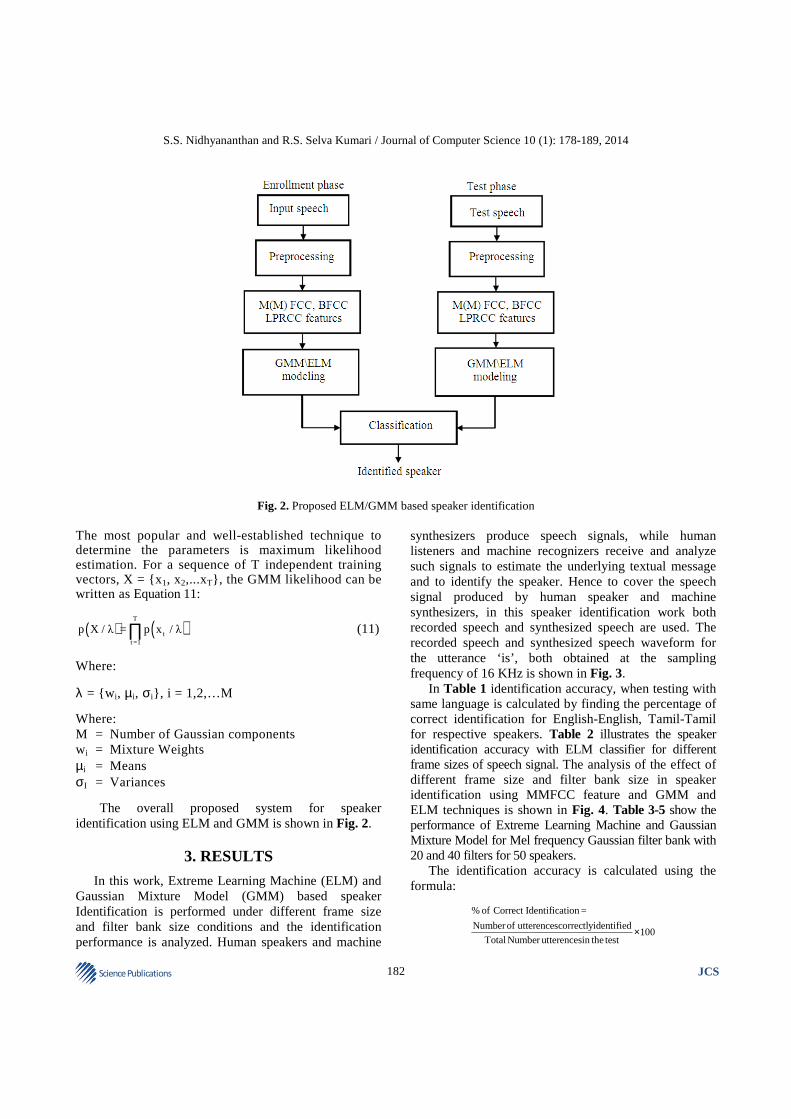
Fig. 2. Proposed ELM/GMM based speaker identification The most popular and well-established technique to determine the parameters is maximum likelihood estimation. For a sequence of T independent training vectors, X = {x1, x2,...xT}, the GMM likelihood can be written as Equation 11:
( ) ( )T
tt=1
p X / λ = p x / λ∏ (11)
Where: λ = {w i, µi, σi}, i = 1,2,…M Where: M = Number of Gaussian components wi = Mixture Weights µi = Means σI = Variances The overall proposed system for speaker identification using ELM and GMM is shown in Fig. 2.
3. RESULTS
In this work, Extreme Learning Machine (ELM) and Gaussian Mixture Model (GMM) based speaker Identification is performed under different frame size and filter bank size conditions and the identification performance is analyzed. Human speakers and machine
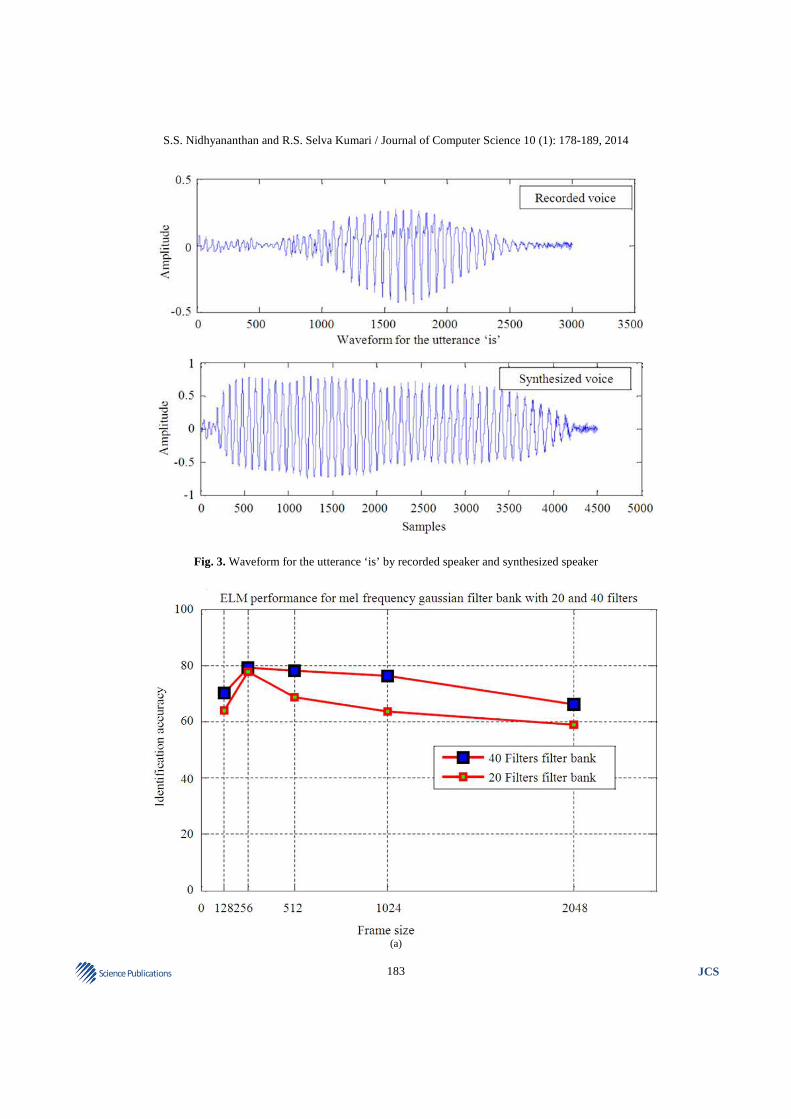
synthesizers produce speech signals, while human listeners and machine recognizers receive and analyze such signals to estimate the underlying textual message and to identify the speaker. Hence to cover the speech signal produced by human speaker and machine synthesizers, in this speaker identification work both recorded speech and synthesized speech are used. The recorded speech and synthesized speech waveform for the utterance ‘is’, both obtained at the sampling frequency of 16 KHz is shown in Fig. 3.
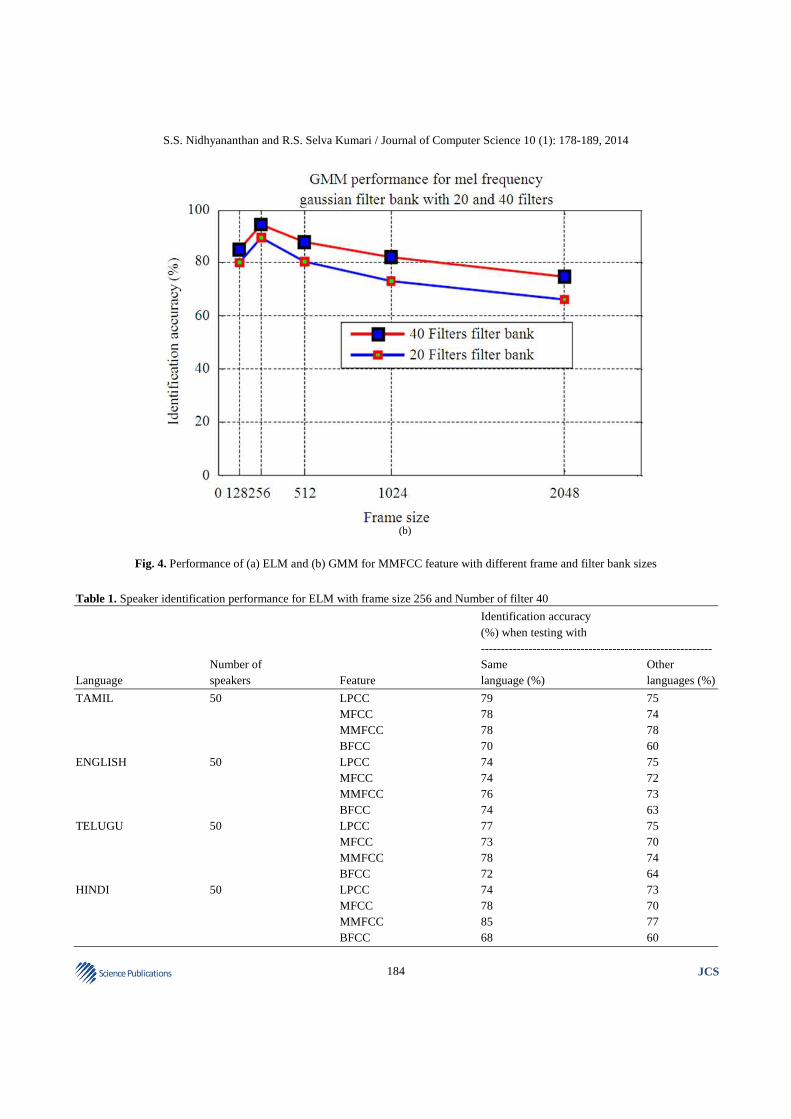
In Table 1 identification accuracy, when testing with same language is calculated by finding the percentage of correct identification for English-English, Tamil-Tamil for respective speakers. Table 2 illustrates the speaker identification accuracy with ELM classifier for different frame sizes of speech signal. The analysis of the effect of different frame size and filter bank size in speaker identification using MMFCC feature and GMM and
ELM techniques is shown in Fig. 4. Table 3-5 show the performance of Extreme Learning Machine and Gaussian Mixture Model for Mel frequency Gaussian filter bank with 20 and 40 filters for 50 speakers.
The identification accuracy is calculated using the formula:
% of Correct Identification =
Numberof utterencescorrectlyidentified100
TotalNumber utterencesin the test×
S.S. Nidhyananthan and R.S. Selva Kumari / Journal of Computer Science 10 (1): 178-189, 2014
183 Science Publications
JCS
Fig. 3. Waveform for the utterance ‘is’ by recorded speaker and synthesized speaker
(a)
S.S. Nidhyananthan and R.S. Selva Kumari / Journal of Computer Science 10 (1): 178-189, 2014
184 Science Publications
JCS
(b)
Fig. 4. Performance of (a) ELM and (b) GMM for MMFCC feature with different frame and filter bank sizes
Table 1. Speaker identification performance for ELM with frame size 256 and Number of filter 40
Identification accuracy (%) when testing with ---------------------------------------------------------- Number of Same Other Language speakers Feature language (%) languages (%)
TAMIL 50 LPCC 79 75 MFCC 78 74 MMFCC 78 78 BFCC 70 60 ENGLISH 50 LPCC 74 75 MFCC 74 72 MMFCC 76 73 BFCC 74 63 TELUGU 50 LPCC 77 75 MFCC 73 70 MMFCC 78 74 BFCC 72 64 HINDI 50 LPCC 74 73 MFCC 78 70 MMFCC 85 77 BFCC 68 60
S.S. Nidhyananthan and R.S. Selva Kumari / Journal of Computer Science 10 (1): 178-189, 2014
185 Science Publications
JCS
Table 2. ELM performance for Mel frequency Gaussian filter bank with 20 and 40 filters for 50 speakers
Identification accuracy (%) when ------------------------------------------------------------------------------------------------------------------ Number of filters = 20 Number of filters = 40 ---------------------------------------------------------- ------------------------------------------------ Testing with same Testing with other Testing with same Testing with other Frame size Feature language (%) languages (%) language (%) languages (%) LPCC 61.25 53.75 73.96 69.79 MFCC 60.00 50.00 72.91 67.70 1024 MMFCC 63.50 54.00 76.12 72.90 BFCC 57.75 47.75 64.75 55.00 512 LPCC 65.00 62.50 74.00 710.00 MFCC 65.00 53.75 74.25 70.00 MMFCC 68.50 58.00 78.00 74.25 BFCC 63.75 49.25 69.25 61.50 256 LPCC 67.50 52.50 76.00 74.50 MFCC 75.00 57.50 75.75 71.50 MMFCC 77.75 67.25 79.25 75.50 BFCC 66.75 50.75 71.00 61.75
Table 3. GMM performance for Mel frequency Gaussian filter bank with 20 filters for 50 speakers
Identification accuracy (%) when Number of filters = 20 ------------------------------------------------------------------------------------------------------------------ Gaussian mixtures = 8 Gaussian mixtures = 16 ----------------------------------------------------- ------------------------------------------------- Testing with same Testing with other Testing with same Testing with other Frame size Feature language (%) languages (%) language (%) languages (%)
1024 LPCC 70.75 69.00 70.28 70.00 MFCC 71.00 69.00 73.00 71.00 MMFCC 73.58 70.00 76.89 75.58 BFCC 67.09 66.08 73.58 72.30 512 LPCC 68.00 63.00 73.00 70.00 MFCC 78.30 75.03 79.88 76.33 MMFCC 79.71 75.57 80.66 78.87 BFCC 73.58 70.50 72.64 70.00 256 LPCC 65.00 63.00 72.00 70.00 MFCC 79.30 78.00 82.54 80.32 MMFCC 81.96 80.12 89.45 87.20
BFCC 74.05 72.33 75.47 73.40
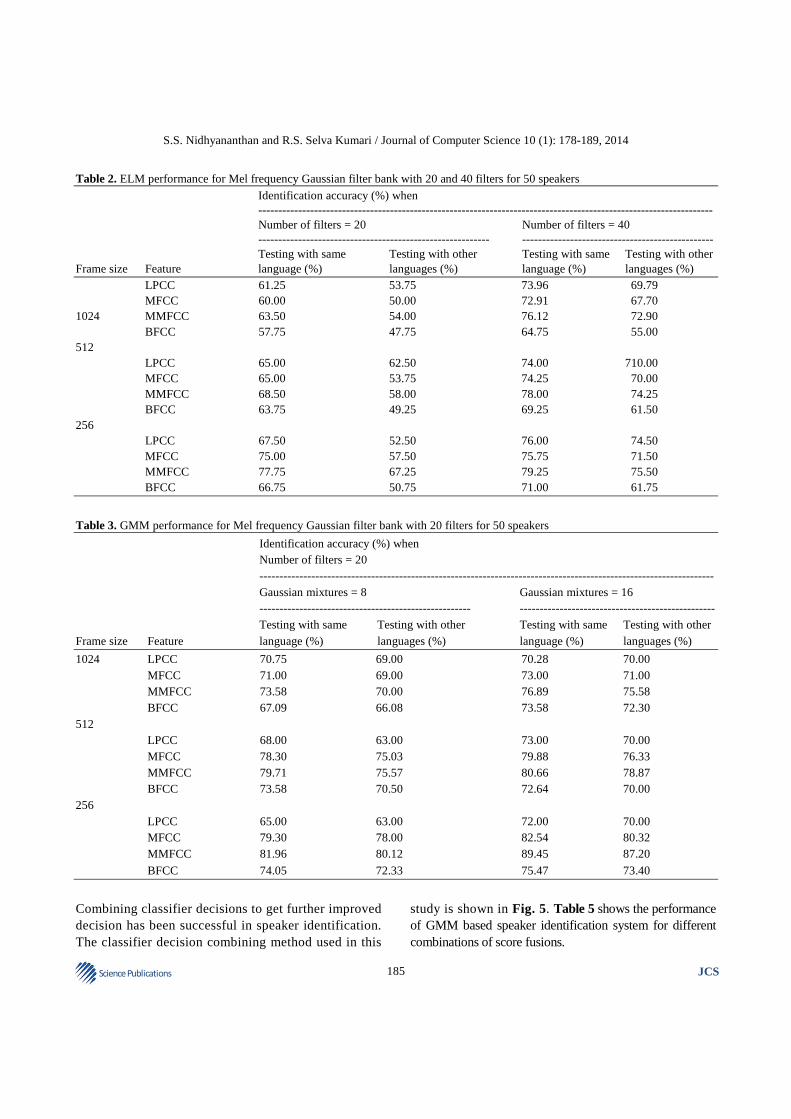
Combining classifier decisions to get further improved decision has been successful in speaker identification. The classifier decision combining method used in this
study is shown in Fig. 5. Table 5 shows the performance of GMM based speaker identification system for different combinations of score fusions.
S.S. Nidhyananthan and R.S. Selva Kumari / Journal of Computer Science 10 (1): 178-189, 2014
186 Science Publications
JCS
Fig. 5. Classifier Score level fusion
Table 4. GMM performance for Mel frequency Gaussian filter bank with 40 filters for 50 speakers Identification accuracy (%) when Number of filters = 40 ------------------------------------------------------------------------------------------------------------------ Gaussian mixtures = 8 Gaussian mixtures = 16 ------------------------------------------------------- ------------------------------------------------ Testing with same Testing with other Testing with same Testing with other Frame size Feature language (%) languages (%) language (%) languages (%) LPCC 73.64 70.00 75.58 73.00 1024 MFCC 73.00 70.58 72.08 71.00 MMFCC 79.00 72.40 82.00 78.00 BFCC 70.00 69.00 75.56 74.00 512 LPCC 71.00 66.00 74.50 72.00 MFCC 81.00 77.00 84.00 80.00 MMFCC 84.00 79.00 88.00 83.60 BFCC 78.00 72.40 81.00 77.00 256 LPCC 69.00 65.00 73.54 70.00 MFCC 87.00 82.00 89.00 83.00 MMFCC 89.00 85.50 94.00 90.20 BFCC 80.40 77.00 86.50 79.00
Table 5. GMM Score level fusion performance Score fusion Identification accuracy (%) MMFCC and MFCC 97.5 MMFCC and BFCC 89.0 MFCC and BFCC 88.0
4. DISCUSSION
The speaker identification task uses a priori information and determines which speaker from a set of possible speakers is the one currently talking. This priori information is captured in the form of features of the registered user’s speech signal. This work uses
features such as Linear Predictive Residual Cepstral Coefficient (LPRCC), Mel Frequency Cepstral coefficient (MFCC), Modified Mel Frequency Cepstral Coefficient (MMFCC) and Bark Frequency Cepstral Coefficient (BFCC) features. The human speech production and hearing mechanisms are likely to have evolved in parallel, each systems taking advantage of properties of the other. The BFCC feature used in this work is related to hearing mechanism which helps in analyzing speaker specific information present in the speech signal in the frequency range 200-5600 Hz.
In the Mel Frequency Cepstral Coefficient feature, the initial c0 coefficient represents the average energy in
S.S. Nidhyananthan and R.S. Selva Kumari / Journal of Computer Science 10 (1): 178-189, 2014
187 Science Publications
JCS
the speech frame and is discarded for amplitude normalization. The coefficient c1 reflects the energy balance between low and high frequencies, positive values indicating sonorants and negative values for frication. For i > 1, ci represent increasingly fine spectral detail frequency ranges. For ELM classifier the primary focus is on labeling and retrieval. The testing and training files are generated for pre emphasized features that are extracted. Those files are fed into the ELM classifier to compute the testing and training accuracy. ELM classifier provides as output the testing time, training time, testing accuracy and training accuracy when the testing data files and training data files are loaded to it. The output weights of the testing data and training data are calculated and the output label of the given speaker is classified. Reduction in frame size increases the number of frames obtained. Hence finding an appropriate match among a larger number of frames makes the task effective for finding good matching among the training and testing samples. In GMM the maximum likelihood score estimation is used to identify the speaker.
For evaluation purpose speakers are asked to utter different short length utterances in Tamil, English, Telugu and Hindi Languages. Maximum length of speech signal in each session is limited to 4 sec, Enrollment Phase Identified speaker Classification Test Phase Totally four sessions are recorded for each speaker, out of which 2 sessions are used for training and the remaining 2 sessions are used for testing. Most of the researchers have concentrated on clean speech or noisy speech for speaker identification task. But this work focuses on combination of noisy recorded speech along with synthesized speech for speaker identification task. After pre processing the speech signal is framed to 2048, 1024, 512, 256, 128 frame sizes. Also the frame shift trial is made with 40, 50, 60 and more than 60% of frame sizes. To improve the speaker identification accuracy Mel scale filter bank is constructed using Gaussian shaped filters in contrary to the triangular filters used in conventional systems. This triangular filter bank is reshaped to Gaussian filter to make higher correlation with adjacent sub bands. The Mel scale filter bank is constituted with 20 and 40 Gaussian shaped filters respectively. ELM performs well when the classes to which the test signal is associated is less, when number of class increases (in this case number of
speakers) the performance of ELM drops. Identification accuracy when testing with other languages is calculated when testing with other than test languages. From Table 2 it is inferred that when the filters in the filter bank are 20 and the frame size is 1024 the accuracy is less. Moreover, when testing is done with same training language speech (for example English-English), the identification accuracy increases whereas when testing with other language speech signals (for example English-Tamil) the identification accuracy decreases.
Identification accuracy of testing with same language is calculated by averaging the identification accuracies of all the same language testing (for example Tamil Utterance testing with Tamil utterance training, English with English, Telugu with Telugu) for a specific feature. Similarly identification accuracy of testing with other language is calculated by averaging the identification accuracies of all the language testing with other three language utterances. Experimental evaluation indicates that the characterization of the speakers with varying frame sizes and filter bank sizes play a significant role in capturing the identity of the speaker. As increased filter bank size could capture all the minor variations in the sound and aids better identification rates, the identity of a human speaker can be exploited robustly by increasing the filter bank size. Speech signals are assumed to be stationary for 10-20 ms duration. Substantiating this, frame size of 256 samples and frame shift of 50% of frame size perform better than frames with 512 samples and 1024 samples. When frame size decreases below 256 or increases beyond 1024, filter bank size increases beyond 40 and frame shift increases above 50% of frame size there is a reduction in identification accuracy.
The ELM runs 20 times faster than GMM algorithm in testing. The overall result reveal that out of the four cepstral features the MMFCC feature with mean cepstral subtraction contributes more to speaker specific attributes intern to enhancement in speaker identification accuracy.
Ranjan et al. (2010) used LPC, RC, APSD, Number of zero crossing and Formant frequencies features and Artificial Neural Network using back propagation learning algorithm and clustering algorithm for training and identification processes of 20 speakers uttered in Hindi,
S.S. Nidhyananthan and R.S. Selva Kumari / Journal of Computer Science 10 (1): 178-189, 2014
188 Science Publications
JCS
Telugu, Sanskrit and Punjabi languages. The average identification rate 83.29% was achieved when the network is trained using back propagation algorithm and it was improved by about 9% and reached up to 92.78% when using clustering algorithm.
In this proposed work with 50 speakers when single hidden layer feed forward neural network ELM is used 79.25% identification accuracy is achieved and when GMM is used 94% identification accuracy is achieved. Combination of classifier would perform better if they are provided with information that is relevant in nature. Using this concept the log-likelihood score of MMFCC feature is combined with the log-likelihood score of MFCC feature for the GMM modeling.
The weighting factor w used in this work is 0.77. This value is arrived after several trials. The new log-likelihood score obtained when the weighted scores of MMFCC and MFCC are summed up result in improved speaker identification accuracy of 97.5%.
5. CONCLUSION
In this study the task of finding the speaker’s identity using the voice characteristics of multilingual speakers is evaluated with different frame sizes, frame shifts and filter bank sizes. Frame size of 256 samples together with frame shit of 50% of frame size performs better than frames with 512 samples and 1024 samples. Filter bank size of 40 Gaussian shaped filters performs better than bank with 20 filers. The overall identification rate of 79.25% is achieved for MMFCC feature with Frame size 256 by using ELM modeling technique. The maximum identification rate 97.5% is achieved for MFCC feature with frame size 256 and the mixture weight 16 by using GMM modeling technique. Experimental results show that Modified Mel Frequency Cepstral Coefficient features perform better for both with GMM and ELM algorithms. Since ELM runs faster than GMM, ELM algorithm is suitable for speaker identification applications, which require faster response with some tolerance. GMM outperforms ELM with large difference in identification accuracy. The robust performance exhibited by the GMM model is promising and can promote further work in the area of speaker identification when combined with emerging feature extraction and modeling techniques.
6. REFERENCES
Al-Ani, M.S., T.S. Mohammed and K.M. Aljebory, 2007. Speaker identification: A hybrid approach using neural networks and wavelet transform. J. Comput. Sci., 3: 304-309. DOI: 10.3844/jcssp.2007.304.309
Bharathi, A. and A.M. Natarajan, 2011. Efficient classification of cancer using support vector machines and modified extreme learning machine based on analysis of variance features. Am. J. Applied Sci., 8: 1295-1301. DOI: 10.3844/ajassp.2011.1295.1301
Bharathi, C.R. and V. Shanthi, 2012. An effective system for acute spotting aberration in the speech of abnormal children via artificial neural network and genetic algorithm. Am. J. Applied Sci., 9: 1561-1570. DOI: 10.3844/ajassp.2012.1561.1570
Dhanaskodi, D. and S. Arumugam, 2011. Speech enhancement algorithm using sub band two step decision directed approach with adaptive weighting factor and noise masking threshold. J. Comput. Sci., 7: 941-948.DOI: 10.3844/jcssp.2011.941.948
Hasan, M.H., H. Jaafar and D.A. Ramli, 2012. Evaluation on score reliability for biometric speaker authentication systems. J. Comput. Sci., 8: 1554-1563. DOI: 10.3844/jcssp.2012.1554.1563
Jayanna, H.S. and S.R.M. Prasanna, 2009. Multiple frame size and rate analysis for speaker recognition under limited data condition. IET Signal Process., 3: 189-204. DOI: 10.1049/iet-spr.2008.0211
Justin, J. and I. Vennila, 2013. A hybrid speech recognition system with hidden Markov model and radial basis function neural network. Am. J. Applied Sci., 10: 1148-1153. DOI: 10.3844/ajassp.2013.1148.1153
Prathosh, A.P., T.V. Ananthapadmanabha and A.G. Ramakrishnan, 2013. Epoch extraction based on integrated linear prediction residual using plosion index. IEEE Trans. Audio, Speech Language Process., 21: 2471-2480. DOI: 10.1109/TASL.2013.2273717
Quiros, A. and S.P. Wilson, 2012. Dependent Gaussian mixture models for source separation. EURASIP J. Adv. Signal Process. DOI: 10.1186/1687-6180-2012-239
S.S. Nidhyananthan and R.S. Selva Kumari / Journal of Computer Science 10 (1): 178-189, 2014
189 Science Publications
JCS
Ranjan, R., S.K. Singh, A. Shukla and K.S. Tiwari, 2010. Text-dependent multilingual speaker identification for indian languages using artificial neural network. Proceedings of the 3rd International Conference on Emerging Trends in Engineering and Technology, Nov. 19-21, IEEE Xplore Press, Goa, pp: 632-635. DOI: 10.1109/ICETET.2010.23
Salam, M.S., D. Mohamad and S.H. Salleh, 2009. Improved statistical speech segmentation using connectionist approach. J. Comput. Sci., 5: 275-282. DOI: 10.3844/jcssp.2009.275.282
Singh, D., 2010. Hybrid auditory based interaction framework for driver assistance system. J. Comput. Sci., 6: 1499-1504. DOI: 10.3844/jcssp.2010.1499.1504
Sumithra, M.G., K. Thanuskodi and A.H.J. Archana, 2011. A new speaker recognition system with combined feature extraction techniques. J. Comput. Sci., 7: 459-465. DOI: 10.3844/jcssp.2011.459.465
Tiun, S., R. Abdullah and T.E. Kong, 2012. Restricted malay speech synthesizer using syntax-prosody representation. J. Comput. Sci., 8: 1961-1969. DOI: 10.3844/jcssp.2012.1961.1969