Embed Size (px)
Citation preview

Some Aspects of Pollution in Southampton WaterAuthor(s): J. E. G. RaymontSource: Proceedings of the Royal Society of London. Series B, Biological Sciences, Vol. 180, No.1061, A Discussion on Freshwater and Estaurine Studies of the Effects of Industry (Mar. 21,1972), pp. 451-468Published by: The Royal SocietyStable URL: http://www.jstor.org/stable/76213 .
Accessed: 07/05/2014 18:29
Your use of the JSTOR archive indicates your acceptance of the Terms & Conditions of Use, available at .http://www.jstor.org/page/info/about/policies/terms.jsp
.JSTOR is a not-for-profit service that helps scholars, researchers, and students discover, use, and build upon a wide range ofcontent in a trusted digital archive. We use information technology and tools to increase productivity and facilitate new formsof scholarship. For more information about JSTOR, please contact [email protected].
.
The Royal Society is collaborating with JSTOR to digitize, preserve and extend access to Proceedings of theRoyal Society of London. Series B, Biological Sciences.
http://www.jstor.org
This content downloaded from 169.229.32.136 on Wed, 7 May 2014 18:29:48 PMAll use subject to JSTOR Terms and Conditions
Proc. R. Soc. Lond. B. 180, 451-468 (1972)
Printed in Great Britain
Some aspects of pollution in Southampton Water
BY J. E. G. RAYMONT
Department of Oceanography, The University of Southampton
The levels of some trace metals have been studied in Southampton Water. Particulate iron, though variable, is generally high and the concentration appears to be correlated with the amount of particulate matter. Zinc is approximately doubled in concentration inside Southampton Water, but much higher levels are occasionally encountered. Copper and nickel are only somewhat higher and total mercury is lower inside Southampton Water than in Solent waters. Zinc and copper are concentrated approximately 30000 times on a dry mass basis by Mercenaria mercenaria. Mercury is concentrated by Mercenaria and other bivalves; the mud which is especially rich in total mercury may represent an important source of mercury for these animals.
Primary nutrients, phosphate, nitrate and ammonium, increase in concentration from seaward on proceeding up the estuary. Surface waters appear to be especially rich in nitrate and ammonium. Gross pollution seems unlikely in view of low nitrite concentration and high oxygen values virtually throughout the estuary.
The high rate of turnover of organic substrates by heterotrophic organisms may be associated with relatively large amounts of organic matter in Southampton Water. This has to some extent been confirmed by direct surveys of particulate and dissolved organic carbon which also suggest that regional differences exist. Higher levels of organic matter occur near the head of the estuary, near Marchwood, the Docks, and the mouth of the River Itchen.
Although thermal changes in Southampton Water appear to have been slight, some in- crease in winter minimal temperatures and in summer maxima have occurred, especially in the Marchwood area. No evidence exists of deleterious effects on marine organisms. Phytoplankton can apparently endure rises of at least 10 ?C for short periods without in- jurious effects. The density of zooplankton has not decreased; possibly certain species (e.g. Elminius modestus) have been favoured by thermal changes. A marked increase in Mer- cenaria mercenaria population may be associated with the small thermal rise and remarkably high population densities are encountered. Spawning appears to be correlated with summer temperatures exceeding 18 to 19 'C.
INTRODUCTION
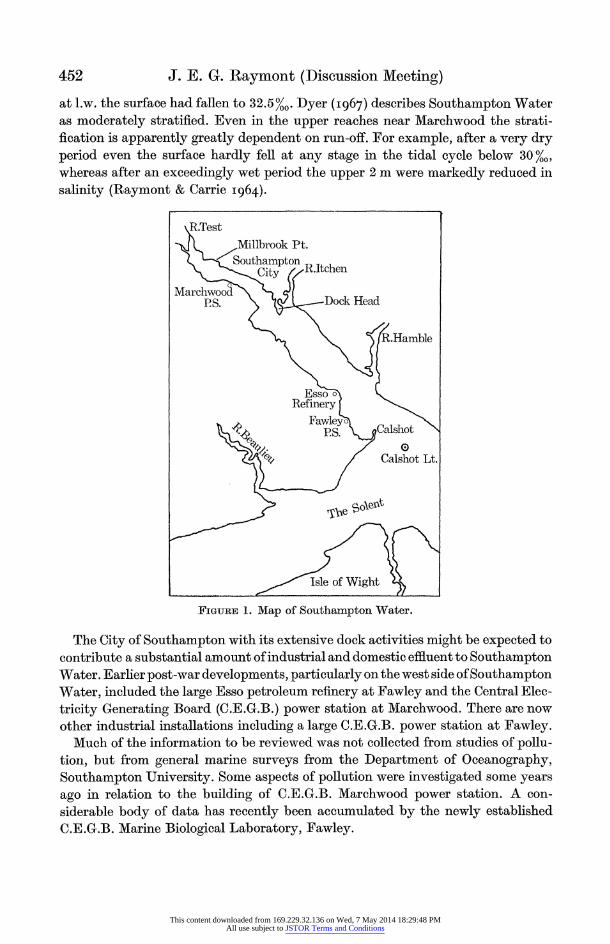
Southampton Water, some 16 km long, runs in a northwest-southeasterly direc- tion opening at its seaward end to the Solent, and at the opposite end continuing as the River Test. The River Itchen and the very much smaller River Hamble open into it along the east bank (figure 1). Near the entrance to Southampton Water the depth is of the order of 12 to 13 m; the rest of Southampton Water has banks of soft mud with a deep water channel dredged to a depth of more than 10 m below chart datum line to above Southampton Docks. Most of the present data refer to surveys as far as the upper part of the Docks.
Though the area may be referred to as an estuary, Southampton Water is essentially mainly marine in character. Figure 2 suggests that at h.w. the entrance shows salinities throughout the water column exceeding 34% , and that relatively high salinities extend far up the estuary with values > 31 %,. At l.w. however, a more pronounced stratification occurs along the estuary. Thus on 12 November 1970 whereas near Calshot the salinity at h.w. varied from only 34.2 to 34.4%0,
E 451 ]
This content downloaded from 169.229.32.136 on Wed, 7 May 2014 18:29:48 PMAll use subject to JSTOR Terms and Conditions
452 J. E. G. Raymont (Discussion Meeting)
at l.w. the surface had fallen to 32.5%,. Dyer (I967) describes Southampton Water as moderately stratified. Even in the upper reaches near Marchwood the strati- fication is apparently greatly dependent on run-off. For example, after a very dry period even the surface hardly fell at any stage in the tidal cycle below 30 %", whereas after an exceedingly wet period the upper 2 m were markedly reduced in salinity (Raymont & Carrie I964).
R.Test Milbrook Pt. Southampton R It h
City .tcn
Marchwooa PS. Dock Head
R.Hamble
Esso Refintery
PS. Caishot
Calshot Lt.
slof Wight
FiGuiRn 1. Map of Southampton Water.
The City of Southampton with its extensive dock activities might be expected to contribute a substantial amount of industrial and domestic effluent to Southampton Water. Earlier post-war developments, particularly on the west side of Southampton Water, included the large Esso petroleum refinery at Fawley and the Central Elec- tricity Generating Board (C.E.G.B.) power station at Marchwood. There are now other industrial installations including a large C.E.G.B. power station at Fawley.
Much of the information to be reviewed was not collected from studies of pollu- tion, but from general marine surveys from the Department of Oceanography, Southampton University. Some aspects of pollution were investigated some years ago in relation to the building of C.E.G.B. Marchwood power station. A con- siderable body of data has recently been accumulated by the newly established C.E.G.B. Marine Biological Laboratory, Fawley.
This content downloaded from 169.229.32.136 on Wed, 7 May 2014 18:29:48 PMAll use subject to JSTOR Terms and Conditions

Some aspect8 of pollution in Southampton Water 453
distance/km March- Mill-
Caishot Lt Calshot Esso Dock Hd wood brook Pt
01 :1 4,t1216 i
0
31.0 31.5
4i ~~~~~~~~~~~~~~~~~~~~~~~32.0
10 32.5
33.5
34.0 3.
34.5
20
FiGuRE 2. Variation of salinity (%O) with depth along Southampton Water at h.w. slack, 19 Oct. 1970.
RES-ULTS
Oniy the following topics related to pollution will be selected: (a) trace metals, (b) primary nutrients and possible pollution, (c) dissolved and particulate organic matter, and (d) thermal effects.
(a) Trace metals
P. C. Head (Ph.D. thesis, Southampton University) investigated the levels of particulate matter in Southampton Water. The amounts were relatively high and typical of an estuarine region (1.3 to 48.6 mg/i). He considered that wind effects were important in stirring up particulate matter; a good correlation existed between the wind speed over the 5 days previous to sampling and the amount of particulate matter found at one exposed station.
Head also investigated the levels of iron in the estuary. Sampling at high water at three points in Southampton Water over a period of approximately 2-1 years, he showed particulate Fe ranging from 106 to 1046 izg/l. Mean values were 321 and 353 ~tgll at two stations; 436 izg/l at the third. Head found that the patterns of distribution of particulate matter and of particulate iron were similar, and there was a highly significant correlation between concentration of particulate iron and
This content downloaded from 169.229.32.136 on Wed, 7 May 2014 18:29:48 PMAll use subject to JSTOR Terms and Conditions
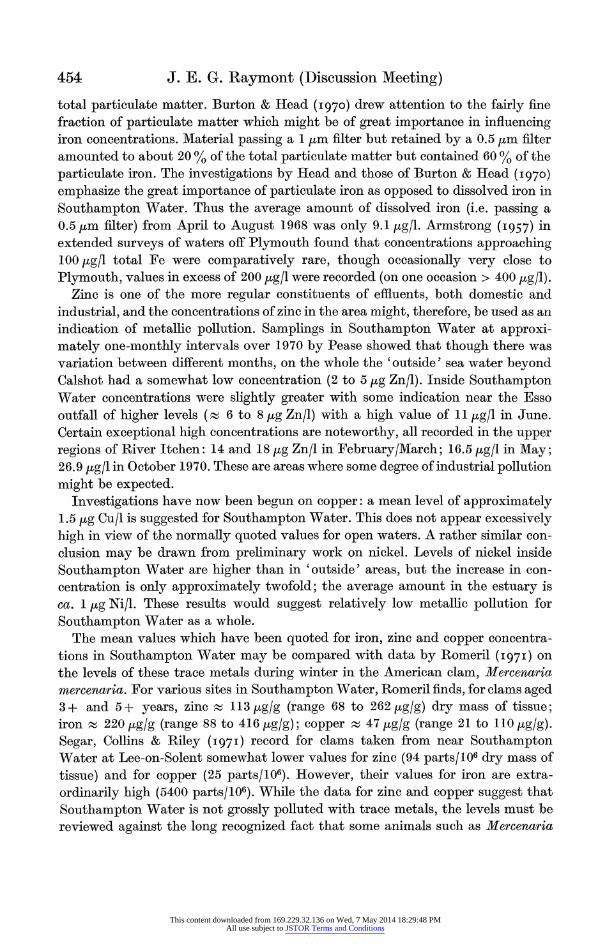
454 J. E. G. Raymont (Discussion Meeting)
total particulate matter. Burton & Head (1970) drew attention to the fairly fine fraction of particulate matter which might be of great importance in influencing iron concentrations. Material passing a 1 [km filter but retained by a 0.5 [m filter amounted to about 20 % of the total particulate matter but contained 60 % of the particulate iron. The investigations by Head and those of Burton & Head (I970) emphasize the great importance of particulate iron as opposed to dissolved iron in Southampton Water. Thus the average amount of dissolved iron (i.e. passing a 0.5 Zm filter) from April to August 1968 was only 9.1 [kg/l. Armstrong (1957) in extended surveys of waters off Plymouth found that concentrations approaching 100 ltg/l total Fe were comparatively rare, though occasionally very close to Plymouth, values in excess of 200 ,tg/l were recorded (on one occasion > 400 [kg/l).
Zinc is one of the more regular constituents of effluents, both domestic and industrial, and the concentrations of zinc in the area might, therefore, be used as an indication of metallic pollution. Samplings in Southampton Water at approxi- mately one-monthly intervals over 1970 by Pease showed that though there was variation between different months, on the whole the 'outside' sea water beyond Calshot had a somewhat low concentration (2 to 5 yg Zn/l). Inside Southampton Water concentrations were slightly greater with some indication near the Esso outfall of higher levels ( 6 to 8 pg Zn/l) with a high value of 11 Htg/l in June. Certain exceptional high concentrations are noteworthy, all recorded in the upper regions of River Itchen: 14 and 18 [kg Zn/I in February/March; 16.5 yg/l in May; 26.9 Zg/l in October 1970. These are areas where some degree of industrial pollution might be expected.
Investigations have now been begun on copper: a mean level of approximately 1.5 [kg Cu/i is suggested for Southampton Water. This does not appear excessively high in view of the normally quoted values for open waters. A rather similar con- clusion may be drawn from preliminary work on nickel. Levels of nickel inside Southampton Water are higher than in 'outside' areas, but the increase in con- centration is only approximately twofold; the average amount in the estuary is ca. 1 yg Ni/l. These results would suggest relatively low metallic pollution for Southampton Water as a whole.
The mean values which have been quoted for iron, zinc and copper concentra- tions in Southampton Water may be compared with data by Romeril (I97I) on the levels of these trace metals during winter in the American clam, iercenaria mercenaria. For various sites in Southampton Water, Romeril finds, for clams aged 3+ and 5+ years, zinc 113 kg/g (range 68 to 262 kg/g) dry mass of tissue; iron 220 kg/g (range 88 to 416 jg/g); copper 47 Htg/g (range 21 to 110 jg/g). Segar, Collins & Riley (I97I) record for clams taken from near Southampton Water at Lee-on-Solent somewhat lower values for zinc (94 parts/106 dry mass of tissue) and for copper (25 parts/106). However, their values for iron are extra- ordinarily high (5400 parts/106). While the data for zinc and copper suggest that Southampton Water is not grossly polluted with trace metals, the levels must be reviewed against the long recognized fact that some animals such as Mercenaria
This content downloaded from 169.229.32.136 on Wed, 7 May 2014 18:29:48 PMAll use subject to JSTOR Terms and Conditions
Some aspects of pollution in Southampton Water 455
mercenaria concentrate metals to an extraordinary degree. The concentration factors for zinc and copper would be about 28000 and 31000 times respectively on a dry mass basis.
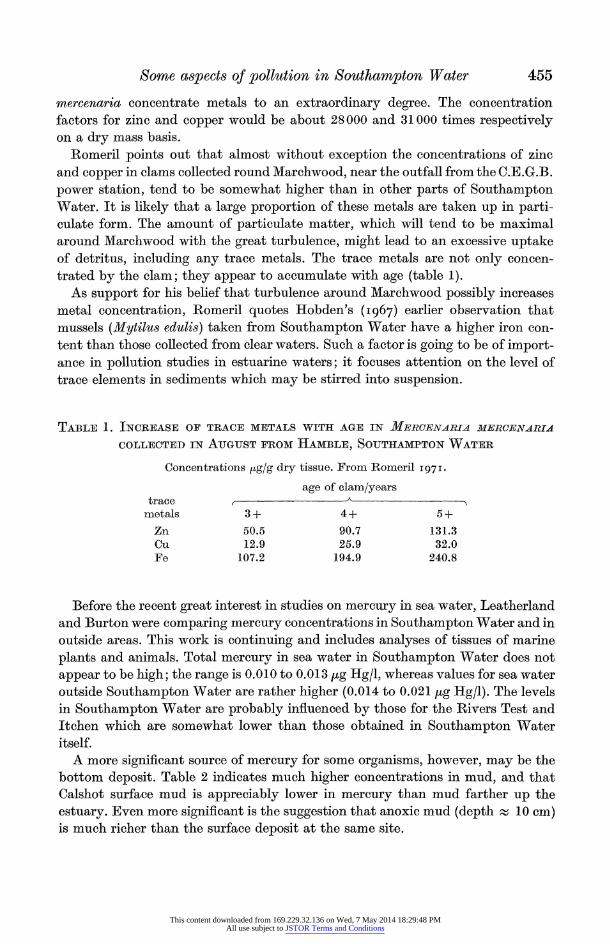
Romeril points out that almost without exception the concentrations of zinc and copper in clams collected round Marchwood, near the outfall from the C.E.G.B. power station, tend to be somewhat higher than in other parts of Southampton Water. It is likely that a large proportion of these metals are taken up in parti- culate form. The amount of particulate matter, which will tend to be maximal around Marchwood with the great turbulence, might lead to an excessive uptake of detritus, including any trace metals. The trace metals are not only concen- trated by the clam; they appear to accumulate with age (table 1).
As support for his belief that turbulence around Marchwood possibly increases metal concentration, Romeril quotes Hobden's (I967) earlier observation that mussels (Mytilus edulis) taken from Southampton Water have a higher iron con- tent than those collected from clear waters. Such a factor is going to be of import- ance in pollution studies in estuarine waters; it focuses attention on the level of trace elements in sediments which may be stirred into suspension.
TABLE 1. INCREASE OF TRACE METALS WITH AGE IN MERCENARIA MERCENARIX
COLLECTED IN AUGUST FROM HAMBLE, SOUTHAMPTON WATER
Concentrations zug/g dry tissue. From Romeril 197I. age of clam/years
trace metals 3+ 4+ 5+ Zn 50.5 90.7 131.3 Cu 12.9 25.9 32.0 Fe 107.2 194.9 240.8
Before the recent great interest in studies on mercury in sea water, Leatherland and Burton were comparing mercury concentrations in Southampton Water and in outside areas. This work is continuing and includes analyses of tissues of marine plants and animals. Total mercury in sea water in Southampton Water does not appear to be high; the range is 0.010 to 0.013 ,ug Hg/l, whereas values for sea water outside Southampton Water are rather higher (0.014 to 0.021 Hg Hg/i). The levels in Southampton Water are probably influenced by those for the Rivers Test and Itchen which are somewhat lower than those obtained in Southampton Water itself.
A more significant source of mercury for some organisms, however, may be the bottom deposit. Table 2 indicates much higher concentrations in mud, and that Calshot surface mud is appreciably lower in mercury than mud farther up the estuary. Even more significant is the suggestion that anoxic mud (depth I 10 cm) is much richer than the surface deposit at the same site.
This content downloaded from 169.229.32.136 on Wed, 7 May 2014 18:29:48 PMAll use subject to JSTOR Terms and Conditions

556 J. E. G. Raymont (Discussion Meeting)
TABLE 2. VARIATIONS IN TOTAL MERCURY CONCENTRATION IN
MUDS FROM SOUTHAMPTON WATER
,ug/g dry mud
Calshot, surface mud 0.188 Town Quay, surface mud 0.62 Hamble, surface mud 0.636 Town Quay, anoxic mud 2.22 Hamble, anoxic mud 5.68
Concentration of mercury by marine benthic organisms in the area is obvious (table 3). Though several other animals and plants have been analysed, a few bivalves have been selected for discussion. The results for Mytilus and Cardium suggest that levels in Southampton Water may be higher than in nearby areas. Mytilus appears to concentrate mercury especially. The Mercenaria analyses are also of interest: clams from Marchwood and Town Quay sites show higher mercury levels. The results for the specimen transferred to Whitstable may indicate that mercury once accumulated is lost only slowly. Preliminary tissue analyses of Mercenarita suggest that the gills have the highest mercury concentration, although the difference is only about a factor of 2.
TABLE 3. TOTAL AMOUNTS OF MERCURY, ARSENIC AND ANTIMONY IN TISSUES OF
BIVALVES FROM SOUTHAMPTON WATER AND NEARBY AREAS
Hg As Sb
,4g/g dry tissue
Mytilus edulis (Lee) 0.434 14.8 0.047 Mytilus edulis (Southampton W.) 1.863 9.45 0.042 Cardium edule (Lee) 0.158 4.5 0.013 Cardium edule (Southampton W.) 0.800 6.32 0.043 Mercenaria mercenaria (Southampton W.t) 0.570 7.12 0.013 Mercenaria mercenaria (Southampton W. 0.50 6.1 0.015 Town Quay)
Mercenaria mercenaria (Southampton W. 0.54 4.1 Marohwood)
Mercenaria mercenaria (Southampton W. 0.18 3.2 0.007 Hamnble)
t Clam transferred from Southampton Water to Whitstable for 'cleaning'.
Table 3 indicates that arsenic is also concentrated to a considerable degree by bivalves, but there is no clear picture of differences between Southampton Water and the Solent and the concentration factor is about an order of magnitude less than for mercury. Antimony appears to be relatively little concentrated by marine benthic animals.
The main conclusion from these results on metallic ions is that Southampton Water cannot be regarded as a dangerously polluted area. However, the high concentration factors typical of some organisms suggest that the levels of metallic
This content downloaded from 169.229.32.136 on Wed, 7 May 2014 18:29:48 PMAll use subject to JSTOR Terms and Conditions
Some aspects of pollution in Southampton Water 457
ions should be most carefully monitored especially in the light of any substantial increase in industrialization.
(b) Primary nutrients and possible pollution
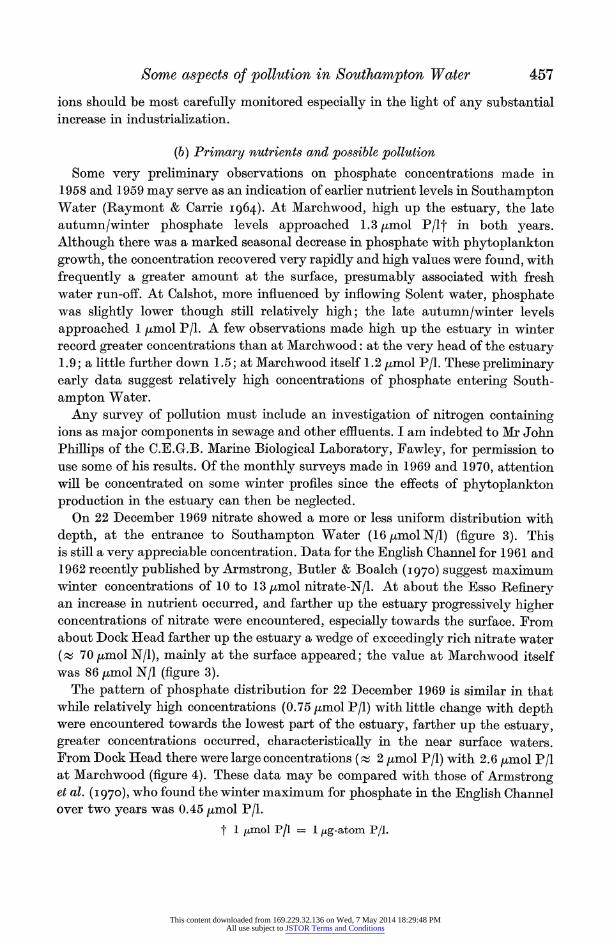
Some very preliminary observations on phosphate concentrations made in 1958 and 1959 may serve as an indication of earlier nutrient levels in Southampton Water (Raymont & Carrie I964). At Marchwood, high up the estuary, the late autumn/winter phosphate levels approached 1.3 vumol P/It in both years. Although there was a marked seasonal decrease in phosphate with phytoplankton growth, the concentration recovered very rapidly and high values were found, with frequently a greater amount at the surface, presumably associated with fresh water run-off. At Calshot, more influenced by inflowing Solent water, phosphate was slightly lower though still relatively high; the late autumn/winter levels approached 1 ,umol P/l. A few observations made high up the estuary in winter record greater concentrations than at Marchwood: at the very head of the estuary 1.9; a little further down 1.5; at Marchwood itself 1.2 ,umol P/l. These preliminary early data suggest relatively high concentrations of phosphate entering South- ampton Water.
Any survey of pollution must include an investigation of nitrogen containing ions as major components in sewage and other effluents. I am indebted to Mr John Phillips of the C.E.G.B. Marine Biological Laboratory, Fawley, for permission to use some of his results. Of the monthly surveys made in 1969 and 1970, attention will be concentrated on some winter profiles since the effects of phytoplankton production in the estuary can then be neglected.
On 22 December 1969 nitrate showed a more or less uniform distribution with depth, at the entrance to Southampton Water (16 ,1mol N/I) (figure 3). This is still a very appreciable concentration. Data for the English Channel for 1961 and 1962 recently published by Armstrong, Butler & Boalch (I970) suggest maximum winter concentrations of 10 to 13 tkmol nitrate-N/l. At about the Esso Refinery an increase in nutrient occurred, and farther up the estuary progressively higher concentrations of nitrate were encountered, especially towards the surface. From about Dock Head farther up the estuary a wedge of exceedingly rich nitrate water ( 70 ,tmol N/I), mainly at the surface appeared; the value at Marchwood itself was 86 ,tmol N/l (figure 3).
The pattern of phosphate distribution for 22 December 1969 is similar in that while relatively high concentrations (0.75 ytmol P/1) with little change with depth were encountered towards the lowest part of the estuary, farther up the estuary, greater conicentrations occurred, characteristically in the near surface waters. From Dock Head there were large concentrations (- 2 limol P/1) with 2.6 umol P/I at Marchwood (figure 4). These data may be compared with those of Armstrong et al. (I970), who found the winter maximum for phosphate in the English Channel over two years was 0.45 umol P/1.
t 1 juraol P/I = 1 jug-atom P/1.
This content downloaded from 169.229.32.136 on Wed, 7 May 2014 18:29:48 PMAll use subject to JSTOR Terms and Conditions

458 J. E. G. Raymont (Discussion Meeting)
distance/km March- Mill- Calshot Lt Calshot Esso Dock ld wood brook Pt
01 i 4 8 112 1161, o 16. 86. - -- 70
~60 50
40 16.
Q~~~~ 10 16.
20 FIGURE 3. Variation in nitrate (+ nitrite) concentrations (expressed as ymol N/I) with depth
along Southampton Water at h.w. slack, 22 Dec. 1969.
distance/km March- Mill-
Calshot Lt Calshot Esso Dock Hd wood brook Pt
Ol. .1 ' 4 112 16 0 2.61
2.00 1.75 1.50
1.25
10. ~ ~ ~ ~ .--1.00 1.05
0.81
0.80
0.75 20
FIGURE 4. Variation in phosphate concentrations (expressed as jrmol P/i) with depth along Southampton Water at h.w. slack, 22 Dec. 1969.
This content downloaded from 169.229.32.136 on Wed, 7 May 2014 18:29:48 PMAll use subject to JSTOR Terms and Conditions
Some aspects of pollution in Southampton Water 459
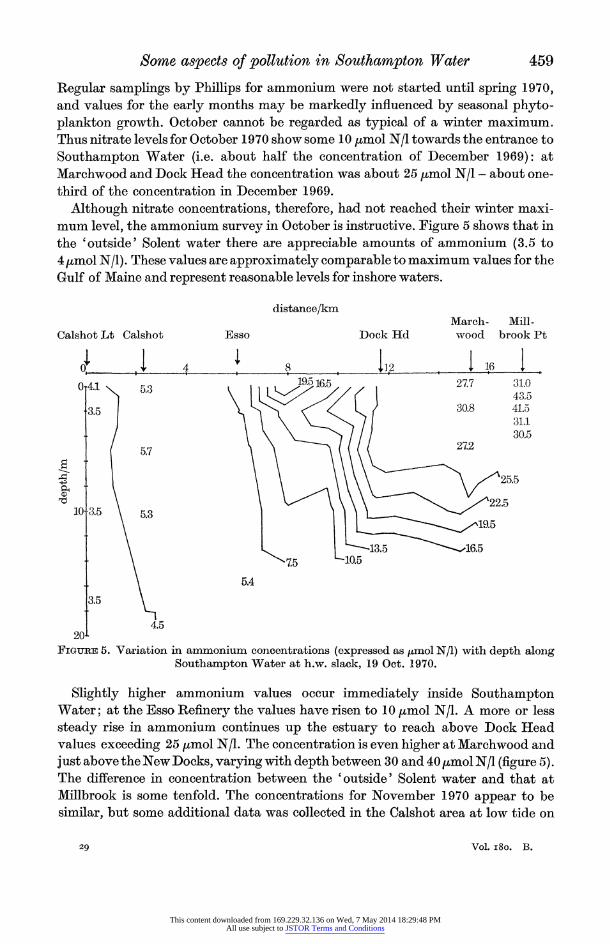
Regular samplings by Phillips for ammonium were not started until spring 1970, and values for the early months may be markedly influenced by seasonal phyto- plankton growth. October cannot be regarded as typical of a winter maximum. Thus nitrate levels for October 1970 show some 10 pmol N/l towards the entrance to Southampton Water (i.e. about half the concentration of December 1969): at Marchwood and Dock Head the concentration was about 25 ,umol N/l - about one- third of the concentration in December 1969.
Although nitrate concentrations, therefore, had not reached their winter maxi- mum level, the ammonium survey in October is instructive. Figure 5 shows that in the 'outside' Solent water there are appreciable amounts of ammonium (3.5 to 4 lkmol N/l). These values are approximately comparable to maximum values for the Gulf of Maine and represent reasonable levels for inshore waters.
distance/km March- Mill-
Calshot Lt Calshot Esso Dock Hd wood brook Pt
4l ... _ |1 _4 l-8 ' 112 11 16 0 41 53 19.5 16.5 27.7 31.0
43.05 3.5 30.8 41.5
31.1 30.5
570272
25.5
22.5 10-3.5 5.3
19.5
135 16.5 7.5 10.5
5.4 3.5
4.5 20L
FIGuPE 5. Variation in ammonium concentrations (expressed as pmol N/I) with depth along Southampton Water at h.w. slack, 19 Oct. 1970.
Slightly higher ammonium values occur immediately inside Southampton Water; at the Esso Refinery the values have risen to 10 ,umol N/I. A more or less steady rise in ammonium continues up the estuary to reach above Dock Head values exceeding 25 ,umol N/l. The concentration is even higher at Marchwood and just above the New Docks, varying with depth between 30 and 40 Hmol N/l (figure 5). The difference in concentration between the 'outside' Solent water and that at Millbrook is some tenfold. The concentrations for November 1970 appear to be similar, but some additional data was collected in the Calshot area at low tide on
29 Vol. i8o. B.
This content downloaded from 169.229.32.136 on Wed, 7 May 2014 18:29:48 PMAll use subject to JSTOR Terms and Conditions
460 J. E. G. Raymont (Discussion Meeting)
the same day. Outflow on the ebb showed a marked increase in ammonium equi- valent to about 3 times the level at high tide. Some data for ammonium levels obtained independently by Mendez in our Department for February 1971 are also relevant; approximately opposite Esso - 3.6 jumol N/l; opposite Marchwood - 12.6 kmol N/l; a little distance from the entrance of River Itchen - 22.2 ymol N/l. The increase in ammonium with inflow is clear. Though it is difficult to pinpoint particular effluents, sewage presumably makes a major contribution to ammonium which is a substantial part of the total nitrogen.
The concentrations of nutrients are to some extent comparable to those found by Mommaerts (I969, I970) for the estuary of River Tamar. In Southampton Water total nitrogen (NOv and NH+) appears to be relatively much higher than phosphate. This is apparently typical of estuaries subject to polluted inflow. Thus Head & James (I970) found River Tyne water with N/P atom ratio for NO- /PO3-
of 20/1 for river water, 15/1 for river influenced water and 13/1 for coastal water. When NH+ was also included the ratios were 35/1, 30/1 and 14/1 respectively. Jeffries (I962) also comments on the excessively high N/P ratio in the grossly polluted Raritan River.
Although the inflow of primary nutrients into Southampton Water is un- doubtedly very large, there is no suggestion of gross pollution over the whole area. This is supported by investigations on oxygen concentrations which have been continuing for a considerable time. Recent monthly surveys along the length of the estuary by Phillips confirm that oxygenation is generally high. For example, on 19 October 1970 there was a virtually homogeneous water column at the entrance to Southampton Water - 96 to 97 % saturated. Surface and bottom water showed only a very slight decline in oxygen content to beyond Marchwood. The only indication of lowered oxygen was in a relatively small subsurface lens of water around Marchwood with only 70 % saturation. This is the lowest value over two years.
Absence of gross pollution is confirmed by a few data on nitrite. There is no clear pattern to nitrite distribution, but there is exceedingly little nitrite as com- pared with the high levels of both nitrate and ammonium. Maximum nitrite encountered on the 19 October 1970 survey was a subsurface wedge of only 1.3 Zmol nitrite-N/l; the surface water had 0.5 pmol N/l, the order of magnitude for nitrite in the Solent area. There is again very good confirmation from recent NO- analyses from Mendez. In February 1971 nitrite varied in concentration from 0.5 Zmol N/l opposite Esso, to 0.8 ,umol N/l opposite Marchwood, and to 1.5 ,umol N/l, indicating perhaps some minor pollution some distance from the mouth of the River Itchen.
Although primary nutrients are not at present at a dangerously high level in Southampton Water, the considerable inflow of nutrients must be a matter of con- cern if further urban development be envisaged.
This content downloaded from 169.229.32.136 on Wed, 7 May 2014 18:29:48 PMAll use subject to JSTOR Terms and Conditions
Some aspects of pollution tn Southampton Water 461
(c) Dissolved and particulate orqanic matter The amounts of dissolved and particulate organic matter in a somewhat polluted
estuary such as Southampton Water may be expected to be large. Such increased concentrations may be associated with higher densities of heterotrophic organisms. An indication of the turnover of organic material may be obtained by measuring the activity of heterotrophs in the water. This may be done by measuring the rate of mineralization of an organic substrate.
A fairly crude earlier method was to collect samples of sea water from various parts of Southampton Water, to spike these with known quantities (mg/l) of glucose, and to measure the progressive loss of glucose with time. These experi- ments were instructive in showing fairly clearly that the rate of loss of glucose was distinctly higher in Southampton Water than in the Solent. Moreover, in the area around Dock Head, where considerable pollution fromn sewage effluent might be expected, the decline in glucose was especially rapid.
A more elegant method developed by Williams has been to study the rate of uptake and mineralization of radioactive glucose and amino acids (cf. Williams & Askew I968; Williams & Gray 1970). Preliminary results with labelled glucose indicate that there are regional differences in activity. A shorter turnover time was observed in the region of Marchwood outfall and in mud flat areas at the head of Southampton Water, as compared with longer turnover times for water from the Calshot area.
The turnover time of amino acids appears to be less for surface water frorm Southampton Water than that from the English Channel at E 1. Apparently the population of heterotrophs in Southampton Water was better able to accommodate to a sudden increase in concentration of substrate. With a relatively large quantity (5 mg/l) of a mixture of amino acids added, a lengthening of turnover time occurred in samples both from Southampton Water and the English Channel. But whereas the English Channel population responded only weakly over a period of 2 days, the Southampton Water population after a lag period of 24 h, showed a marked in crease in rate of mineralization.
Over a short period of summer 1970 surveys of particulate organic material estimated as carbon (p.o.c.) were carried out along the length of the estuary. P.o.c. is variable (0.5 to 4 mg C/l), even apart from the variability due to phytoplankton blooms. However, higher levels of p.o.c. occurred towards the head of the estuary and lower concentrations near Calshot. Some evidence of higher levels was obtained on some occasions off Marchwood, near the entrance of the River Itchen, and on one survey, off Dock Head.
Surveys of dissolved organic material estimated as carbon (d.o.c.) were also conducted over a limited period of summer 1970. Concentrations were generally high (normally 1.5 to 3, max. 4 mg C/I). Some high values were found near the head of the estuary with lower concentrations near Calshot. On occasions there was a negative correlation between d.o.c. and salinity. Raised levels also appeared on
29-2
This content downloaded from 169.229.32.136 on Wed, 7 May 2014 18:29:48 PMAll use subject to JSTOR Terms and Conditions
462 J. E. G. Raymont (Discussion Meeting)
some surveys opposite Marchwood, at the Royal Pier, Docks and the mouth of the River Itchen. The large quantity of d.o.c. is noteworthy and this must be reckoned as an important part of the total pollutants entering the area.
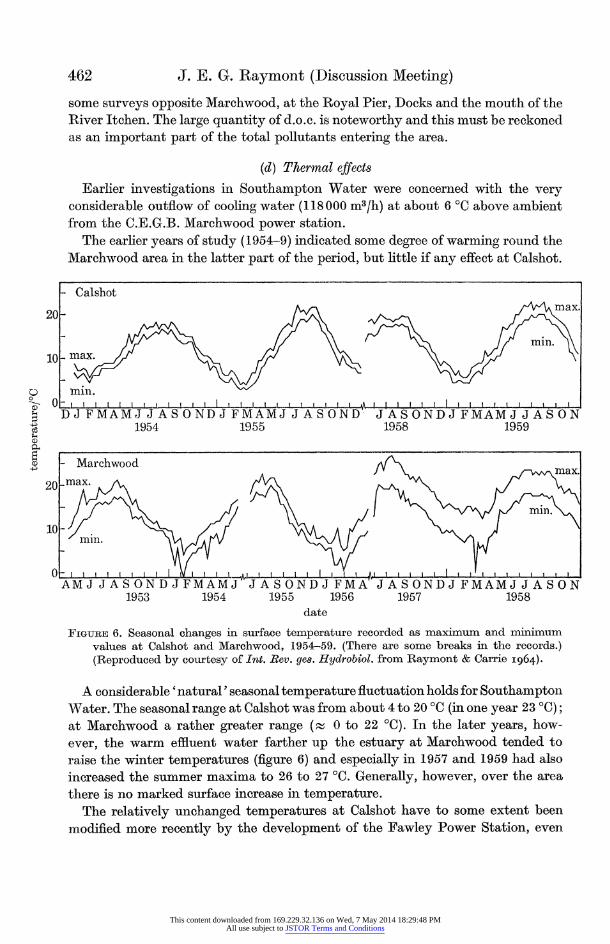
(d) Thermal effects Earlier investigations in Southampton Water were concerned with the very
considerable outflow of cooling water (118000 m3/h) at about 6 'C above ambient from the C.E.G.B. Marchwood power station.
The earlier years of study (1954-9) indicated some degree of warming round the Marchwood area in the latter part of the period, but little if any effect at Calshot.
Calshot
20- max.
min. 1o max.
0a I I t II I A I I I __ DJ FMAMJJASONDJFMAMJ JASOND JASONDJFMAMJJASON
1954 1955 1958 1959
Marchwoodc max
20 -max
10-
0 I1 L l I Aj
AMJ JASONDJFMAMJ JASONDJ FMA"JASONDJ FMAMJJASON 1953 1954 1955 1956 1957 1958
date FIGURE 6. Seasonal changes in surface temperature recorded as maximum and minilnum
values at Calshot and Marchwood, 1954-59. (There are some breaks in the records.) (Reproduced by courtesy of Int. Rev. ges. Hydrobiol. from Raymont & Carrie I964).
A considerable 'natural' seasonal temperature fluctuation holds for Southampton Water. The seasonal range at Calshot was from about 4 to 20 0C (in one year 23 ?C); at Marchwood a rather greater range (. 0 to 22 0C). In the later years, how- ever, the warm effluent water farther up the estuary at Marchwood tended to raise the winter temperatures (figure 6) and especially in 1957 and 1959 had also increased the summer maxima to 26 to 27 ?C. Generally, however, over the area there is no marked surface increase in temperature.
The relatively unchanged temperatures at Calshot have to some extent been modified more recently by the development of the Fawley Power Station, even
This content downloaded from 169.229.32.136 on Wed, 7 May 2014 18:29:48 PMAll use subject to JSTOR Terms and Conditions

Some aspects of pollution in Southampton Water 463
though its outfall is in the Solent, and most of the warm water drifts westward. Spencer (1970) has suggested that occasionally warm water may apparently creep round Calshot into Southampton Water. However, the effect is very localized and temperature changes are very limited as compared with the seasonal changes in Southampton Water. Occasionally reduction of surface salinity in the Marchwood area causes a warmed lens of water originating from the outfall to remain, despite its higher temperature, at an intermediate depth and drift for some time with the tidal flow. Such a body of water gives up its heat only relatively slowly, but the raised temperature pool is of relatively small extent.
Some indication of the surface raising of temperature is given by Savage (I969 a). With the outfall stream during h.w. slack reaching 6 'C above ambient, he showed that at 100 m distance temperature change was not measurable.
Since it was fairly certain that no marked kill of organisms occurred with the relatively small rise in temperature in Southampton Water, the effects of changed temperature on certain aspects of the biology of some marine animals and plants have been examined.
(i) Effects on phytoplankton Savage (I969 a) carried out laboratory and field investigations to test the effects
of raised temperature from the Marchwood effluent on phytoplankton. In both field and laboratory experiments the assimilation capacity of the phytoplankton, measured as uptake of 14C, was used as an indicator of any deleterious effects.
Phytoplankton taken from the intake to the power station and from the outflow showed no appreciable difference in assimilation capacity. Phytoplankton may, therefore, pass through the power station with the very considerable increase in temperature without suffering permanent damage. This conclusion was to some extent supported by laboratory experiments with two cultures (Isochrysis and Dunaliella). With cultures acclimatized to ambient temperature, increases of 5 and even 10 ?C had no significant effect. Only with an increase of 20 ?C (from 16 to 36 ?C) was there a marked effect on carbon assimilation; a 7 % reduction in February and a maximum of 22 % reduction in June. The time for which the phytoplankton is exposed to high temperature appears to be critical; short ex- posures apparently are not harmful. For example, a 20 00 rise in temperature had relatively little effect on photosynthetic ability with an exposure of 10 min, but there was a marked depressing influence when exposure lasted for 22 min (cf. Ukeles I96I; Hirayama & Hirano I970).
It is likely, however, that different groups or species of phytoplankton may react to varying degrees to thermal changes. For example, naked nanoplankton flagellates may be very different from relatively large diatom species. Savage (I969 b) has used fractionation techniques to commence investigations on this problem. In Southampton Water only a relatively small fraction of phytoplankton production and crop is attributed to the larger cells (> 55 lxm diameter). Thus this fraction accounts for only 7 % of primary production, whereas the smaller cells
This content downloaded from 169.229.32.136 on Wed, 7 May 2014 18:29:48 PMAll use subject to JSTOR Terms and Conditions
464 J. E. G. Raymont (Discussion Meeting)
(20 to 55 ,vkm diameter) account for some 36 %, and the smallest nanoplankton fraction (< 20 I-m) accounts for 57 % of production. It will be essential to mo-itor effects of thermal changes on this nanoplankton which appears from microscopic examination to be composed mainly of flagellates and small diatoms.
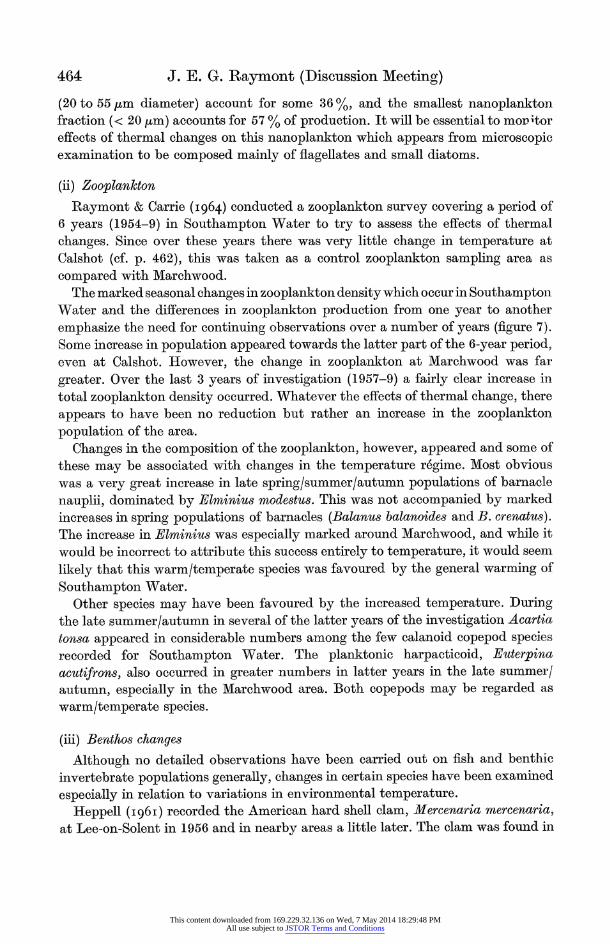
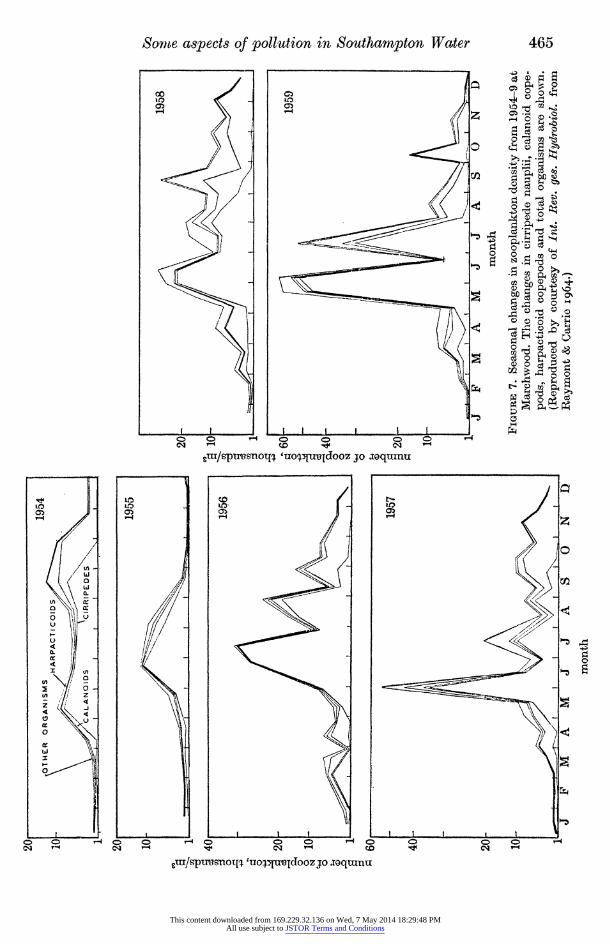
(ii) Zooplankton Raymont & Carrie (X964) conducted a zooplankton survey covering a period of
6 years (1954-9) in Southampton Water to try to assess the effects of thermal changes. Since over these years there was very little change in temperature at Calshot (cf. p. 462), this was taken as a control zooplankton sampling area as compared with Marchwood.
The marked seasonal changes in zooplankton density which occur in Southamptoll Water and the differences in zooplankton production from one year to another emphasize the need for continuing observations over a number of years (figure 7). Some increase in population appeared towards the latter part of the 6-year period, even at Calshot. However, the change in zooplankton at Marchwood was far greater. Over the last 3 years of investigation (1957-9) a fairly clear increase in total zooplankton density occurred. Whatever the effects of thermal change, there appears to have been no reduction but rather an increase in the zooplankton population of the area.
Changes in the composition of the zooplankton, however, appeared and some of these may be associated with changes in the temperature regime. Most obvious was a very great increase in late spring/summer/autumn populations of barnacle nauplii, dominated by Elmininus modestus. This was not accompanied by marked increases in spring populations of barnacles (Balanus balanoides and B. crenatus). The increase in Elminius was especially marked around Marchwood, and while it would be incorrect to attribute this success entirely to temperature, it would seem likely that this warm/temperate species was favoured by the general warming of Southampton Water.
Other species may have been favoured by the increased temperature. During the late summer/autumn in several of the latter years of the investigation Acartia tonsa appeared in considerable numbers among the few calanoid copepod species recorded for Southampton Water. The planktonic harpacticoid, Euterpina acutifrons, also occurred in greater numbers in latter years in the late summer/ autumn, especially in the Marchwood area. Both copepods may be regarded as warm/temperate species.
(iii) Benthos changes Although no detailed observations have been carried out on fish and benthic
invertebrate populations generally, changes in certain species have been examined especially in relation to variations in environmental temperature.
Heppell (I96i) recorded the American hard shell clam, Mercenaria mercenaria, at Lee-on-Solent in 1956 and in nearby areas a little later. The clam was found in
This content downloaded from 169.229.32.136 on Wed, 7 May 2014 18:29:48 PMAll use subject to JSTOR Terms and Conditions
Some aspects of pollution in Southampton Water 465
(z
I~~~~~~~~~~~~~~I
0
0o
0 0 ~~~~~~~~~ 0 0 _~~~~~~~0 0
to~~~~~~~~~~~~~~~~~~~~~~~~~~~~~~~~~~~c C)~ ~ ~ ~~~C
/ ~ ~ ~ ~ ~~~~~~~~~~~0~~~~ /1'~~~~~~~~~~~~~~~~~~~~~~~~~~~~~~~~~~~~~~~~~~~~~~~~~~~~~~~~~~~~~~~~~~-
CL~~~~~~~~~~~~~~~~~~~~~~~~~~~~~~~~~~~~~~~~~~1 0~~~~~~~~~~~~~~~~~~~~~~
5n /
'I
0
LAi
c~~~~ V4 ~~~~~~~ - -4 P-
p/-ptsrnotyl 'uojTpnj4oozjo roqmunu
This content downloaded from 169.229.32.136 on Wed, 7 May 2014 18:29:48 PMAll use subject to JSTOR Terms and Conditions

466 J. E. G. Raymont (Discussion Meeting)
Southampton Water in 1957 and from that date when a few specimens were taken, the species has now so extensively colonized Southampton Water that in many areas it is the dominant bivalve. A commercial fishery is now operating.
M. mercenaria is a warm/temperate species and though it can grow at lower temperatures, spawning occurs only at 24 to 25 'C (Belding I9I2; Nelson i928), or according to Loosanoff (I937) perhaps slightly below 24 0C although he quotes ca. 23 to 30 'C in the laboratory. Carriker (I96I) gives 22 to 30 00, but most frequently 24 to 26 0C as spawning temperatures for the species. Ansell (I963) suggested from experimental evidence that Southampton Water clams could spawn at about 18 'C.
A considerable spawning population undoubtedly now occurs, perhaps with the slightly raised temperature, in Southampton Water. Some ten years ago, it appeared that only certain years were favourable for spawning. For example, 1955 and 1959 were conspicuously 'good' years and these happened to be very warm years. Apparently a warm summer coinciding with slightly raised temperature from effluents in Southampton Water, together contribute to successful spawning and settlement. In latter years investigations by Mitchell perhaps suggest that spawnings occur more frequently, but certain years are still especially successful.
Mitchell has studied the occurrence of clam larvae in Southampton Water. His analysis for summer 1970 shows that spawning is limited to the warmest period of the year; from field observations he suggests a critical temperature of 18 to 19 'C. The first minor peak of larvae for samples taken from Royal Pier (figure 8) probably
20- / A
frL~~~~~ 0~~
15 /''S O
15- 1/ I " ~~~~~~~~~04-4
1()~ ~~~~~~- 00
1(-A~~~~~~~t- /l0
month
FIGuR}E 8. Seasonal occurrence of larvae of Meroenaria mercenacria in Southampton Water (Royal Pier). *, numbers per cubic metre taken in pump samples. Maximum (A) and minirnum (o) temperatures are indicated.
This content downloaded from 169.229.32.136 on Wed, 7 May 2014 18:29:48 PMAll use subject to JSTOR Terms and Conditions
Some aspects of pollution in Southampton Water 467
represents larvae originating from stock at Marchwood outfall where the tem- perature had already passed 18 'C. The second major peak suggests spawning of the Royal Pier -stock itself with a temperature rising above 18 'C (figure 8).
It is remarkable that the area west of Southampton Water is marked by a complete dearth of records of Mercenaria. Any warmed effects are rapidly shut off to the west. Eastwards, live specimens occur at Stokes Bay, with unconfirmed reports of odd specimens even to Chichester Harbour. Even in Southampton Water Mercenaria does not extend naturally below Hythe.
A remarkable feature of the Southampton Water population is the high density of clams. Carriker (I96I) quotes 3 clams/yd2 as a reasonable commercial density and apparently regards 'several per sq. ft.' as 'dense'. At Marchwood 100 clams of all sizes have been recorded in a square yard. In the outfall the highest density of commercial clams was 1 60/M2. Young clams are of course far denser; the highest figure is 4750/M2 of 10 mm mean size
GENERAL CONCLUSION
Investigations of concentrations of primary nutrients and of certain metallic ions in addition to oxygen data suggest that Southampton Water is not a grossly polluted area. However, the present quantities of nutrients and some metallic ions suggest that further increases in Southampton Water might have deleterious effects. Thermal changes appear to have no harmful effects, although the ecological balance between various species may be greatly changed.
The natural turbulence of Southampton Water in addition to the effluent inflows produce a large load of particulate matter, both inorganic and organic which must be related to pollution.
Any marked increase in urban and industrial development along Southampton Water must be carefully assessed by physical, chemical and biological surveys and constant monitoring of possible pollutants, in addition to experimental investi- gations on selected species.
I am greatly indebted to my colleagues and past students in the Oceanography Department, and to staff of the C.E.G.B. Marine Biological Laboratory, Fawley, for permission to use data, both published and unpublished.
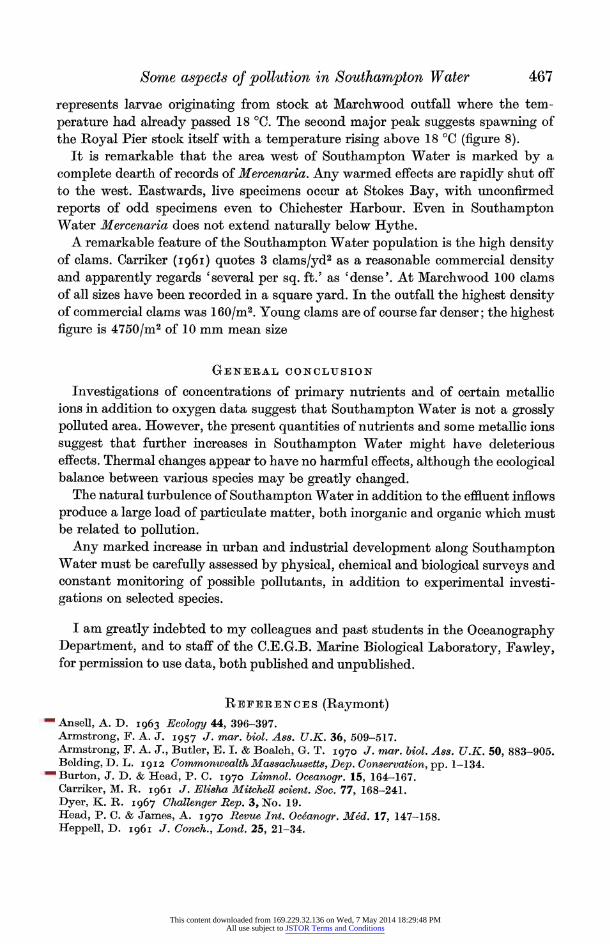
REFE RE NCES (Raymont) Ansell, A. D. I963 Ecology 44, 396-397. Armstrong, F. A. J. I957 J. mar. biol. Ass. U.K. 36, 509-517. Armstrong, F. A. J., Butler, E. L. & Boal?h, G. T. 1970 J. mar. biol. Ass. U.K. 50, 883-905. Belding, D. L. I9I2 Commonwealth Massachusetts, Dep. Conservation, pp. 1-134. Burton, J. D. & I-ead, P. C. I970 Limnol. Oceanogr. 15, 164-167. Carriker, M. R. I96I J. Elisha Mitchell scient. Soc. 77, 168-241. Dyer, K. R. I967 Challenger Rep. 3, No. 19. Head, P. C. & James, A. I970 Revue Int. Oceanogr. Med. 17, 147-158. Heppell, D. I96I J. Conch., Lond. 25, 21-34.
This content downloaded from 169.229.32.136 on Wed, 7 May 2014 18:29:48 PMAll use subject to JSTOR Terms and Conditions

468 J. E. G. Raymont (Discussion Meeting) Hirayama, K. & Hirano, R. 1970 Mar. Biol. 7, 205-213. Hobden, D. J. I967 J. mar. biol. Ass. U.K. 47, 597-606. Jeffries, H. P. i962 Limnol. Oceanogr. 7, 21-31. Loosanoff, V. L. 1937 Ecology 18, 506-515. Mommaerts, J. P. I969 J. mar. biol. Ass. U.K. 49, 749-765. Mommaerts, J. P. I970 J. mar. biol. Ass. U.K. 50, 849-855. Nelson, T. C. I928 Science, N.Y. 67, 220-221. Raymont, J. E. G. & Carrie, B. G. A. I964 Int. Revue ges. Hydrobiol. 49, 185-232. Romeril, M. G. 197 I C.E.R.L. Laboratory Note No. RD/L/N 31/71, 1-8. Savage, P. D. V. i969a C.E.R.L.-Laboratory Memorandum No. RD/L/M 269, 27-32. Savage, P. D. V. i969b C.E.R.L. Laboratory Memorandum No. RD/LIM 269, 44-49. Segar, D. A., Collins, J. D. & Riley, J. P. I97I J. mar. biol. Ass. U.K. 51, 131-136. Spencer, J. F. I 970 C.E.R.L. Laboratory Note No. RD/L/N 183/70, 1-5. Ukeles, R. I96I Biol. Bull. mar. Lab., Woods Hole 120, 255-264. Williams, P. J. LeB. & Askew, C. I968 Deep Sea Res. 15, 365-375. Williams, P. J. LeB. & Gray, R. W. I970 J. mar. biol. Ass. U.K. 50, 871-881
This content downloaded from 169.229.32.136 on Wed, 7 May 2014 18:29:48 PMAll use subject to JSTOR Terms and Conditions