Embed Size (px)
Citation preview
Volume 40, Number 4, 2014
A CONTRIBUTION TO RESEARCH OF SOME PHYSICAL
CHARACTERISTICS OF DISC BRAKES IN LABORATORY
CONDITIONS
Jasna Glišović1 PhD, Assitant Professor, Miroslav Demić
2, PhD, Full Professor, Jovanka
Lukić,3 PhD, Full Professor, Danijela Miloradović
4, PhD, Assitant Professor, Jasmina
Blagojević5, PhD Student, Sandra Veličković
6, PhD Student
UDC:629.017
INTRODUCTION
The main task of the brake mechanisms is to achieve the necessary braking torque
acting on the wheel of the vehicle, causing its deceleration, and thus braking of the vehicle.
Therefore, the braking torque is a fundamental characteristic of every brake, the measuring
tool of its functional properties or performances.
Calculation methods and testing procedures for disk brake mechanisms, presented
in a large number of papers [1,2,3,4], have passed through several stages in their
development. Calculation methods have experienced the most intense progress thanks to the
development of computer techniques. In this way, numerical methods have become the
basic calculation methods, without which, it cannot be possible to imagine the development
of many products today in technologically advanced countries. These methods allow rapid
analysis of a large number of different combinations and the selection of the optimal
solution (optimization). Numerical methods [5,6] are approximate and they require reliable
information based on which the boundary conditions are derived. Thus, there is their direct
connection with the testing of brake mechanisms that provides information of high precision
and quality, thanks to advancement of measurement and processing techniques and analysis
of measurement results. In this way, the period needed for the development of new brake's
elements is significantly reduced. The large part of the brake system testing is verification of
compliance with the requirements of international and national regulations. Developmental
researches are very diverse and necessary for the introduction of new product or
improvement of the existing products.
A large number of physical parameters of the disc brake are recorded during the
experimental research with special attention given to the brake fluid’s pressure in the brake
cylinder, the braking torque, disk speed and brake squeal expressed as sound pressure level
(SPL). Over the years, many laboratory and road tests with a wide range of options and
approaches have been developed. Modern dynamometers for testing the brakes have become
1 Jasna Glišović, University of Kragujevac, Faculty of Engineering, Sestre Janjić 6, 34000
Kragujevac, email: [email protected]
2 Miroslav Demić, University of Kragujevac, Faculty of Engineering, Sestre Janjić 6, 34000
Kragujevac, email: [email protected] 3 Jovanka Lukić, University of Kragujevac, Faculty of Engineering, Sestre Janjić 6, 34000
Kragujevac, email: [email protected] 4 Danijela Miloradović, University of Kragujevac, Faculty of Engineering, Sestre Janjić 6, 34000
Kragujevac, email: [email protected] 5 Jasmina Blagojević, University of Kragujevac, Faculty of Engineering, Sestre Janjić 6, 34000
Kragujevac, email: [email protected] 6 Sandra Veličković, University of Kragujevac, Faculty of Engineering, Sestre Janjić 6, 34000
Kragujevac, email: [email protected]
A contribution to research of some physical characteristics of disc brakes in laboratory
conditions
Volume 40, Number 4, 2014
34
the sophisticated test platforms for the identification of the brake characteristics and for the
diagnostic of the noise problem
The work of disc brakes during the braking process is defined with physical output
parameters: activation force, brake torque, brake noise, thermal load, etc. The aim of this
paper was to determine the minimum number of mutually independent physical parameters
which represent, with reasonable accuracy, braking characteristics of disc brakes. Thermal
stress is an important parameter of brakes. However, it is not independent parameter because
it can be calculated based on the braking torque and rotation angle of the brake disc. Bearing
in mind that the aim of this paper is to analyse the correlation between the minimum
numbers of independent brake parameters, it is justified not to pay attention to thermal load
as a dependent parameter in this paper.
Performed analyses show that there are different approaches and there are still no
generally accepted methods for evaluation of characteristics and output parameters of disk
brake mechanisms [7]. One method for definition of criteria for evaluation of physical
properties of disc brakes of motor vehicles that includes the phase of experimental
measurements and the subsequent processing of the recorded data is presented in this paper.
EXPERIMENTAL RESEARCH
Description of measurement installation
Brake dynamometer for testing disc brake noise has been developed at the
Laboratory for IC engines at the Faculty of Engineering, University of Kragujevac. Since
the moment of inertia of the brake disc on rotating drive shaft is equivalent to a linear inertia
of the vehicle, it is possible to include the influence of vehicle inertia and thus provide more
reliable results in laboratory conditions. The installation consists of several functional units:
• Test bench with the electromotor, power transmission and disc,
• Electric power installation,
• Installation for activation of the disk brake i.e. for generation of the
braking torque,
• Measuring equipment.
Electromotor is mounted on the stand that is rigidly connected. The drive block
consists of: asynchronous electric motor fed by frequency regulator, friction belt
transmission with ratio equal to 1, inertial mass and brake disc. The speed sensor is mounted
at the free end of the electromotor's shaft. The inertial mass on the input shaft is made in the
form of the disc with diameter of 0.35 m, width of 0.045 m and mass of 35 kg. Mass
moment of inertia has value of 0.54 kgm2 and it corresponds to the kinetic energy of the test
vehicle, at low initial speeds, which are critical in terms of the frequent appearance of brake
squeal [8].
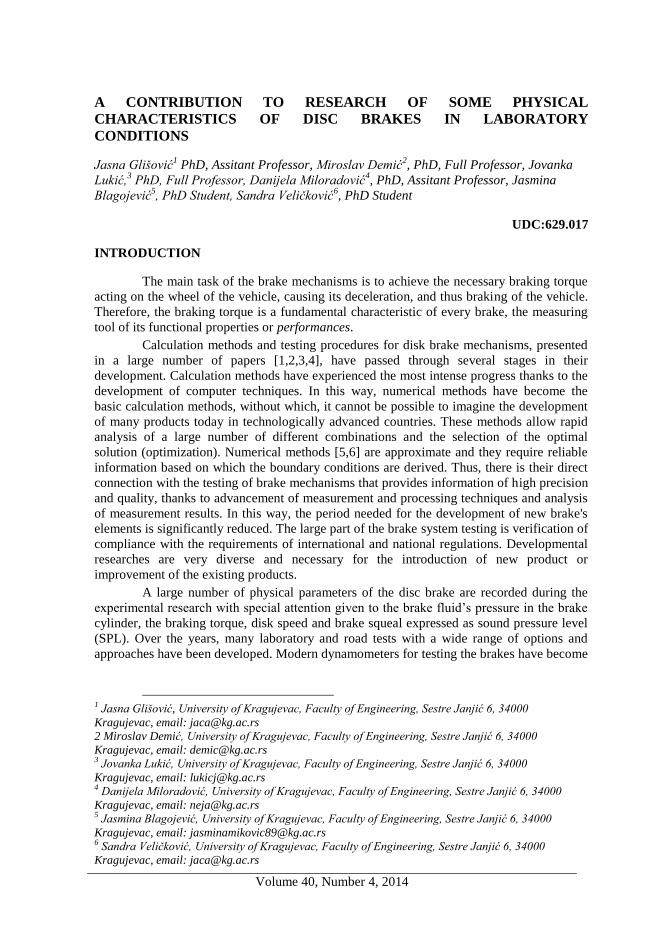
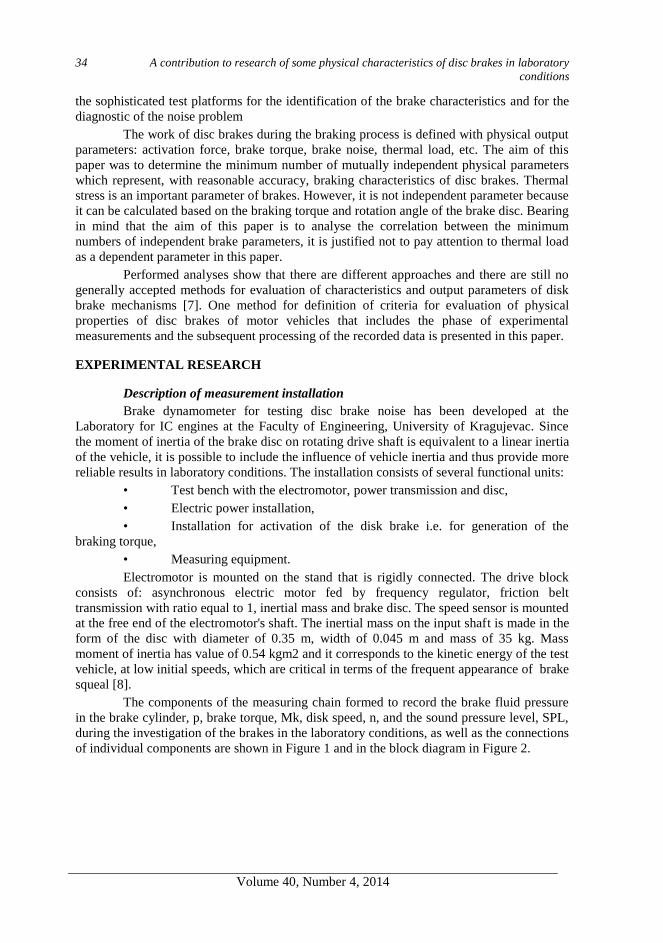
The components of the measuring chain formed to record the brake fluid pressure
in the brake cylinder, p, brake torque, Mk, disk speed, n, and the sound pressure level, SPL,
during the investigation of the brakes in the laboratory conditions, as well as the connections
of individual components are shown in Figure 1 and in the block diagram in Figure 2.
Jasna Glišović , Miroslav Demić, Jovanka Lukić, Danijela Miloradović,
Jasmina Blagojević, Sandra Veličković
Volume 40, Number 4, 2014
35
Figure 1: Photo of designed measuring installation for research of the brake noise [8]
Figure 2: Measuring chain for analysis of disc brake parameters in laboratory conditions
[8]
During the experimental research, the two categories of tests were performed: with
constant disc rotation speed and for different braking pressures in the disc brake cylinder
and with constant brake pressure and varying speeds. Performed tests correspond to braking
of the vehicle with disengaged clutch i.e. with interrupted power transmission.
A contribution to research of some physical characteristics of disc brakes in laboratory
conditions
Volume 40, Number 4, 2014
36
Test regimes:
Constant disc speed and different brake pressures:
• Constant disc speed in range from 250 to 1000 min-1
is applied.
• For every disc speed value, different pressures in range from 0.5 to 3 MPa with
increment of p = 0.5 MPa are applied.
Constant brake pressure and different disc speeds:
• Constant maximum pressure in the range from 0.5 to 3 MPa is applied.
• For every pressure value, the different disc speeds in the range from 250 to 1000
min-1
with increment of n = 50 min-1
are applied.
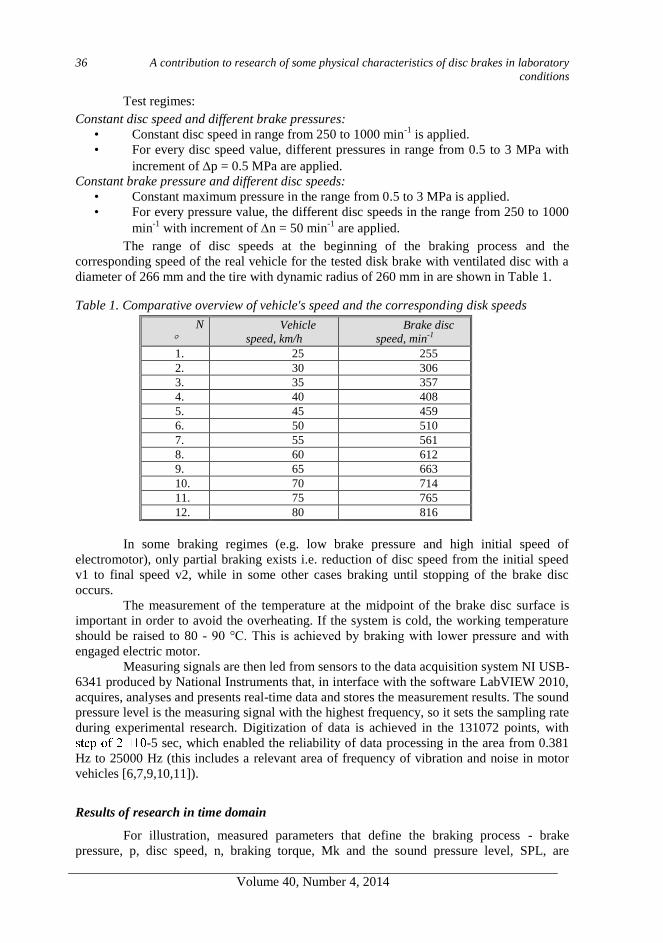
The range of disc speeds at the beginning of the braking process and the
corresponding speed of the real vehicle for the tested disk brake with ventilated disc with a
diameter of 266 mm and the tire with dynamic radius of 260 mm in are shown in Table 1.
Table 1. Comparative overview of vehicle's speed and the corresponding disk speeds
N
Vehicle
speed, km/h
Brake disc
speed, min-1
1. 25 255
2. 30 306
3. 35 357
4. 40 408
5. 45 459
6. 50 510
7. 55 561
8. 60 612
9. 65 663
10. 70 714
11. 75 765
12. 80 816
In some braking regimes (e.g. low brake pressure and high initial speed of
electromotor), only partial braking exists i.e. reduction of disc speed from the initial speed
v1 to final speed v2, while in some other cases braking until stopping of the brake disc
occurs.
The measurement of the temperature at the midpoint of the brake disc surface is
important in order to avoid the overheating. If the system is cold, the working temperature
should be raised to 80 - 90 °C. This is achieved by braking with lower pressure and with
engaged electric motor.
Measuring signals are then led from sensors to the data acquisition system NI USB-
6341 produced by National Instruments that, in interface with the software LabVIEW 2010,
acquires, analyses and presents real-time data and stores the measurement results. The sound
pressure level is the measuring signal with the highest frequency, so it sets the sampling rate
during experimental research. Digitization of data is achieved in the 131072 points, with
-5 sec, which enabled the reliability of data processing in the area from 0.381
Hz to 25000 Hz (this includes a relevant area of frequency of vibration and noise in motor
vehicles [6,7,9,10,11]).
Results of research in time domain
For illustration, measured parameters that define the braking process - brake
pressure, p, disc speed, n, braking torque, Mk and the sound pressure level, SPL, are
Jasna Glišović , Miroslav Demić, Jovanka Lukić, Danijela Miloradović,
Jasmina Blagojević, Sandra Veličković
Volume 40, Number 4, 2014
37
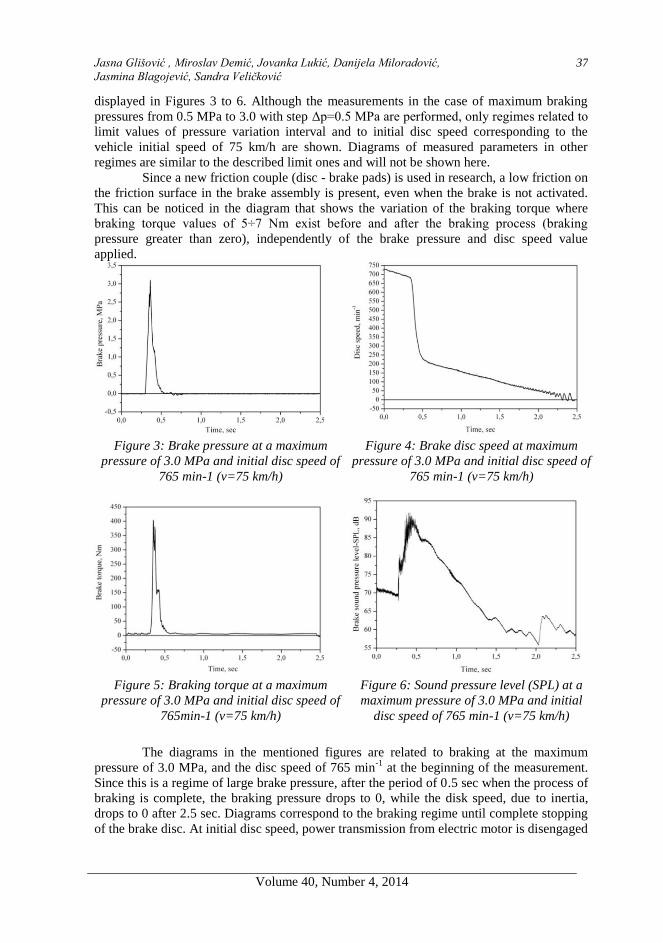
displayed in Figures 3 to 6. Although the measurements in the case of maximum braking
pressures from 0.5 MPa to 3.0 with step Δp=0.5 MPa are performed, only regimes related to
limit values of pressure variation interval and to initial disc speed corresponding to the
vehicle initial speed of 75 km/h are shown. Diagrams of measured parameters in other
regimes are similar to the described limit ones and will not be shown here.
Since a new friction couple (disc - brake pads) is used in research, a low friction on
the friction surface in the brake assembly is present, even when the brake is not activated.
This can be noticed in the diagram that shows the variation of the braking torque where
braking torque values of 5÷7 Nm exist before and after the braking process (braking
pressure greater than zero), independently of the brake pressure and disc speed value
applied.
Figure 3: Brake pressure at a maximum
pressure of 3.0 MPa and initial disc speed of
765 min-1 (v=75 km/h)
Figure 4: Brake disc speed at maximum
pressure of 3.0 MPa and initial disc speed of
765 min-1 (v=75 km/h)
Figure 5: Braking torque at a maximum
pressure of 3.0 MPa and initial disc speed of
765min-1 (v=75 km/h)
Figure 6: Sound pressure level (SPL) at a
maximum pressure of 3.0 MPa and initial
disc speed of 765 min-1 (v=75 km/h)
The diagrams in the mentioned figures are related to braking at the maximum
pressure of 3.0 MPa, and the disc speed of 765 min-1
at the beginning of the measurement.
Since this is a regime of large brake pressure, after the period of 0.5 sec when the process of
braking is complete, the braking pressure drops to 0, while the disk speed, due to inertia,
drops to 0 after 2.5 sec. Diagrams correspond to the braking regime until complete stopping
of the brake disc. At initial disc speed, power transmission from electric motor is disengaged
A contribution to research of some physical characteristics of disc brakes in laboratory
conditions
Volume 40, Number 4, 2014
38
(the case of stopping the vehicle without brakes), so at the moment when the brake is
activated (t=0.3 sec), the disc speed is reduced to 690 min-1
.
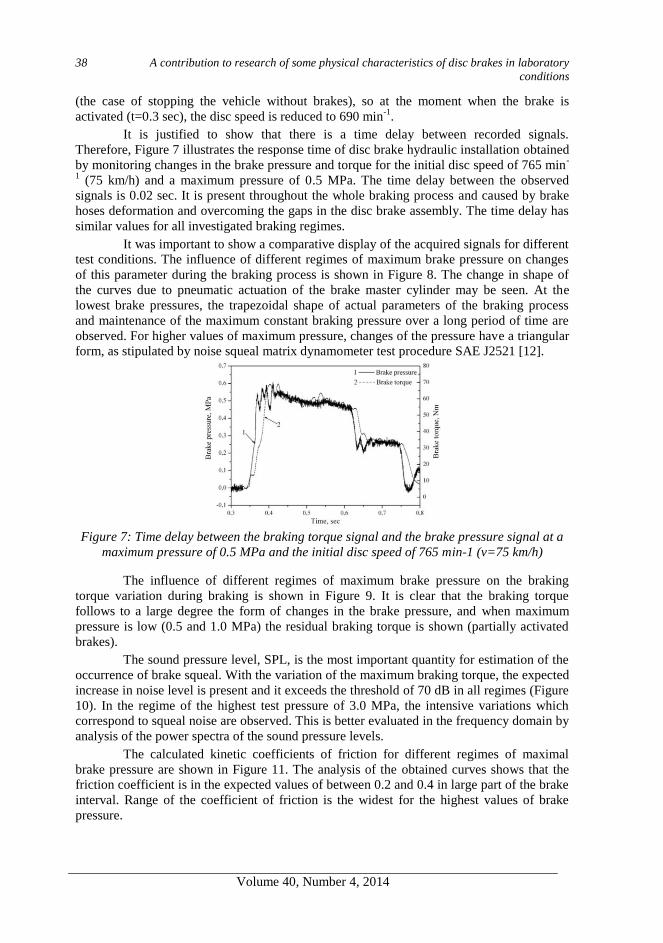
It is justified to show that there is a time delay between recorded signals.
Therefore, Figure 7 illustrates the response time of disc brake hydraulic installation obtained
by monitoring changes in the brake pressure and torque for the initial disc speed of 765 min-
1 (75 km/h) and a maximum pressure of 0.5 MPa. The time delay between the observed
signals is 0.02 sec. It is present throughout the whole braking process and caused by brake
hoses deformation and overcoming the gaps in the disc brake assembly. The time delay has
similar values for all investigated braking regimes.
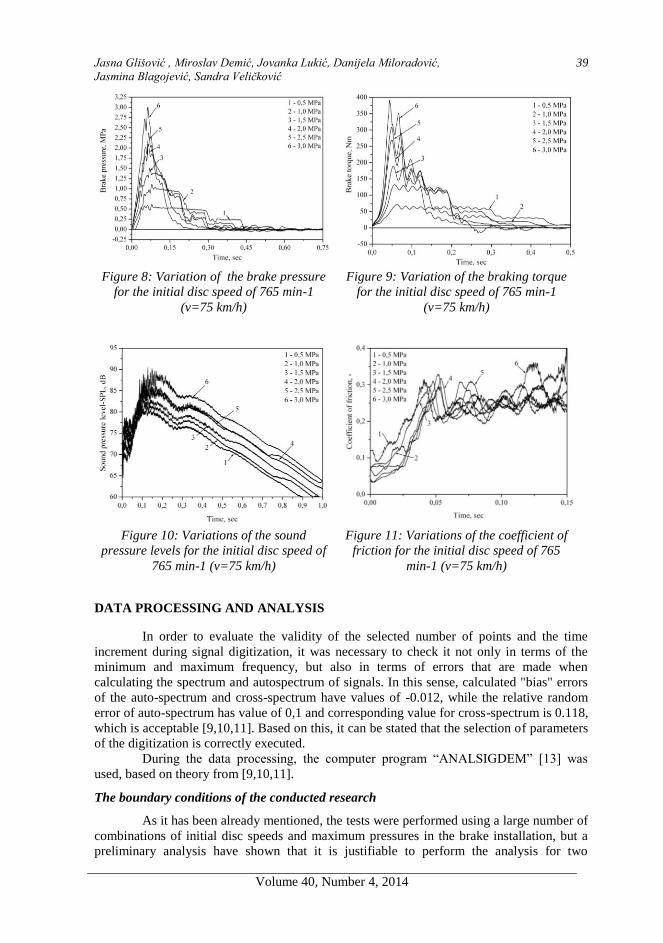
It was important to show a comparative display of the acquired signals for different
test conditions. The influence of different regimes of maximum brake pressure on changes
of this parameter during the braking process is shown in Figure 8. The change in shape of
the curves due to pneumatic actuation of the brake master cylinder may be seen. At the
lowest brake pressures, the trapezoidal shape of actual parameters of the braking process
and maintenance of the maximum constant braking pressure over a long period of time are
observed. For higher values of maximum pressure, changes of the pressure have a triangular
form, as stipulated by noise squeal matrix dynamometer test procedure SAE J2521 [12].
Figure 7: Time delay between the braking torque signal and the brake pressure signal at a
maximum pressure of 0.5 MPa and the initial disc speed of 765 min-1 (v=75 km/h)
The influence of different regimes of maximum brake pressure on the braking
torque variation during braking is shown in Figure 9. It is clear that the braking torque
follows to a large degree the form of changes in the brake pressure, and when maximum
pressure is low (0.5 and 1.0 MPa) the residual braking torque is shown (partially activated
brakes).
The sound pressure level, SPL, is the most important quantity for estimation of the
occurrence of brake squeal. With the variation of the maximum braking torque, the expected
increase in noise level is present and it exceeds the threshold of 70 dB in all regimes (Figure
10). In the regime of the highest test pressure of 3.0 MPa, the intensive variations which
correspond to squeal noise are observed. This is better evaluated in the frequency domain by
analysis of the power spectra of the sound pressure levels.
The calculated kinetic coefficients of friction for different regimes of maximal
brake pressure are shown in Figure 11. The analysis of the obtained curves shows that the
friction coefficient is in the expected values of between 0.2 and 0.4 in large part of the brake
interval. Range of the coefficient of friction is the widest for the highest values of brake
pressure.
Jasna Glišović , Miroslav Demić, Jovanka Lukić, Danijela Miloradović,
Jasmina Blagojević, Sandra Veličković
Volume 40, Number 4, 2014
39
Figure 8: Variation of the brake pressure
for the initial disc speed of 765 min-1
(v=75 km/h)
Figure 9: Variation of the braking torque
for the initial disc speed of 765 min-1
(v=75 km/h)
Figure 10: Variations of the sound
pressure levels for the initial disc speed of
765 min-1 (v=75 km/h)
Figure 11: Variations of the coefficient of
friction for the initial disc speed of 765
min-1 (v=75 km/h)
DATA PROCESSING AND ANALYSIS
In order to evaluate the validity of the selected number of points and the time
increment during signal digitization, it was necessary to check it not only in terms of the
minimum and maximum frequency, but also in terms of errors that are made when
calculating the spectrum and autospectrum of signals. In this sense, calculated "bias" errors
of the auto-spectrum and cross-spectrum have values of -0.012, while the relative random
error of auto-spectrum has value of 0,1 and corresponding value for cross-spectrum is 0.118,
which is acceptable [9,10,11]. Based on this, it can be stated that the selection of parameters
of the digitization is correctly executed.
During the data processing, the computer program “ANALSIGDEM” [13] was
used, based on theory from [9,10,11].
The boundary conditions of the conducted research
As it has been already mentioned, the tests were performed using a large number of
combinations of initial disc speeds and maximum pressures in the brake installation, but a
preliminary analysis have shown that it is justifiable to perform the analysis for two
A contribution to research of some physical characteristics of disc brakes in laboratory
conditions
Volume 40, Number 4, 2014
40
boundary conditions of the mentioned parameters (minimum and maximum values of the
braking pressure in the installation).
In this regard, the following parameters of disc brakes were analyzed for extreme
conditions:
a) the same initial disc speed (around 750 min-1), but for different pressures
in the brake installation and
b) the same maximum pressure (3 MPa), but for different initial disc speeds.
In order to determine the validity of performing tests with different initial
conditions, it is necessary to analyse the existence of the correlation between the identical
registered values in various tests, because if there is a high correlation, then it is not
necessary to perform a large number of tests, and vice versa. In order to analyse the
influence of test conditions on the physical characteristics of the disc brakes, the cross-
correlation coefficients functions [9,10,11] were calculated for test a) and test b).
The interactions between the following parameters are observed during the test a)
and the test b):
• disc speed,
• braking torque,
• pressure in the brake installation and
• brake noise.
The following couples of registered parameters are observed:
• disc speed - brake torque,
• disc speed - brake noise,
• brake pressure in the installation - braking torque,
• brake pressure in the installation - brake noise and
• disc speed - brake pressure in the installation.
Cross-correlations coefficient in the case of the same initial disc speeds
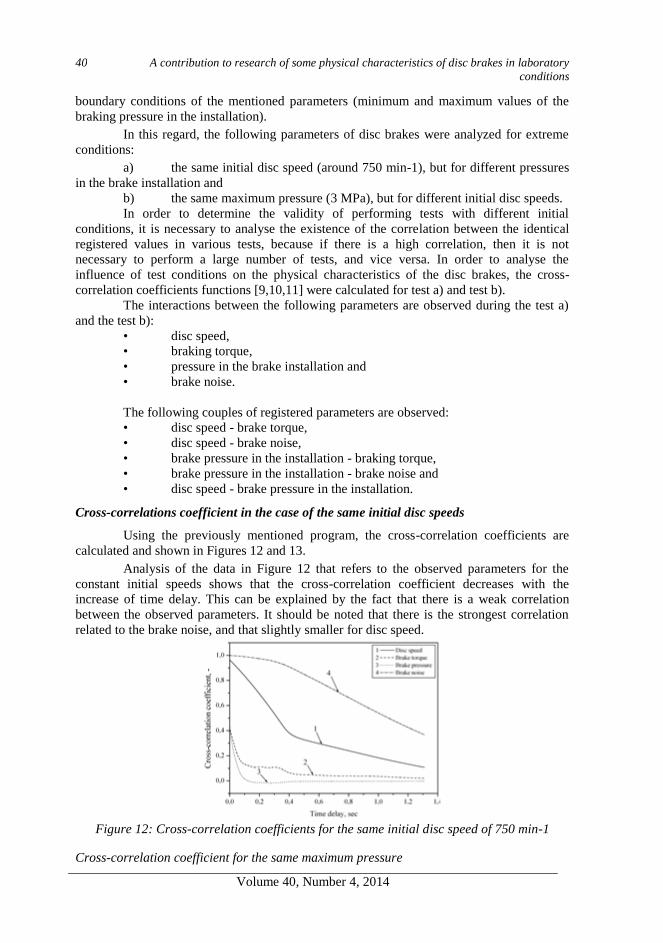
Using the previously mentioned program, the cross-correlation coefficients are
calculated and shown in Figures 12 and 13.
Analysis of the data in Figure 12 that refers to the observed parameters for the
constant initial speeds shows that the cross-correlation coefficient decreases with the
increase of time delay. This can be explained by the fact that there is a weak correlation
between the observed parameters. It should be noted that there is the strongest correlation
related to the brake noise, and that slightly smaller for disc speed.
Figure 12: Cross-correlation coefficients for the same initial disc speed of 750 min-1
Cross-correlation coefficient for the same maximum pressure
Jasna Glišović , Miroslav Demić, Jovanka Lukić, Danijela Miloradović,
Jasmina Blagojević, Sandra Veličković
Volume 40, Number 4, 2014
41
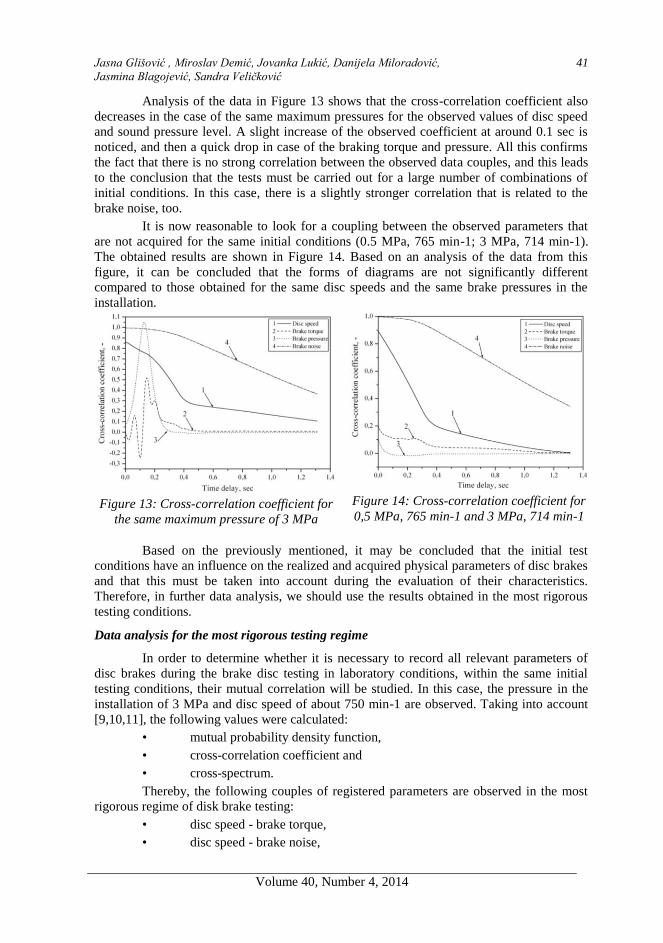
Analysis of the data in Figure 13 shows that the cross-correlation coefficient also
decreases in the case of the same maximum pressures for the observed values of disc speed
and sound pressure level. A slight increase of the observed coefficient at around 0.1 sec is
noticed, and then a quick drop in case of the braking torque and pressure. All this confirms
the fact that there is no strong correlation between the observed data couples, and this leads
to the conclusion that the tests must be carried out for a large number of combinations of
initial conditions. In this case, there is a slightly stronger correlation that is related to the
brake noise, too.
It is now reasonable to look for a coupling between the observed parameters that
are not acquired for the same initial conditions (0.5 MPa, 765 min-1; 3 MPa, 714 min-1).
The obtained results are shown in Figure 14. Based on an analysis of the data from this
figure, it can be concluded that the forms of diagrams are not significantly different
compared to those obtained for the same disc speeds and the same brake pressures in the
installation.
Figure 13: Cross-correlation coefficient for
the same maximum pressure of 3 MPa
Figure 14: Cross-correlation coefficient for
0,5 MPa, 765 min-1 and 3 MPa, 714 min-1
Based on the previously mentioned, it may be concluded that the initial test
conditions have an influence on the realized and acquired physical parameters of disc brakes
and that this must be taken into account during the evaluation of their characteristics.
Therefore, in further data analysis, we should use the results obtained in the most rigorous
testing conditions.
Data analysis for the most rigorous testing regime
In order to determine whether it is necessary to record all relevant parameters of
disc brakes during the brake disc testing in laboratory conditions, within the same initial
testing conditions, their mutual correlation will be studied. In this case, the pressure in the
installation of 3 MPa and disc speed of about 750 min-1 are observed. Taking into account
[9,10,11], the following values were calculated:
• mutual probability density function,
• cross-correlation coefficient and
• cross-spectrum.
Thereby, the following couples of registered parameters are observed in the most
rigorous regime of disk brake testing:
• disc speed - brake torque,
• disc speed - brake noise,
A contribution to research of some physical characteristics of disc brakes in laboratory
conditions
Volume 40, Number 4, 2014
42
• brake pressure in the installation - braking torque,
• brake pressure in the installation - brake noise and
• disc speed - brake pressure in the installation.
Mutual probability density functions
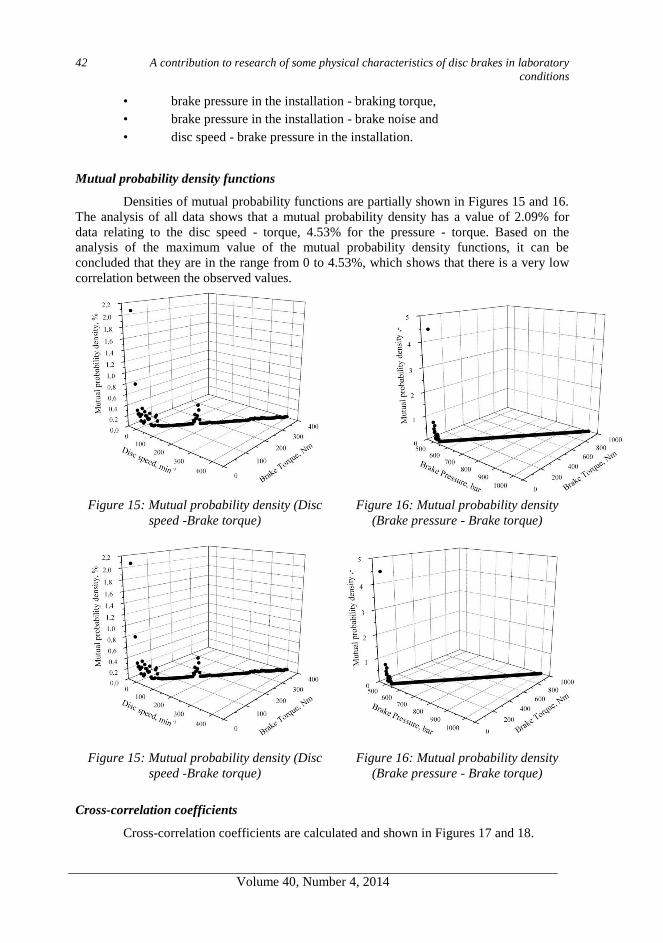
Densities of mutual probability functions are partially shown in Figures 15 and 16.
The analysis of all data shows that a mutual probability density has a value of 2.09% for
data relating to the disc speed - torque, 4.53% for the pressure - torque. Based on the
analysis of the maximum value of the mutual probability density functions, it can be
concluded that they are in the range from 0 to 4.53%, which shows that there is a very low
correlation between the observed values.
Figure 15: Mutual probability density (Disc
speed -Brake torque)
Figure 16: Mutual probability density
(Brake pressure - Brake torque)
Figure 15: Mutual probability density (Disc
speed -Brake torque)
Figure 16: Mutual probability density
(Brake pressure - Brake torque)
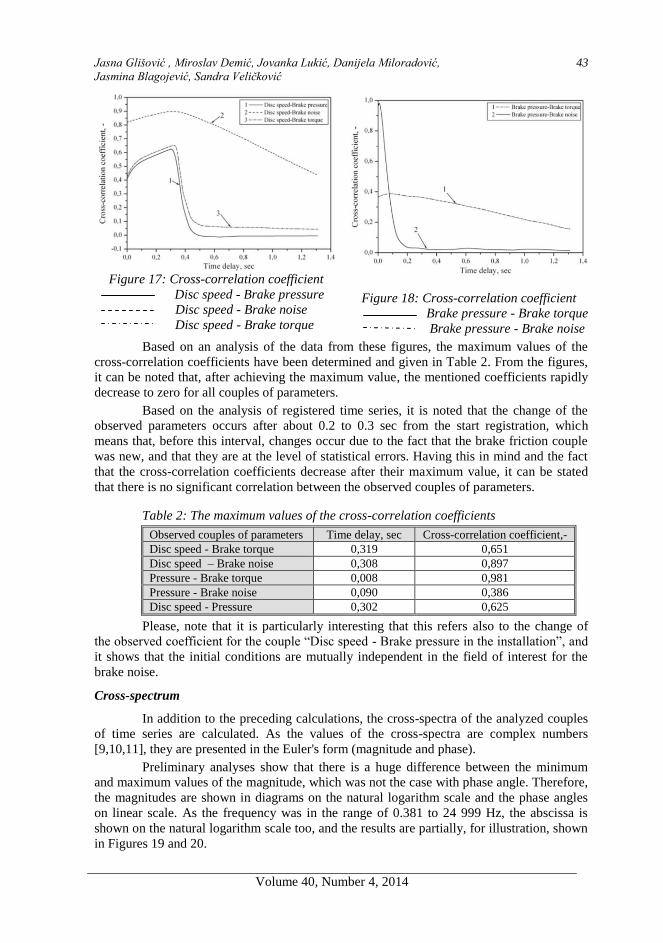
Cross-correlation coefficients
Cross-correlation coefficients are calculated and shown in Figures 17 and 18.
Jasna Glišović , Miroslav Demić, Jovanka Lukić, Danijela Miloradović,
Jasmina Blagojević, Sandra Veličković
Volume 40, Number 4, 2014
43
Figure 17: Cross-correlation coefficient
Disc speed - Brake pressure
Disc speed - Brake noise
Disc speed - Brake torque
Figure 18: Cross-correlation coefficient
Brake pressure - Brake torque
Brake pressure - Brake noise
Based on an analysis of the data from these figures, the maximum values of the
cross-correlation coefficients have been determined and given in Table 2. From the figures,
it can be noted that, after achieving the maximum value, the mentioned coefficients rapidly
decrease to zero for all couples of parameters.
Based on the analysis of registered time series, it is noted that the change of the
observed parameters occurs after about 0.2 to 0.3 sec from the start registration, which
means that, before this interval, changes occur due to the fact that the brake friction couple
was new, and that they are at the level of statistical errors. Having this in mind and the fact
that the cross-correlation coefficients decrease after their maximum value, it can be stated
that there is no significant correlation between the observed couples of parameters.
Table 2: The maximum values of the cross-correlation coefficients
Observed couples of parameters Time delay, sec Cross-correlation coefficient,-
Disc speed - Brake torque 0,319 0,651
Disc speed – Brake noise 0,308 0,897
Pressure - Brake torque 0,008 0,981
Pressure - Brake noise 0,090 0,386
Disc speed - Pressure 0,302 0,625
Please, note that it is particularly interesting that this refers also to the change of
the observed coefficient for the couple “Disc speed - Brake pressure in the installation”, and
it shows that the initial conditions are mutually independent in the field of interest for the
brake noise.
Cross-spectrum
In addition to the preceding calculations, the cross-spectra of the analyzed couples
of time series are calculated. As the values of the cross-spectra are complex numbers
[9,10,11], they are presented in the Euler's form (magnitude and phase).
Preliminary analyses show that there is a huge difference between the minimum
and maximum values of the magnitude, which was not the case with phase angle. Therefore,
the magnitudes are shown in diagrams on the natural logarithm scale and the phase angles
on linear scale. As the frequency was in the range of 0.381 to 24 999 Hz, the abscissa is
shown on the natural logarithm scale too, and the results are partially, for illustration, shown
in Figures 19 and 20.
A contribution to research of some physical characteristics of disc brakes in laboratory
conditions
Volume 40, Number 4, 2014
44
a) b)
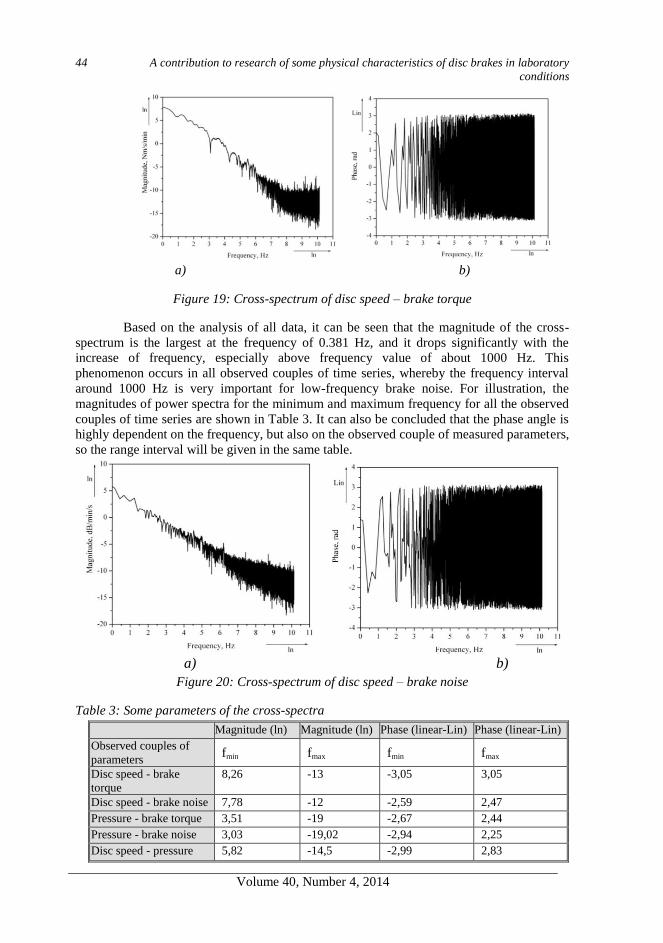
Figure 19: Cross-spectrum of disc speed – brake torque
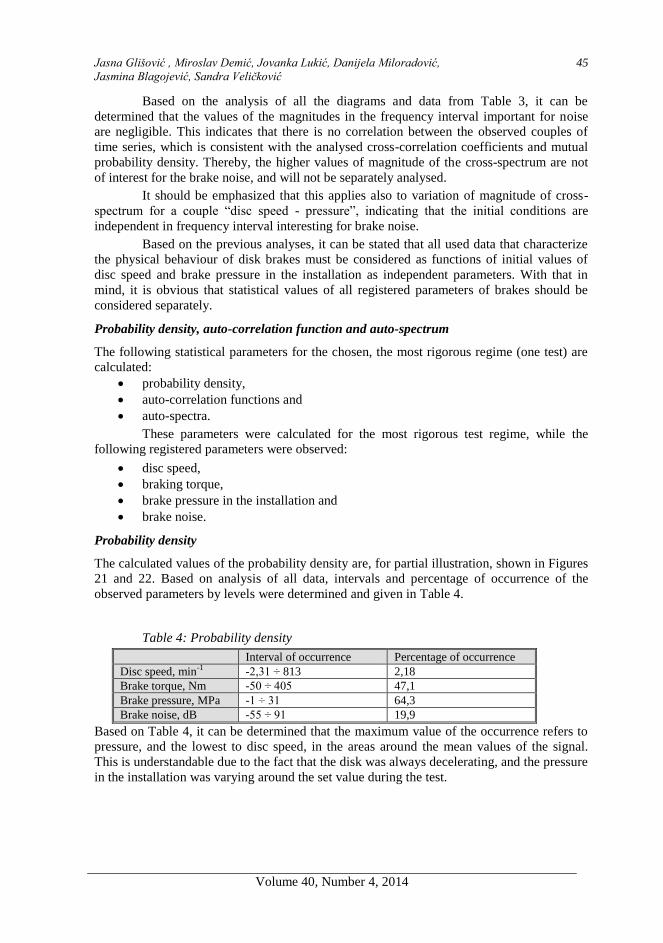
Based on the analysis of all data, it can be seen that the magnitude of the cross-
spectrum is the largest at the frequency of 0.381 Hz, and it drops significantly with the
increase of frequency, especially above frequency value of about 1000 Hz. This
phenomenon occurs in all observed couples of time series, whereby the frequency interval
around 1000 Hz is very important for low-frequency brake noise. For illustration, the
magnitudes of power spectra for the minimum and maximum frequency for all the observed
couples of time series are shown in Table 3. It can also be concluded that the phase angle is
highly dependent on the frequency, but also on the observed couple of measured parameters,
so the range interval will be given in the same table.
a) b)
Figure 20: Cross-spectrum of disc speed – brake noise
Table 3: Some parameters of the cross-spectra
Magnitude (ln) Magnitude (ln) Phase (linear-Lin) Phase (linear-Lin)
Observed couples of
parameters fmin fmax fmin fmax
Disc speed - brake
torque
8,26 -13 -3,05 3,05
Disc speed - brake noise 7,78 -12 -2,59 2,47
Pressure - brake torque 3,51 -19 -2,67 2,44
Pressure - brake noise 3,03 -19,02 -2,94 2,25
Disc speed - pressure 5,82 -14,5 -2,99 2,83
Jasna Glišović , Miroslav Demić, Jovanka Lukić, Danijela Miloradović,
Jasmina Blagojević, Sandra Veličković
Volume 40, Number 4, 2014
45
Based on the analysis of all the diagrams and data from Table 3, it can be
determined that the values of the magnitudes in the frequency interval important for noise
are negligible. This indicates that there is no correlation between the observed couples of
time series, which is consistent with the analysed cross-correlation coefficients and mutual
probability density. Thereby, the higher values of magnitude of the cross-spectrum are not
of interest for the brake noise, and will not be separately analysed.
It should be emphasized that this applies also to variation of magnitude of cross-
spectrum for a couple “disc speed - pressure”, indicating that the initial conditions are
independent in frequency interval interesting for brake noise.
Based on the previous analyses, it can be stated that all used data that characterize
the physical behaviour of disk brakes must be considered as functions of initial values of
disc speed and brake pressure in the installation as independent parameters. With that in
mind, it is obvious that statistical values of all registered parameters of brakes should be
considered separately.
Probability density, auto-correlation function and auto-spectrum
The following statistical parameters for the chosen, the most rigorous regime (one test) are
calculated:
probability density,
auto-correlation functions and
auto-spectra.
These parameters were calculated for the most rigorous test regime, while the
following registered parameters were observed:
disc speed,
braking torque,
brake pressure in the installation and
brake noise.
Probability density
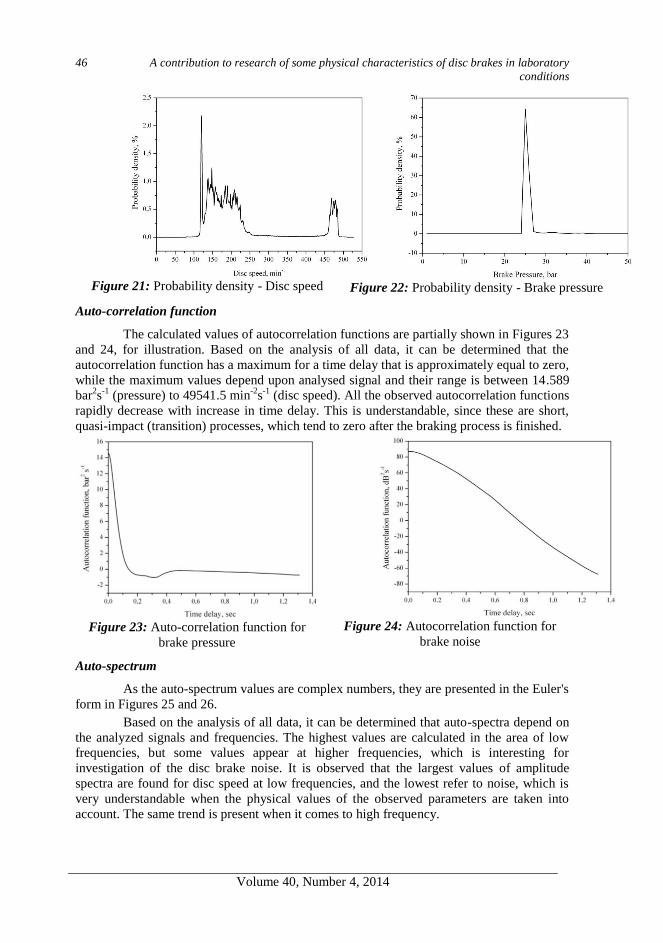
The calculated values of the probability density are, for partial illustration, shown in Figures
21 and 22. Based on analysis of all data, intervals and percentage of occurrence of the
observed parameters by levels were determined and given in Table 4.
Table 4: Probability density
Interval of occurrence Percentage of occurrence
Disc speed, min-1 -2,31 ÷ 813 2,18
Brake torque, Nm -50 ÷ 405 47,1
Brake pressure, MPa -1 ÷ 31 64,3
Brake noise, dB -55 ÷ 91 19,9
Based on Table 4, it can be determined that the maximum value of the occurrence refers to
pressure, and the lowest to disc speed, in the areas around the mean values of the signal.
This is understandable due to the fact that the disk was always decelerating, and the pressure
in the installation was varying around the set value during the test.
A contribution to research of some physical characteristics of disc brakes in laboratory
conditions
Volume 40, Number 4, 2014
46
Figure 21: Probability density - Disc speed
Figure 22: Probability density - Brake pressure
Auto-correlation function
The calculated values of autocorrelation functions are partially shown in Figures 23
and 24, for illustration. Based on the analysis of all data, it can be determined that the
autocorrelation function has a maximum for a time delay that is approximately equal to zero,
while the maximum values depend upon analysed signal and their range is between 14.589
bar2s
-1 (pressure) to 49541.5 min
-2s
-1 (disc speed). All the observed autocorrelation functions
rapidly decrease with increase in time delay. This is understandable, since these are short,
quasi-impact (transition) processes, which tend to zero after the braking process is finished.
Figure 23: Auto-correlation function for
brake pressure
Figure 24: Autocorrelation function for
brake noise
Auto-spectrum
As the auto-spectrum values are complex numbers, they are presented in the Euler's
form in Figures 25 and 26.
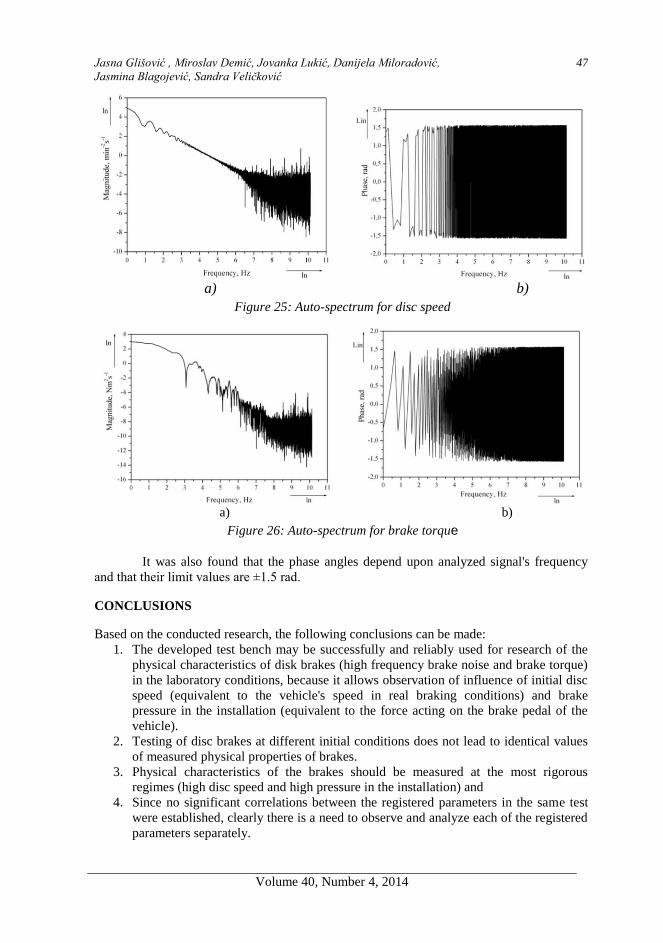
Based on the analysis of all data, it can be determined that auto-spectra depend on
the analyzed signals and frequencies. The highest values are calculated in the area of low
frequencies, but some values appear at higher frequencies, which is interesting for
investigation of the disc brake noise. It is observed that the largest values of amplitude
spectra are found for disc speed at low frequencies, and the lowest refer to noise, which is
very understandable when the physical values of the observed parameters are taken into
account. The same trend is present when it comes to high frequency.
Jasna Glišović , Miroslav Demić, Jovanka Lukić, Danijela Miloradović,
Jasmina Blagojević, Sandra Veličković
Volume 40, Number 4, 2014
47
a) b)
Figure 25: Auto-spectrum for disc speed
a) b)
Figure 26: Auto-spectrum for brake torque
It was also found that the phase angles depend upon analyzed signal's frequency
and that their limit values are ±1.5 rad.
CONCLUSIONS
Based on the conducted research, the following conclusions can be made:
1. The developed test bench may be successfully and reliably used for research of the
physical characteristics of disk brakes (high frequency brake noise and brake torque)
in the laboratory conditions, because it allows observation of influence of initial disc
speed (equivalent to the vehicle's speed in real braking conditions) and brake
pressure in the installation (equivalent to the force acting on the brake pedal of the
vehicle).
2. Testing of disc brakes at different initial conditions does not lead to identical values
of measured physical properties of brakes.
3. Physical characteristics of the brakes should be measured at the most rigorous
regimes (high disc speed and high pressure in the installation) and
4. Since no significant correlations between the registered parameters in the same test
were established, clearly there is a need to observe and analyze each of the registered
parameters separately.
A contribution to research of some physical characteristics of disc brakes in laboratory
conditions
Volume 40, Number 4, 2014
48
ACKNOWLEDGMENTS
This paper was realized within the researching project “The research of vehicle
safety as part of a cybernetic system: Driver-Vehicle-Environment” ref. no. 35041, funded
by Ministry of Education, Science and Technological Development of the Republic of
Serbia.
REFERENCES
[1] Abendroth, H. and Wernitz, B., The Integrated Test Concept: Dyno-Vehicle,
Performance-Noise, Proceedings of the 18th Annual Brake Colloquium And
Engineering Display, SAE Technical Paper 2000-01-2774, San Diego, California,
United States,2000.
[2] Abu Bakar, A. R., Modelling and Simulation of Disc Brake Contact Analysis and
Squeal, PhD Thesis, University of Liverpool, Faculty of Engineering, Department of
Mechanical Engineering, Liverpool, United Kingdom, 2005.
[3] Fieldhouse, J., Ashraf, N., and Talbot, C., The Measurement and Analysis of the
Disc/Pad Interface Dynamic Centre of Pressure and Its Influence on Brake Noise, SAE
International Journal of Passenger Cars- Mechanical Systems , 1(1), 2009, 736-745.
[4] Glišovic, J., Radonjic, R., Babic, M., Miloradovic, D., Catic, D., Design of Vehicle
Road Testing Method for Determination of Brake Pad Friction Characteristics, Journal
of the Balkan Tribological Association, 2011, 17(4), 513-525.
[5] Gotowicki, P.F., Nigrelli, V., Mariotti, G.V., Aleksendric, D., Duboka, D., Numerical
and experimental analysis of a pegs-wing ventilated disk brake rotor, with pads and
cylinders, Proceedings of the 10th EAEC European Automotive Congress (vol 1),
European Automobile Engineers Cooperation, 2005, Belgrade, Serbia, 244-259.
[6] Ouyang, H., Nack, W., Yuan, Y, Chen, F., Numerical analysis of automotive disc
brake squeal: a review, Int. J. Vehicle Noise and Vibration, 2005, 1(3/4), 207-231.
[7] Kinkaid, N.M., O’Reilly, O.M., Papadopoulos P., Automotive disc brake squeal: a
review, Journal of Sound and Vibration, 2003, 267(1), 105–166.
[8] Glisovic, J., Theoretical and experimental research of high-frequency noise of disc
brakes, PhD Thesis, University of Kragujevac, Faculty of Engineering, Serbia, 2012
(in Serbian).
[9] Bendat, J.S., Piersol, A.G., Engineering Applications of Correlation and Spectral
Analysis, John Wiley and Sons, London, 1980.
[10] Bendat, J.S. Nonlinear Systems-Techniques and Applications, John Wiley and Sons,
London, 1998.
[11] Bendat, J.S., Piersol, A.G., Random Data Analysis and Measurement Procedures, John
Wiley and Sons, London, 2000.
[12] SAE J2521, Disc and Drum Brake Dynamometer Squeal Noise Matrix, Society of
Automotive Engineers, Brake NVH Standards Committee, 2010.
[13] Demić, M. Analsigdem Software for signal analysis, 2003, www.ptt.yu/korisnici/i/
m/imizm034/index.swf.