Embed Size (px)
Citation preview
This article was downloaded by: [Umeå University Library]On: 03 October 2014, At: 00:22Publisher: RoutledgeInforma Ltd Registered in England and Wales Registered Number: 1072954 Registeredoffice: Mortimer House, 37-41 Mortimer Street, London W1T 3JH, UK
International Journal of EnvironmentalStudiesPublication details, including instructions for authors andsubscription information:http://www.tandfonline.com/loi/genv20
A comparison between geothermalabsorption and compression heatpumps for space conditioningMichaël Kummert a b , Michel Bernier a , Andrea Costa c & JeanParis ca École Polytechnique de Montréal, Département de géniemécanique , C.P. 6079, Succ. Centre‐ville, Montréal, Québec,Canada , H3C 3A7b ESRU – University of Strathclyde, Department of MechanicalEngineering , 75 Montrose Street, Glasgow, G1 1XJ, Scotland, UKc École Polytechnique de Montréal, Département de géniechimique , C.P. 6079, Succ. Centre‐ville, Montréal, Québec,Canada , H3C 3A7Published online: 11 Jul 2007.
To cite this article: Michaël Kummert , Michel Bernier , Andrea Costa & Jean Paris (2007) Acomparison between geothermal absorption and compression heat pumps for space conditioning,International Journal of Environmental Studies, 64:4, 467-487, DOI: 10.1080/00207230701382115
To link to this article: http://dx.doi.org/10.1080/00207230701382115
PLEASE SCROLL DOWN FOR ARTICLE
Taylor & Francis makes every effort to ensure the accuracy of all the information (the“Content”) contained in the publications on our platform. However, Taylor & Francis,our agents, and our licensors make no representations or warranties whatsoever as tothe accuracy, completeness, or suitability for any purpose of the Content. Any opinionsand views expressed in this publication are the opinions and views of the authors,and are not the views of or endorsed by Taylor & Francis. The accuracy of the Contentshould not be relied upon and should be independently verified with primary sourcesof information. Taylor and Francis shall not be liable for any losses, actions, claims,proceedings, demands, costs, expenses, damages, and other liabilities whatsoeveror howsoever caused arising directly or indirectly in connection with, in relation to orarising out of the use of the Content.

This article may be used for research, teaching, and private study purposes. Anysubstantial or systematic reproduction, redistribution, reselling, loan, sub-licensing,systematic supply, or distribution in any form to anyone is expressly forbidden. Terms &Conditions of access and use can be found at http://www.tandfonline.com/page/terms-and-conditions
Dow
nloa
ded
by [
Um
eå U
nive
rsity
Lib
rary
] at
00:
22 0
3 O
ctob
er 2
014
International Journal of Environmental Studies,Vol. 64, No. 4, August 2007, 467–487
International Journal of Environmental StudiesISSN 0020-7233 print: ISSN 1029-0400 online © 2007 Taylor & Francis
http://www.tandf.co.uk/journalsDOI: 10.1080/00207230701382115
A comparison between geothermal absorption and compression heat pumps for space conditioning
MICHAËL KUMMERT*†‡, MICHEL BERNIER†, ANDREA COSTA§ AND JEAN PARIS§
†École Polytechnique de Montréal, Département de génie mécanique, C.P. 6079, Succ. Centre-ville,Montréal, Québec, Canada H3C 3A7; ‡ESRU – University of Strathclyde, Department of MechanicalEngineering, 75 Montrose StreetGlasgow G1 1XJ, Scotland, UK; §École Polytechnique de Montréal,
Département de génie chimique, C.P. 6079, Succ. Centre-ville, Montréal, Québec, Canada H3C 3A7Taylor and Francis LtdGENV_A_238100.sgm
(Received 27 April 2007)10.1080/00207230701382115International Journal of Environmental Studies0020-7233 (print)/1029-0400 (online)Original Article2007Taylor & Francis0000000002007Michaë[email protected]
This article compares the performance of geothermal absorption and compression heat pump systemsfor space conditioning. The comparison is performed on an R-2000 residence for three Canadianlocations representing three different climates and energy contexts: Montréal, Edmonton andVancouver. The analysis is based on simulations carried out using TRNSYS. Results indicate that therequired length of the geothermal heat exchanger is significantly different for the two types of heatpumps (compression and absorption). In Edmonton, geothermal absorption heat pump systems have alower life-cycle cost and emit fewer greenhouse gases than geothermal compression heat pumpsystem. In Montréal, both systems have similar life-cycle costs. Since electricity is mainly hydro-based the greenhouse gas emissions are much lower for the compression system. In Vancouver, thecompression system has both lower life-cycle costs and lower greenhouse gases emissions.
Keywords: Heat pump; Compression; Absorption; Ground heat exchanger; TRNSYS; Dynamic simulation; Energy consumption; CO2 emissions; Life-cycle cost
Introduction
The ground has been used as a heat source or sink in building applications for a number ofyears. For example, geothermal compression heat pumps (CHP) are now routinely installedworldwide [1] with 600,000 equivalent three-ton (10.6 kW) units in the US alone [2]. Gas-fired absorption heat pumps (AHP) used in conjunction with geothermal heat exchangers haveonly been recently considered [3], although they have a higher energy efficiency than conven-tional heating systems (see the discussion of COP below). This paper shows that geothermalAHPs can also present some advantages over geothermal CHPs in terms of required heatexchanger length and primary energy use (depending on the power generation mix). The appli-cation considered in this paper is different from the most common use of absorption heatpumps with high temperature geothermal heat sources. In this paper, a gas-driven heat pump
*Corresponding author. Email: [email protected]
Dow
nloa
ded
by [
Um
eå U
nive
rsity
Lib
rary
] at
00:
22 0
3 O
ctob
er 2
014
468 M. Kummert et al.
uses the ground at relatively shallow depth (typically 0 to 200m). The undisturbed groundtemperature is typically between 5°C and 15°C and the AHP operates in the same way as aconventional CHP. Most of the reported applications for geothermal absorption heat pumpsuse higher temperature heat extracted from the ground (50°C and above), with the geothermalheat sometimes driving the heat pump (instead of the gas combustion in this paper).
There are fundamental differences between CHPs and AHPs. CHPs use the classic vapour-compression refrigeration cycle. In an AHP, the temperature lift, that is, the heat pumping froma low to a high temperature level, is accomplished by using heat instead of mechanical work[4]. The energy performance of heat pumps is usually expressed by their Coefficient of Perfor-mance (COP), which is defined as the ratio between the useful energy transfer (heat added toor removed from the load) and the energy input (electricity in a CHP, natural gas in a gas-driven AHP). CHPs typically have a higher COP than AHPs, both in heating and cooling:typical values for cooling are around 3 for CHPs and 0.7 for AHPs, while typical COP valuesfor heating are around 3.5 for CHPs and 1.7 for AHPs. Using the COP to assess the energyperformance of both types of machine ignores the fact that electricity is often generated inthermal power plants with an efficiency well below 100%. If the performance is evaluated interms of primary energy or CO2 emissions, the electricity generation mix must be taken intoaccount. This is further discussed later in this paper. AHPs use environmentally friendly refrig-erants that are not subject to any international restrictions related to the protection of the ozonelayer and they do not contribute to the greenhouse effect. The vast majority of CHPs operateusing electricity while most AHPs burn natural gas to provide the temperature lift. Given thatelectricity is often generated using fossil fuels with a relatively low efficiency, it is not obviouswhich of the CHPs or AHPs will generate the least amount of greenhouse gases (GHG).Furthermore, AHPs will generate less GHG than heating with conventional or condensing gasboilers.
The significant differences in the values of the COPs will translate into different amount ofenergy removed from the ground (Qground,source) or added to the ground (Qground,sink) as shownin equations (1) and (2):
For the same value of useful energy (Quseful in equations 1 and 2) in heating or cooling and forthe COP values mentioned above, Qground,source is 1.6 times higher for the CHPs than for theAHPs. In cooling, Qground,sink is 1.8 times lower for the CHPs than for the AHPs. In otherwords, AHPs extract less heat from the ground in heating mode than CHPs but reject moreheat in cooling mode. These different values of Qground have an impact on the length and costof the ground heat exchanger.
The objective of this paper is to present comparative results on the use of geothermal CHPsand AHPs for space conditioning of Canadian residences. The energy consumption, as well asGHG emissions and life-cycle costs, are compared. Three cities are examined in order to coverdifferent climates: Montréal, Edmonton and Vancouver. In addition, the production of elec-tricity for these three cities involves different fuel mixes, from hydroelectricity-dominated inMontréal and Vancouver to fossil fuel-dominated electricity production in Edmonton [5].
Q QCOP
Q QCOP
ground source useful heatingheating
ground k useful coolingcooling
� �
� �
� ��
���
�
���
� ��
���
�
���
� �
� �
�� ������ ��
�� � ��� ��sin
Q QCOP
Q QCOP
ground source useful heatingheating
ground k useful coolingcooling
� �
� �
� ��
���
�
���
� ��
���
�
���
� �
� �
�� ������ ��
�� � ��� ��sin
Dow
nloa
ded
by [
Um
eå U
nive
rsity
Lib
rary
] at
00:
22 0
3 O
ctob
er 2
014
A comparison between geothermal absorption and compression heat pumps 469
Literature review
Residential ground-source or ground-coupled heat pumps have achieved a significant marketpenetration in recent years and they have been studied extensively in the scientific literature.Lund et al. [1] provide an exhaustive survey of applications and installed capacity world-wide. A summary of design procedures and relevant papers can be found in [6]. The vastmajority of systems use a compression heat pump and the most common ground heatexchanger consists of vertical boreholes.
Previous studies have shown that geothermal heat pumps used for space conditioning canlead to a significant reduction of greenhouse gas (GHG) emissions. One of these studies [7]took into account both direct (refrigerant leakage) and indirect (fossil fuel use) emissions andused emission data for power generation on the margin. The study reveals that the ground-source heat pump has the lowest GHG emissions over the 20-year lifetime in all the citiesexamined. The magnitude of the reduction depends on the location and on the margin elec-tricity generation and can reach 85%. A similar study was performed in Wisconsin [8] usinghourly emission data for the current electricity mix. The authors found that ground sourceheat pumps lead to emission reductions in the commercial sector. In the residential sector,emissions actually increase if ground source heat pumps replace efficient natural or liquefiedpetroleum gas (LPG) furnaces. These results are partly attributed to the relatively high reli-ance on coal for electricity generation.
Absorption chillers in conventional (air-cooled) systems have been covered by manyauthors and some studies include a detailed analysis of their benefits (or drawbacks) in termsof primary energy consumption and emissions. Gansler et al. [9] compared the source energyuse and emissions attributable to different cooling systems in an office building and a schoolbuilding. They used the concept of ‘energy trajectory’ to convert net energy delivered to thebuilding into source energy by taking into account all system efficiencies from extraction toconversion and delivery. The cooling system electrical demand is assumed to be met by thelast generating equipment dispatched, that is, the marginal plant. The authors compare elec-tric and gas-powered absorption chillers with and without thermal storage. They find that thegas-powered absorption cooling system has higher source energy requirements in all config-urations and that thermal storage typically shows source energy savings of 10%.
Absorption heat pumps used for space heating in addition to space cooling are often asso-ciated with solar thermal collectors. Argiriou et al. [10] performed a simulation study of alow capacity (10 kW) solar-assisted absorption machine coupled with floor heating and cool-ing. They found that energy (or $) savings could reach 20 to 27% when compared to aconventional (air-source) compression heat pump system. Tri-generation systems combineabsorption heat pumps for heat and cold generation with on-site power generation (e.g. fromgas engines/micro-turbines or fuel cells). The study in [11] gives an example of such asystem including solar thermal and photovoltaic collectors in a hospital.
The literature about ground-source absorption heat pumps for residential buildings is muchless abundant. A 1998 review of close to a hundred scientific papers on solar-assisted airconditioning does not make any mention of ground-coupled systems, even though most ofthe projects include absorption heat pumps [12]. More recent reviews [13,14] also discussseveral enhancements to solar-assisted absorption heat pump systems but make no mentionof ground-coupled systems. The study of Garimella [15] is one of the very few examiningabsorption systems for residential space conditioning through ground coupling. In this study,the building load is not modelled and the comparison is based on COP values only. A verysimple model is used for the ground heat exchanger (fixed temperature difference with the
Dow
nloa
ded
by [
Um
eå U
nive
rsity
Lib
rary
] at
00:
22 0
3 O
ctob
er 2
014
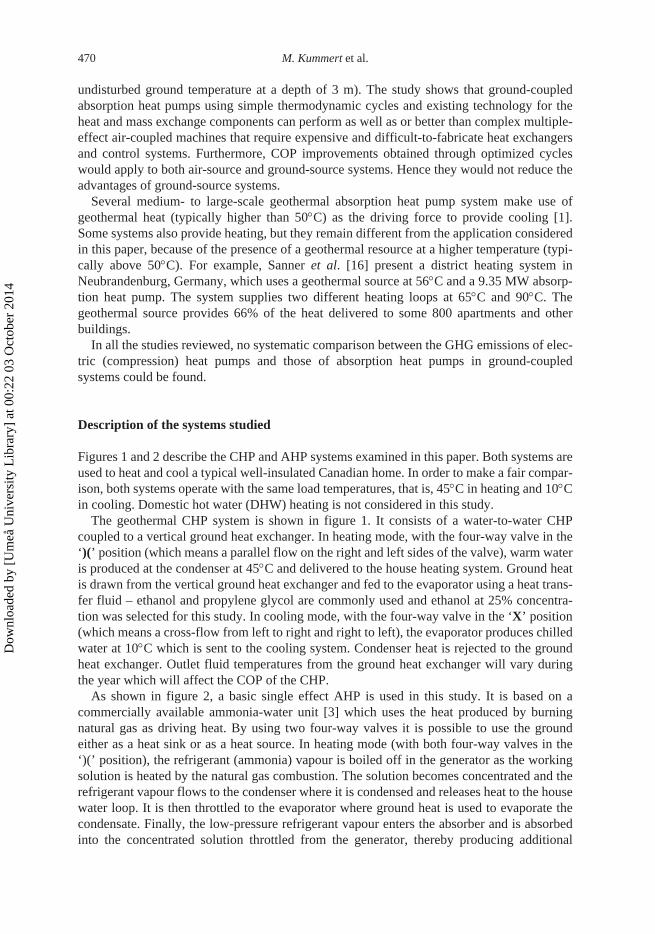
470 M. Kummert et al.
undisturbed ground temperature at a depth of 3 m). The study shows that ground-coupledabsorption heat pumps using simple thermodynamic cycles and existing technology for theheat and mass exchange components can perform as well as or better than complex multiple-effect air-coupled machines that require expensive and difficult-to-fabricate heat exchangersand control systems. Furthermore, COP improvements obtained through optimized cycleswould apply to both air-source and ground-source systems. Hence they would not reduce theadvantages of ground-source systems.
Several medium- to large-scale geothermal absorption heat pump system make use ofgeothermal heat (typically higher than 50°C) as the driving force to provide cooling [1].Some systems also provide heating, but they remain different from the application consideredin this paper, because of the presence of a geothermal resource at a higher temperature (typi-cally above 50°C). For example, Sanner et al. [16] present a district heating system inNeubrandenburg, Germany, which uses a geothermal source at 56°C and a 9.35 MW absorp-tion heat pump. The system supplies two different heating loops at 65°C and 90°C. Thegeothermal source provides 66% of the heat delivered to some 800 apartments and otherbuildings.
In all the studies reviewed, no systematic comparison between the GHG emissions of elec-tric (compression) heat pumps and those of absorption heat pumps in ground-coupledsystems could be found.
Description of the systems studied
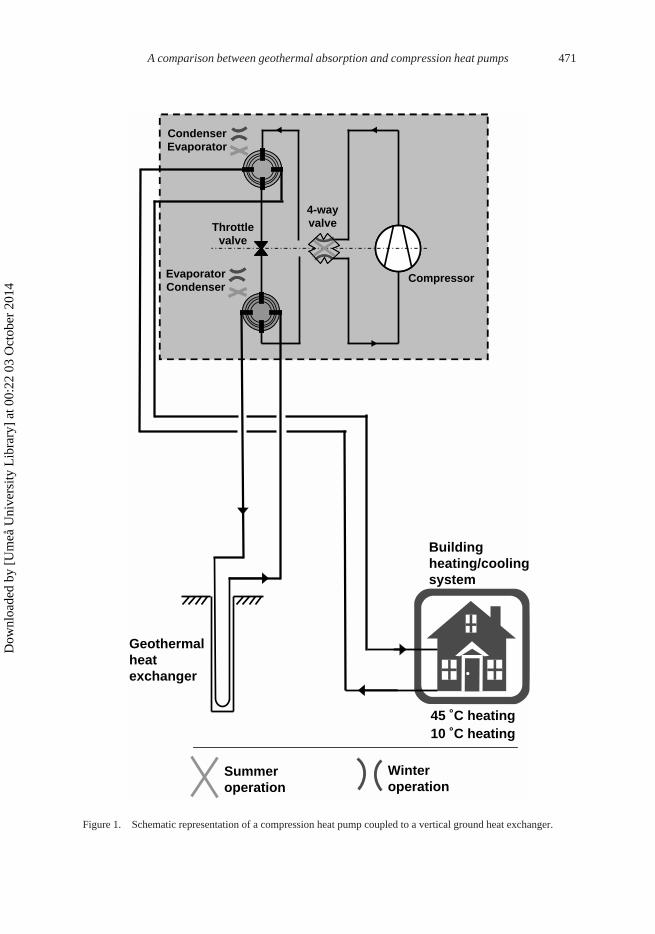
Figures 1 and 2 describe the CHP and AHP systems examined in this paper. Both systems areused to heat and cool a typical well-insulated Canadian home. In order to make a fair compar-ison, both systems operate with the same load temperatures, that is, 45°C in heating and 10°Cin cooling. Domestic hot water (DHW) heating is not considered in this study.Figure 1. Schematic representation of a compression heat pump coupled to a vertical ground heat exchanger.Figure 2. Schematic representation of an absorption heat pump coupled to a vertical ground heat exchanger.The geothermal CHP system is shown in figure 1. It consists of a water-to-water CHPcoupled to a vertical ground heat exchanger. In heating mode, with the four-way valve in the‘)(’ position (which means a parallel flow on the right and left sides of the valve), warm wateris produced at the condenser at 45°C and delivered to the house heating system. Ground heatis drawn from the vertical ground heat exchanger and fed to the evaporator using a heat trans-fer fluid – ethanol and propylene glycol are commonly used and ethanol at 25% concentra-tion was selected for this study. In cooling mode, with the four-way valve in the ‘X’ position(which means a cross-flow from left to right and right to left), the evaporator produces chilledwater at 10°C which is sent to the cooling system. Condenser heat is rejected to the groundheat exchanger. Outlet fluid temperatures from the ground heat exchanger will vary duringthe year which will affect the COP of the CHP.
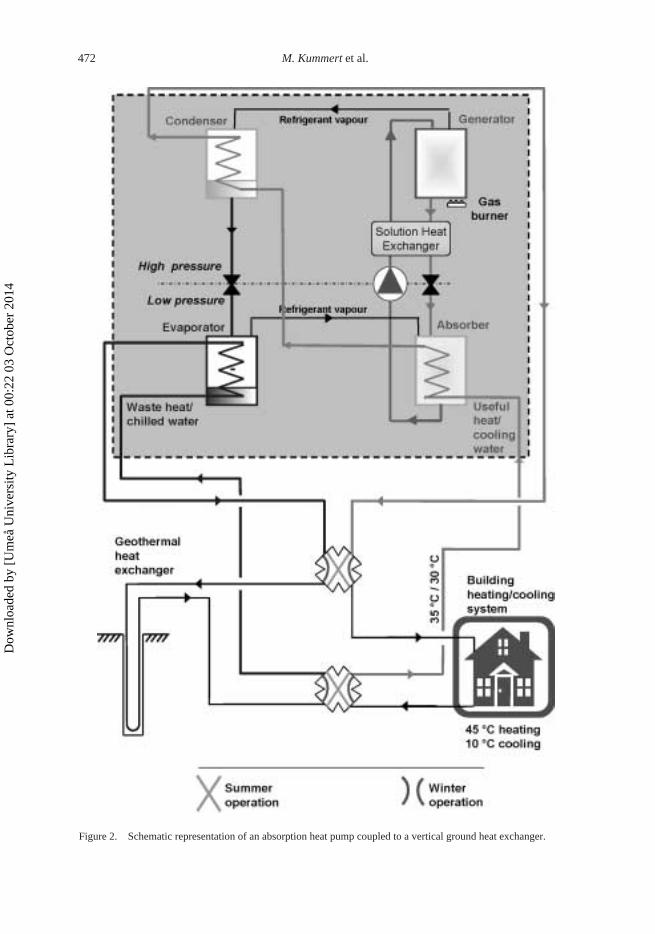
As shown in figure 2, a basic single effect AHP is used in this study. It is based on acommercially available ammonia-water unit [3] which uses the heat produced by burningnatural gas as driving heat. By using two four-way valves it is possible to use the groundeither as a heat sink or as a heat source. In heating mode (with both four-way valves in the‘)(’ position), the refrigerant (ammonia) vapour is boiled off in the generator as the workingsolution is heated by the natural gas combustion. The solution becomes concentrated and therefrigerant vapour flows to the condenser where it is condensed and releases heat to the housewater loop. It is then throttled to the evaporator where ground heat is used to evaporate thecondensate. Finally, the low-pressure refrigerant vapour enters the absorber and is absorbedinto the concentrated solution throttled from the generator, thereby producing additional
Dow
nloa
ded
by [
Um
eå U
nive
rsity
Lib
rary
] at
00:
22 0
3 O
ctob
er 2
014
A comparison between geothermal absorption and compression heat pumps 471
Geothermalheatexchanger
Buildingheating/coolingsystem
Summeroperation
Winteroperation
Compressor
CondenserEvaporator
EvaporatorCondenser
Throttlevalve
4-wayvalve
45 ˚C heating10 ˚C heating
Figure 1. Schematic representation of a compression heat pump coupled to a vertical ground heat exchanger.
Dow
nloa
ded
by [
Um
eå U
nive
rsity
Lib
rary
] at
00:
22 0
3 O
ctob
er 2
014
472 M. Kummert et al.
Figure 2. Schematic representation of an absorption heat pump coupled to a vertical ground heat exchanger.
Dow
nloa
ded
by [
Um
eå U
nive
rsity
Lib
rary
] at
00:
22 0
3 O
ctob
er 2
014
A comparison between geothermal absorption and compression heat pumps 473
useful heat transferred to the water loop. The resulting diluted working solution is pumpedback to the generator to close the solution loop. The condenser and absorber produce heat atthe same temperature and are connected together as shown on figure 2. Given that the energybalance over the complete cycle is zero, the total useful heat is equal to the sum of the drivingheat at the generator and the ground heat. Heat released in the absorber and condenser istransferred to the building heating loop at 45°C. The ratio between useful and driving heat, isthe Coefficient of Performance (COP) of the AHP in heating. In cooling mode, the internaloperation of the AHP remains the same and driving heat is still required in the generator. But,both four-way valves are now in the ‘X’ position. Chilled water is produced at the evaporatorand distributed into the building’s cooling system at 10°C. Heat released at the absorber andcondenser is rejected into the geothermal heat exchanger. The COP in cooling is simply theratio of the cooling effect in the evaporator to the driving heat.
Methodology
The following analysis is based on simulations carried out using TRNSYS [17], with modelsfrom the standard component library and from the TESS libraries [22], as well as new modelsthat were developed for the present study. A one-hour time step is used throughout this work.The different components and main assumptions used in the simulations are presented below.
Building
The building is simulated using the standard multi-zone building model implemented inTRNSYS, known as Type 56 [17]. A typical single-family detached house is selected forthree Canadian locations: Montréal, Edmonton, and Vancouver. Architectural characteristicsof each house are set according to ‘archetypes’ that were developed to match statistical datafor the existing housing stock. The selected archetypes [18] were developed by NationalResources Canada and implemented in the Residential Energy & Economic Simulator(REES). Table 1 surveys basic characteristics of the selected archetypes. All houses have aconventional wood-frame structure and a heated basement. Houses are assumed to have asquare floor plan and evenly distributed windows on the four external walls.
The thermal performance characteristics were obtained from Hamlin and Gusdorf [19]who present a validated dataset on conventional and ‘R-2000’ houses built across Canadabetween 1983 and 1996. ‘R-2000’ houses are built to the R-2000 Standard [20], which goesbeyond the building codes and consists of strict technical requirements for energy efficiency,indoor air quality and environmental responsibility. The 90-percentile value is used for ther-mal insulation, that is, the reference house is better or as well insulated than 90% of the R-2000 houses in the dataset. The average air tightness is used, in the absence of detailedpercentile data. Internal gains are typical for a family of four (two adults and two children)with a statistical presence of 50%. Standard weather data from the ‘Canadian Weather forEnergy Calculations’ database (CWEC) are used [21].
Basement thermal losses
The interaction between the ground and the building through basement walls and floor is calcu-lated using a detailed three-D ground model which is part of the TESS libraries (Type 701,[22]). The near-field soil temperatures are affected by the heat transfer from the basement, and
Dow
nloa
ded
by [
Um
eå U
nive
rsity
Lib
rary
] at
00:
22 0
3 O
ctob
er 2
014
474 M. Kummert et al.
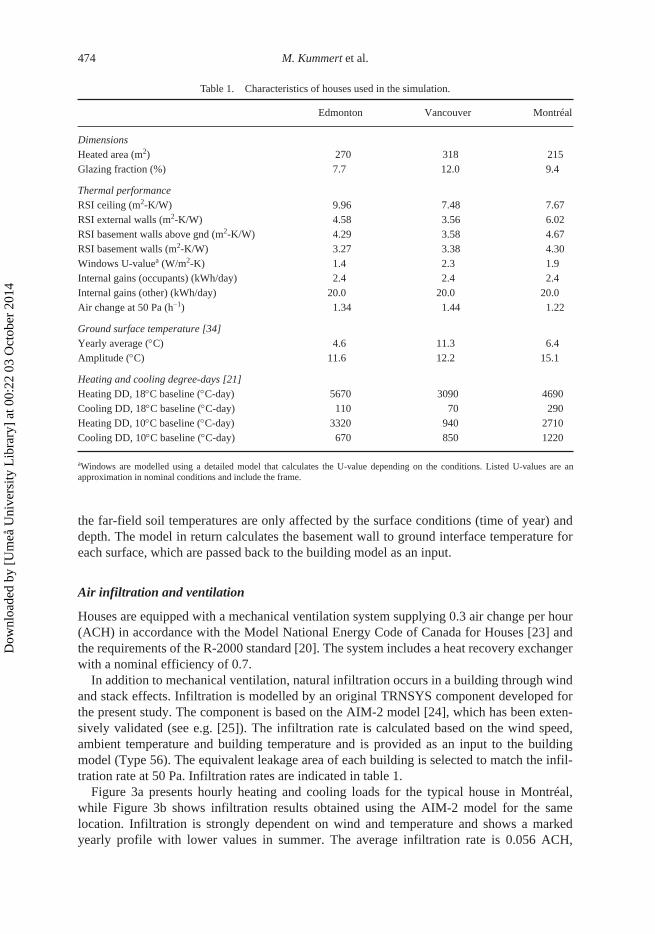
the far-field soil temperatures are only affected by the surface conditions (time of year) anddepth. The model in return calculates the basement wall to ground interface temperature foreach surface, which are passed back to the building model as an input.
Air infiltration and ventilation
Houses are equipped with a mechanical ventilation system supplying 0.3 air change per hour(ACH) in accordance with the Model National Energy Code of Canada for Houses [23] andthe requirements of the R-2000 standard [20]. The system includes a heat recovery exchangerwith a nominal efficiency of 0.7.
In addition to mechanical ventilation, natural infiltration occurs in a building through windand stack effects. Infiltration is modelled by an original TRNSYS component developed forthe present study. The component is based on the AIM-2 model [24], which has been exten-sively validated (see e.g. [25]). The infiltration rate is calculated based on the wind speed,ambient temperature and building temperature and is provided as an input to the buildingmodel (Type 56). The equivalent leakage area of each building is selected to match the infil-tration rate at 50 Pa. Infiltration rates are indicated in table 1.
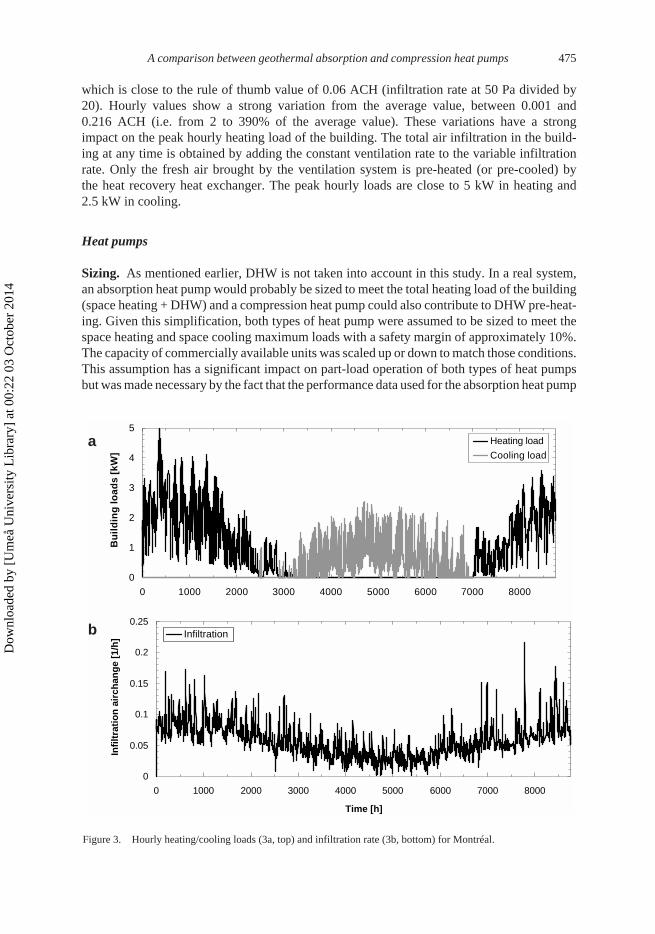
Figure 3a presents hourly heating and cooling loads for the typical house in Montréal,while Figure 3b shows infiltration results obtained using the AIM-2 model for the samelocation. Infiltration is strongly dependent on wind and temperature and shows a markedyearly profile with lower values in summer. The average infiltration rate is 0.056 ACH,
Table 1. Characteristics of houses used in the simulation.
Edmonton Vancouver Montréal
DimensionsHeated area (m2) 270 318 215Glazing fraction (%) 7.7 12.0 9.4
Thermal performanceRSI ceiling (m2-K/W) 9.96 7.48 7.67RSI external walls (m2-K/W) 4.58 3.56 6.02RSI basement walls above gnd (m2-K/W) 4.29 3.58 4.67RSI basement walls (m2-K/W) 3.27 3.38 4.30Windows U-valuea (W/m2-K) 1.4 2.3 1.9Internal gains (occupants) (kWh/day) 2.4 2.4 2.4Internal gains (other) (kWh/day) 20.0 20.0 20.0Air change at 50 Pa (h−1) 1.34 1.44 1.22
Ground surface temperature [34]Yearly average (°C) 4.6 11.3 6.4Amplitude (°C) 11.6 12.2 15.1
Heating and cooling degree-days [21]Heating DD, 18°C baseline (°C-day) 5670 3090 4690Cooling DD, 18°C baseline (°C-day) 110 70 290Heating DD, 10°C baseline (°C-day) 3320 940 2710Cooling DD, 10°C baseline (°C-day) 670 850 1220
aWindows are modelled using a detailed model that calculates the U-value depending on the conditions. Listed U-values are anapproximation in nominal conditions and include the frame.
Dow
nloa
ded
by [
Um
eå U
nive
rsity
Lib
rary
] at
00:
22 0
3 O
ctob
er 2
014
A comparison between geothermal absorption and compression heat pumps 475
which is close to the rule of thumb value of 0.06 ACH (infiltration rate at 50 Pa divided by20). Hourly values show a strong variation from the average value, between 0.001 and0.216 ACH (i.e. from 2 to 390% of the average value). These variations have a strongimpact on the peak hourly heating load of the building. The total air infiltration in the build-ing at any time is obtained by adding the constant ventilation rate to the variable infiltrationrate. Only the fresh air brought by the ventilation system is pre-heated (or pre-cooled) bythe heat recovery heat exchanger. The peak hourly loads are close to 5 kW in heating and2.5 kW in cooling.Figure 3. Hourly heating/cooling loads (3a, top) and infiltration rate (3b, bottom) for Montréal.
Heat pumps
Sizing. As mentioned earlier, DHW is not taken into account in this study. In a real system,an absorption heat pump would probably be sized to meet the total heating load of the building(space heating + DHW) and a compression heat pump could also contribute to DHW pre-heat-ing. Given this simplification, both types of heat pump were assumed to be sized to meet thespace heating and space cooling maximum loads with a safety margin of approximately 10%.The capacity of commercially available units was scaled up or down to match those conditions.This assumption has a significant impact on part-load operation of both types of heat pumpsbut was made necessary by the fact that the performance data used for the absorption heat pump
0
1
2
3
4
5
0 1000 2000 3000 4000 5000 6000 7000 8000
Bu
ild
ing
load
s [k
W]
Heating load
Cooling load
0
0.05
0.1
0.15
0.2
0.25
0 1000 2000 3000 4000 5000 6000 7000 8000
Time [h]
Infi
ltra
tio
n a
irch
ang
e [1
/h] Infiltration
a
b
Figure 3. Hourly heating/cooling loads (3a, top) and infiltration rate (3b, bottom) for Montréal.
Dow
nloa
ded
by [
Um
eå U
nive
rsity
Lib
rary
] at
00:
22 0
3 O
ctob
er 2
014
476 M. Kummert et al.
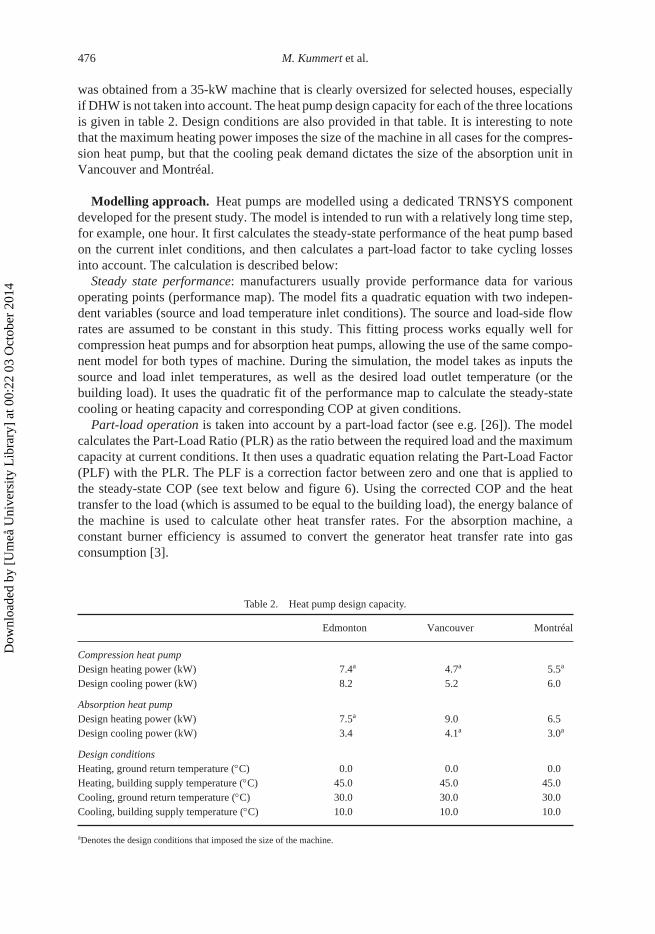
was obtained from a 35-kW machine that is clearly oversized for selected houses, especiallyif DHW is not taken into account. The heat pump design capacity for each of the three locationsis given in table 2. Design conditions are also provided in that table. It is interesting to notethat the maximum heating power imposes the size of the machine in all cases for the compres-sion heat pump, but that the cooling peak demand dictates the size of the absorption unit inVancouver and Montréal.
Modelling approach. Heat pumps are modelled using a dedicated TRNSYS componentdeveloped for the present study. The model is intended to run with a relatively long time step,for example, one hour. It first calculates the steady-state performance of the heat pump basedon the current inlet conditions, and then calculates a part-load factor to take cycling lossesinto account. The calculation is described below:
Steady state performance: manufacturers usually provide performance data for variousoperating points (performance map). The model fits a quadratic equation with two indepen-dent variables (source and load temperature inlet conditions). The source and load-side flowrates are assumed to be constant in this study. This fitting process works equally well forcompression heat pumps and for absorption heat pumps, allowing the use of the same compo-nent model for both types of machine. During the simulation, the model takes as inputs thesource and load inlet temperatures, as well as the desired load outlet temperature (or thebuilding load). It uses the quadratic fit of the performance map to calculate the steady-statecooling or heating capacity and corresponding COP at given conditions.
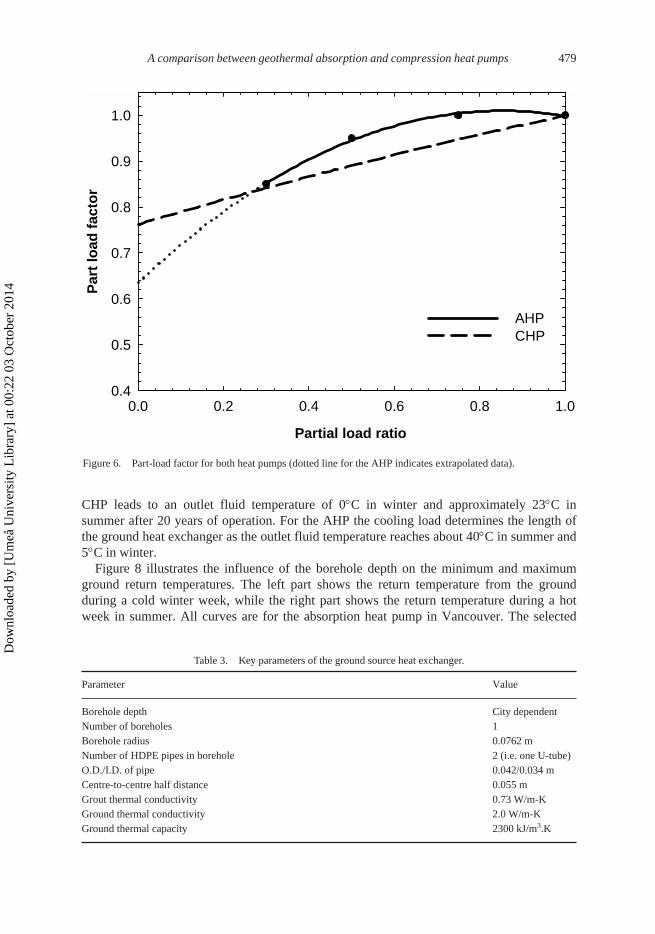
Part-load operation is taken into account by a part-load factor (see e.g. [26]). The modelcalculates the Part-Load Ratio (PLR) as the ratio between the required load and the maximumcapacity at current conditions. It then uses a quadratic equation relating the Part-Load Factor(PLF) with the PLR. The PLF is a correction factor between zero and one that is applied tothe steady-state COP (see text below and figure 6). Using the corrected COP and the heattransfer to the load (which is assumed to be equal to the building load), the energy balance ofthe machine is used to calculate other heat transfer rates. For the absorption machine, aconstant burner efficiency is assumed to convert the generator heat transfer rate into gasconsumption [3].
Table 2. Heat pump design capacity.
Edmonton Vancouver Montréal
Compression heat pumpDesign heating power (kW) 7.4a 4.7a 5.5a
Design cooling power (kW) 8.2 5.2 6.0
Absorption heat pumpDesign heating power (kW) 7.5a 9.0 6.5Design cooling power (kW) 3.4 4.1a 3.0a
Design conditionsHeating, ground return temperature (°C) 0.0 0.0 0.0Heating, building supply temperature (°C) 45.0 45.0 45.0Cooling, ground return temperature (°C) 30.0 30.0 30.0Cooling, building supply temperature (°C) 10.0 10.0 10.0
aDenotes the design conditions that imposed the size of the machine.
Dow
nloa
ded
by [
Um
eå U
nive
rsity
Lib
rary
] at
00:
22 0
3 O
ctob
er 2
014
A comparison between geothermal absorption and compression heat pumps 477
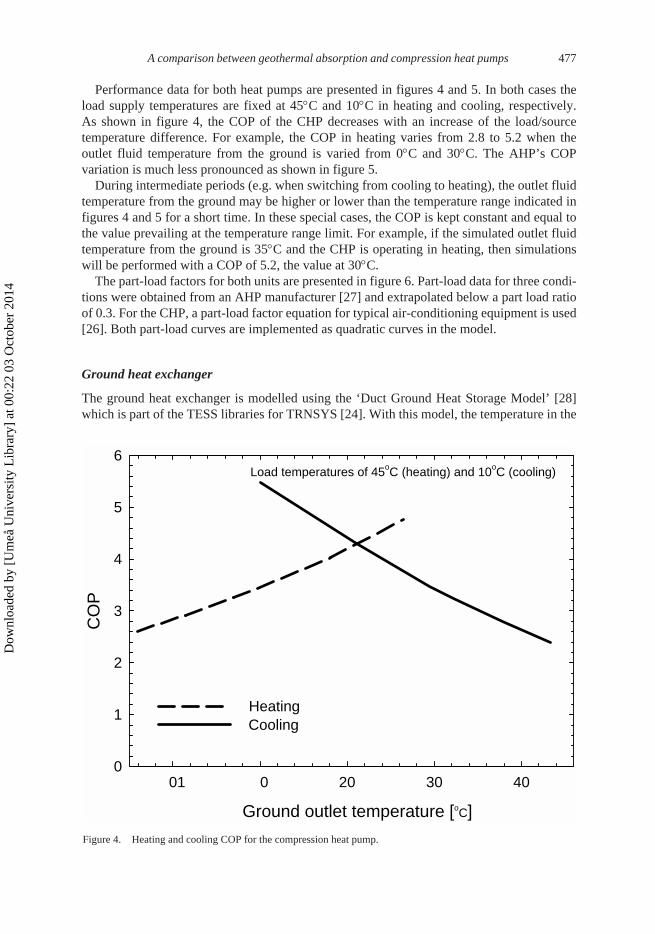
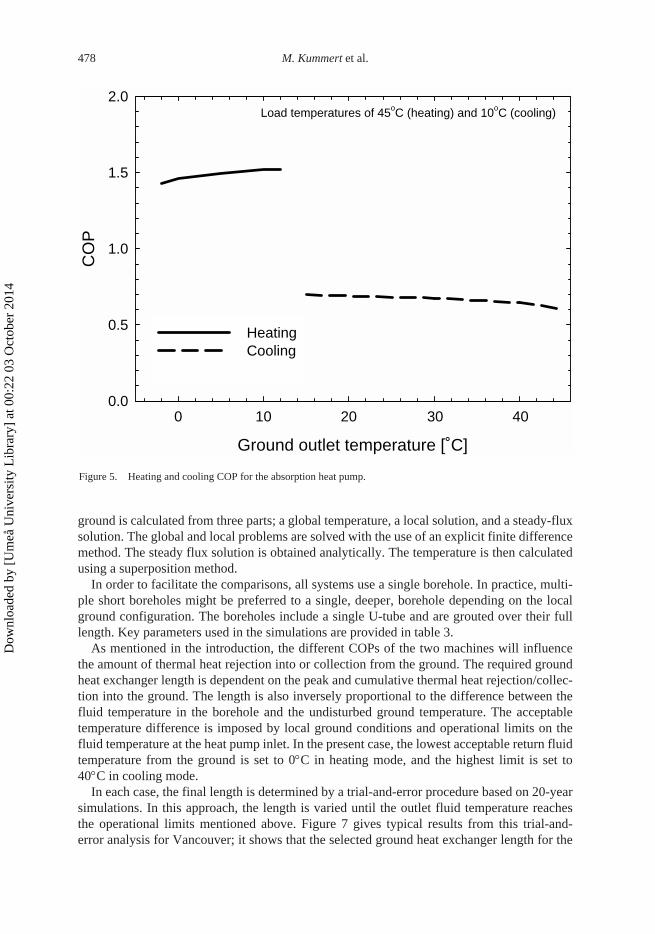
Performance data for both heat pumps are presented in figures 4 and 5. In both cases theload supply temperatures are fixed at 45°C and 10°C in heating and cooling, respectively.As shown in figure 4, the COP of the CHP decreases with an increase of the load/sourcetemperature difference. For example, the COP in heating varies from 2.8 to 5.2 when theoutlet fluid temperature from the ground is varied from 0°C and 30°C. The AHP’s COPvariation is much less pronounced as shown in figure 5.Figure 4. Heating and cooling COP for the compression heat pump.Figure 5. Heating and cooling COP for the absorption heat pump.During intermediate periods (e.g. when switching from cooling to heating), the outlet fluidtemperature from the ground may be higher or lower than the temperature range indicated infigures 4 and 5 for a short time. In these special cases, the COP is kept constant and equal tothe value prevailing at the temperature range limit. For example, if the simulated outlet fluidtemperature from the ground is 35°C and the CHP is operating in heating, then simulationswill be performed with a COP of 5.2, the value at 30°C.
The part-load factors for both units are presented in figure 6. Part-load data for three condi-tions were obtained from an AHP manufacturer [27] and extrapolated below a part load ratioof 0.3. For the CHP, a part-load factor equation for typical air-conditioning equipment is used[26]. Both part-load curves are implemented as quadratic curves in the model.Figure 6. Part-load factor for both heat pumps (dotted line for the AHP indicates extrapolated data).
Ground heat exchanger
The ground heat exchanger is modelled using the ‘Duct Ground Heat Storage Model’ [28]which is part of the TESS libraries for TRNSYS [24]. With this model, the temperature in the
Ground outlet temperature [oC]
01 0 20 30 40
CO
P
0
1
2
3
4
5
6
HeatingCooling
Load temperatures of 45oC (heating) and 10oC (cooling)
Figure 4. Heating and cooling COP for the compression heat pump.
Dow
nloa
ded
by [
Um
eå U
nive
rsity
Lib
rary
] at
00:
22 0
3 O
ctob
er 2
014
478 M. Kummert et al.
ground is calculated from three parts; a global temperature, a local solution, and a steady-fluxsolution. The global and local problems are solved with the use of an explicit finite differencemethod. The steady flux solution is obtained analytically. The temperature is then calculatedusing a superposition method.
In order to facilitate the comparisons, all systems use a single borehole. In practice, multi-ple short boreholes might be preferred to a single, deeper, borehole depending on the localground configuration. The boreholes include a single U-tube and are grouted over their fulllength. Key parameters used in the simulations are provided in table 3.
As mentioned in the introduction, the different COPs of the two machines will influencethe amount of thermal heat rejection into or collection from the ground. The required groundheat exchanger length is dependent on the peak and cumulative thermal heat rejection/collec-tion into the ground. The length is also inversely proportional to the difference between thefluid temperature in the borehole and the undisturbed ground temperature. The acceptabletemperature difference is imposed by local ground conditions and operational limits on thefluid temperature at the heat pump inlet. In the present case, the lowest acceptable return fluidtemperature from the ground is set to 0°C in heating mode, and the highest limit is set to40°C in cooling mode.
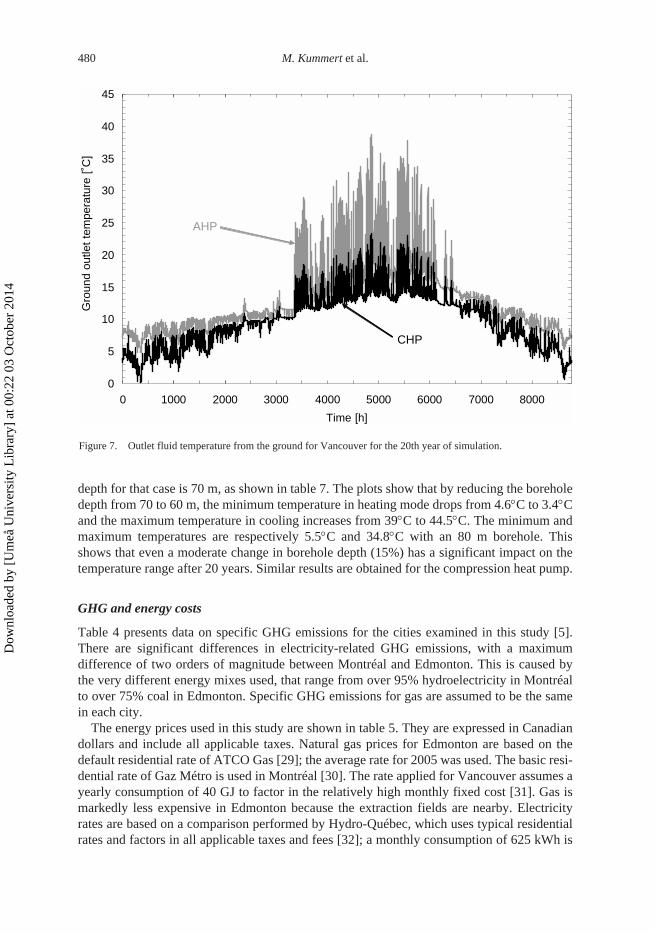
In each case, the final length is determined by a trial-and-error procedure based on 20-yearsimulations. In this approach, the length is varied until the outlet fluid temperature reachesthe operational limits mentioned above. Figure 7 gives typical results from this trial-and-error analysis for Vancouver; it shows that the selected ground heat exchanger length for the
Ground outlet temperature [˚C]
0 10 20 30 40
CO
P
0.0
0.5
1.0
1.5
2.0
HeatingCooling
Load temperatures of 45oC (heating) and 10oC (cooling)
Figure 5. Heating and cooling COP for the absorption heat pump.
Dow
nloa
ded
by [
Um
eå U
nive
rsity
Lib
rary
] at
00:
22 0
3 O
ctob
er 2
014
A comparison between geothermal absorption and compression heat pumps 479
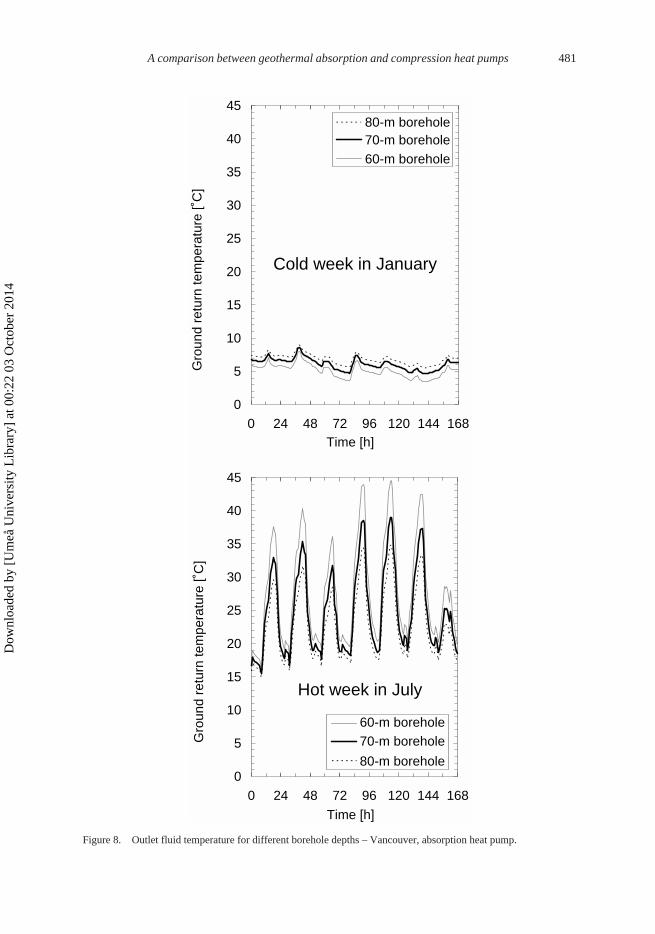
CHP leads to an outlet fluid temperature of 0°C in winter and approximately 23°C insummer after 20 years of operation. For the AHP the cooling load determines the length ofthe ground heat exchanger as the outlet fluid temperature reaches about 40°C in summer and5°C in winter.Figure 7. Outlet fluid temperature from the ground for Vancouver for the 20th year of simulation.Figure 8 illustrates the influence of the borehole depth on the minimum and maximumground return temperatures. The left part shows the return temperature from the groundduring a cold winter week, while the right part shows the return temperature during a hotweek in summer. All curves are for the absorption heat pump in Vancouver. The selected
Partial load ratio
0.0 0.2 0.4 0.6 0.8 1.0
Par
t lo
ad f
acto
r
0.4
0.5
0.6
0.7
0.8
0.9
1.0
AHPCHP
Figure 6. Part-load factor for both heat pumps (dotted line for the AHP indicates extrapolated data).
Table 3. Key parameters of the ground source heat exchanger.
Parameter Value
Borehole depth City dependentNumber of boreholes 1Borehole radius 0.0762 mNumber of HDPE pipes in borehole 2 (i.e. one U-tube)O.D./I.D. of pipe 0.042/0.034 mCentre-to-centre half distance 0.055 mGrout thermal conductivity 0.73 W/m-KGround thermal conductivity 2.0 W/m-KGround thermal capacity 2300 kJ/m3.K
Dow
nloa
ded
by [
Um
eå U
nive
rsity
Lib
rary
] at
00:
22 0
3 O
ctob
er 2
014
480 M. Kummert et al.
depth for that case is 70 m, as shown in table 7. The plots show that by reducing the boreholedepth from 70 to 60 m, the minimum temperature in heating mode drops from 4.6°C to 3.4°Cand the maximum temperature in cooling increases from 39°C to 44.5°C. The minimum andmaximum temperatures are respectively 5.5°C and 34.8°C with an 80 m borehole. Thisshows that even a moderate change in borehole depth (15%) has a significant impact on thetemperature range after 20 years. Similar results are obtained for the compression heat pump.Figure 8. Outlet fluid temperature for different borehole depths – Vancouver, absorption heat pump.
GHG and energy costs
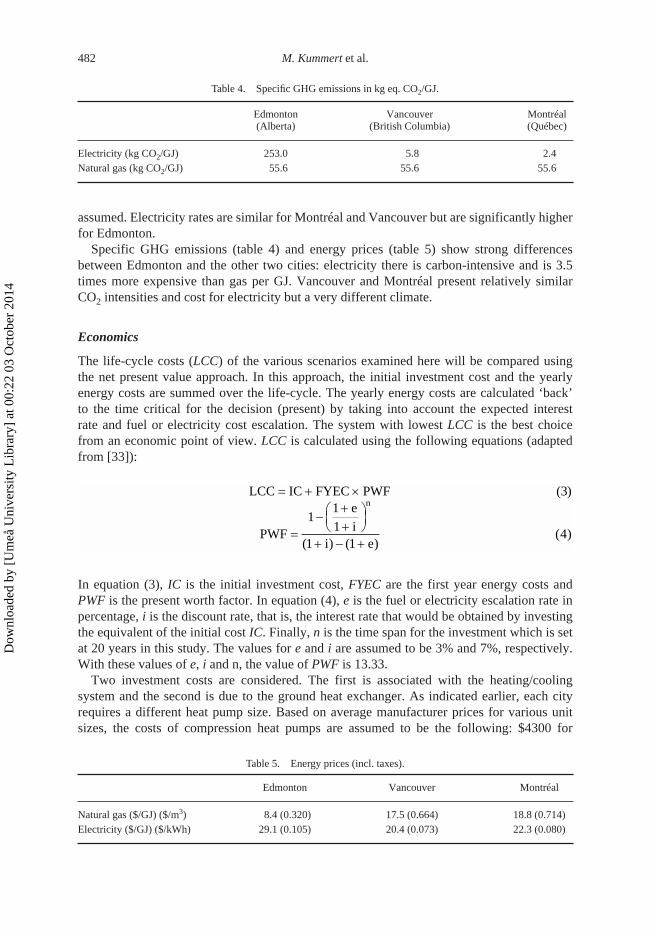
Table 4 presents data on specific GHG emissions for the cities examined in this study [5].There are significant differences in electricity-related GHG emissions, with a maximumdifference of two orders of magnitude between Montréal and Edmonton. This is caused bythe very different energy mixes used, that range from over 95% hydroelectricity in Montréalto over 75% coal in Edmonton. Specific GHG emissions for gas are assumed to be the samein each city.
The energy prices used in this study are shown in table 5. They are expressed in Canadiandollars and include all applicable taxes. Natural gas prices for Edmonton are based on thedefault residential rate of ATCO Gas [29]; the average rate for 2005 was used. The basic resi-dential rate of Gaz Métro is used in Montréal [30]. The rate applied for Vancouver assumes ayearly consumption of 40 GJ to factor in the relatively high monthly fixed cost [31]. Gas ismarkedly less expensive in Edmonton because the extraction fields are nearby. Electricityrates are based on a comparison performed by Hydro-Québec, which uses typical residentialrates and factors in all applicable taxes and fees [32]; a monthly consumption of 625 kWh is
0
5
10
15
20
25
30
35
40
45
0 1000 2000 3000 4000 5000 6000 7000 8000
Time [h]
Gro
und
outle
t te
mpe
ratu
re [
˚C]
AHP
CHP
Figure 7. Outlet fluid temperature from the ground for Vancouver for the 20th year of simulation.
Dow
nloa
ded
by [
Um
eå U
nive
rsity
Lib
rary
] at
00:
22 0
3 O
ctob
er 2
014
A comparison between geothermal absorption and compression heat pumps 481
0
5
10
15
20
25
30
35
40
45
0 24 48 72 96 120 144 168Time [h]
Gro
und
retu
rn te
mpe
ratu
re [˚
C]
80-m borehole70-m borehole60-m borehole
Cold week in January
0
5
10
15
20
25
30
35
40
45
0 24 48 72 96 120 144 168
Time [h]
Gro
und
retu
rn te
mpe
ratu
re [˚
C]
60-m borehole70-m borehole
80-m borehole
Hot week in July
Figure 8. Outlet fluid temperature for different borehole depths – Vancouver, absorption heat pump.
Dow
nloa
ded
by [
Um
eå U
nive
rsity
Lib
rary
] at
00:
22 0
3 O
ctob
er 2
014
482 M. Kummert et al.
assumed. Electricity rates are similar for Montréal and Vancouver but are significantly higherfor Edmonton.
Specific GHG emissions (table 4) and energy prices (table 5) show strong differencesbetween Edmonton and the other two cities: electricity there is carbon-intensive and is 3.5times more expensive than gas per GJ. Vancouver and Montréal present relatively similarCO2 intensities and cost for electricity but a very different climate.
Economics
The life-cycle costs (LCC) of the various scenarios examined here will be compared usingthe net present value approach. In this approach, the initial investment cost and the yearlyenergy costs are summed over the life-cycle. The yearly energy costs are calculated ‘back’to the time critical for the decision (present) by taking into account the expected interestrate and fuel or electricity cost escalation. The system with lowest LCC is the best choicefrom an economic point of view. LCC is calculated using the following equations (adaptedfrom [33]):
In equation (3), IC is the initial investment cost, FYEC are the first year energy costs andPWF is the present worth factor. In equation (4), e is the fuel or electricity escalation rate inpercentage, i is the discount rate, that is, the interest rate that would be obtained by investingthe equivalent of the initial cost IC. Finally, n is the time span for the investment which is setat 20 years in this study. The values for e and i are assumed to be 3% and 7%, respectively.With these values of e, i and n, the value of PWF is 13.33.
Two investment costs are considered. The first is associated with the heating/coolingsystem and the second is due to the ground heat exchanger. As indicated earlier, each cityrequires a different heat pump size. Based on average manufacturer prices for various unitsizes, the costs of compression heat pumps are assumed to be the following: $4300 for
LCC IC FYEC PWF
PWF
e
ii e
n= + ×
=−
++
+ − +
( )
( ) ( )( )
3
11
11 1
4
Table 4. Specific GHG emissions in kg eq. CO2/GJ.
Edmonton(Alberta)
Vancouver(British Columbia)
Montréal(Québec)
Electricity (kg CO2/GJ) 253.0 5.8 2.4Natural gas (kg CO2/GJ) 55.6 55.6 55.6
Table 5. Energy prices (incl. taxes).
Edmonton Vancouver Montréal
Natural gas ($/GJ) ($/m3) 8.4 (0.320) 17.5 (0.664) 18.8 (0.714)Electricity ($/GJ) ($/kWh) 29.1 (0.105) 20.4 (0.073) 22.3 (0.080)
Dow
nloa
ded
by [
Um
eå U
nive
rsity
Lib
rary
] at
00:
22 0
3 O
ctob
er 2
014
A comparison between geothermal absorption and compression heat pumps 483
Vancouver, $5000 for Montréal and $6700 for Edmonton. The costs of the AHPs are difficultto estimate because of their recent introduction to the market. Data on cost per unit size arenot available, the only reference point being an approximate cost of $7000 for a 35/16 kW(heating/cooling) AHP [3]. Smaller units are expected to be less expensive in absolute termsbut to have a higher cost per kW. Considering that the design heating/cooling power (table 2)are different, the following AHP costs are assumed: $6000 for Vancouver, $5500 for Edmon-ton and $5000 for Montréal. Ground heat exchanger costs are assumed to be equal to $70 permeter of borehole. This price includes drilling, piping, and grouting costs.
Results
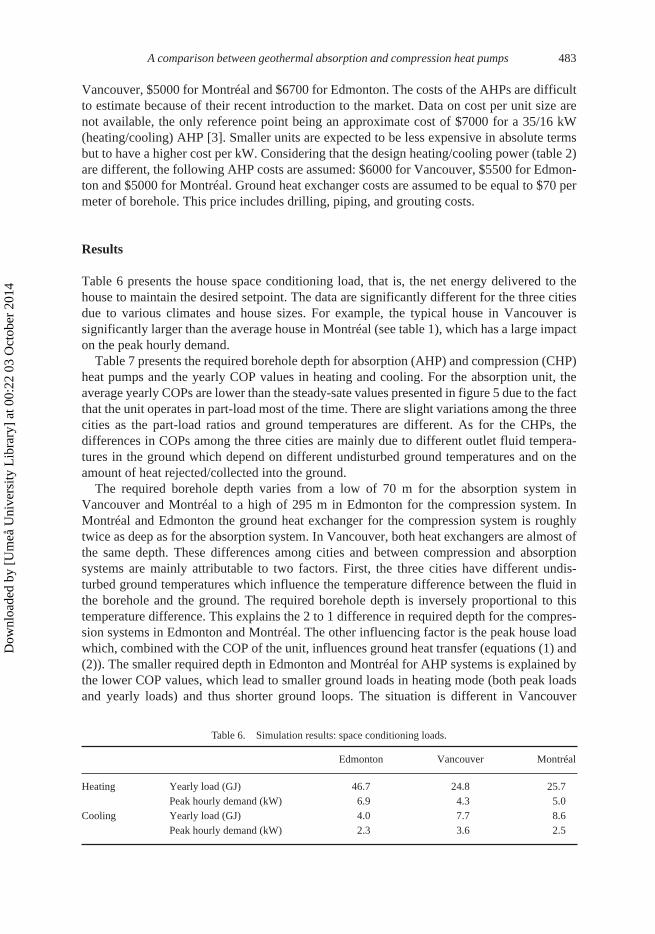
Table 6 presents the house space conditioning load, that is, the net energy delivered to thehouse to maintain the desired setpoint. The data are significantly different for the three citiesdue to various climates and house sizes. For example, the typical house in Vancouver issignificantly larger than the average house in Montréal (see table 1), which has a large impacton the peak hourly demand.
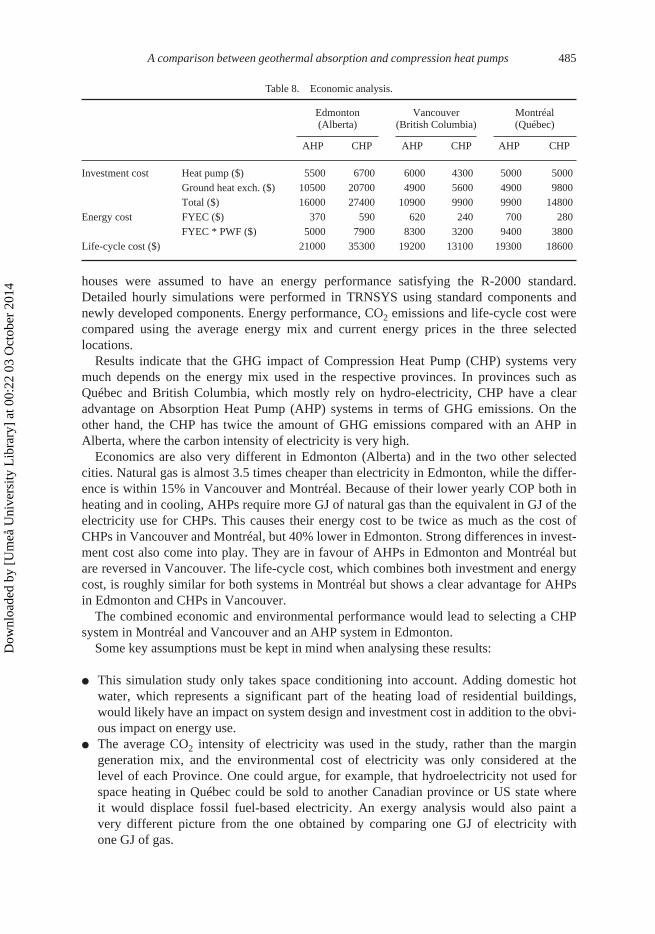
Table 7 presents the required borehole depth for absorption (AHP) and compression (CHP)heat pumps and the yearly COP values in heating and cooling. For the absorption unit, theaverage yearly COPs are lower than the steady-sate values presented in figure 5 due to the factthat the unit operates in part-load most of the time. There are slight variations among the threecities as the part-load ratios and ground temperatures are different. As for the CHPs, thedifferences in COPs among the three cities are mainly due to different outlet fluid tempera-tures in the ground which depend on different undisturbed ground temperatures and on theamount of heat rejected/collected into the ground.
The required borehole depth varies from a low of 70 m for the absorption system inVancouver and Montréal to a high of 295 m in Edmonton for the compression system. InMontréal and Edmonton the ground heat exchanger for the compression system is roughlytwice as deep as for the absorption system. In Vancouver, both heat exchangers are almost ofthe same depth. These differences among cities and between compression and absorptionsystems are mainly attributable to two factors. First, the three cities have different undis-turbed ground temperatures which influence the temperature difference between the fluid inthe borehole and the ground. The required borehole depth is inversely proportional to thistemperature difference. This explains the 2 to 1 difference in required depth for the compres-sion systems in Edmonton and Montréal. The other influencing factor is the peak house loadwhich, combined with the COP of the unit, influences ground heat transfer (equations (1) and(2)). The smaller required depth in Edmonton and Montréal for AHP systems is explained bythe lower COP values, which lead to smaller ground loads in heating mode (both peak loadsand yearly loads) and thus shorter ground loops. The situation is different in Vancouver
Table 6. Simulation results: space conditioning loads.
Edmonton Vancouver Montréal
Heating Yearly load (GJ) 46.7 24.8 25.7Peak hourly demand (kW) 6.9 4.3 5.0
Cooling Yearly load (GJ) 4.0 7.7 8.6Peak hourly demand (kW) 2.3 3.6 2.5
Dow
nloa
ded
by [
Um
eå U
nive
rsity
Lib
rary
] at
00:
22 0
3 O
ctob
er 2
014
484 M. Kummert et al.
because the required depth is imposed by the cooling load instead of the heating load for theAHP system. In cooling mode, the lower COP value of an AHP leads to higher ground loadsand in the particular case of Vancouver the peak cooling load imposes the minimal depth ofthe ground heat exchanger for the AHP system, while it is imposed by the heating load withthe CHP system.
The lower part of table 7 presents the yearly energy consumption (electricity or naturalgas) and GHG emissions related to space conditioning. The GHG emissions include emis-sions at the house level and at the thermal power plant. The yearly energy consumption is 2.9,2.2, and 3.0 times higher for the absorption system for Montréal, Edmonton, and Vancouver,respectively. In absolute terms the yearly energy consumption is the greatest in Edmonton.GHG emissions are also the greatest in Edmonton. But in contrast to the situation in Montréaland Vancouver, the GHG emissions of the compression system are higher than for theabsorption system. This is due to the fact that the electricity produced in Edmonton is mainlybased on fossil-fuel thermal power plants while electricity in Montréal and Vancouver ismainly hydro.
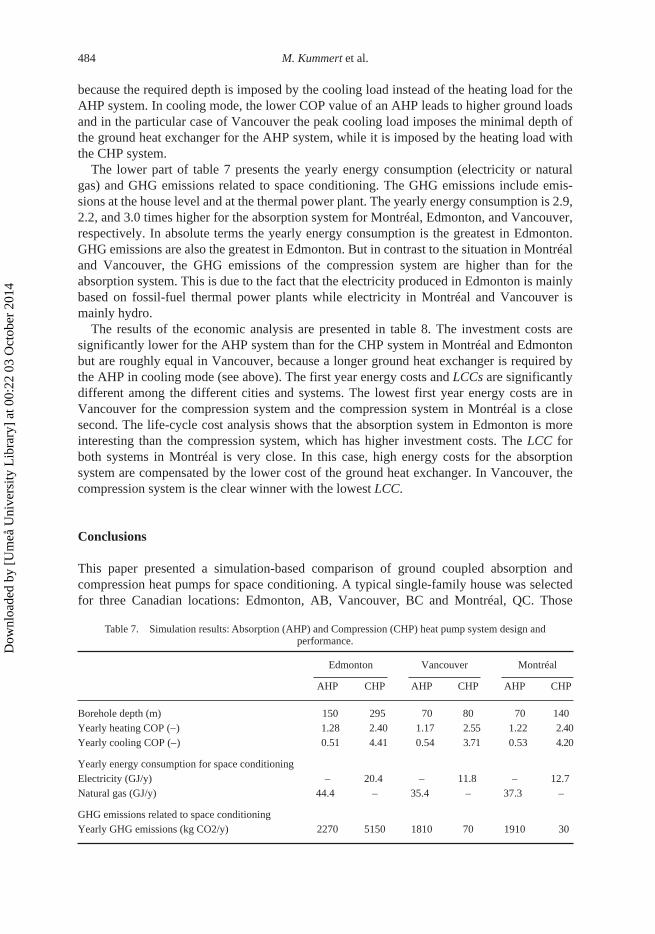
The results of the economic analysis are presented in table 8. The investment costs aresignificantly lower for the AHP system than for the CHP system in Montréal and Edmontonbut are roughly equal in Vancouver, because a longer ground heat exchanger is required bythe AHP in cooling mode (see above). The first year energy costs and LCCs are significantlydifferent among the different cities and systems. The lowest first year energy costs are inVancouver for the compression system and the compression system in Montréal is a closesecond. The life-cycle cost analysis shows that the absorption system in Edmonton is moreinteresting than the compression system, which has higher investment costs. The LCC forboth systems in Montréal is very close. In this case, high energy costs for the absorptionsystem are compensated by the lower cost of the ground heat exchanger. In Vancouver, thecompression system is the clear winner with the lowest LCC.
Conclusions
This paper presented a simulation-based comparison of ground coupled absorption andcompression heat pumps for space conditioning. A typical single-family house was selectedfor three Canadian locations: Edmonton, AB, Vancouver, BC and Montréal, QC. Those
Table 7. Simulation results: Absorption (AHP) and Compression (CHP) heat pump system design and performance.
Edmonton Vancouver Montréal
AHP CHP AHP CHP AHP CHP
Borehole depth (m) 150 295 70 80 70 140Yearly heating COP (−) 1.28 2.40 1.17 2.55 1.22 2.40Yearly cooling COP (−) 0.51 4.41 0.54 3.71 0.53 4.20
Yearly energy consumption for space conditioningElectricity (GJ/y) – 20.4 – 11.8 – 12.7Natural gas (GJ/y) 44.4 – 35.4 – 37.3 –
GHG emissions related to space conditioningYearly GHG emissions (kg CO2/y) 2270 5150 1810 70 1910 30
Dow
nloa
ded
by [
Um
eå U
nive
rsity
Lib
rary
] at
00:
22 0
3 O
ctob
er 2
014
A comparison between geothermal absorption and compression heat pumps 485
houses were assumed to have an energy performance satisfying the R-2000 standard.Detailed hourly simulations were performed in TRNSYS using standard components andnewly developed components. Energy performance, CO2 emissions and life-cycle cost werecompared using the average energy mix and current energy prices in the three selectedlocations.
Results indicate that the GHG impact of Compression Heat Pump (CHP) systems verymuch depends on the energy mix used in the respective provinces. In provinces such asQuébec and British Columbia, which mostly rely on hydro-electricity, CHP have a clearadvantage on Absorption Heat Pump (AHP) systems in terms of GHG emissions. On theother hand, the CHP has twice the amount of GHG emissions compared with an AHP inAlberta, where the carbon intensity of electricity is very high.
Economics are also very different in Edmonton (Alberta) and in the two other selectedcities. Natural gas is almost 3.5 times cheaper than electricity in Edmonton, while the differ-ence is within 15% in Vancouver and Montréal. Because of their lower yearly COP both inheating and in cooling, AHPs require more GJ of natural gas than the equivalent in GJ of theelectricity use for CHPs. This causes their energy cost to be twice as much as the cost ofCHPs in Vancouver and Montréal, but 40% lower in Edmonton. Strong differences in invest-ment cost also come into play. They are in favour of AHPs in Edmonton and Montréal butare reversed in Vancouver. The life-cycle cost, which combines both investment and energycost, is roughly similar for both systems in Montréal but shows a clear advantage for AHPsin Edmonton and CHPs in Vancouver.
The combined economic and environmental performance would lead to selecting a CHPsystem in Montréal and Vancouver and an AHP system in Edmonton.
Some key assumptions must be kept in mind when analysing these results:
● This simulation study only takes space conditioning into account. Adding domestic hotwater, which represents a significant part of the heating load of residential buildings,would likely have an impact on system design and investment cost in addition to the obvi-ous impact on energy use.
● The average CO2 intensity of electricity was used in the study, rather than the margingeneration mix, and the environmental cost of electricity was only considered at thelevel of each Province. One could argue, for example, that hydroelectricity not used forspace heating in Québec could be sold to another Canadian province or US state whereit would displace fossil fuel-based electricity. An exergy analysis would also paint avery different picture from the one obtained by comparing one GJ of electricity withone GJ of gas.
Table 8. Economic analysis.
Edmonton(Alberta)
Vancouver(British Columbia)
Montréal(Québec)
AHP CHP AHP CHP AHP CHP
Investment cost Heat pump ($) 5500 6700 6000 4300 5000 5000Ground heat exch. ($) 10500 20700 4900 5600 4900 9800Total ($) 16000 27400 10900 9900 9900 14800
Energy cost FYEC ($) 370 590 620 240 700 280FYEC * PWF ($) 5000 7900 8300 3200 9400 3800
Life-cycle cost ($) 21000 35300 19200 13100 19300 18600
Dow
nloa
ded
by [
Um
eå U
nive
rsity
Lib
rary
] at
00:
22 0
3 O
ctob
er 2
014
486 M. Kummert et al.
These aspects should be considered in further work. In spite of these simplifications, thepresent study shows an interesting potential for absorption geothermal heat pump systems insome Canadian provinces and, by extrapolation, in some US states. Geothermal AHPsystems lead to lower CO2 emissions than CHP systems if electricity is mainly generatedfrom fossil fuels. Economics can also play in favour of AHP systems in some locations andthere seems to be a positive reinforcement between their environmental and economic advan-tages. Finally, the simulations have shown that the optimal system design (heat pump sizingand borehole length) is very different for AHPs and CHPs and that this factor must be takeninto account when comparing the potential of both technologies.
Nomenclature
AHP: Absorption Heat PumpCHP: Compression Heat PumpCOP: Coefficient Of PerformanceDHW: Domestic Hot Watere: fuel or electricity escalation rateFYEC: First Year Energy CostGHG: Greenhouse Gasi: Market discount rateIC: Investment CostLCC: Life-Cycle Costn: Number of years for the LCC studyPWF: Present Worth FactorQground,sink: Energy removed from the ground (heating mode)Qground,source: Energy added to the ground (cooling mode)Quseful,cooling: Useful energy (cooling)Quseful,heating: Useful energy (heating)R-2000: Canadian standard for energy efficiency in homes [20]
References
[1] Lund, J.W., Freeston, D.H. and Boyd, T.L., 2005, Direct application of geothermal energy: 2005 Worldwidereview. Geothermics, 34(6), 691–727.
[2] Rybach, L., 2005, The advance of geothermal heat pumps world-wide. IEA Heat Pump Centre Newsletter,23(4), 13–18.
[3] Robur, 2006, Model GAHP-W-LB. ROBUR S.p.A. 24040 Verdellino/Zingonia (Bg) – Italy. Available onlineat: www.robur.com (accessed March 2006).
[4] Radermacher, R., 1996, Absorption Chillers and Heat Pumps (Boca Raton, FL: CRC Press).[5] Environment Canada, 2005, Canada’s Greenhouse Gas Inventory: 1990–2003. Annex 9: Electricity Intensity
Tables. Environment Canada, Gatineau, QC, Canada.[6] ASHRAE, 2003, Geothermal energy, in Handbook of Applications, chapter 32, pp. 32.11–32.28 (Atlanta, GA:
American Society of Heating, Refrigerating and Air-conditioning Engineers).[7] Caneta Research, 2003, Global warming impacts of ground-source heat pumps compared to other heating and
cooling systems: an update for the Canadian Geoexchange Coalition. Natural Resources Canada, Renewableand Electrical Energy Division. Ottawa, ON, Canada.
[8] GEO & ORNL, 2000, Emissions and economic analysis of ground source heat pumps in Wisconsin. Preparedby Global Energy Options and Oakridge National Laboratories for the Energy Center of Wisconsin, Madison,WI, USA.
[9] Gansler, R., Reindl, D. and Jekel, T., 2001, Simulation of source energy utilization and emissions for HVACsystems. ASHRAE Transactions, American Society of Heating, Refrigerating, and Air-Conditioning Engineers,Atlanta, GA, pp. 39–51.
Dow
nloa
ded
by [
Um
eå U
nive
rsity
Lib
rary
] at
00:
22 0
3 O
ctob
er 2
014
A comparison between geothermal absorption and compression heat pumps 487
[10] Argiriou, A., Balaras, C., Kontoyiannidis, S. and Michel, E., 2005, Numerical simulation and performanceassessment of a low capacity solar assisted absorption heat pump coupled with a sub-floor system. SolarEnergy, 79(3), 290–301.
[11] Seifert, P., 2000, Rational supply of power, heat and cooling in buildings demonstrated by a hospital inDresden. Final report of EU-Thermie project BU/0065/97 DBI Gas- und Umwelttechnik GmbH, 2000.
[12] Lamp, P. and Ziegler, F., 1998, European research on solar-assisted air conditioning. International Journal ofRefrigeration, 21, 89–99.
[13] Ziegler, F., 2002, State of the art in sorption heat pumping and cooling technologies. International Journal ofRefrigeration, 25, 450–459.
[14] Balaras, C., Argiriou, A., Michel, E. and Henning, H., 2003, Recent activities on solar air conditioning.ASHRAE Transactions, 109, 251–260.
[15] Garimella, S., 1997, Absorption heat pump performance improvement through ground coupling. Journal ofEnergy Resources Technology, Transactions of the ASME, 119, 242–249.
[16] Sanner, B., Hopkirk, R., Kabus, F., Ritter, W. and Rybach, L., 1996, Practical experiences in Europe of thecombination of geothermal energy and heat pumps, in: Proceedings of IEA Conference on Heat PumpingTechnologies, I, pp. 111–123.
[17] Klein, S.A. et al., 2004, TRNSYS 16 – A Transient System Simulation program, User manual, University ofWisconsin-Madison, Solar Energy Laboratory.
[18] Gusdorf, J., 2001, EKO∧10 Base Cases & Benchmarks (DRAFT). Natural Resources Canada, CANMET,Buildings Group.
[19] Hamlin, T. and Gusdorf, J., 1997, Air tightness and energy efficiency of new conventional and R-2000 housingin Canada, 1997. Natural Resources Canada, CANMET, Buildings Group.
[20] NRCan, 2005, R-2000 Standard (2005 Edition). Natural Resources Canada, Office of Energy Efficiency,Ottawa.
[21] Numerical Logics, 1999, Canadian Weather for Energy Calculations, Users Manual and CD-ROM. EnvironmentCanada, Ottawa.
[22] TESS, 2004, TESS Libraries Version 2, User manual. Thermal Energy Systems Specialists, Madison, WI..[23] NRC, 1997, Model National Energy Code of Canada for Houses 1997. National Research Council Canada,
Institute for Research in Construction, Ottawa.[24] ASHRAE, 2005, Ventilation and infiltration, in: Handbook of Fundamentals, chapter 27, p. 27.22 (Atlanta,
GA: American Society of Heating, Refrigerating and Air-conditioning Engineers).[25] Walker, I. and Wilson, D., 1998, Field validation of algebraic equations for stack and wind driven air infiltra-
tion calculations. HVAC&R Research, 4, 119–139.[26] Henderson, H., Huang, Y.J. and Parker, D., 1999, Residential equipment part-load curves for use in DOE-2.
Report LBNL-42175. Lawrence Berkeley National Laboratory, Berkeley, CA.[27] Robur, 2006, Part-load data for the GAHP-W-LB. Personal communication. Robur SpA, Verdellino
(Bergamo), Italy.[28] Hellström, G., 1989, Duct Ground Heat Storage Model, Manual for Computer Code, Department of Mathematical
Physics, University of Lund, Sweden.[29] Direct Energy Regulated Services, 2006, Historic Rates for North Customers. Available online at:
www.directenergy.com/alberta/home_regulated/natural_gas/historic_gas_rates.aspx (accessed July 2006).[30] Gaz Métro, 2006, Gaz Métro, Montréal, QC, Canada Tariffs – 1 October 2005 (modified 1 March 2006).
Available online: www.gazmetro.com (accessed July 2006).[31] Terasen Gas, 2006, Current Vancouver Island and Sunshine Coast service area rates (effective 1 January
2006), Terasen Gas Inc., Surrey, BC, Canada.. Available online at: www.terasengas.com (accessed July 2006).[32] Hydro-Québec, 2005, Comparison of Electricity Prices in Major North American Cities – Rates in effect
1 April 2005, Hydro-Québec, Montréal, QC, Canada.[33] Duffie, J.A. and Beckman, W.A., 2006, Solar Engineering of Thermal Processes, 3rd edn (Hoboken, NJ:
Wiley).[34] NRCan, 1998, GS2000 – Heat Exchanger Design Program, Version 2.0c. Natural Resources Canada,
CANMET Technology Centre, Buildings Group, Ottawa, ON, Canada.
Dow
nloa
ded
by [
Um
eå U
nive
rsity
Lib
rary
] at
00:
22 0
3 O
ctob
er 2
014