Embed Size (px)
Citation preview

Quaternary Science Reviews, Vol. 7, pp. 455-459, 1988. 0277-3791/88 $0.00 + .50 Printed in Great Britain. All rights reserved. Copyright (~) 1988 Pergamon Press plc
A COMPARATIVE EXAMINATION IN VALIDITY OF AD VALUE ESTIMATED FROM ESR SPECTRA OF VARIOUS CARBONATE SEDIMENTS
Chen Yijian,* Lu Jinfen,t Cao Tangmao,t He Rungent and Zhang Rilumt- * Institute of Geology, State Seismological Bureau, Beijing, China
t lnstitute of Biophysics, Academic Sinica, Beijing, China
In order to assess the validity of routine AD-determination, more than 50 carbonate samples of various origin and known age or AD were investigated. Our results demonstrated that reliable chronological information indeed exists on the gamma-induced spectrum. Moreover, information relating to genesis, depositional environment and crystallization can be obtained simultaneously. The uncertainty in AD estimation is about 20% depending on the selection of signal and plotting method. Our study illustrates that the ESR dating method opens up new possibilities for Quaternary chronological studies.
INTRODUCTION
The validity of the AD value is fundamental to ESR dating. However, significant scatter of AD data has been reported due to improper recording and evalu- ation of ESR spectra as shown by the first ESR inter- laboratory comparison test (Hennig et al., 1985). In order to examine the validity of the AD value derived from ESR spectra, more than 50 carbonate samples were tested, varying in 14C age from zero to more than 45 ka, and a series of irradiated samples which had received doses from 5 Gy to 200 Gy.
ESR measurements were performed on a Varian E- 109 spectrometer with a magnetic field modulation of 0.5 G, a microwave frequency of 9.1 GHz and a microwave power of 2-3 mW. The samples were crushed in a mortar and 200-300 mg of sample with a sieve fraction of 105-220 Ixm was used for ESR measurement. Since the samples were not etched with acid, interference from the crushing signal at g = 2.0001 is possible.
THE ESR SIGNALS OBSERVED
Ten ESR lines in the spectra of carbonate samples can be found in the range between the two Mn transition lines (Fig. 1). The shape of the ESR spectrum can be classified into three types: the first including pure macrocrystalline stalagmites and flow- stones characterised by having a dominant combined line at g = 2.0020; the second including impure micro- crystalline stalactite and calcrete characterised by having a broad line (BL) at g = 2.0045 or 2.0054; the third including coral and shell characterised by having three pronounced lines at g = 2.0052, 2.0026 and 2.0006. However, the spectra of pure chemical CaCO3, synthetic calcite and aragonite differ significantly from the natural calcite and aragonite (Fig. 2). It seems to suggest that the difference in the shape of spectrum cannot be attributed to the mineral composition of the
h2-2
!
BL
, / i "i
..... , / i-l '
M n - 1 g = 2.0097
g-value hi. 1 2.0056 h2_ 3 2.0020 BL 2.0054 h24 2.0014
hl_ 2 2.0050 h3.1 2.0004 h2.1 2.0035 h3_ 2 1.9997
h2_ 2 2.0026 h 4 1,9973
9.1GHz 0.5 Gpp
1 mW
h4
Jr r j " i t :." P
,,'/ "'"". .......
Groups of signal
FIG. 1. Three types of ESR spectra derived from flowstone (solid line), calcrete (dashed line) and coral limestone (dotted line). A microwave power of 1 mW and a modulation amplitude of 0.5 G
were used.
sample but is related to impurity (such as humic acids and clay minerals), genesis, depositional environment and crystallization.
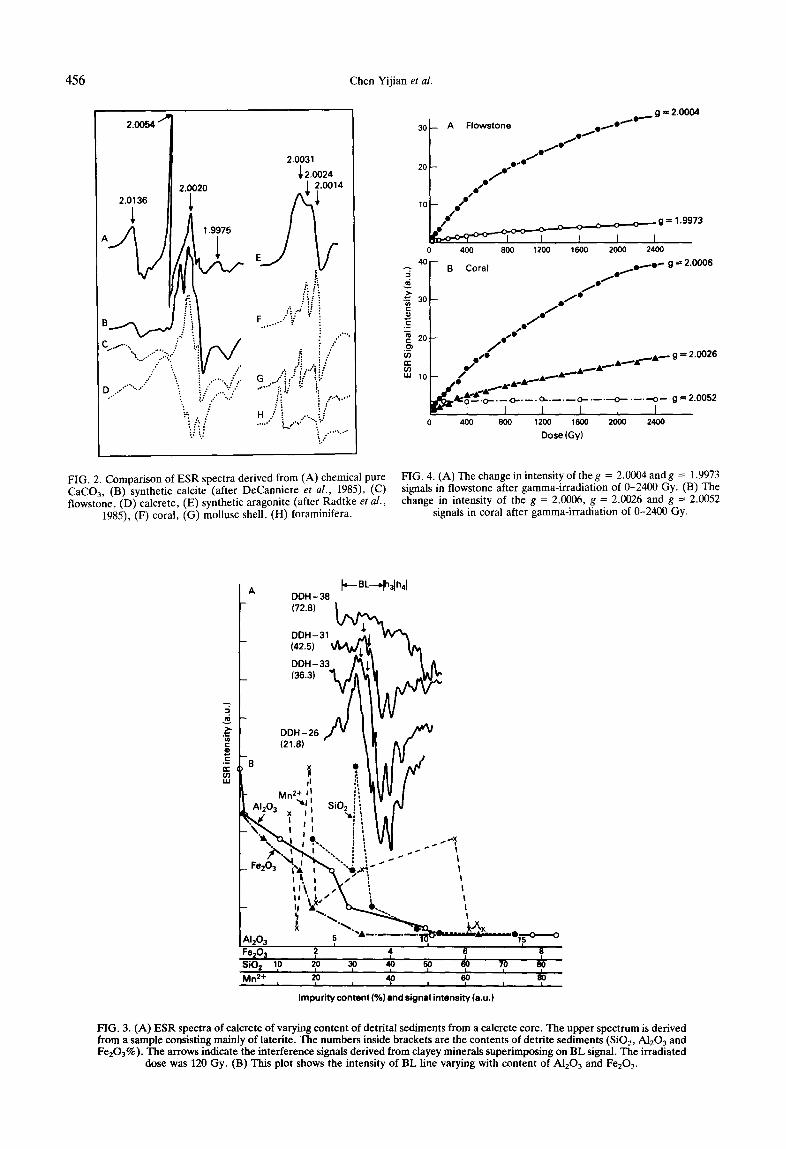
Figure 3 shows the ESR spectra of four calcretes from a bore core containing varying amounts of detrital sediment. A few signals resulting from clay minerals superimposing on the BL line are visible. As the SIO2, AI20 3 and Fe20 3 contents reach 36%, as shown in Fig. 4B, it becomes evident that a progressive decrease in signal intensity occurs with increasing amounts of A1203 and Fe203. The effect of SiO2 content on signal amplitude of BL does not seem serious since the
455
456 Chen Yijian et aL
2.0054/~
2,0~36
c , - . . , ... i ,., %......'" .,:-..,"
. / ".. °... ................. ' •
• ... / ~....-. /
2.0031
2.0024
.-1 . F ~ '~i ! i l .......... ......
H ../ , ,.,.:....... %:
• .....%... %.:
30
20
10
4 0
30 E 03
20 O~
O~ rf- Oq UJ 10
g 2.0004 _ A Flowstone o ~ e ' ~ ' O ' ' "
_ o.o ~ ° ~ ° ~ ° ~ / e "
sO So
, / / e g = 1.9973
~ I I ] I ] 4 0 0 8 0 0 1 2 0 0 1600 2 0 0 0 2 4 0 0
- B Coral o ~ o ' ' 'O~ g = 2.0006
_ /o.O"/°/ . / e . . . . & ~ g = 2.0026
e / " A.....A......A '''`L~ ~ e ~ & . M4k""
: ~ 1 ¢ 0 - - . 0 - - . - - < ~ ' - - - O- . . . . o-- ---.---0-- . - - - - -o-- g = 2.0052 i ' - - - [ I I I J I
4 0 0 8 0 0 1 2 0 0 1600 2 0 0 0 2 4 0 0
Dose (Gy)
FIG. 2. Comparison of ESR spectra derived from (A) chemical pure CaCO3, (B) synthetic calcite (after DeCanniere et al., 1985), (C) flowstone, (D) calcrete, (E) synthetic aragonite (after Radtke et al.,
1985), (F) coral, (G) mollusc shell, (H) foraminifera.
FIG. 4. (A) The change in intensity of the g = 2.0004 and g = 1.9973 signals in flowstone after gamma-irradiation of 0-2400 Gy. (B) The change in intensity of the g = 2.0006, g = 2.0026 and g --- 2.0052
signals in coral after gamma-irradiation of 0-2400 Gy.
I (D E r~
F . - - - B L - - - ~ n , I I_A DDH - 38
(72.8) ~
L DDH-31 (42.51 ~VW[ A
0D.-33 /~i/ "~ ^
D D . - 2 8 / V ~ ~ ),~ (2181 ~I /V
M . ' + " ii ~ V V I AI203 . "~t' Si02 i i IV N ^ , I ~;%
, . ~ , , , ~i! I J l \ - ' ~ ' , ' i~ ~1~1
i ~ . , \,. ! l
~1~0~ s "A - t ~ - . - - , , - - - ~ - , - - - %-g-o Fe;O;I 2 4 I 6 I 8 Sio2 lo 20 3o 4o so ~ 7o so
I I I I I I I | Mn 2+ 20 40 60 so
I I I I I I I I
Impurity content (%) and signal intensity (a.u.)
FIG. 3. (A) ESR spectra of calcrete of varying content of detrital sediments from a calcrete core. The upper spectrum is derived from a sample consisting mainly of laterite. The numbers inside brackets are the contents of detrite sediments (SIO2, A1203 and Fe203%). The arrows indicate the interference signals derived from clayey minerals superimposing on BL signal• The irradiated
dose was 120 Gy. (B) This plot shows the intensity of BL line varying with content of A1203 and Fe203.
Validity of AD Value 457
sensitivity of radiation in quartz is low (Regulla et al., 1985; Smith et al., 1985a).
As shown in Fig. 4, an exponential increase in intensity of signals at g = 2.0026, 2.0020, 2.0006 and 1.9973 with increasing dose was observed. However, the growth curves of the ESR signal appear to be linear only in the lower irradiation range. For coral limestone samples, the start of saturation appears at a dose of about 300 Gy. For flowstone samples, the start of saturation appears at a dose of about 200 Gy. For stalagmite samples, the start of saturation appears at a dose of about 100 Gy. Our observations are similar to the observations by Smith et al. (1985b), but differ from Wieser et al. (1985), who observed a start of saturation at a dose of 10 kGy in a Hegy sample.
COMPARATIVE EXAMINATION OF AD VALUE
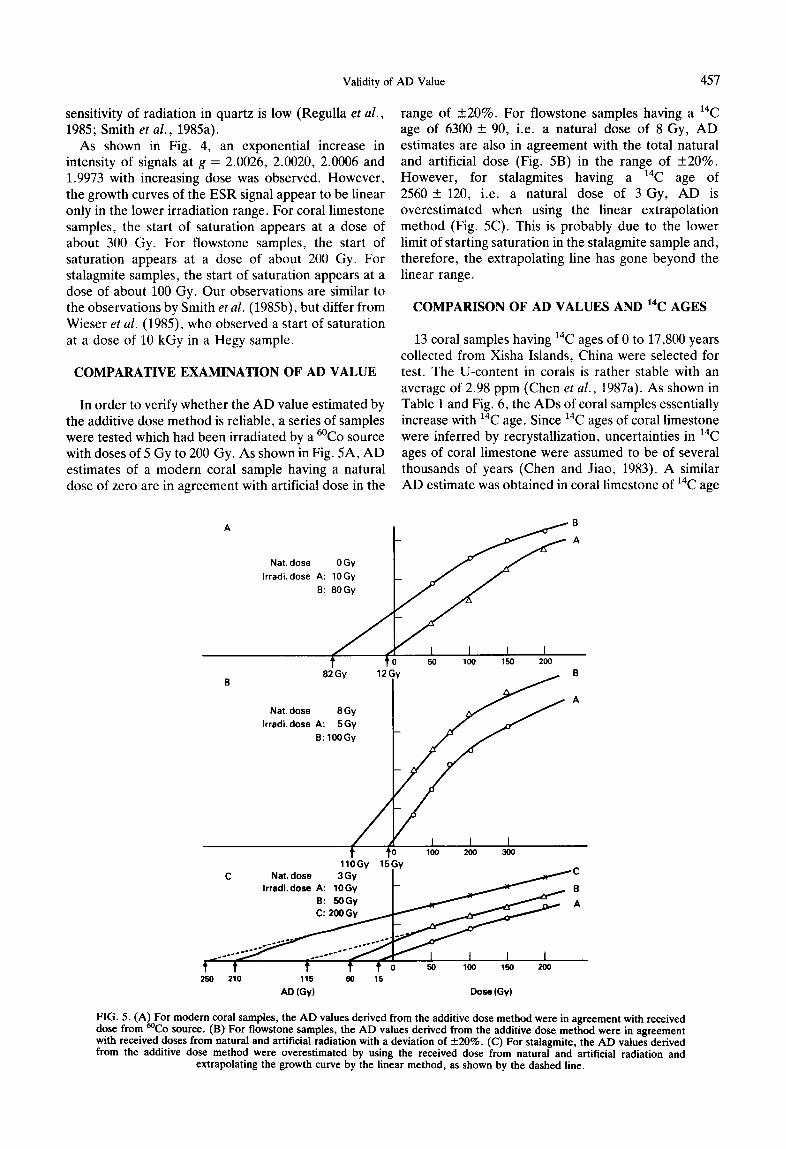
In order to verify whether the AD value estimated by the additive dose method is reliable, a series of samples were tested which had been irradiated by a 6°Co source with doses of 5 Gy to 200 Gy. As shown in Fig. 5A, AD estimates of a modern coral sample having a natural dose of zero are in agreement with artificial dose in the
range of _+20%. For flowstone samples having a 14C age of 6300 + 90, i.e. a natural dose of 8 Gy, AD estimates are also in agreement with the total natural and artificial dose (Fig. 5B) in the range of _+20%. However, for stalagmites having a 14C age of 2560 -+ 120, i.e. a natural dose of 3 Gy, AD is overestimated when using the linear extrapolation method (Fig. 5C). This is probably due to the lower limit of starting saturation in the stalagmite sample and, therefore, the extrapolating line has gone beyond the linear range.
COMPARISON OF AD VALUES AND 14C AGES
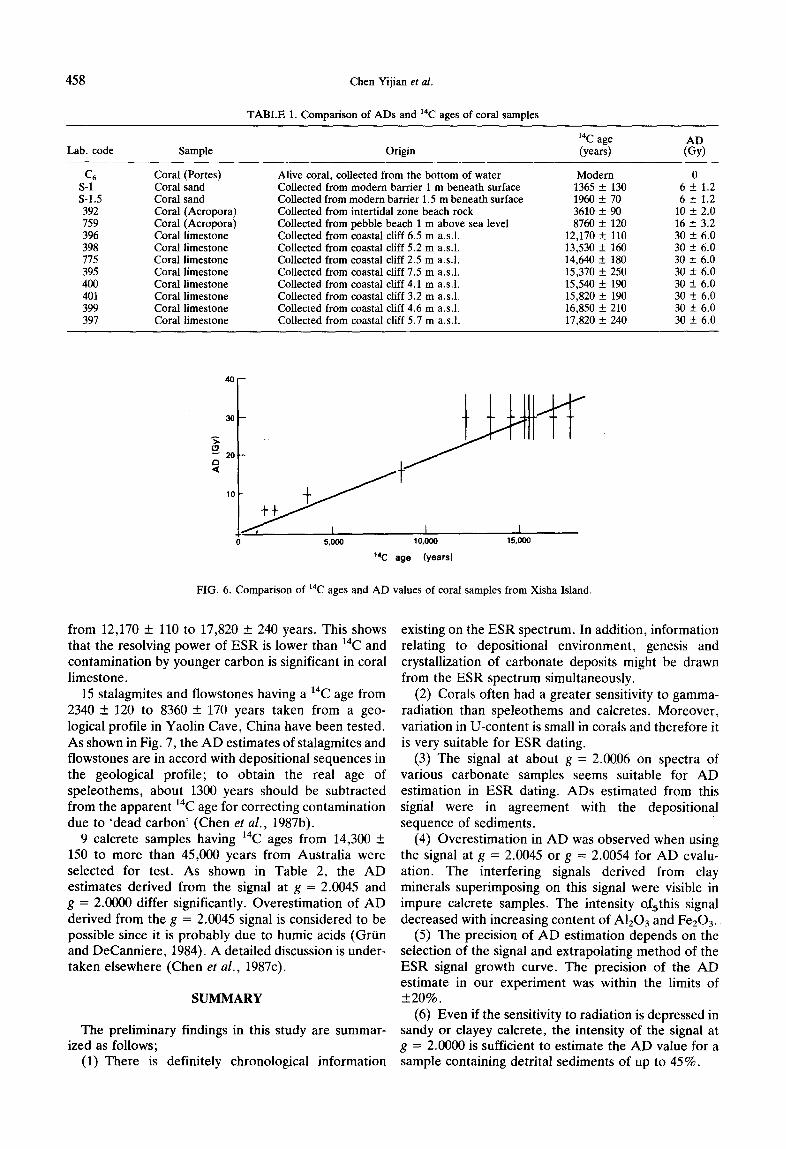
13 coral samples having 14C ages of 0 to 17,800 years collected from Xisha Islands, China were selected for test. The U-content in corals is rather stable with an average of 2.98 ppm (Chen et al., 1987a). As shown in Table 1 and Fig. 6, the ADs of coral samples essentially increase with 14C age. Since ~4C ages of coral limestone were inferred by recrystallization, uncertainties in 14C ages of coral limestone were assumed to be of several thousands of years (Chen and Jiao, 1983). A similar AD estimate was obtained in coral limestone of ~4C age
A
Nat. dose 0 Gy Irradi. dose A: 10Gy
B: 80Gy
82Gy 12(
Nat. dose 8 Gy Irradi. dose A: 5Gy
B: 100Gy
/ 110Gy 15
C Nat. dose 3 Gy Irradi.dose A: 10Gy
B: 50Gy
, . . . . t f . . . . . . . . 250 210 115 60 15
AD (Gy)
B
I I I I 50 100 150 200
B
A
I I I 100 200 300
iy
Dose (Gy)
FIG. 5. (A) For modem coral samples, the AD values derived from the additive dose method were in agreement with received dose from 6°Co source. (B) For flowstone samples, the AD values derived from the additive dose method were in agreement with received doses from natural and artificial radiation with a deviation of +20%. (C) For stalagmite, the AD values derived from the additive dose method were overestimated by using the received dose from natural and artificial radiation and
extrapolating the growth curve by the linear method, as shown by the dashed line.
458 Chen Yijian et al.
TABLE 1. Comparison of ADs and 14C ages of coral samples
14C age A D Lab. code Sample Origin (years) (Gy)
C 6 Coral (Portes) S-1 Coral sand S-1.5 Coral sand 392 Coral (Acropora) 759 Coral (Acropora) 396 Coral limestone 398 Coral limestone 775 Coral limestone 395 Coral limestone 400 Coral limestone 401 Coral limestone 399 Coral limestone 397 Coral limestone
Alive coral, collected from the bottom of water Modern 0 Collected from modern barrier 1 m beneath surface 1365 + 130 6 + 1.2 Collected from modern barrier 1.5 m beneath surface 1960 + 70 6 + 1.2 Collected from intertidal zone beach rock 3610 + 90 10 + 2.0 Collected from pebble beach 1 m above sea level 8760 + 120 16 + 3.2 Collected from coastal cliff 6.5 m a.s.l. 12,170 + 110 30 + 6.0 Collected from coastal cliff 5.2 m a.s.1. 13,530 + 160 30 + 6.0 Collected from coastal cliff 2.5 m a.s.l. 14,640 + 180 30 --+ 6.0 Collected from coastal cliff 7.5 m a.s.l. 15,370 + 250 30 + 6.0 Collected from coastal cliff 4.1 m a.s.l. 15,540 + 190 30 + 6.0 Collected from coastal cliff 3.2 m a.s.l. 15,820 + 190 30 + 6.0 Collected from coastal cliff 4.6 m a.s.l. 16,850 + 210 30 + 6.0 Collected from coastal cliff 5.7 m a.s.1. 17,820 + 240 30 + 6.0
40
30
o 20
Q
0 5,ooo 10,000 15,000
14C age (years)
FIG. 6. Comparison of 14C ages and AD values of coral samples from Xisha lsland.
from 12,170 + 110 to 17,820 + 240 years. This shows that the resolving power of ESR is lower than 14C and contamination by younger carbon is significant in coral limestone.
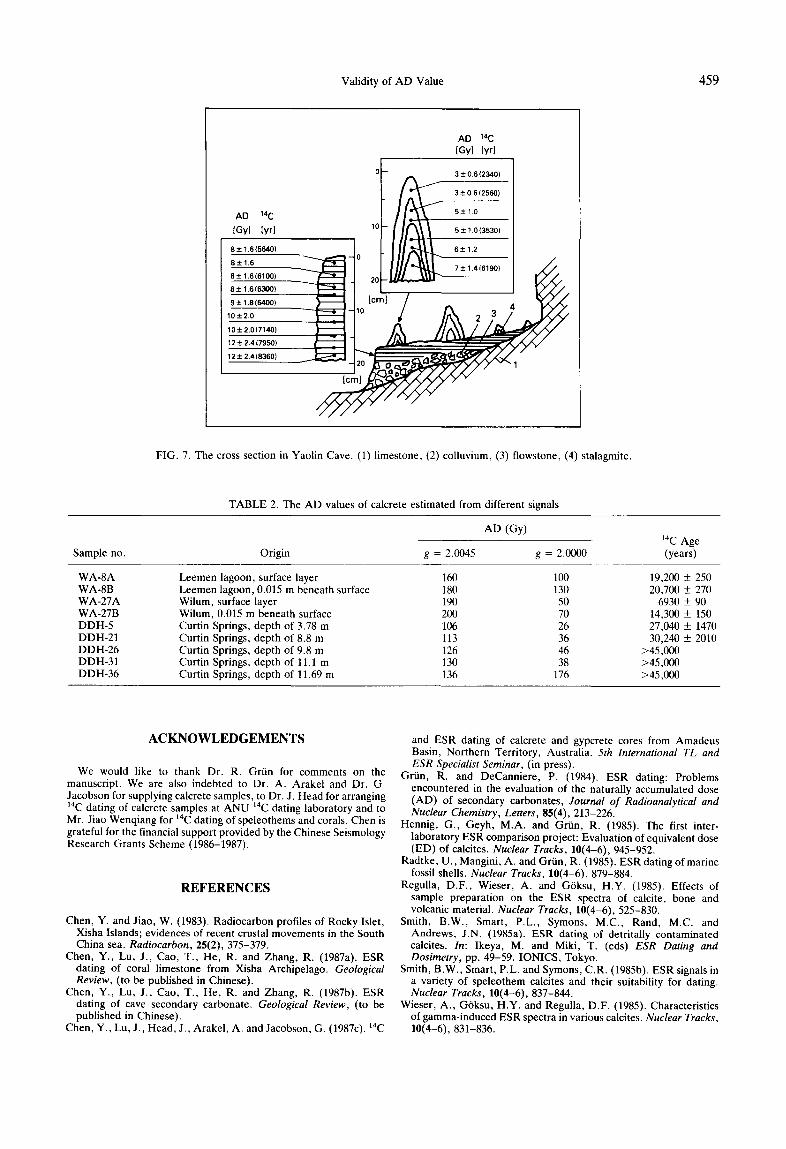
15 stalagmites and flowstones having a 14C age from 2340 + 120 to 8360 + 170 years taken from a geo- logical profile in Yaolin Cave, China have been tested. As shown in Fig. 7, the AD estimates of stalagmites and flowstones are in accord with depositional sequences in the geological profile; to obtain the real age of speleothems, about 1300 years should be subtracted from the apparent ~4C age for correcting contamination due to 'dead carbon' (Chen et al., 1987b).
9 calcrete samples having 14C ages from 14,300 + 150 to more than 45,000 years from Australia were selected for test. As shown in Table 2, the AD estimates derived from the signal at g = 2.0045 and g = 2.0000 differ significantly. Overestimation of AD derived from the g = 2.0045 signal is considered to be possible since it is probably due to humic acids (Grtin and DeCanniere, 1984). A detailed discussion is under- taken elsewhere (Chen et al., 1987c).
SUMMARY
The preliminary findings in this study are summar- ized as follows;
(1) There is definitely chronological information
existing on the ESR spectrum. In addition, information relating to depositional environment, genesis and crystallization of carbonate deposits might be drawn from the ESR spectrum simultaneously.
(2) Corals often had a greater sensitivity to gamma- radiation than speleothems and calcretes. Moreover, variation in U-content is small in corals and therefore it is very suitable for ESR dating.
(3) The signal at about g = 2.0006 on spectra of various carbonate samples seems suitable for AD estimation in ESR dating. ADs estimated from this signal were in agreement with the depositional sequence of sediments.
(4) Overestimation in AD was observed when using the signal at g = 2.0045 or g = 2.0054 for AD evalu- ation. The interfering signals derived from clay minerals superimposing on this signal Were visible in impure calcrete samples. The intensity o~this signal decreased with increasing content of A1203 and Fe203.,
(5) The precision of AD estimation depends on the selection of the signal and extrapolating method of the ESR signal growth curve. The precision of the AD estimate in our experiment was within the limits of +20%.
(6) Even if the sensitivity to radiation is depressed in sandy or clayey calcrete, the intensity of the signal at g = 2.0000 is sufficient to estimate the AD value for a sample containing detrital sediments of up to 45%.
Validity of AD Value 459
A D 14C [Gy] [yr]
A D 14C [Gy] [yr]
8 -+ 1.6 (5640)
8-+1.6
8_+1.6(6100) 8 + 1.6163OO)
9 -+ 1.8 (6400)
10-+2.0
10±2.0(7140)
12 _+ 2.4 (7950)
12 --- 2.4(8360)
0 3 ± 0.6 (2340)
3_+0.6(2560)
5_+1.0
10 5 _+ 1.0 (3530)
6_+1.2 ~ - o 7_+,,15,,o~ J / • 20 ~
FIG. 7. The cross section in Yaolin Cave. (1) limestone, (2) colluvium, (3) flowstone, (4) stalagmite.
TABLE 2. The AD values of calcrete estimated from different signals
Sample no. Origin g = 2.0045
AD (Gy) 14C Age
g = 2.0000 (years)
WA-8A WA-8B WA-27A WA-27B DDH-5 DDH-21 DDH-26 DDH-31 DDH-36
Leemen lagoon, surface layer Leemen lagoon, 0.015 m beneath surface Wilum, surface layer Wilum, 0.015 m beneath surface Curtin Springs, depth of 3.78 m Curtin Springs, depth of 8.8 m Curtin Springs, depth of 9.8 m Curtin Springs, depth of 11.1 m Curtin Springs, depth of 11.69 m
160 100 19,200 + 250 180 130 20,700 + 270 190 50 6930 + 90 200 70 14,300 + 150 106 26 27,040 + 1470 113 36 30,240 + 2010 126 46 >45,000 130 38 >45,000 136 176 >45,000
A C KNOWLEDGEMENTS
We would like to thank Dr. R. Griin for comments on the manuscript. We are also indebted to Dr. A. Arakel and Dr. G. Jacobson for supplying calcrete samples, to Dr. J. Head for arranging 14C dating of calcrete samples at ANU 14C dating laboratory and to Mr. Jiao Wenqiang for 14C dating of speleothems and corals. Chen is grateful for the financial support provided by the Chinese Seismology Research Grants Scheme (1986-1987).
REFERENCES
Chen, Y. and Jiao, W. (1983). Radiocarbon profiles of Rocky Islet, Xisha Islands; evidences of recent crustal movements in the South China sea. Radiocarbon, 25(2), 375-379.
Chen, Y., Lu, J., Cao, T., He, R. and Zhang, R. (1987a). ESR dating of coral limestone from Xisha Archipelago. Geological Review, (to be published in Chinese).
Chen, Y., Lu, J., Cao, T., He, R. and Zhang, R. (1987b). ESR dating of cave secondary carbonate. Geological Review, (to be published in Chinese).
Chen, Y., Lu, J., Head, J., Arakel, A. and Jacobson, G. (1987c). 14C
and ESR dating of calcrete and gypcrete cores from Amadeus Basin, Northern Territory, Australia. 5th International TL and ESR Specialist Seminar, (in press).
Grfin, R. and DeCanniere, P. (1984). ESR dating: Problems encountered in the evaluation of the naturally accumulated dose (AD) of secondary carbonates, Journal of Radioanalytieal and Nuclear Chemistry, Letters, 85(4), 213-226.
Hennig, G., Geyh, M.A. and Griin, R. (1985). The first inter- laboratory ESR comparison project: Evaluation of equivalent dose (ED) of calcites. Nuclear Track, 10(4-6), 945-952.
Radtke, U., Mangini, A. and Griin, R. (1985). ESR dating of marine fossil shells. Nuclear Tracks, 10(4-6), 879-884.
Regulla, D.F., Wieser, A. and G6ksu, H.Y. (1985). Effects of sample preparation on the ESR spectra of calcite, bone and volcanic material. Nuclear Tracks, 10(4-6), 525-830.
Smith, B.W., Smart, P.L., Symons, M.C., Rand, M.C. and Andrews, J.N. (1985a). ESR dating of detritally contaminated calcites. In: Ikeya, M. and Miki, T. (eds) ESR Dating and Dosimetry, pp. 49-59. IONICS, Tokyo.
Smith, B.W., Smart, P.L. and Symons, C.R. (1985b). ESR signals in a variety of speleothem calcites and their suitability for dating. Nuclear Tracks, 10(4-6), 837-844.
Wieser, A., GSksu, H.Y. and Regulla, D.F. (1985). Characteristics of gamma-induced ESR spectra in various calcites. Nuclear Tracks, 10(4-6), 831-836.


