Embed Size (px)
Citation preview
A COMPARATIVE ANALYSIS OF SHOPPING MALLS
IN PUTRAJAYA AND BUKIT INDAH, MALAYSIA
Akinropo Oluremi Akindele
Malaysia Sustainable Cities Program, Working Paper Series © Akinropo Oluremi Akindele & Massachusetts Institute of Technology 2016
1
A COMPARATIVE ANALYSIS OF SHOPPING
MALLS IN PUTRAJAYA AND BUKIT INDAH,
MALAYSIA
by Akinropo Oluremi Akindele Malaysia Sustainable Cities Program, Massachusetts Institute of Technology
Abstract The study investigates shopping characteristics in Putrajaya and
Bukit Indah, Malaysia. The physical, environmental, spatial, and land use characteristics of shopping malls—as well as shoppers’ satisfaction with those retail settings—were appraised. The ultimate goal was to provide policy options for sustainable shopping in Malaysia. It was observed that when compared to the Alamanda mall in Putrajaya, the Jusco mall in Bukit Indah performed better. The study suggests that multiple factors are important to promoting sustainable shopping in cities, and improving individual, local, regional, and national economies. These factors include an appropriate approach to land use, and sufficient attention to the kinds of design, appearance, and environmental factors that attract shoppers.
Introduction As a part of its effort to achieve “developed-country” status by
2020 (Islam and Ismail, 2010; Lee, 2014), and as part of the global sustainable development movement, Malaysia is positioning itself as one of the major international shopping arcade and business destinations (EYGM, 2012). This goal has motivated political leaders to spur retail trade, in part by encouraging the growth and patronage of shopping malls in several cities.
Sustainable development generally means using environmental resources in a way that allows other generations to continue to use and preserve them. Including the shopping mall under the umbrella of sustainable development is, clearly, a sensible focus for both policy makers and investors. Shopping in malls can be sustainable when the processes of siting, building, and operating are properly organized to promote city liveability and environmental performance. This is made possible by—among other initiatives—decreasing carbon emissions, encouraging socialization, and promoting continuous wealth generation.
Becoming a high-income and a developed country in a sustainable way is, of course, inseparable from economic development (Frenchman, 2011). The retail sector, when well organized and
A COMPARATIVE ANALYSIS OF SHOPPING MALLS
IN PUTRAJAYA AND BUKIT INDAH, MALAYSIA
Akinropo Oluremi Akindele
Malaysia Sustainable Cities Program, Working Paper Series © Akinropo Oluremi Akindele & Massachusetts Institute of Technology 2016
2
developed, is observed to contribute significantly to national and urban economic growth (Shay and Bright, 2014; Sudalaimuthu and Davi, 2014). Retail accounts for over US$15 trillion in global revenue, and is expected to maintain strong growth. Retail sustains approximately 142 million jobs in 82 countries, and accounts for a significant share of GDP in many countries, from 8 percent in the U.S. to 14 percent in India (Wam, 2012). Retail and wholesale trade is the third-largest economic sector in Germany, accounting for 9.4 percent of total gross value added.
In the U.S., retail comprises almost 3.8 million businesses, 29 million jobs, USD$822.5 billion in wages, and USD$1.2 trillion in GDP; or 12 percent, 16.1 percent, 8.4 percent and 7.4 percent respectively of the United States’ economy in 2012 (PWC, 2012). Most of the retail revenue was generated by the top global retailers, which have concentrated much of that volume in mall-based “mega stores.” In 2011 alone, currency-adjusted retail revenue of US $4.3 trillion was generated from retailing. This means that 40 percent of retail revenues were generated in malls.
Large malls are increasingly playing a pivotal role in retail development, and therefore contributing immensely to economic growth of cities and nations in terms of GDP. The Dubai Mall, for example, attracted 47 million visitors in 2010 and 54 million in 2011 (Wam, 2012). This exceeds the number of visitors to any single leisure destinations or theme park in the world, including New York City’s Times Square (39.2 million) and Central Park (38 million, and Niagara Falls on the U.S.-Canadian border (22.5 million) (Wam, 2012).
But while some countries have enjoyed economic growth coupled with the growth of mega retail centers, that correlation has not emerged in some other countries. For example: in Australia, increased sales revenues did not bring a corresponding increase in GDP, possibly due to exclusionary zoning laws and restrictions on direct foreign investments (Luce, 2013). More broadly, people have expressed a number of concerns about mega retailing centers. One is that they can negatively affect other smaller retail centers by dominating the sales in the region (Borgers et al, 2015); although this can be controlled through proper sitting and spacing. Another is that large retailing centers may contribute to the unsustainability of cities, both because of the traffic they generate and the high level of consumerism that they encourage (ILO, 2011). In recent years, in fact, many malls have closed down, even in developed countries (Annon, 2006). Policy makers now have to make certain choices between environmental impact and economic impacts of mega retail centers before they permit mall development (Civic Economic s, 2008).
This study focuses on two malls: one in Bukit Indah, and one in Putrajaya. While Bukit Indah has been growing in an organic way—in response to the complex interaction of social, economic, and demographic pressures—Putrajaya was planned from the beginning to serve as the national administrative headquarters. The district structure
A COMPARATIVE ANALYSIS OF SHOPPING MALLS
IN PUTRAJAYA AND BUKIT INDAH, MALAYSIA
Akinropo Oluremi Akindele
Malaysia Sustainable Cities Program, Working Paper Series © Akinropo Oluremi Akindele & Massachusetts Institute of Technology 2016
3
plan of Putrajaya and part of Sepang (1995) paid careful attention to key aspects of sustainable shopping, and to the project’s interactions with other components of the administrative city. The plan is based on the neighbourhood concept of proximity and accessibility (Section 3.2) (Malaysia, 1995). This study compares the shopping experience in these two cities’ malls—a comparison that may provide useful lessons in best practices for siting, designing, and land use planning to promote sustainable shopping.
Statement of the research problem One of the facilitators and responses to urbanization is vertical
growth (Badger, 2015; Sev et al, 2011). Such growth helps accommodate the large numbers of residents that flood cities around the world more or less on a daily basis. The result is a profusion of high-rise developments in many cities—to the extent that these skyscrapers are defining the essence of urban life (Westly, 2008). Perhaps not surprisingly, large high-rise buildings do not earn much support in the sustainable development discussion (Junnila et al, 2006; Heinnonen et al, 2011). Most treatises on sustainable development have criticized large buildings on the grounds that they encourage high-carbon emissions and contribute significantly to climate change (Van and Xu, 2012). However, if they are to accommodate continued population growth, space-constrained cities have few choices other than to grow vertically.
At the same time, cities are expected to support economic growth, which in turn implies the development of shopping centers. This, in turn, calls for a better understanding of the shopping experience. Mall shopping is in significant ways stimulated by the physical environment. Shopping malls are key place identity and image. Malls serve as public space, distill and display the “romance of the city” that attracts tourists, and assemble large numbers of people to build social capital and engage in leisure and recreation (Wam, 2012). Malls have served as a significant contributor to economic development in the developed world, serving a powerful platform for local, intra- and inter-regional, and international trade (PWC, 2012; Sudalaimuthu and Davi, 2014). Therefore, especially in the cities of the developed countries, shopping malls are quickly replacing other forms of shopping and commercial activities. For instance, in 2005, there were 48,685 malls in the US alone (Anon, 2007). Australia has 1,102 malls as of 2007 (Urbis JHD Property Limited, 2007), and in 2009, there were 819 malls in the United Kingdom (Anon, 2009). In most developed countries, the mall system of shopping is increasingly defining and sustaining city identity (Koolhaas, 2000).
But there is a countervailing trend, as well: malls have been observed to close at faster rate than they open (Mate, 2012). Out of the 2,000 largest malls in USA, 400 (20 percent) closed down between 2007 and 2009 (Anon, 2006, 2011); due to the global economic crisis
A COMPARATIVE ANALYSIS OF SHOPPING MALLS
IN PUTRAJAYA AND BUKIT INDAH, MALAYSIA
Akinropo Oluremi Akindele
Malaysia Sustainable Cities Program, Working Paper Series © Akinropo Oluremi Akindele & Massachusetts Institute of Technology 2016
4
(Misonzhnik, 2010; Gregory, 2009; Benfield, 2009). The contracting economy in that period affected shopping centers and malls around the world (Mate, 2012; Lebow, 1955; Bansal and Kilbourne, 2001; White, 2010; Zukin, 1998), even though some scholars argued that sustaining shopping centers was key to encouraging consumerism and combating the recession.
As the world moves towards the paradigm of sustainability, in which mass consumption is seen as one of the greatest challenges to a sustainable future, we need to ask ourselves: how should malls survive? When does shopping become sustainable? What are the best ways to site design and build malls in ways that attracts people, lift their spirits, and encourage them to socialize and engage in physical activity? What actually happens in malls?
By comparing the malls in Putrajaya and Bukit Indah, this paper will address those questions.
Sustainable shopping: an overview Through overuse, environmental sustainability has become
almost a “buzz phrase,” and has been interpreted in diverse, sometimes confusing ways (Lundqvist, 2007). This reflects both the complexity of the term and its applicability to a wide variety of fields. Most definitions of sustainable development, however, focus on the idea that development should meet the needs of the present without compromising the ability of the future generations to meet their own needs (WHO, 1999). Sustainability has been linked to a wide variety of factors, ranging from materials choices to technologies to energy use. Nevertheless, the literature is notably slim when it comes to the roles of commercial land uses in environmental sustainability. Only a few scholars have made even limited reference to the role of commercial shopping centers in environmental sustainability (Mate, 2012).
Nevertheless, there are at least two schools of thought that can be brought to bear on the subject of sustainable shopping. The first relates to energy use and greenhouse gases versus ecological development. McMorrow (2001) traced the origin of mall or internal shopping spaces to late 18th century France; where internal shopping spaces started as stores, growing to market places and bazaars, to arcades, department stores, supermarkets, and—today—shopping malls. He posited that malls and other internal shopping spaces were intended to attract shoppers who might otherwise be impacted by the challenges and limitations of urban life, and to shelter shoppers from any negative experiences. This view was supported by other scholars (Chung, 2001; Leung, 2001; Jayne, 2006), all of whom concluded—not necessarily approvingly—that malls are the temples of mass consumption.
Beardsley, (2010); Mate (2012); and Auspitz (2010), among others, also supported this school of thought. Their argument against the mall is made against the background of sustainability. According to
A COMPARATIVE ANALYSIS OF SHOPPING MALLS
IN PUTRAJAYA AND BUKIT INDAH, MALAYSIA
Akinropo Oluremi Akindele
Malaysia Sustainable Cities Program, Working Paper Series © Akinropo Oluremi Akindele & Massachusetts Institute of Technology 2016
5
this school of thought, the mall occupies a vast amount of land, and requires excessive energy from non-renewable, greenhouse gas-intensive sources to light the facility, maintain constant internal temperature, and preserve perishable items. Further, huge amounts of water need to be used, and by and large, the design of a mall does not support rainwater collection. Additionally, there is a need for transportation to malls. Vehicles contribute significantly to carbon emissions in cities and the carbon footprints of malls would be dramatically worse if the related private vehicles’ carbon emissions were factored into the malls’ carbon-production calculations. Finally, they point out, malls generate large volumes of waste, which have to be dealt with.
The second school of thought sees a mall as a strong component of economic development—one that is key to sustainable city development. In this view, malls are places where social capital is developed. Malls can be beautiful, even magnificent, and can therefore promote a sense of place, and foster local activities. According to Koolhaas (2000), shopping has become almost the only means by which we experience public activities, and malls therefore help defines and reinforce the identity of an institution or a city. A mall serves as a place of social interaction; where many city residents relax—and which may in fact be the third-most important place in peoples’ lives, after home and the workplace. Finally, the mall attracts tourists, thus promoting economy and creating trickle-down benefits to other commercial hospitality investments.
Malls as public spaces and their social capital
connotations The importance of community to human social, emotional, and
cognitive experiences can never be over-emphasized (Wandersman, 1985). Community creates the bond whereby people and place are moulded into a whole (Rivlin, 1987). Although the value of place and community seems clear, there has been much social commentary regarding the decreasing ability of people to connect with their communities and the people who live among them (Fleming and Von Tscharner, 1987; Lippard, 1997; Putnam, 2000: Stumpf, 1998). It therefore becomes important to understand the importance and the application of the concept of “social capital” to community cohesion in public spaces. Social capital has been defined as “the connections among individuals social networks and the norms of reciprocity and trustworthiness that arise from them” (Putnam, 2000; p. 19).
In the utopian sense, the scale of neighborhoods is supposed to encourage people in reasonable proximity to gather, and thereby to foster social interaction and friendliness. Neighborhoods, in other words, are gathering places that enhance the lives of people (Oldenburg, 1999). Oldenburg defined these gathering places as “third places”—neither home nor work, but resources that help get people
A COMPARATIVE ANALYSIS OF SHOPPING MALLS
IN PUTRAJAYA AND BUKIT INDAH, MALAYSIA
Akinropo Oluremi Akindele
Malaysia Sustainable Cities Program, Working Paper Series © Akinropo Oluremi Akindele & Massachusetts Institute of Technology 2016
6
through their day. Oldenburg describes the third place as “a generic designation for a great variety of public places that host the regular, voluntary, informal, and happily anticipated gatherings of individuals beyond the realms of home and work” (p. 16). Third places provide a context within which to connect with the people in communities, as well as a place to exchange ideas and news.
This description would seem to include malls. Oldenburg, however, expressed concern that many third places are disappearing, and that in the United States, the third place has become a “distant third.” He posits that this leads to the shrinking of social capital, which threatens our civic and personal health.
Study areas The areas chosen for the study are the Malaysian cities of Bukit
Indah and Putrajaya. Both are located on the eastern end of Peninsular Malaysia. The former is in the state of Johor, within the region of Iskanda Malaysia. The latter is located near the federal capital of Malaysia.
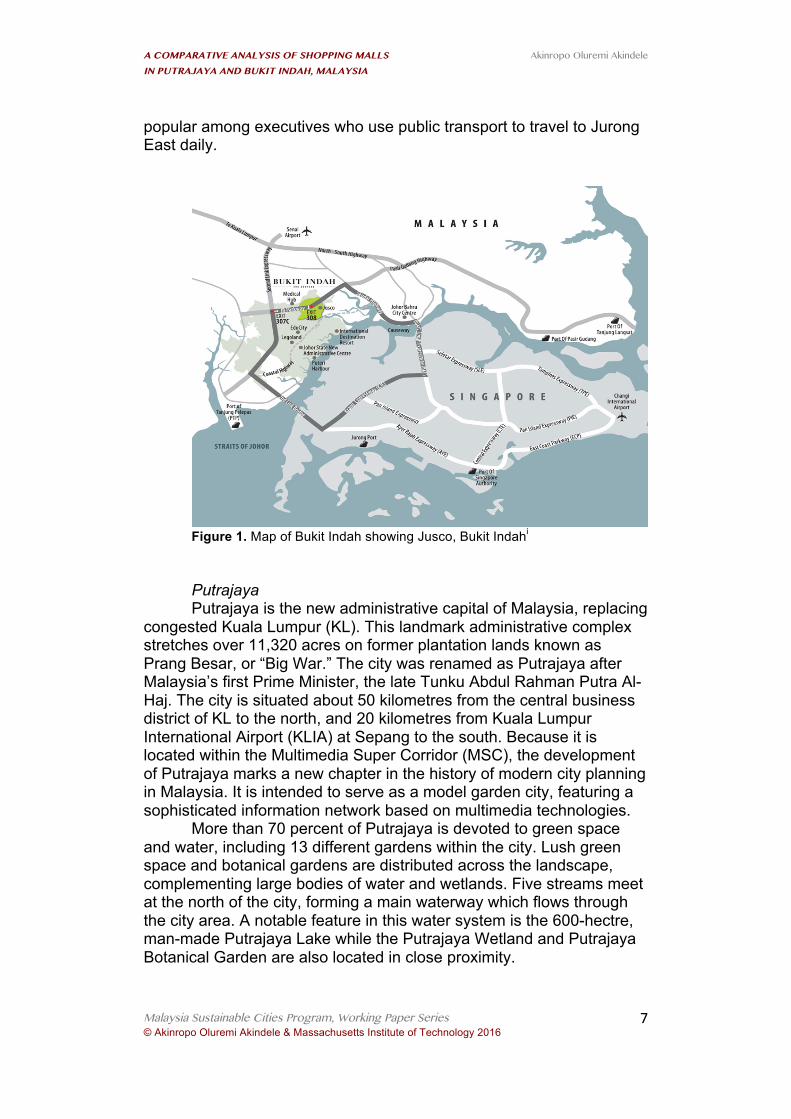
Bukit Indah Bukit Indah is located in the heart of Nusajaya, Iskandar
Malaysia, Johor. The city was founded in 1997. Today, its population exceeds 60,000, with more than 10,000 houses. There is an AEON/Jusco store, Tesco and Giant hypermarkets, and many other commercial outlets. As a result, Bukit Indah is acquiring a reputation as the center of the western Johor (Nusajaya) commercial district. It is reasonably close to the Woodland checkpoint and the Skudai and Johor Bahru highways. The township attracts visitors from Singapore, as well as from neighbouring townships such as Taman Sutera, Tampoi Utama, Nusa Bestari, and Tmn Perling.
Bukit Indah Bukit is the only prime commercial and residential district in western Johor, and it is fast developing. It consists of 20 retail lots and 120 office units, which collectively house a healthy mix of light industries, such as fashion designing Indah Walk 1, described below), restaurants with food from various cultures (Indah Walk 2), and the lifestyle office and education avenue (Indah walk 3);. Hotel such—as the Granada Hotel—surround the commercial hub, catering to tourists and travellers, including international visitors. There is also a heavy presence of residential units in close proximity to the commercial areas, including the Sky Executive Suites and Sky Loft condominiums.
The Indah Walk 1 consists of 39 shops that are directly across from the main entrance to the AEON Jusco Bukit Indah. Indah Walk 2 consists of 43 shops next to Tesco. The Indah Walk retail shop offices located in three-storey clustered buildings offer a range of fine dining, professional services, and recreational facilities. The planned Sky Loft and Sky Executive Suites (25 to 30+ storeys) will tower over the neighborhoods. These iconic high rise Serviced Apartments, are highly
A COMPARATIVE ANALYSIS OF SHOPPING MALLS
IN PUTRAJAYA AND BUKIT INDAH, MALAYSIA
Akinropo Oluremi Akindele
Malaysia Sustainable Cities Program, Working Paper Series © Akinropo Oluremi Akindele & Massachusetts Institute of Technology 2016
7
popular among executives who use public transport to travel to Jurong East daily.
Figure 1. Map of Bukit Indah showing Jusco, Bukit Indahi
Putrajaya Putrajaya is the new administrative capital of Malaysia, replacing
congested Kuala Lumpur (KL). This landmark administrative complex stretches over 11,320 acres on former plantation lands known as Prang Besar, or “Big War.” The city was renamed as Putrajaya after Malaysia’s first Prime Minister, the late Tunku Abdul Rahman Putra Al-Haj. The city is situated about 50 kilometres from the central business district of KL to the north, and 20 kilometres from Kuala Lumpur International Airport (KLIA) at Sepang to the south. Because it is located within the Multimedia Super Corridor (MSC), the development of Putrajaya marks a new chapter in the history of modern city planning in Malaysia. It is intended to serve as a model garden city, featuring a sophisticated information network based on multimedia technologies.
More than 70 percent of Putrajaya is devoted to green space and water, including 13 different gardens within the city. Lush green space and botanical gardens are distributed across the landscape, complementing large bodies of water and wetlands. Five streams meet at the north of the city, forming a main waterway which flows through the city area. A notable feature in this water system is the 600-hectre, man-made Putrajaya Lake while the Putrajaya Wetland and Putrajaya Botanical Garden are also located in close proximity.
A COMPARATIVE ANALYSIS OF SHOPPING MALLS
IN PUTRAJAYA AND BUKIT INDAH, MALAYSIA
Akinropo Oluremi Akindele
Malaysia Sustainable Cities Program, Working Paper Series © Akinropo Oluremi Akindele & Massachusetts Institute of Technology 2016
8
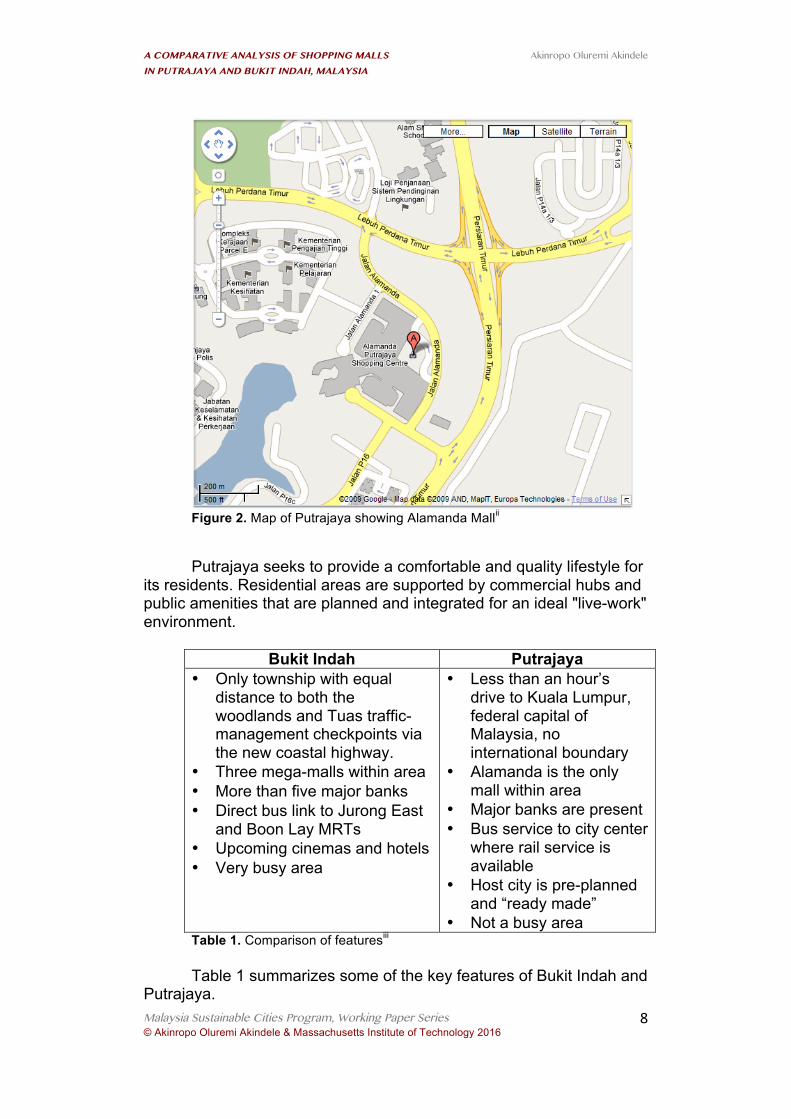
Figure 2. Map of Putrajaya showing Alamanda Mallii
Putrajaya seeks to provide a comfortable and quality lifestyle for its residents. Residential areas are supported by commercial hubs and public amenities that are planned and integrated for an ideal "live-work" environment.
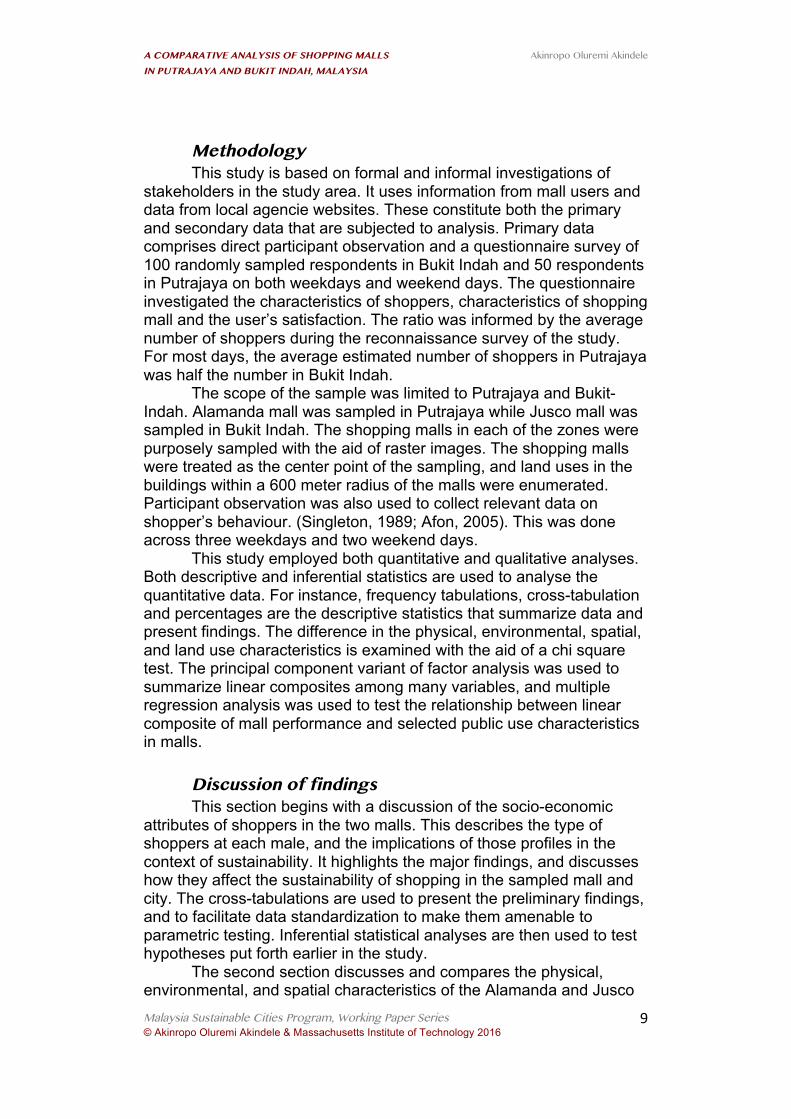
Bukit Indah Putrajaya
• Only township with equal distance to both the woodlands and Tuas traffic-management checkpoints via the new coastal highway.
• Three mega-malls within area • More than five major banks • Direct bus link to Jurong East
and Boon Lay MRTs • Upcoming cinemas and hotels • Very busy area
• Less than an hour’s drive to Kuala Lumpur, federal capital of Malaysia, no international boundary
• Alamanda is the only mall within area
• Major banks are present • Bus service to city center
where rail service is available
• Host city is pre-planned and “ready made”
• Not a busy area Table 1. Comparison of featuresiii Table 1 summarizes some of the key features of Bukit Indah and
Putrajaya.
A COMPARATIVE ANALYSIS OF SHOPPING MALLS
IN PUTRAJAYA AND BUKIT INDAH, MALAYSIA
Akinropo Oluremi Akindele
Malaysia Sustainable Cities Program, Working Paper Series © Akinropo Oluremi Akindele & Massachusetts Institute of Technology 2016
9
Methodology This study is based on formal and informal investigations of
stakeholders in the study area. It uses information from mall users and data from local agencie websites. These constitute both the primary and secondary data that are subjected to analysis. Primary data comprises direct participant observation and a questionnaire survey of 100 randomly sampled respondents in Bukit Indah and 50 respondents in Putrajaya on both weekdays and weekend days. The questionnaire investigated the characteristics of shoppers, characteristics of shopping mall and the user’s satisfaction. The ratio was informed by the average number of shoppers during the reconnaissance survey of the study. For most days, the average estimated number of shoppers in Putrajaya was half the number in Bukit Indah.
The scope of the sample was limited to Putrajaya and Bukit-Indah. Alamanda mall was sampled in Putrajaya while Jusco mall was sampled in Bukit Indah. The shopping malls in each of the zones were purposely sampled with the aid of raster images. The shopping malls were treated as the center point of the sampling, and land uses in the buildings within a 600 meter radius of the malls were enumerated. Participant observation was also used to collect relevant data on shopper’s behaviour. (Singleton, 1989; Afon, 2005). This was done across three weekdays and two weekend days.
This study employed both quantitative and qualitative analyses. Both descriptive and inferential statistics are used to analyse the quantitative data. For instance, frequency tabulations, cross-tabulation and percentages are the descriptive statistics that summarize data and present findings. The difference in the physical, environmental, spatial, and land use characteristics is examined with the aid of a chi square test. The principal component variant of factor analysis was used to summarize linear composites among many variables, and multiple regression analysis was used to test the relationship between linear composite of mall performance and selected public use characteristics in malls.
Discussion of findings This section begins with a discussion of the socio-economic
attributes of shoppers in the two malls. This describes the type of shoppers at each male, and the implications of those profiles in the context of sustainability. It highlights the major findings, and discusses how they affect the sustainability of shopping in the sampled mall and city. The cross-tabulations are used to present the preliminary findings, and to facilitate data standardization to make them amenable to parametric testing. Inferential statistical analyses are then used to test hypotheses put forth earlier in the study.
The second section discusses and compares the physical, environmental, and spatial characteristics of the Alamanda and Jusco
A COMPARATIVE ANALYSIS OF SHOPPING MALLS
IN PUTRAJAYA AND BUKIT INDAH, MALAYSIA
Akinropo Oluremi Akindele
Malaysia Sustainable Cities Program, Working Paper Series © Akinropo Oluremi Akindele & Massachusetts Institute of Technology 2016
10
malls. The third section compares the land-use characteristics at both places, again drawing inferences for the sustainability of shopping. The fourth and final section compares the shoppers’ satisfaction in the malls, and the relevance of imageability to shopping sustainability.
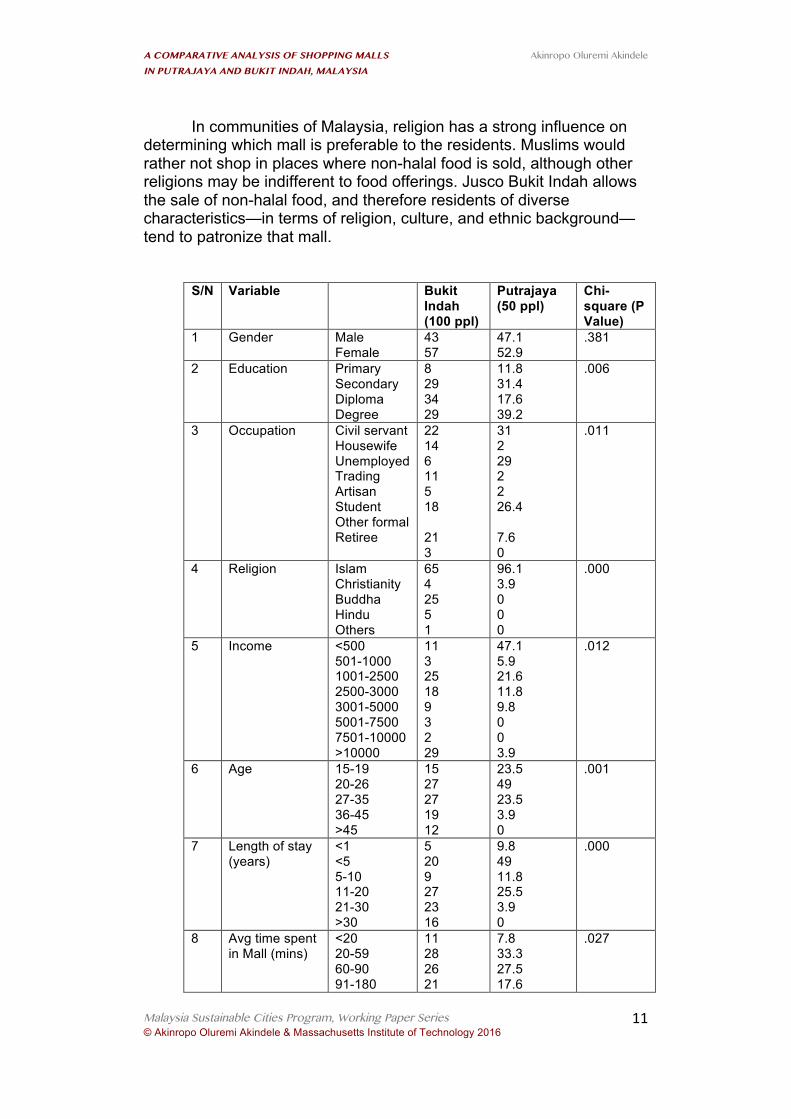
Socioeconomic characteristics of respondents This section describes the shoppers’ characteristics based on
their socio-economic status as revealed by the survey (see Table 2). Not surprisingly, more women than men were observed shopping. Relatively more women were recorded in Jusco Bukit Indah compared than at the Alamanda mall, although the difference in gender of shoppers comparing the malls is not statistically significant at 95 percent confidence level; with probability value of .381. This would have implications for activities in the mall that might be beneficial to women or otherwise attract them. There was a fair representation of all categories of education level sampled from both malls, and the difference in educational category when both malls are compared is significant at 95 percent confidence level. Respondents with at least a university degree are relatively more common in the Alamanda shopping mall, where 39.2 percent have at least a university degree. This perhaps is because many residents of Putrajaya are bureaucrats. This suggests that more of such population in terms of percentage (although not absolute numbers) shop in Alamanda.
Most of the other respondents are probably students, as their last obtained certificate was secondary school (31.4 percent). In terms of percentage, Bukit Indah seems to have shoppers with a diploma certificate followed by respondents with at least a University degree (29 percent). This may be explained through the homogenous and heterogeneous dichotomy of the two environments. “Homogenous” in this study is means a category of residents who are similar in terms of key socio-economic elements, such as occupation, income, and religion. “Heterogeneous” implies is more diverse mix of socio-economic backgrounds.
Not surprisingly, many residents of Putrajaja—the administrative capital of the country—are government workers. Again, this explains why there are more civil servants in Putrajaya (31 percent) as compared to Bukit Indah (22 percent). There is a higher incidence of students (26.4 percent) and unemployed (29 percent) among respondents from Putrajaya, and this is reflected in the age distribution of the respondents. Teenagers (23.5 percent) combined with young people below twenty-seven (49 percent) formed the bulk of sample in Putrajaya. This contrasts with 15 percent teenagers and 27 percent 20- to 26-year-olds in Bukit Indah. This means a lot for the economic and consuming power of shoppers, and bodes well for the sustainability of the mall. For instance, there is a high incidence of respondents with the lowest income in Putrajaya (47.1 percent) compared to Bukit Indah (11 percent); meanwhile, there are more respondents earning beyond ten thousand ringits in Bukit Indah, compared to Putrajaya.
A COMPARATIVE ANALYSIS OF SHOPPING MALLS
IN PUTRAJAYA AND BUKIT INDAH, MALAYSIA
Akinropo Oluremi Akindele
Malaysia Sustainable Cities Program, Working Paper Series © Akinropo Oluremi Akindele & Massachusetts Institute of Technology 2016
11
In communities of Malaysia, religion has a strong influence on determining which mall is preferable to the residents. Muslims would rather not shop in places where non-halal food is sold, although other religions may be indifferent to food offerings. Jusco Bukit Indah allows the sale of non-halal food, and therefore residents of diverse characteristics—in terms of religion, culture, and ethnic background—tend to patronize that mall.
S/N Variable Bukit
Indah (100 ppl)
Putrajaya (50 ppl)
Chi-square (P Value)
1 Gender Male Female
43 57
47.1 52.9
.381
2 Education Primary Secondary Diploma Degree
8 29 34 29
11.8 31.4 17.6 39.2
.006
3 Occupation Civil servant Housewife Unemployed Trading Artisan Student Other formal Retiree
22 14 6 11 5 18 21 3
31 2 29 2 2 26.4 7.6 0
.011
4 Religion Islam Christianity Buddha Hindu Others
65 4 25 5 1
96.1 3.9 0 0 0
.000
5 Income <500 501-1000 1001-2500 2500-3000 3001-5000 5001-7500 7501-10000 >10000
11 3 25 18 9 3 2 29
47.1 5.9 21.6 11.8 9.8 0 0 3.9
.012
6 Age 15-19 20-26 27-35 36-45 >45
15 27 27 19 12
23.5 49 23.5 3.9 0
.001
7 Length of stay (years)
<1 <5 5-10 11-20 21-30 >30
5 20 9 27 23 16
9.8 49 11.8 25.5 3.9 0
.000
8 Avg time spent in Mall (mins)
<20 20-59 60-90 91-180
11 28 26 21
7.8 33.3 27.5 17.6
.027
A COMPARATIVE ANALYSIS OF SHOPPING MALLS
IN PUTRAJAYA AND BUKIT INDAH, MALAYSIA
Akinropo Oluremi Akindele
Malaysia Sustainable Cities Program, Working Paper Series © Akinropo Oluremi Akindele & Massachusetts Institute of Technology 2016
12
181-300 >300
11 3
0 13.7
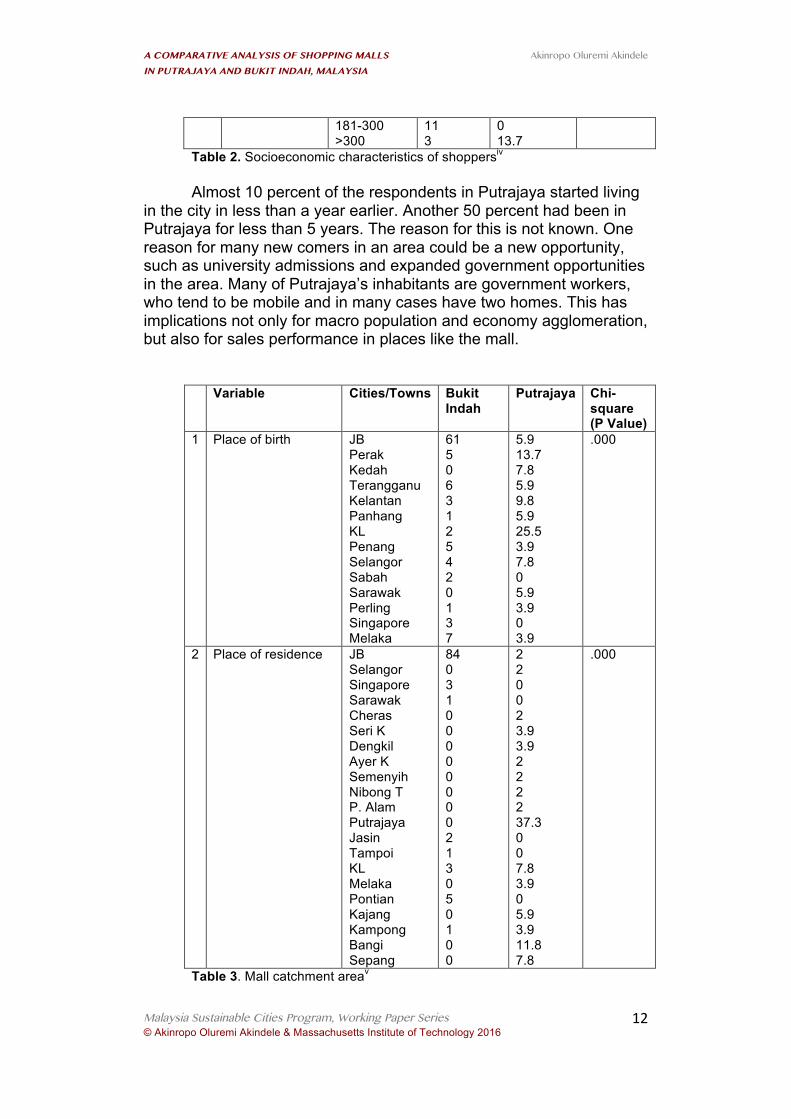
Table 2. Socioeconomic characteristics of shoppersiv Almost 10 percent of the respondents in Putrajaya started living
in the city in less than a year earlier. Another 50 percent had been in Putrajaya for less than 5 years. The reason for this is not known. One reason for many new comers in an area could be a new opportunity, such as university admissions and expanded government opportunities in the area. Many of Putrajaya’s inhabitants are government workers, who tend to be mobile and in many cases have two homes. This has implications not only for macro population and economy agglomeration, but also for sales performance in places like the mall.
Variable Cities/Towns Bukit Indah
Putrajaya Chi-square (P Value)
1 Place of birth JB Perak Kedah Terangganu Kelantan Panhang KL Penang Selangor Sabah Sarawak Perling Singapore Melaka
61 5 0 6 3 1 2 5 4 2 0 1 3 7
5.9 13.7 7.8 5.9 9.8 5.9 25.5 3.9 7.8 0 5.9 3.9 0 3.9
.000
2 Place of residence JB Selangor Singapore Sarawak Cheras Seri K Dengkil Ayer K Semenyih Nibong T P. Alam Putrajaya Jasin Tampoi KL Melaka Pontian Kajang Kampong Bangi Sepang
84 0 3 1 0 0 0 0 0 0 0 0 2 1 3 0 5 0 1 0 0
2 2 0 0 2 3.9 3.9 2 2 2 2 37.3 0 0 7.8 3.9 0 5.9 3.9 11.8 7.8
.000
Table 3. Mall catchment areav
A COMPARATIVE ANALYSIS OF SHOPPING MALLS
IN PUTRAJAYA AND BUKIT INDAH, MALAYSIA
Akinropo Oluremi Akindele
Malaysia Sustainable Cities Program, Working Paper Series © Akinropo Oluremi Akindele & Massachusetts Institute of Technology 2016
13
There are important lessons to be learned from the mall catchment area—that is, the geographic area from which the mall draws shoppers—as summarized in Table 3. In particular, it suggests the magnetic ability of a single mall to gather people. For Malaysia, this has major implications for intra, inter-regional, and international trade. The relative positioning of the mall at an internationally attractive position with good transportation links can mean a lot for the success of mall development.
Intuitively, residents of the greater city where the mall is located visit the mall most. Samples from Bukit Indah account for 84 percent of Johor Bahru residents; 3 percent come from Singapore, and the rest come mainly from seven other Malaysian states, including Sarawak, Jasin, Tampoi, Kualar Lumpur, Pontian and Kampong. While there is an opportunity for international trade, the concentration of local resident shoppers is high. On the other hand, at the Alamanda mall of Putrajaya, local resident shoppers account for a quarter (25.5 percent) of all shoppers, and the distribution of shoppers across all states—except for Sarawak, Jasin, Tampoi, and Pontian—is better. At Alamanda, international trade is almost invisible.
To summarize: when there is opportunity to access a wide range of goods and participate in many appealing activities, people are attracted regardless of distance.
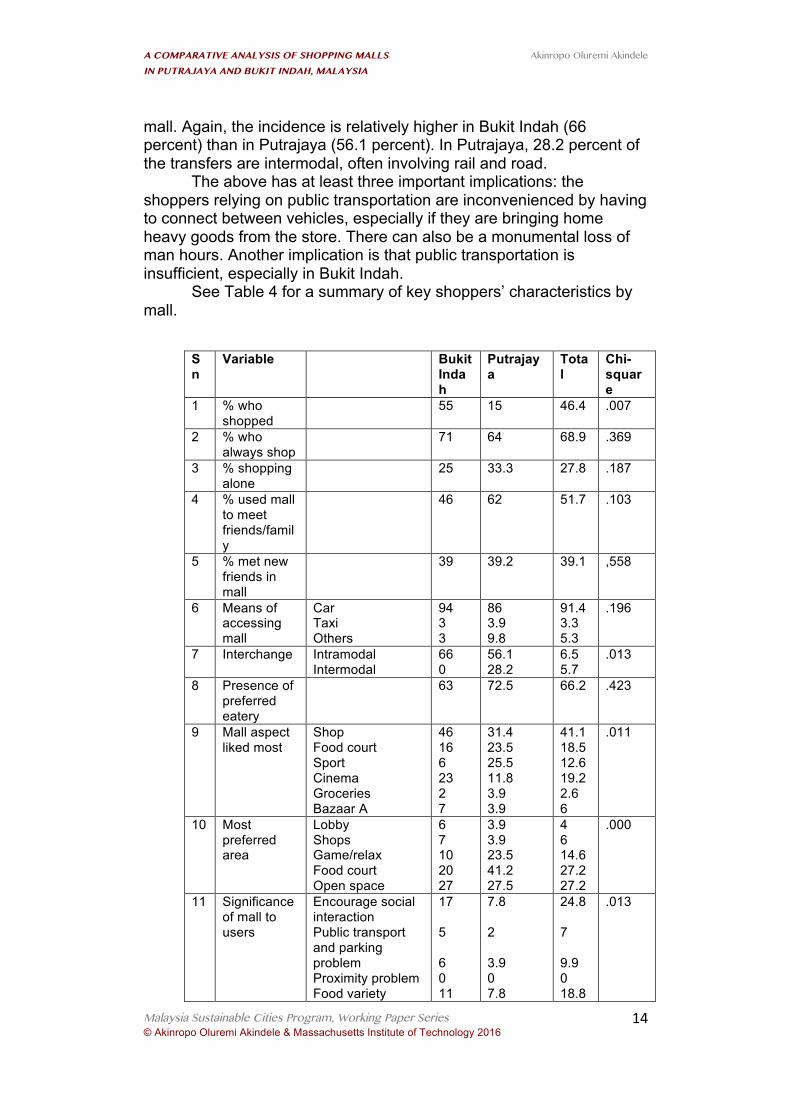
Shopping in the mall Estimates from the survey revealed that many people visit the
mall for reasons other than shopping. In the entire study, while 68.9 percent (71 percent in Jusco Bukit Indah and 64 percent in Alamanda) add shopping to their activities in the mall; only 46.4 percent of people in the mall reported that they visited it solely for the purpose of shopping. There are relatively more of this category of people in Jusco Bukit Indah (55 percent of total shoppers in Bukit Indah) compared to (15 percent) in Alamanda mall, Putrajaya.vi It is not surprising, therefore, that malls are perceived as platforms to meet friends and families. Among the mall users, 51.7 percent agreed with this statement. Some 39.1 percent of the mall users even met new friends. This factor strongly paints malls as a highly effective public and social meeting place.
Mall patronage involved a very high incidence (91.4 percent) of private car use. The incidence was relatively higher in Jusco Bukit Indah (94 percent) compared to 86 percent in Alamanda, Putrajaya. This has both positive and negative connotations. On the positive side, malls result in high social capital formation in that it gathers many people. Both the malls have a very high incidence of visitors. On the other hand, the amount of fuel used by these private cars on their relatively long journey will certainly contribute to high carbon emission and environmental unsustainability.
Many of the shoppers who use public transportation (56.5 percent) have to transfer at least once between their homes and the
A COMPARATIVE ANALYSIS OF SHOPPING MALLS
IN PUTRAJAYA AND BUKIT INDAH, MALAYSIA
Akinropo Oluremi Akindele
Malaysia Sustainable Cities Program, Working Paper Series © Akinropo Oluremi Akindele & Massachusetts Institute of Technology 2016
14
mall. Again, the incidence is relatively higher in Bukit Indah (66 percent) than in Putrajaya (56.1 percent). In Putrajaya, 28.2 percent of the transfers are intermodal, often involving rail and road.
The above has at least three important implications: the shoppers relying on public transportation are inconvenienced by having to connect between vehicles, especially if they are bringing home heavy goods from the store. There can also be a monumental loss of man hours. Another implication is that public transportation is insufficient, especially in Bukit Indah.
See Table 4 for a summary of key shoppers’ characteristics by mall.
Sn
Variable Bukit Indah
Putrajaya
Total
Chi-square
1 % who shopped
55 15 46.4 .007
2 % who always shop
71 64 68.9 .369
3 % shopping alone
25 33.3 27.8 .187
4 % used mall to meet friends/family
46 62 51.7 .103
5 % met new friends in mall
39 39.2 39.1 ,558
6 Means of accessing mall
Car Taxi Others
94 3 3
86 3.9 9.8
91.4 3.3 5.3
.196
7 Interchange Intramodal Intermodal
66 0
56.1 28.2
6.5 5.7
.013
8 Presence of preferred eatery
63 72.5 66.2 .423
9 Mall aspect liked most
Shop Food court Sport Cinema Groceries Bazaar A
46 16 6 23 2 7
31.4 23.5 25.5 11.8 3.9 3.9
41.1 18.5 12.6 19.2 2.6 6
.011
10 Most preferred area
Lobby Shops Game/relax Food court Open space
6 7 10 20 27
3.9 3.9 23.5 41.2 27.5
4 6 14.6 27.2 27.2
.000
11 Significance of mall to users
Encourage social interaction Public transport and parking problem Proximity problem Food variety
17 5 6 0 11
7.8 2 3.9 0 7.8
24.8 7 9.9 0 18.8
.013
A COMPARATIVE ANALYSIS OF SHOPPING MALLS
IN PUTRAJAYA AND BUKIT INDAH, MALAYSIA
Akinropo Oluremi Akindele
Malaysia Sustainable Cities Program, Working Paper Series © Akinropo Oluremi Akindele & Massachusetts Institute of Technology 2016
15
Organized shopping Multipurpose characteristics Child care Pleasure/relaxation Noise compatibility Noise during events Escalator far apart
18 21 18 2 1 1
25.5 5.9 39.2 3.9 0 0
43.5 26.9 57.2 5.2 1 1
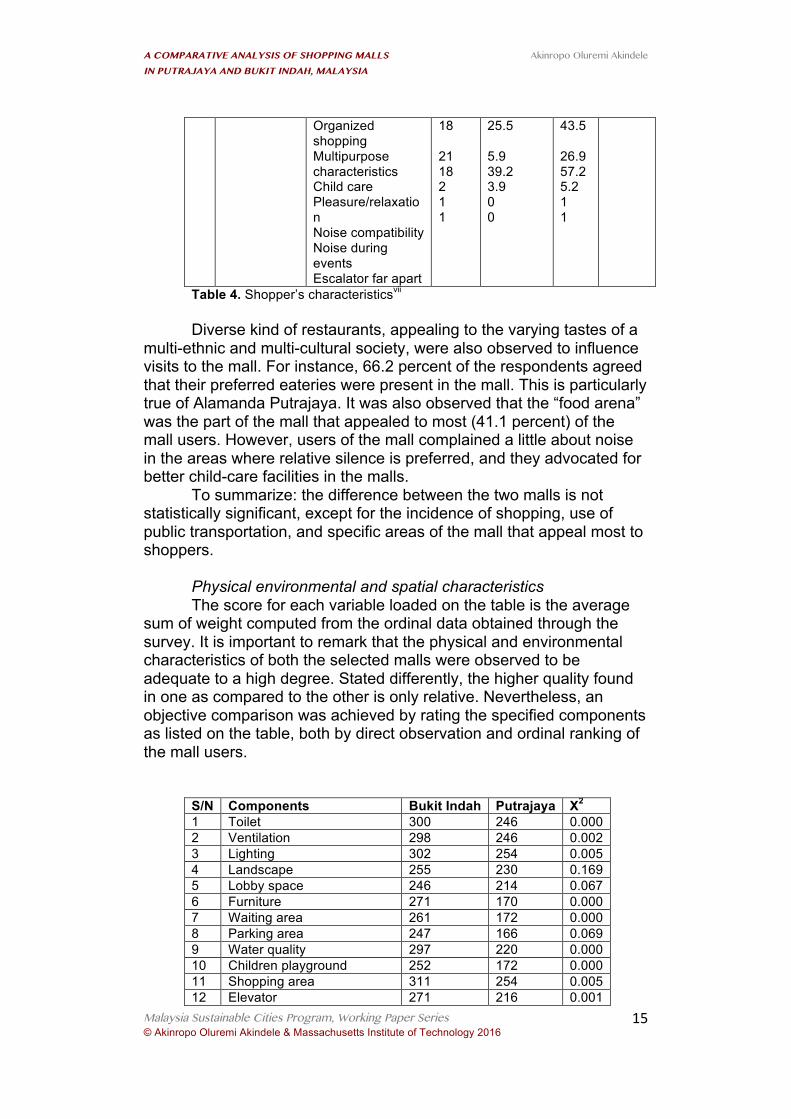
Table 4. Shopper’s characteristicsvii Diverse kind of restaurants, appealing to the varying tastes of a
multi-ethnic and multi-cultural society, were also observed to influence visits to the mall. For instance, 66.2 percent of the respondents agreed that their preferred eateries were present in the mall. This is particularly true of Alamanda Putrajaya. It was also observed that the “food arena” was the part of the mall that appealed to most (41.1 percent) of the mall users. However, users of the mall complained a little about noise in the areas where relative silence is preferred, and they advocated for better child-care facilities in the malls.
To summarize: the difference between the two malls is not statistically significant, except for the incidence of shopping, use of public transportation, and specific areas of the mall that appeal most to shoppers.
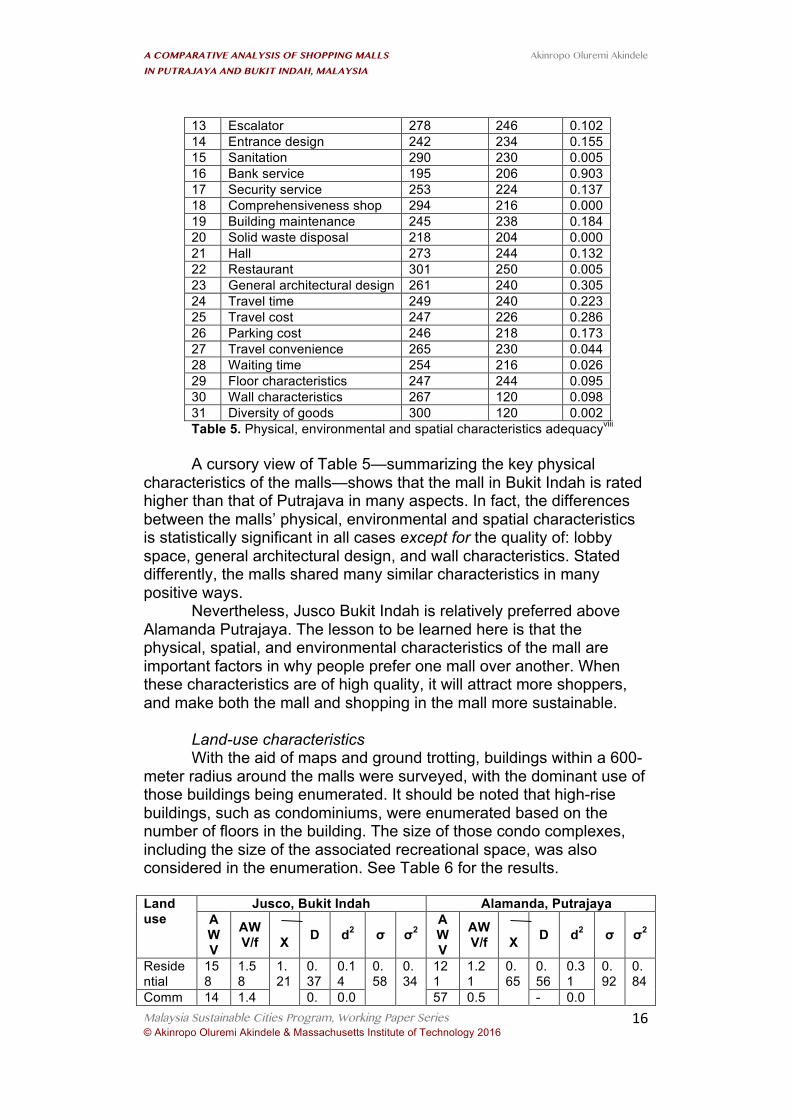
Physical environmental and spatial characteristics The score for each variable loaded on the table is the average
sum of weight computed from the ordinal data obtained through the survey. It is important to remark that the physical and environmental characteristics of both the selected malls were observed to be adequate to a high degree. Stated differently, the higher quality found in one as compared to the other is only relative. Nevertheless, an objective comparison was achieved by rating the specified components as listed on the table, both by direct observation and ordinal ranking of the mall users.
S/N Components Bukit Indah Putrajaya X2 1 Toilet 300 246 0.000 2 Ventilation 298 246 0.002 3 Lighting 302 254 0.005 4 Landscape 255 230 0.169 5 Lobby space 246 214 0.067 6 Furniture 271 170 0.000 7 Waiting area 261 172 0.000 8 Parking area 247 166 0.069 9 Water quality 297 220 0.000 10 Children playground 252 172 0.000 11 Shopping area 311 254 0.005 12 Elevator 271 216 0.001
A COMPARATIVE ANALYSIS OF SHOPPING MALLS
IN PUTRAJAYA AND BUKIT INDAH, MALAYSIA
Akinropo Oluremi Akindele
Malaysia Sustainable Cities Program, Working Paper Series © Akinropo Oluremi Akindele & Massachusetts Institute of Technology 2016
16
13 Escalator 278 246 0.102 14 Entrance design 242 234 0.155 15 Sanitation 290 230 0.005 16 Bank service 195 206 0.903 17 Security service 253 224 0.137 18 Comprehensiveness shop 294 216 0.000 19 Building maintenance 245 238 0.184 20 Solid waste disposal 218 204 0.000 21 Hall 273 244 0.132 22 Restaurant 301 250 0.005 23 General architectural design 261 240 0.305 24 Travel time 249 240 0.223 25 Travel cost 247 226 0.286 26 Parking cost 246 218 0.173 27 Travel convenience 265 230 0.044 28 Waiting time 254 216 0.026 29 Floor characteristics 247 244 0.095 30 Wall characteristics 267 120 0.098 31 Diversity of goods 300 120 0.002 Table 5. Physical, environmental and spatial characteristics adequacyviii A cursory view of Table 5—summarizing the key physical
characteristics of the malls—shows that the mall in Bukit Indah is rated higher than that of Putrajava in many aspects. In fact, the differences between the malls’ physical, environmental and spatial characteristics is statistically significant in all cases except for the quality of: lobby space, general architectural design, and wall characteristics. Stated differently, the malls shared many similar characteristics in many positive ways.
Nevertheless, Jusco Bukit Indah is relatively preferred above Alamanda Putrajaya. The lesson to be learned here is that the physical, spatial, and environmental characteristics of the mall are important factors in why people prefer one mall over another. When these characteristics are of high quality, it will attract more shoppers, and make both the mall and shopping in the mall more sustainable.
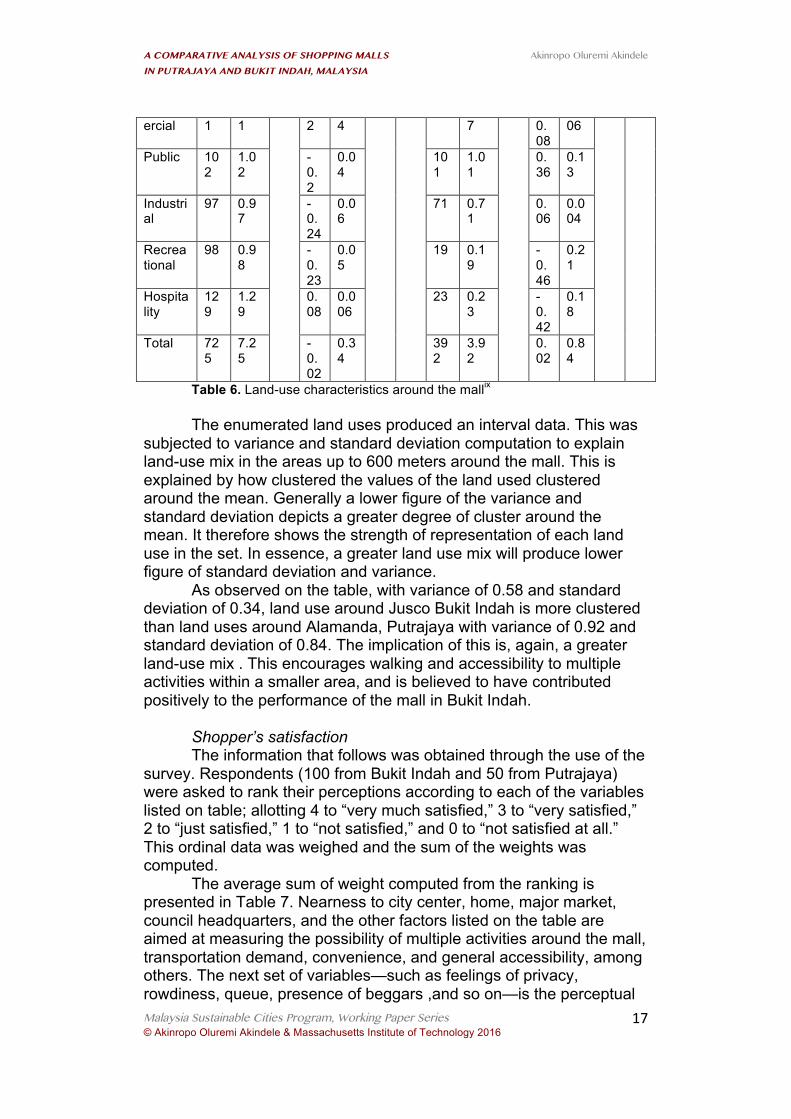
Land-use characteristics With the aid of maps and ground trotting, buildings within a 600-
meter radius around the malls were surveyed, with the dominant use of those buildings being enumerated. It should be noted that high-rise buildings, such as condominiums, were enumerated based on the number of floors in the building. The size of those condo complexes, including the size of the associated recreational space, was also considered in the enumeration. See Table 6 for the results. Land use
Jusco, Bukit Indah Alamanda, Putrajaya AWV
AWV/f
XX D d2 σ σ2
AWV
AWV/f
XX D d2 σ σ2
Residential
158
1.58
1.21
0.37
0.14
0.58
0.34
121
1.21
0.65
0.56
0.31
0.92
0.84
Comm 14 1.4 0. 0.0 57 0.5 - 0.0
A COMPARATIVE ANALYSIS OF SHOPPING MALLS
IN PUTRAJAYA AND BUKIT INDAH, MALAYSIA
Akinropo Oluremi Akindele
Malaysia Sustainable Cities Program, Working Paper Series © Akinropo Oluremi Akindele & Massachusetts Institute of Technology 2016
17
ercial 1 1 2 4 7 0.08
06
Public 102
1.02
-0.2
0.04
101
1.01
0.36
0.13
Industrial
97 0.97
-0.24
0.06
71 0.71
0.06
0.004
Recreational
98 0.98
-0.23
0.05
19 0.19
-0.46
0.21
Hospitality
129
1.29
0.08
0.006
23 0.23
-0.42
0.18
Total 725
7.25
-0.02
0.34
392
3.92
0.02
0.84
Table 6. Land-use characteristics around the mallix The enumerated land uses produced an interval data. This was
subjected to variance and standard deviation computation to explain land-use mix in the areas up to 600 meters around the mall. This is explained by how clustered the values of the land used clustered around the mean. Generally a lower figure of the variance and standard deviation depicts a greater degree of cluster around the mean. It therefore shows the strength of representation of each land use in the set. In essence, a greater land use mix will produce lower figure of standard deviation and variance.
As observed on the table, with variance of 0.58 and standard deviation of 0.34, land use around Jusco Bukit Indah is more clustered than land uses around Alamanda, Putrajaya with variance of 0.92 and standard deviation of 0.84. The implication of this is, again, a greater land-use mix . This encourages walking and accessibility to multiple activities within a smaller area, and is believed to have contributed positively to the performance of the mall in Bukit Indah.
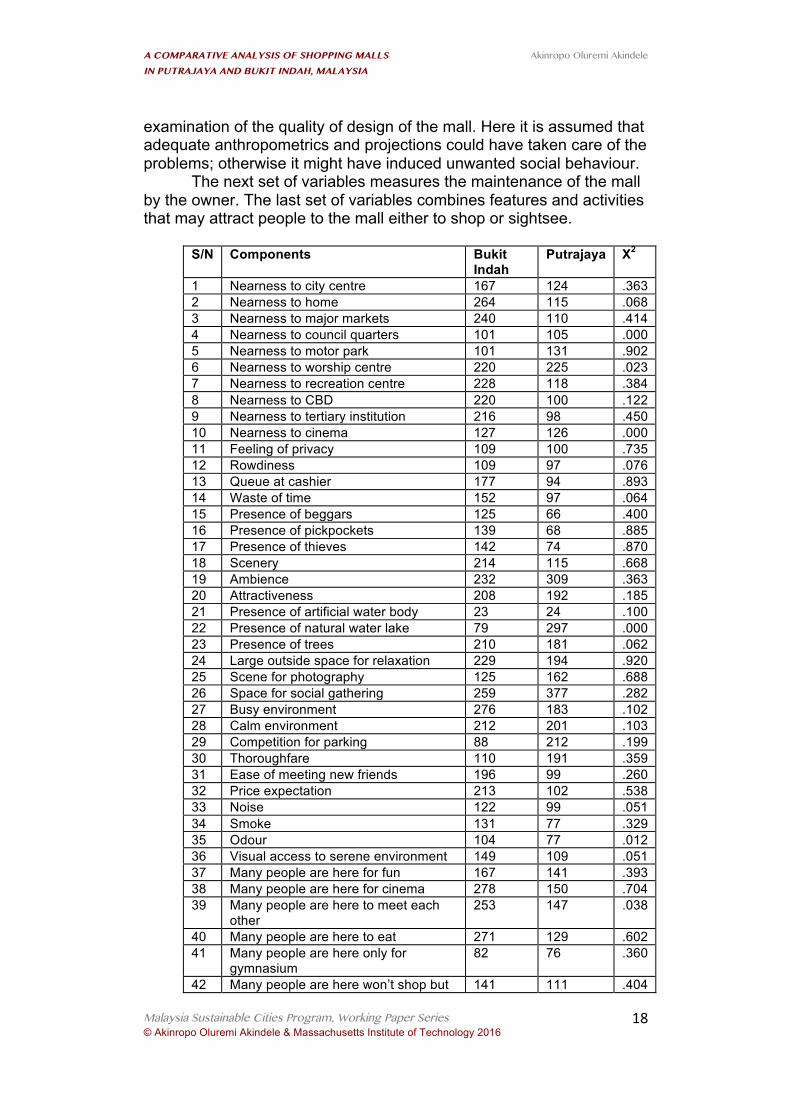
Shopper’s satisfaction The information that follows was obtained through the use of the
survey. Respondents (100 from Bukit Indah and 50 from Putrajaya) were asked to rank their perceptions according to each of the variables listed on table; allotting 4 to “very much satisfied,” 3 to “very satisfied,” 2 to “just satisfied,” 1 to “not satisfied,” and 0 to “not satisfied at all.” This ordinal data was weighed and the sum of the weights was computed.
The average sum of weight computed from the ranking is presented in Table 7. Nearness to city center, home, major market, council headquarters, and the other factors listed on the table are aimed at measuring the possibility of multiple activities around the mall, transportation demand, convenience, and general accessibility, among others. The next set of variables—such as feelings of privacy, rowdiness, queue, presence of beggars ,and so on—is the perceptual
A COMPARATIVE ANALYSIS OF SHOPPING MALLS
IN PUTRAJAYA AND BUKIT INDAH, MALAYSIA
Akinropo Oluremi Akindele
Malaysia Sustainable Cities Program, Working Paper Series © Akinropo Oluremi Akindele & Massachusetts Institute of Technology 2016
18
examination of the quality of design of the mall. Here it is assumed that adequate anthropometrics and projections could have taken care of the problems; otherwise it might have induced unwanted social behaviour.
The next set of variables measures the maintenance of the mall by the owner. The last set of variables combines features and activities that may attract people to the mall either to shop or sightsee.
S/N Components Bukit Indah
Putrajaya X2
1 Nearness to city centre 167 124 .363 2 Nearness to home 264 115 .068 3 Nearness to major markets 240 110 .414 4 Nearness to council quarters 101 105 .000 5 Nearness to motor park 101 131 .902 6 Nearness to worship centre 220 225 .023 7 Nearness to recreation centre 228 118 .384 8 Nearness to CBD 220 100 .122 9 Nearness to tertiary institution 216 98 .450 10 Nearness to cinema 127 126 .000 11 Feeling of privacy 109 100 .735 12 Rowdiness 109 97 .076 13 Queue at cashier 177 94 .893 14 Waste of time 152 97 .064 15 Presence of beggars 125 66 .400 16 Presence of pickpockets 139 68 .885 17 Presence of thieves 142 74 .870 18 Scenery 214 115 .668 19 Ambience 232 309 .363 20 Attractiveness 208 192 .185 21 Presence of artificial water body 23 24 .100 22 Presence of natural water lake 79 297 .000 23 Presence of trees 210 181 .062 24 Large outside space for relaxation 229 194 .920 25 Scene for photography 125 162 .688 26 Space for social gathering 259 377 .282 27 Busy environment 276 183 .102 28 Calm environment 212 201 .103 29 Competition for parking 88 212 .199 30 Thoroughfare 110 191 .359 31 Ease of meeting new friends 196 99 .260 32 Price expectation 213 102 .538 33 Noise 122 99 .051 34 Smoke 131 77 .329 35 Odour 104 77 .012 36 Visual access to serene environment 149 109 .051 37 Many people are here for fun 167 141 .393 38 Many people are here for cinema 278 150 .704 39 Many people are here to meet each
other 253 147 .038
40 Many people are here to eat 271 129 .602 41 Many people are here only for
gymnasium 82 76 .360
42 Many people are here won’t shop but 141 111 .404
A COMPARATIVE ANALYSIS OF SHOPPING MALLS
IN PUTRAJAYA AND BUKIT INDAH, MALAYSIA
Akinropo Oluremi Akindele
Malaysia Sustainable Cities Program, Working Paper Series © Akinropo Oluremi Akindele & Massachusetts Institute of Technology 2016
19
for the side benefit 43 Malls offer opportunity to play 245 193 .000 44 Architectural beauty attract people to
come 222 208 .823
45 Nearness to home attract people to come
290 115 .002
46 General environment attracts people to come
265 107 .004
47 Have you ever met a new friend in the mall?
180 71 .980
49 Have you ever met a new friend in the mall?
132 76 .041
50 Do you go through interchange while coming to the mall?
166 94 .018
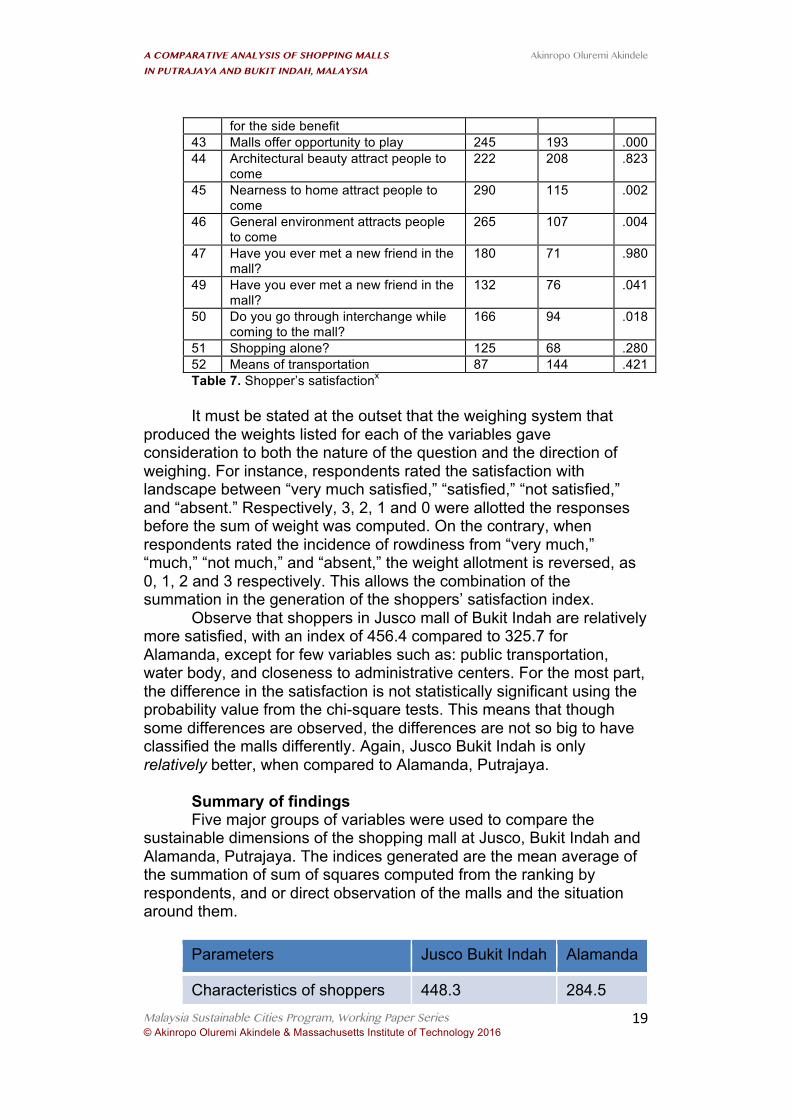
51 Shopping alone? 125 68 .280 52 Means of transportation 87 144 .421 Table 7. Shopper’s satisfactionx It must be stated at the outset that the weighing system that
produced the weights listed for each of the variables gave consideration to both the nature of the question and the direction of weighing. For instance, respondents rated the satisfaction with landscape between “very much satisfied,” “satisfied,” “not satisfied,” and “absent.” Respectively, 3, 2, 1 and 0 were allotted the responses before the sum of weight was computed. On the contrary, when respondents rated the incidence of rowdiness from “very much,” “much,” “not much,” and “absent,” the weight allotment is reversed, as 0, 1, 2 and 3 respectively. This allows the combination of the summation in the generation of the shoppers’ satisfaction index.
Observe that shoppers in Jusco mall of Bukit Indah are relatively more satisfied, with an index of 456.4 compared to 325.7 for Alamanda, except for few variables such as: public transportation, water body, and closeness to administrative centers. For the most part, the difference in the satisfaction is not statistically significant using the probability value from the chi-square tests. This means that though some differences are observed, the differences are not so big to have classified the malls differently. Again, Jusco Bukit Indah is only relatively better, when compared to Alamanda, Putrajaya.
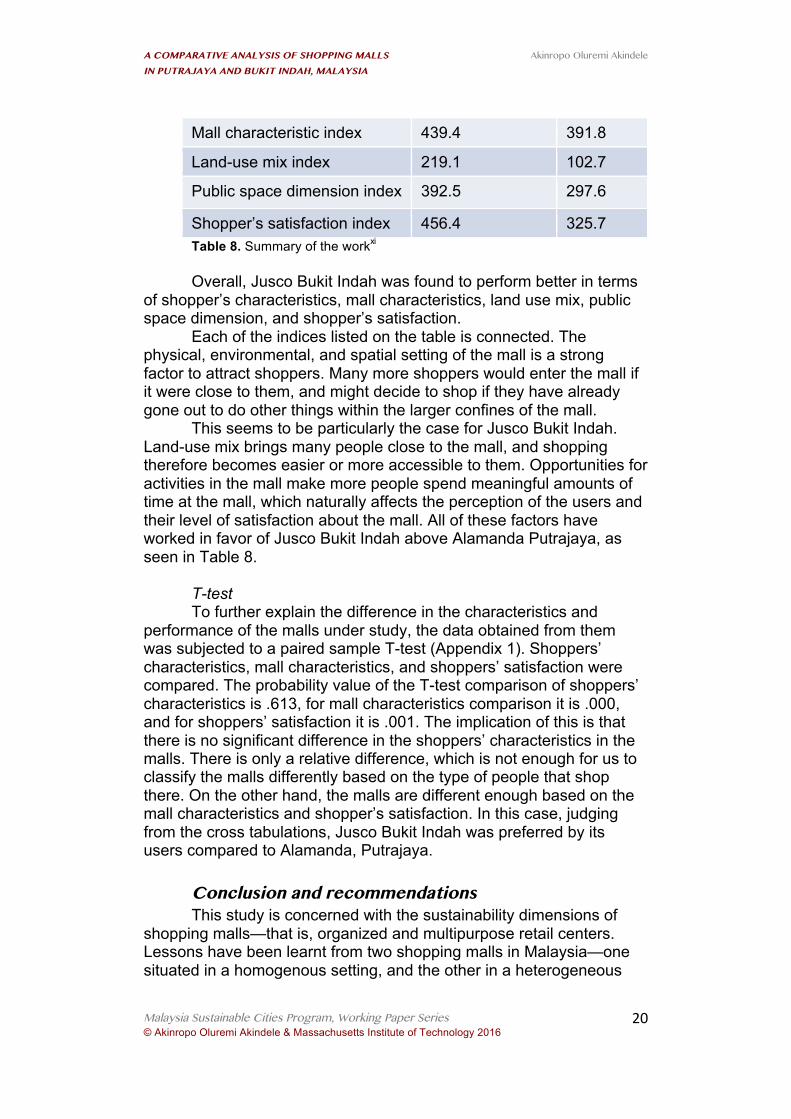
Summary of findings Five major groups of variables were used to compare the
sustainable dimensions of the shopping mall at Jusco, Bukit Indah and Alamanda, Putrajaya. The indices generated are the mean average of the summation of sum of squares computed from the ranking by respondents, and or direct observation of the malls and the situation around them.
Parameters Jusco Bukit Indah Alamanda
Characteristics of shoppers 448.3 284.5
A COMPARATIVE ANALYSIS OF SHOPPING MALLS
IN PUTRAJAYA AND BUKIT INDAH, MALAYSIA
Akinropo Oluremi Akindele
Malaysia Sustainable Cities Program, Working Paper Series © Akinropo Oluremi Akindele & Massachusetts Institute of Technology 2016
20
Mall characteristic index 439.4 391.8
Land-use mix index 219.1 102.7
Public space dimension index 392.5 297.6
Shopper’s satisfaction index 456.4 325.7 Table 8. Summary of the workxi Overall, Jusco Bukit Indah was found to perform better in terms
of shopper’s characteristics, mall characteristics, land use mix, public space dimension, and shopper’s satisfaction.
Each of the indices listed on the table is connected. The physical, environmental, and spatial setting of the mall is a strong factor to attract shoppers. Many more shoppers would enter the mall if it were close to them, and might decide to shop if they have already gone out to do other things within the larger confines of the mall.
This seems to be particularly the case for Jusco Bukit Indah. Land-use mix brings many people close to the mall, and shopping therefore becomes easier or more accessible to them. Opportunities for activities in the mall make more people spend meaningful amounts of time at the mall, which naturally affects the perception of the users and their level of satisfaction about the mall. All of these factors have worked in favor of Jusco Bukit Indah above Alamanda Putrajaya, as seen in Table 8.
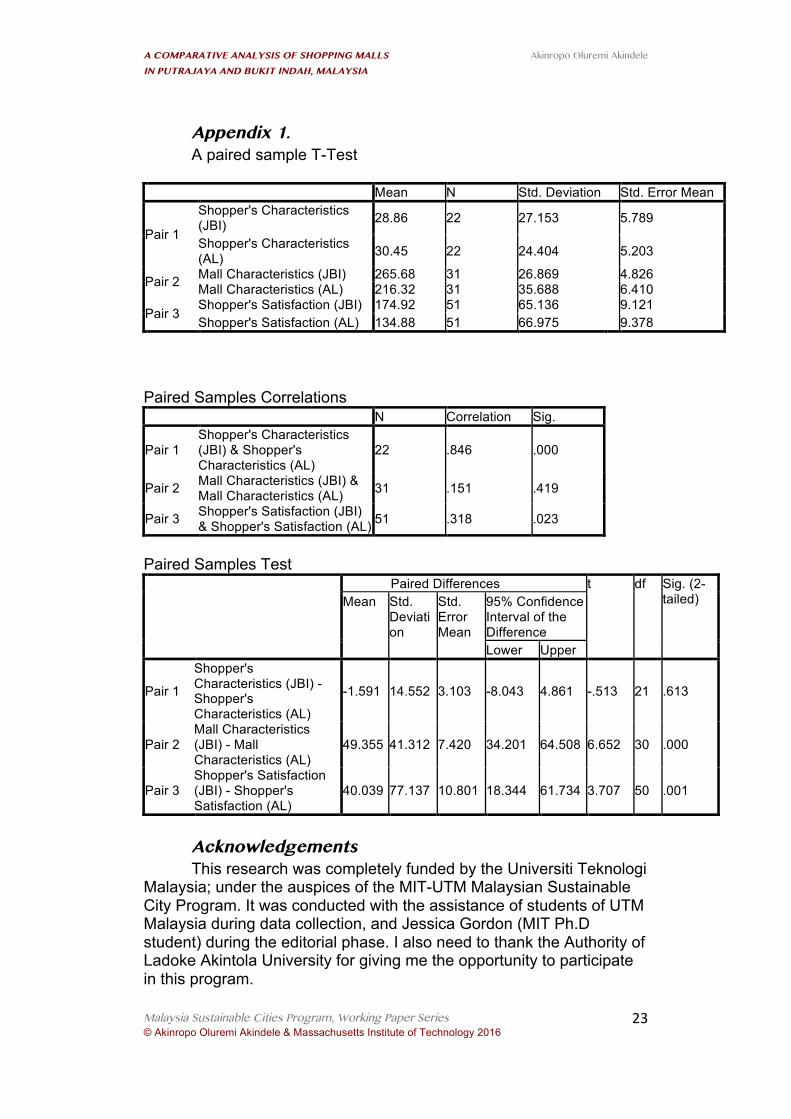
T-test To further explain the difference in the characteristics and
performance of the malls under study, the data obtained from them was subjected to a paired sample T-test (Appendix 1). Shoppers’ characteristics, mall characteristics, and shoppers’ satisfaction were compared. The probability value of the T-test comparison of shoppers’ characteristics is .613, for mall characteristics comparison it is .000, and for shoppers’ satisfaction it is .001. The implication of this is that there is no significant difference in the shoppers’ characteristics in the malls. There is only a relative difference, which is not enough for us to classify the malls differently based on the type of people that shop there. On the other hand, the malls are different enough based on the mall characteristics and shopper’s satisfaction. In this case, judging from the cross tabulations, Jusco Bukit Indah was preferred by its users compared to Alamanda, Putrajaya.
Conclusion and recommendations This study is concerned with the sustainability dimensions of
shopping malls—that is, organized and multipurpose retail centers. Lessons have been learnt from two shopping malls in Malaysia—one situated in a homogenous setting, and the other in a heterogeneous
A COMPARATIVE ANALYSIS OF SHOPPING MALLS
IN PUTRAJAYA AND BUKIT INDAH, MALAYSIA
Akinropo Oluremi Akindele
Malaysia Sustainable Cities Program, Working Paper Series © Akinropo Oluremi Akindele & Massachusetts Institute of Technology 2016
21
one. These lessons may also be applicable to other countries, especially developing ones.
In general, shopping malls can contribute to sustainable development if located, designed, and operated properly. While large buildings may be thought of as inevitably contributing to a high carbon footprint, they may be shaped in ways that reduce that footprint, and increase city livability in substantial ways. Generally, if large buildings that are replacing several smaller ones incorporate “green” building technologies, this makes it easier to maximize the greening of a given site. Ecologically tempered approaches to constructing malls through the practice of green building development is a huge opportunity to reduce the carbon footprint in Malaysia and other countries. It is therefore advocated that plans for huge buildings should consciously incorporate green building principles for a lower-carbon city.
Large retail centers create the opportunity to save space and promote compact cities, compared to the traditional retail systems that encourage the proliferation of many smaller retail businesses that sprawl over a wide area. Given careful siting and ecologically sensitive construction, large retail centers perform well in Malaysia as well as in other developing countries. Multiple uses for the space in addition to shopping opportunities give shoppers ways to reduce stress, save time, and conserve financial resources. For example: a single trip can satisfy most retailing needs, saving time and transportation costs. Because shopping in the city can be easily managed, that makes the city more livable and sustainable.
One of the reasons for the better performance of Jusco Bukit Indah, as observed in the study, is increased land-use intensity and mix. A lesson learnt from Malaysia is that a heterogeneous setting with greater land use mix promotes sustainable shopping, because it attracts more types of uses within the same area, and harnesses transportation, parking, and allied resources. Policy makers—as well as investors who are interested in retailing—should consider such factors when locating a new mall.
Malls have the potential to improve social capital. This is because it becomes a meeting point for several members of the community, where information sharing, social networking, and friendliness may be fostered. The study showed that many mall users were there first due to the entertainment factor—i.e., shopping was secondary. For example, Jusco Bukit Indah hosts a private school, play centers for the children, a cinema, and a number of gaming center. Studies have demonstrated that information distribution and social networking are prime contributors to economic redistribution in cities; this outcome could be promoted through gatherings facilitated by large shopping malls
Shopping mall harness the use of resources in an effective and efficient way. For instance, security infrastructure and personnel can be judiciously deployed in a coherent way, rather than in a fragmented one. Relatively fewer security personnel are needed in the commercial
A COMPARATIVE ANALYSIS OF SHOPPING MALLS
IN PUTRAJAYA AND BUKIT INDAH, MALAYSIA
Akinropo Oluremi Akindele
Malaysia Sustainable Cities Program, Working Paper Series © Akinropo Oluremi Akindele & Massachusetts Institute of Technology 2016
22
hub of Bukit Indah, where AEON mall and others are located. A similar security outfit would be needed for Alamanda mall alone. Retail localization accumulates large amount of solid and liquid wastes, and may therefore encourage recycling of those wastes.
Larger shopping malls also promote sustainability because they allow for more diversified activities and goods. At the mall, one finds not just shoes or bag or groceries, but an almost incredible variety of goods. This can help make the mall a tourist attraction. Some of the larger shopping malls have made a name for countries like Dubai, South Africa, Malaysia, and other developing countries. They contribute significantly to place identity—and even have the potential to develop into historic sites, over time, making people proud to say that they have visited the Such-and-Such mall.
One of the chief reasons that shopping malls seem to be unsustainable in developing countries is their relatively late arrival on the retail scene, which has limited their siting choices. Today, many new shopping malls can only find space at the outskirts of cities. This tends to put them at a distance from the existing public transportation network, leaving them poorly integrated. This is true of Jusco Bukit Indah, where most shoppers depend on their cars to reach the mall. Increased reliance on public transportation, with an emphasis on rail systems, would cut down the energy usage and environmental pollution caused by the use of private cars. The multi-modal transportation advantage of Alamanda mall has yet to be exploited. Water and rail transportation can complement the existing road transportation system to attract more shoppers from near and far. If all these points are taken together, shopping malls will definitely improve city organization, livability, sustainability, and prosperity.
A COMPARATIVE ANALYSIS OF SHOPPING MALLS
IN PUTRAJAYA AND BUKIT INDAH, MALAYSIA
Akinropo Oluremi Akindele
Malaysia Sustainable Cities Program, Working Paper Series © Akinropo Oluremi Akindele & Massachusetts Institute of Technology 2016
23
Appendix 1. A paired sample T-Test
Mean N Std. Deviation Std. Error Mean
Pair 1
Shopper's Characteristics (JBI) 28.86 22 27.153 5.789
Shopper's Characteristics (AL) 30.45 22 24.404 5.203
Pair 2 Mall Characteristics (JBI) 265.68 31 26.869 4.826 Mall Characteristics (AL) 216.32 31 35.688 6.410
Pair 3 Shopper's Satisfaction (JBI) 174.92 51 65.136 9.121 Shopper's Satisfaction (AL) 134.88 51 66.975 9.378
Paired Samples Correlations N Correlation Sig.
Pair 1 Shopper's Characteristics (JBI) & Shopper's Characteristics (AL)
22 .846 .000
Pair 2 Mall Characteristics (JBI) & Mall Characteristics (AL) 31 .151 .419
Pair 3 Shopper's Satisfaction (JBI) & Shopper's Satisfaction (AL) 51 .318 .023
Paired Samples Test
Paired Differences t df Sig. (2-tailed) Mean Std.
Deviation
Std. Error Mean
95% Confidence Interval of the Difference Lower Upper
Pair 1
Shopper's Characteristics (JBI) - Shopper's Characteristics (AL)
-1.591 14.552 3.103 -8.043 4.861 -.513 21 .613
Pair 2 Mall Characteristics (JBI) - Mall Characteristics (AL)
49.355 41.312 7.420 34.201 64.508 6.652 30 .000
Pair 3 Shopper's Satisfaction (JBI) - Shopper's Satisfaction (AL)
40.039 77.137 10.801 18.344 61.734 3.707 50 .001
Acknowledgements This research was completely funded by the Universiti Teknologi
Malaysia; under the auspices of the MIT-UTM Malaysian Sustainable City Program. It was conducted with the assistance of students of UTM Malaysia during data collection, and Jessica Gordon (MIT Ph.D student) during the editorial phase. I also need to thank the Authority of Ladoke Akintola University for giving me the opportunity to participate in this program.
A COMPARATIVE ANALYSIS OF SHOPPING MALLS
IN PUTRAJAYA AND BUKIT INDAH, MALAYSIA
Akinropo Oluremi Akindele
Malaysia Sustainable Cities Program, Working Paper Series © Akinropo Oluremi Akindele & Massachusetts Institute of Technology 2016
24
References American Planning Association (2014); www.planning.org/greatplaces/spaces/characteristics.htm Anon, (2009a) BCSC Retail Property Statistics Summary October 2009Anon, (2009b) Career Guide to Industries, 2010-11 Edition, Grocery Stores. Bureau of Labor Statistics, U.S.Department of Labor Anon, (2011a) “Last Stop: Turtle Creek,” Retail Traffic [online journal] ,<http://retailtrafficmag.com/development/analysis/last_stop_turtle_creek/> accessed October 15, 2011 Anon, (2011b) “Retail park,” Wikipedia, the free encyclopaedia <http://en.wikipedia.org/wiki/Retail_park> accessed December 11, 2011
Anon, (2007) Section 22 Wholesale and Retail Trade , USA: U.S. Census Bureau,<http://search.census.gov/search?q=shopping+malls&btnG.x=9&btnG.y=14&btnG=Go&entqr=0&ud=1&output=xml_no_dtd&oe=UTF-8&ie=UTF-8&client=default_frontend&proxystylesheet=default_frontend&site=census>Accessed November 12, 2011
Anon, (2008) The Market for Retail Tenancy Leases in Australia: Productivity Commission Draft Report, Australian Government Productivity
Auspitz Jesse (2010); Irony of the Sustainable Shopping Mall http://www.resilientcity.org/index.cfm?id=23454&modex=blogid&modexval=c20ee505-1ec9-420f-ad9f8b92e9ab6635&blogid=c20ee505-1ec9-420f-ad9f8b92e9ab6635 Berry, Brian J. L. (1967) Geography of Market Centers and Retail Distribution. Englewood Cliffs: Prentice Hall Inc. Badger Emily (2015); In the Shadow of Booming Cities: A Tension Between Sunlight and Prosperity. http://www.washingtonpost.com/blogs/wonkblog/wp/2015/05/04/in-the-shadows-of-booming-cities-a-tension-between-sunlight-and-prosperity/
Bansal, P. & Kilbourne, W.E.,(2001). The ecologically sustainable retailer. Journal of Retailing and Consumer Services, 8(3), pp.139-146.
Benfield, K., (2009). R.I.P. The American Suburban Shopping Mall. Kaid Benfield’s Blog | Switchboard, from NRDC. Available at:
A COMPARATIVE ANALYSIS OF SHOPPING MALLS
IN PUTRAJAYA AND BUKIT INDAH, MALAYSIA
Akinropo Oluremi Akindele
Malaysia Sustainable Cities Program, Working Paper Series © Akinropo Oluremi Akindele & Massachusetts Institute of Technology 2016
25
http://switchboard.nrdc.org/blogs/kbenfield/rip_the_american_suburban_shop.html [Accessed December 7, 2011].
Berry, Brian J. L.(1959) "A Critique of Contemporary Planning for Business Centers." Land Economics. 35. pp. 306-12.
Berry, Brian J. L. and Garrison, William (1958). "The Functional Baes of the Central Place Hierarchy." Economic Geography. 34. pp. 145-54.
Borgers Aloys, Sanne van Swaaij et Ingrid Janssen, “Assessing the impact of peripheral mega retail centres on traditional urban shopping centres,” Belgeo [En ligne], 1-2 | 2006, mis en ligne le 18 décembre 2013, consulté le 18 février 2015. URL : http://belgeo.revues.org/10888
Chung, C.J. et al. eds., (2001). Project on the City 2—Harvard Design School Guide to Shopping , Köln: Taschen
Civic Economics (2008); A guide to Retail Impact Studies. http://ilsr.org/wp-content/uploads/2009/12/guide.pdf
Egunjobi Layi (2006) Formulation and Implementation of Urban Environmental Strategy. In: Tunde Agbola (ed) (2006) “Environmental Planning and Management: Concepts and Application to Nigeria,” Ibadan: Counstellation Book. Nigeria
Fleming, R. L. & Von Tscharner, R. (1987). Placemakers. Orlando, FL: Harcourt Brace Jovanovich
Gregory, S., (2009). The Last Shopping Mall? New Jersey Awaits Xanadu - TIME.Time Magazine Business, Available at: http://www.time.com/time/magazine/article/0,9171,1886537,00.html [Accessed December 7, 2011].
Heinonen J, Säynäjoki A, Junnila S. A (2011) Longitudinal Study on the Carbon Emissions of a New Residential Development. Sustainability 2011;3:1170 e89.
http://www.indahwalk.weebly.com Indah Walk 3 Lifestyle Offices http://causewaylink.com.my Singapore-Tuas-Bukit Indah Bus
Service http://www.jusco.com.my http://www.tesco.com.my
ILO. (2011). “Global Dialogue Forum on the Needs of Older Workers in relation to Changing Processes and the Working Environment in Retail Commerce.” Geneva, 21–22 September 2011
Jayne, M.,(2006). Cities and Consumption, U.K.: Routledge. Joachim Zentes, Dirk. Morschett, and Hanna Schramm-Klein. (2011). Strategic
A COMPARATIVE ANALYSIS OF SHOPPING MALLS
IN PUTRAJAYA AND BUKIT INDAH, MALAYSIA
Akinropo Oluremi Akindele
Malaysia Sustainable Cities Program, Working Paper Series © Akinropo Oluremi Akindele & Massachusetts Institute of Technology 2016
26
Retail Management: Text and International Cases. Springer; S.R. Kalliappan, Rokiah Alavi, Kalthom Abdullah, and Muhammad Arif, 2008. “Liberalization of Retail Sector and the Economic Impact of the Entry of Foreign Hypermarkets on Local Retailers in Klang Valley, Malaysia.” International Journal of Economics and Management. Vol 2 (2): 323-342
Junnila S, Horvath A, Guggemos AA (2006). Life-Cycle Assessment of Office Buildings in Europe and the United States. J Infrastruct Syst ;12:10e7
Koolhaas, R., (2000). Shopping. In Mutations. pp. 124-183. Leong, S., (2001). Gruen Urbanism. In Project on the City 2—Harvard Design School Guide to Shopping . Köln:Taschen, pp. 381-387. Lebow, V., (1955). Price Competition in 1955. Journal of Retailing, (Spring). Lee Sarah (2014) http://www.theguardian.com/business/2013/jun/20/uk-retail-sales-online-shopping-ons
Lindquist, J. (1974–5). Meaning of Image. Journal of Retailing, 50, 4, 29–38. Luce Stephanie (2013); Global Retail Report AReport by the UNI Global Union. http://blogs.uniglobalunion.org/commerce/wp-content/uploads/sites/7/2013/10/Global-Retail-Report-EN.pdf Luomala, H. (2003). Understanding how retail environments are perceived: a conceptualization and pilot study. International Review of Retail, Distribution and Consumer Research, 13, 3, 279–300. Lippard, L. (1997). The Lure of the Local: Sense of Place in a Multicentered Society. New York: The New Press Misonzhnik, E., (2010). Developers Rethink the Mall for the 21st Century. Retail Traffic Available at: http://retailtrafficmag.com/news/developers_rethink_mall_06272010/index2.html [Accessed December 7, 2011]
Oldenburg, R. (1999). The Great Good Place. New York: Marlowe & Company
Peterson, D. A (1966). "Market Areas of Shopping Districts." Journal of the American Institute of Planners. 29, pp. 297-301
A COMPARATIVE ANALYSIS OF SHOPPING MALLS
IN PUTRAJAYA AND BUKIT INDAH, MALAYSIA
Akinropo Oluremi Akindele
Malaysia Sustainable Cities Program, Working Paper Series © Akinropo Oluremi Akindele & Massachusetts Institute of Technology 2016
27
Putnam, R. (2000). Bowling Alone: The Collapse and Revival of American Community. New York: Simon & Schuster
PWC (2012) Total Retail—Canadian customer expectations driving the next retail business model. http://www.retailcouncil.org/webinars/pwc-total-retail-canadian-customer-expectations-driving-the-next-retail-business-model
Rivlin, L. (1987). The Neighborhood, Personal Identity, and Group Affiliations. In I. Altman & A. Wandersman (Eds.), Neighborhood and Community Environments. New York: Plenum Press.
Sev Aysin, Ozgen Aydan and Basarir Bahar (2011) Design Criteria for High rise Buildings in Historical Cities: A Case of Istanbul. A proceeding of the CTBUH World Conference, October 10-12, COEX Seoul Korea
Shay Mathew R and Bright Gunther (2012) The Economic Impact of US Retail https://nrf.com/sites/default/files/Documents/The%20Economic%20Impact%20of%20the%20US%20Retail%20Industry%20REV.pdf
Suladaimuthu S and Davi S (2014) Impact of Retail Management in the Growth of India Economy. http://www.fibre2fashion.com/industry-article/free-retail-industry-article/impact-of-retail-management-in-the-growth-of-indian-economy/impact
Stumpf, B. (1998). The Ice Palace That Melted Away. New York: Pantheon Books
Shankar B and Chidambara Swamy (2012). “Policy Measure for Improving the Imageability of Mysore,” International Journal of Modern Engineering Research, Vol 2 Issue 2, Mar-April 2012 pp134-138
Thang, D. and Tan, B. (2003). Linking consumer perception to preferences of retail stores: an empirical assessment of the multi-attributes of store image. Journal of Retailing and Consumer Services, 10, 193–200
Unger, D. & Wandersman, A. (1985). The importance of neighbors: The social, cognitive, and affective components of neighboring. American Journal of Community Psychology, 13(2), 139-160
Urbis JHD Pty Ltd, (2007). Australian Shopping Centre Industry: http://www.scca.org.au/HTML%20Pages/Research.htm.White, R., 2010. The future of shopping centers.
A COMPARATIVE ANALYSIS OF SHOPPING MALLS
IN PUTRAJAYA AND BUKIT INDAH, MALAYSIA
Akinropo Oluremi Akindele
Malaysia Sustainable Cities Program, Working Paper Series © Akinropo Oluremi Akindele & Massachusetts Institute of Technology 2016
28
Van Ooteghem K, Xu L. The Life-cycle Assessment of a Single-Storey Retail Building in Canada. Built Environ 2012; 49:212e26
Wam (2012). Published Saturday, December 22, 2012 http://www.emirates247.com
Westley Brian (2008) Low-Rise D.C. Skyline Under Pressure to Look Upward. The Seattle Times. http://www.seattletimes.com/nation-world/low-rise-dc-skyline-under-pressure-to-look-upward/
White Hutchinson (2010) . Available at: http://www.whitehutchinson.com/leisure/articles/FutureOfShoppingCenters.shtml [Accessed January 23, 2011]
Zukin, S., (1998). Urban lifestyles: Diversity and standardisation in spaces of consumption. Urban Studies (Routledge) , 35(5/6), p.825.
Notes
i Source: Virtual Tourist (2014) ii Source: Virtual Tourist (2014) iii Source: adapted from Virtual Tourist (2014) iv Source: author’s fieldwork, 2014 v Source: author’s fieldwork, 2014 vi Mall users rarely shop alone. Few shoppers (27.8 percent) shopped alone in the study with higher incidence found in Alamanda, Putrajaya. vii Source: author’s fieldwork, 2014 viii Source: author’s fieldwork, 2014 ix Source: author’s computation, 2014 x Source: author’s fieldwork, 2014 xi Source: author’s computation, 2014