Embed Size (px)
Citation preview
A Community Collaborative Approach to
Improving Community Health Worker
Performance and Retention in Benin
Sara Riese, Marthe Akogbeto, Ramzia Akonde
Center for Human Services
September 2014
The Partnership for Community Management of Child Health (PRISE-C) in the Sao, Dagla, and
AZT Health Zones of Benin is supported by the American people through the United States
Agency for International Development (USAID) through its Child Survival and Health Grants
Program. PRISE-C is managed by the Center for Human Services under Cooperative Agreement No. AID-OAA-A-10-00047-00.The views expressed in this material do not necessarily reflect the views of USAID or the United States Government.
For the Operations Research Brief and other Child Survival and Health Grants Program materials, please visit http://www.mcsprogram.org/CSHGPproducts

ii
iii
Table of Contents Acknowledgements ...................................................................................................................................... ix
Study Team .................................................................................................................................................. ix
Introduction ................................................................................................................................................... 1
Methods ........................................................................................................................................................ 3
Results ........................................................................................................................................................... 7
Discussion ................................................................................................................................................... 19
References ................................................................................................................................................... 26

iv
Testing a community-based quality
improvement collaborative to improve
community health worker performance
in Benin
This operations research was funded by the U.S. Agency for
International Development through the Child Survival and Health
Grants Program from October 2010–September 2014.
December 2014
Background and Setting
Motivating CHWs to high performance and retaining them in their
position have been long-standing challenges for ministries of health,
and countries have responded with a variety of strategies and
approaches. In Benin, CHWs have been in place for over 20 years and
are seen as an essential part of the health system. They provide a
package of high-impact interventions focused on treatment of priority
child illnesses as well as health education and promotion, although there
are low rates of care seeking for child illness, with less than 40% of
mothers of children under 5 with acute respiratory infection, fever, or
diarrhea seeking care with a health care worker.
Within this context, Center for Human Services implemented a USAID
Child Survival and Health Grants Program-funded initiative from 2010-
2014, working with community health workers and their supervisors in
three health zones of Benin. The objectives of the project were to
increase community engagement with the community health delivery
system, increase demand for community preventive and curative
services, and strengthen performance and sustainability of the
community health delivery system. These CHWs served a population of
over 13,500 children under 5 years of age, and over 18,000 women of
reproductive age (15-49).
QIT members prepare to share
their results at a learning
session. A.Antayhua
Key Findings:
CHWs in the
intervention zone have
11.5 times the odds of
having a high
performance score as
compared to the
control zone
High retention in both
zones resulted in non-
significant retention
findings.
The incremental cost-
effectiveness ratio was
650,000 FCFA per
CHW who achieved a
high performance
score.
OP
ER
ATIO
NS
RE
SE
AR
CH
EX
EC
UTIV
E S
UM
MA
RY

v

vi
Methods
The research was conducted in the SAO and DAGLA health zones of Benin from December of 2011
until April of 2014. The study used a quasi-experimental study design, with assignment to intervention
(SAO) and control (DAGLA) groups made based on a coin toss.
CHW performance data was collected by CHW supervisors, and was measured by a composite score
consisting of 12 performance outcomes. Retention data was also reported by CHW supervisors
throughout the study period. Qualitative data were also collected with CHWs, their supervisors, and
Problem and Solution
In 2010, Benin implemented a policy to provide a performance-based financial motivation to their
community health workers, in an attempt to address evidence of low performance of CHWs in the
country. According to previous data, there was a lack of satisfaction of the community with the work of
the CHW and insufficient acknowledgement of the work of CHWs by the community. This was
reflected in the PRISE-C baseline Knowledge, Practices, and Coverage survey which showed that less
than 50% of mothers who knew of the CHW in their village actually participated in any of the CHW’s
activities.
The quality improvement collaborative is an approach which has been shown to be effective in
improving performance at the health facility level, but there was limited data on its application at the
community level.
The project sought to test whether the addition of a community level quality improvement collaborative
to the performance-based financial motivation would result in higher performance and retention as
compared to the financial motivation alone. The project also assessed the incremental cost-effectiveness
of implementing the collaborative approach and the financial motivation policy.
Intervention
CHS implemented a community-level quality improvement collaborative intervention in 31 villages in
the SAO health zone, using structured mutual learning and sharing of experiences to rapidly improve
and scale-up quality health services. The team used formative research was used to identify members of
the village-level quality improvement teams (QIT). The QITs would assess village performance on
certain health indicators, identify and implement appropriate strategies to improve upon low indicators,
then come together at quarterly quality improvement collaborative meetings to chart their performance
on key indicators and share lessons learned as well as strategies which had an impact and those which
did not with the larger collaborative.
In DAGLA, the control zone, the PRISE-C team convened annual meetings with community leaders
and members of the community health and development committee to develop an annual health
workplan based on priority areas for intervention.
CHWs from both the intervention and control zones received a refresher training on the package of
high-impact community interventions. The performance-based financial motivation was provided
quarterly to CHWs in both health zones. In addition, all supervisors received supervision refresher
training, and routine supervisions were conducted in both zones.

vii
community members, including CHW beneficiaries. Cost data for both the intervention and control
zone were collected by the CHS staff throughout the project period.
Statistical analyses were conducted to determine if there was a statistically different change in
performance and retention in the two zones. Incremental cost-effectiveness analysis was conducted to
calculate a cost per high-performing CHW, as well as to determine the influence of each of the cost
inputs on the cost-effectiveness model.
Findings
Performance
CHWs in the intervention zone had over 11 times the odds of having a high performance score as CHWs
in the control zone. The mean CHW performance scores were significantly different over time, with
greater differences early in the study, and variable differences later.
Retention
Retention levels in both intervention and control zones were very high, so no statistically significant
differences could be identified between them.
Cost-Effectiveness
The incremental cost-effectiveness ratio was 650,000 FCFA per CHW who achieved a high
performance score (95% CI 463,000 – 964,000).
Conclusions
The results of this operations research study shed a new light on how to motivate community health
workers to remain committed to their work, and to reach and maintain strong performance. This study
results demonstrate that in a low-resource setting a community-level quality improvement collaborative
combined with financial incentives provided to the health works is a feasible and effective strategy to
improve CHW performance as compared to financial incentives alone in a low-resource setting, though
further research is needed to ensure that improved performance can be sustained over time.
Recommendations
Scale up of community-based quality improvement collaboratives could be a key component
of future effective community health worker programs.
Future operations research in this area is recommended to better understand the processes of
performance improvement. Including the use of existing community structures as QITs
Use of Evidence
PRISE-C worked closely with the Ministry of Health throughout the operations research, from the
development of the concept through the period of implementation. The findings of the OR will be shared
with them for consideration, although the national MOH as well as zonal health teams have already
shown great interest in replicating the quality improvement collaborative.
viii
The Partnership for Community Management of Child Health (PRISE-C) in the Sao, Dagla, and AZT Health Zones of Benin is supported by
the American people through the United States Agency for International Development (USAID) through its Child Survival and Health Grants
Program. PRISE-C is managed by the Center for Human Services under Cooperative Agreement No. AID-OAA-A-10-00047-00.The views expressed in this material do not necessarily reflect the views of USAID or the United States Government.
For more information about PRISE-C, visit: www.chs-urc.com
ix
Acknowledgements
This operations research was funded by the U.S Agency for International Development through the Child
Survival and Health Grants Program (CSHGP). The research and implementation of CSHGP in Benin was
carried out jointly by the grantee, Center for Human Services, and Benin’s Ministry of Health (MOH)
through its departmental and zonal offices and health centers. We also acknowledge the participation of
over 80 community health workers as well as other community members and mothers of children under the
age of five in the research areas. The project team extends deep appreciation to Gwyneth Vance and Dr.
Edward Broughton who assisted with the data analysis, and Dr Tisna Veldhuijzen van Zanten and Cheryl
Combest who provided valuable editorial support.
Study Team
Marthe Akogbeto (CHS Benin Project Director), Sara Riese (CHS technical backstop, Bethesda), Dr.
Ramzia Akonde (CHS Benin Child Health Advisor)
1
Introduction
Motivating Community Health Workers (CHWs) to high performance and retaining them in their position
have been long-standing challenges for ministries of health. Countries have responded with a variety of
strategies and approaches (Bhattacharyya K et al., 2001). Since CHWs can be formal or informal members
of the health system, volunteer or paid, and can provide different packages of services depending on the
program, finding a standardized response can be a complicated exercise (George et al., 2012). In addition,
motivation and retention are themselves the result of a complex combination of psychological,
interpersonal, and contextual factors (Colvin, CJ, 2013). Many of the strategies to improve motivation and
retention have focused on providing some kind of incentive to CHWS, either financial or non-financial.
Financial incentives have been linked with higher rates of retention, although their link with motivation and
performance is not clear (Alam et al., 2012; Gray, DHH and Ciroma J, 19897; Wubneh H, 1999). There
are other programmatic challenges that arise when providing financial incentives, such as sustainability of
the payments and an expectation of increasing the incentive over time. Non-financial incentives address
other factors that have an influence on the performance of the CHW. These strategies may focus on
improving supervision structures, providing growth and development opportunities, or strengthening the
relationship between the CHW and the community. Non-monetary factors motivating individual CHWs,
such as community recognition and respect of CHW work, as well as peer support, have been shown to
have a large impact on CHW motivation for performance and retention in countries across the globe (Banek
et al., 2014; Kaseje et al., 1987; Ludwick et al., 2014; Walt et al., 1989). Community-level factors, such as
a structured approach to community engagement in CHW work, can also play a role in motivating
individual CHWs (Greenspan et al., 2013; Olayo et al., 2014). It has been postulated that multiple
incentives, potentially combining financial and non-financial approaches, would be required to maximally
motivate CHWs, and this hypothesis is supported by the systems approach developed by Bhattacharyya and
colleagues (2001).
In Benin, community health workers (or relais communautaires in French) have been in place for over 20
years and are seen as an essential part of the health system, providing a link between the formal health
sector and their communities. Despite this important role, they are not formal members of the health sector.
Benin’s 2011 Operational Plan for National Scale-up of High Impact Interventions for the Reduction of
Maternal, Neonatal and Child Mortality states that one of the main gaps in the health care system concerns
CHWs, whose work is an absolute necessity in the implementation of community family health activities.
The 2010 National Directives for Community Based Health Promotion for the first time clearly defines
community structures involved in the community health delivery system, roles and responsibilities of a
CHW, CHW performance indicators, and a policy on motivation of CHWs. This financial incentive
includes both a base incentive of 10,000 FCFAa per quarter as well as a performance-based incentive up to
a maximum of an additional 5,000 FCFA per quarter. The amount of money received out of this 5,000
FCFA is calculated based on performance as measured by a set of performance outcomes. Each outcome
a Average exchange rate of 492 FCFA= $ 1. 10,000 FCFA= $20.32.
2
measure is assigned a monetary value, and once the CHW achieves above 50% on any individual outcome,
they receive money. The 50% cut-off for incentives is the same across outcome measures, for all CHWs.
CHWs collect data on their activities using Ministry of Health registers, but supervisors conduct quarterly
on-site data collection and verification visits for quality control and to ensure that reports are accurate.
These financial incentives were operationalized in project zones for the first time through the PRISE-C
project.
This incentive policy was an attempt to implement a successful motivation strategy for CHWs, in response
to data reflecting low performance of CHWs in the country. According to an assessment done by PISAF, a
USAID-funded project implemented by URC-CHS in Benin from 2006-2012, there was a lack of
satisfaction of the community with the work of the CHW and insufficient acknowledgement of the work of
CHWs by the community (PISAF, 2011). This was reflected in the PRISE-C baseline Knowledge,
Practices, and Coverage survey which showed that less than 50% of mothers who knew of the CHW in
their village actually participated in any of the CHW’s activities.
Financial incentives alone are unlikely to sustain high levels of CHW performance and retention without
other non-financial complementary approaches. The quality improvement collaborative approach to quality
improvement has been successfully applied at the health center level in Benin under numerous previous
projects, and has been demonstrated as an effective means for creating an environment where sustained
behavior change can be achieved, specifically with malaria prevention (Catsambas T et al., 2008; Lynn
Miller-Franco and Lani Marquez, 2011; Mamadou A and
Anato M, 2009; University Research Co., LLC, 2012).
We will examine the application of the quality
improvement collaborative approach at the community
level, in combination with the financial incentives, to
motivate CHWs for improved performance and
retention. Results will be analyzed in comparison to
CHWs performance and retention with financial
incentives alone.
The objectives of this research are:
Objective 1: To determine if the addition of a
community-level quality improvement collaborative to
the Ministry of Health’s financial incentive policy results
in higher performance than the financial incentives
alone.
Objective 2: To determine if the addition of a
community-level quality improvement collaborative to
What is an improvement
collaborative?
In a collaborative, multiple quality improvement
teams work independently to test changes in how
services can be delivered, implementing best
practices and accepted standards for the
collaborative’s topic area. Teams use a common
set of indicators to measure the quality of the care
processes in which the collaborative is trying to
improve and, where possible, the desired health
outcomes. The collaborative organizes regular
sharing of results among teams through learning
sessions in which teams learn from each other
about which changes have been successful and
which were not. This results in a dynamic
improvement strategy in which many teams
working on related problem areas can learn from
each other in a way that facilitates rapid
dissemination of successful practices.
3
the Ministry of Health’s financial incentive policy results in better retention of CHWs than the financial
incentives alone.
Objective 3: To determine the incremental cost-effectiveness of implementing the collaborative and the
Ministry of Health’s financial incentive policy.
Methods
Setting
The research was conducted in the SAO and DAGLA health zones of Benin, with SAO receiving the
intervention and DAGLA serving as the control. Assignment to the intervention group or the control group
was made based on a coin toss at the beginning of the project. The two zones are both principally rural,
with similar ethnic and religious population breakdown as well as similar languages. SAO has a total of 14
health centers with 14,832 inhabitants per health center , and DAGLA has 18 health centers with 16,797
inhabitants per health center (2013 Population Estimates, Ministere de la Sante, Benin).
Study Design and Methods
The study used a quasi-experimental study design, with an intervention and a control group.
Eighty-seven (87) trained community health workers were recruited to participate in the study; 48 in
DAGLA, and 39 in SAO. This accounts for approximately one-third of all CHWs in the zones. CHWs
were chosen based on prior training. In both zones, CHWs previously trained as comprehensive CHWs
through the prior PISAF project or as malaria CHWs through Africare’s malaria program were selected.
All CHWs consented to participate at the initiation of the study or when they were recruited as a CHW
during the study period. Additional respondents who participated in qualitative data collection also
completed informed consent forms. Approval was obtained from University Research Company IRB and
from the Comité d’Ethique at the Benin Ministry of Health.
The study took place over 28 months, from December of 2011 until April of 2014.
Intervention
This operations research was embedded within overall project activities in two of the three project
intervention zones. The quality improvement collaborative intervention uses structured mutual learning and
sharing of experiences to rapidly improve and scale-up quality health services. Formative research was used
to identify appropriate members of the communities’ quality improvement teams (QIT). Each village had
an 8-10 member QIT. These QITs received a 5-day training on quality improvement methodology from
the PRISE-C staff. Teams were to conduct team meetings at a minimum once a month to review indicators
and identify strategies to improve upon low indicators. The team would then implement these strategies in
their community. At 1-2 day quarterly quality improvement collaborative meetings, the different quality
improvement teams would come together and review the data from the past 3 months. Teams would chart
4
their performance on key indicators and share lessons learned with the larger collaborative, strategies which
had an impact and those which did not. Graphs of the team’s performance would be posted at the health
center to encourage transparency and accountability to the community. Two members of the QIT and the
CHW attended these meetings, and they received a per diem. Quarterly coaching visits were conducted
with CHWs and QITs by certain supervisors and CHWs who were chosen based on their good results and
ability to mentor others. These coaching visits were stopped for financial reasons after March of 2013.
In the control zone, the PRISE-C team convened annual meetings with community leaders and members of
the community health and development committee to develop an annual health workplan based on priority
areas for intervention.
Both the intervention and control zones received support from the project to provide a 5 day refresher
training on the package of high-impact community interventions, as well as to provide routine supervision
to CHWs. CHW supervisors, typically a MOH nurse or health staff from the nearest health center, received
a 3 day supervision refresher training at the project outset. Routine supervisions were conducted in both
zones. This consisted of monthly grouped supervisionsb and quarterly on-site supervisions. The monthly
grouped supervisions were stopped for financial reasons after March of 2013, while the quarterly on-site
supervisions continued through the life of the study. The team also developed guidelines for implementation
of the performance-based financial incentives, which were implemented in both zones starting in 2011 and
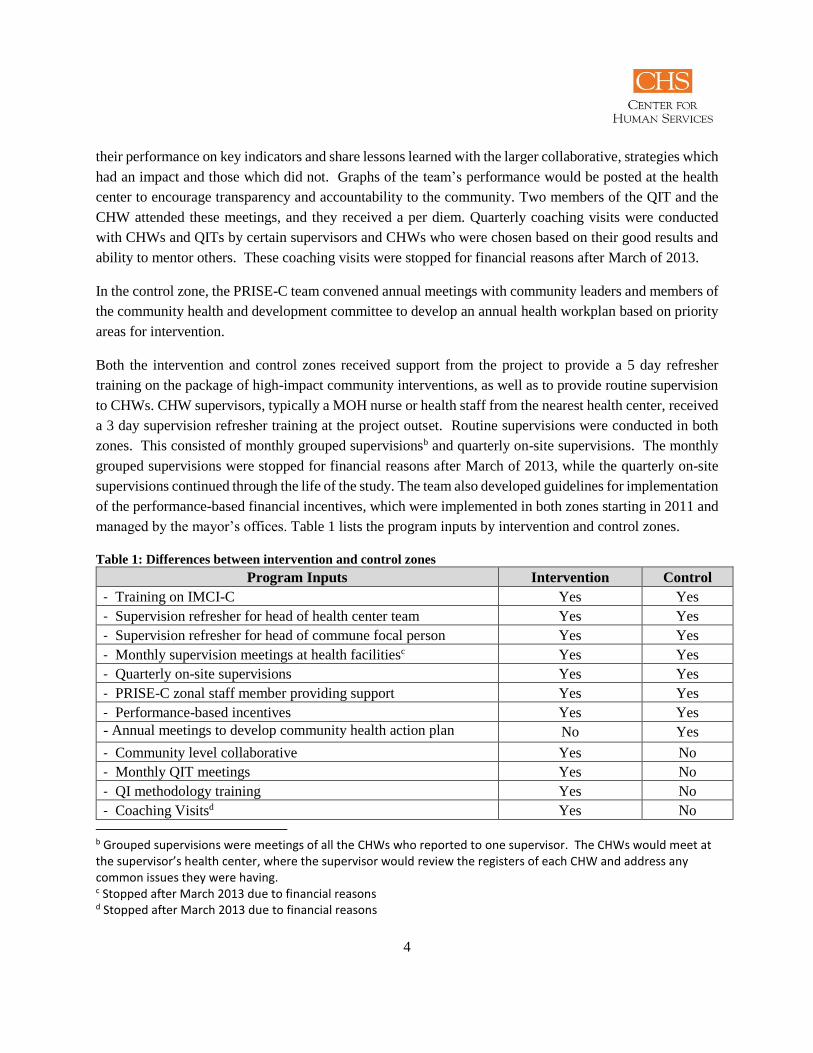
managed by the mayor’s offices. Table 1 lists the program inputs by intervention and control zones.
Table 1: Differences between intervention and control zones
Program Inputs Intervention Control
- Training on IMCI-C Yes Yes
- Supervision refresher for head of health center team Yes Yes
- Supervision refresher for head of commune focal person Yes Yes
- Monthly supervision meetings at health facilitiesc Yes Yes
- Quarterly on-site supervisions Yes Yes
- PRISE-C zonal staff member providing support Yes Yes
- Performance-based incentives Yes Yes
- Annual meetings to develop community health action plan No Yes
- Community level collaborative Yes No
- Monthly QIT meetings Yes No
- QI methodology training Yes No
- Coaching Visitsd Yes No
b Grouped supervisions were meetings of all the CHWs who reported to one supervisor. The CHWs would meet at the supervisor’s health center, where the supervisor would review the registers of each CHW and address any common issues they were having. c Stopped after March 2013 due to financial reasons d Stopped after March 2013 due to financial reasons
5
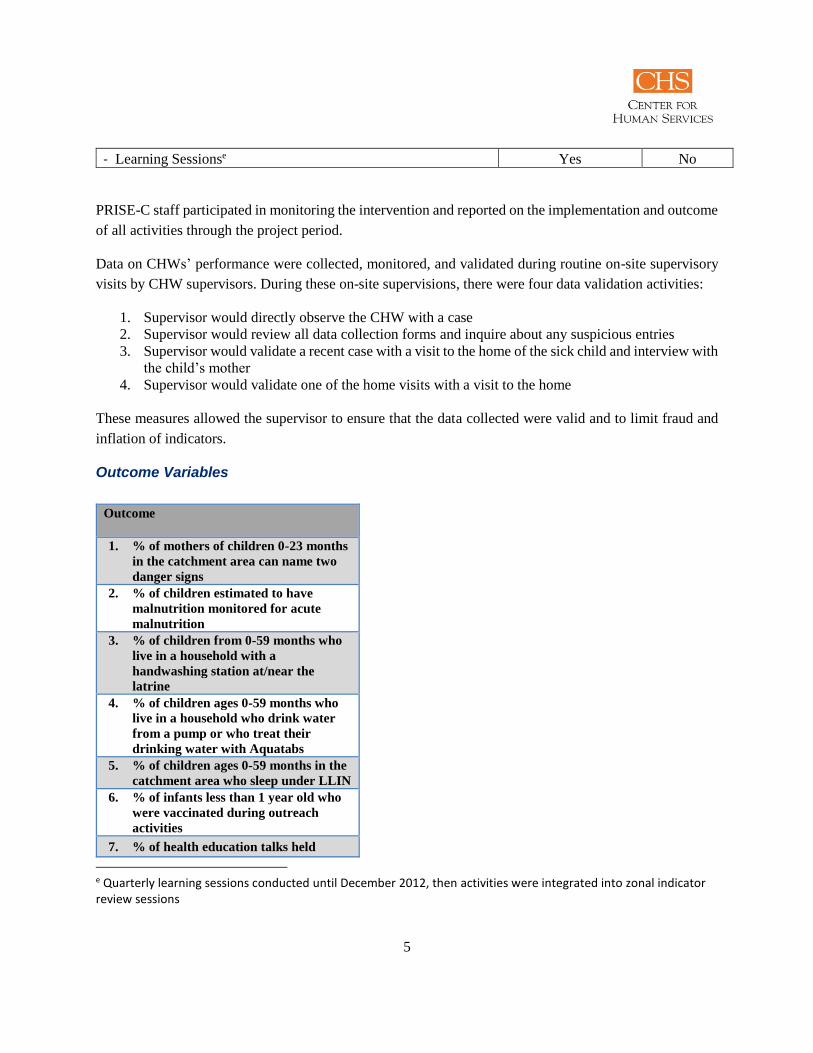
- Learning Sessionse Yes No
PRISE-C staff participated in monitoring the intervention and reported on the implementation and outcome
of all activities through the project period.
Data on CHWs’ performance were collected, monitored, and validated during routine on-site supervisory
visits by CHW supervisors. During these on-site supervisions, there were four data validation activities:
1. Supervisor would directly observe the CHW with a case
2. Supervisor would review all data collection forms and inquire about any suspicious entries
3. Supervisor would validate a recent case with a visit to the home of the sick child and interview with
the child’s mother
4. Supervisor would validate one of the home visits with a visit to the home
These measures allowed the supervisor to ensure that the data collected were valid and to limit fraud and
inflation of indicators.
Outcome Variables
e Quarterly learning sessions conducted until December 2012, then activities were integrated into zonal indicator review sessions
Outcome
1. % of mothers of children 0-23 months
in the catchment area can name two
danger signs
2. % of children estimated to have
malnutrition monitored for acute
malnutrition
3. % of children from 0-59 months who
live in a household with a
handwashing station at/near the
latrine
4. % of children ages 0-59 months who
live in a household who drink water
from a pump or who treat their
drinking water with Aquatabs
5. % of children ages 0-59 months in the
catchment area who sleep under LLIN
6. % of infants less than 1 year old who
were vaccinated during outreach
activities
7. % of health education talks held
6
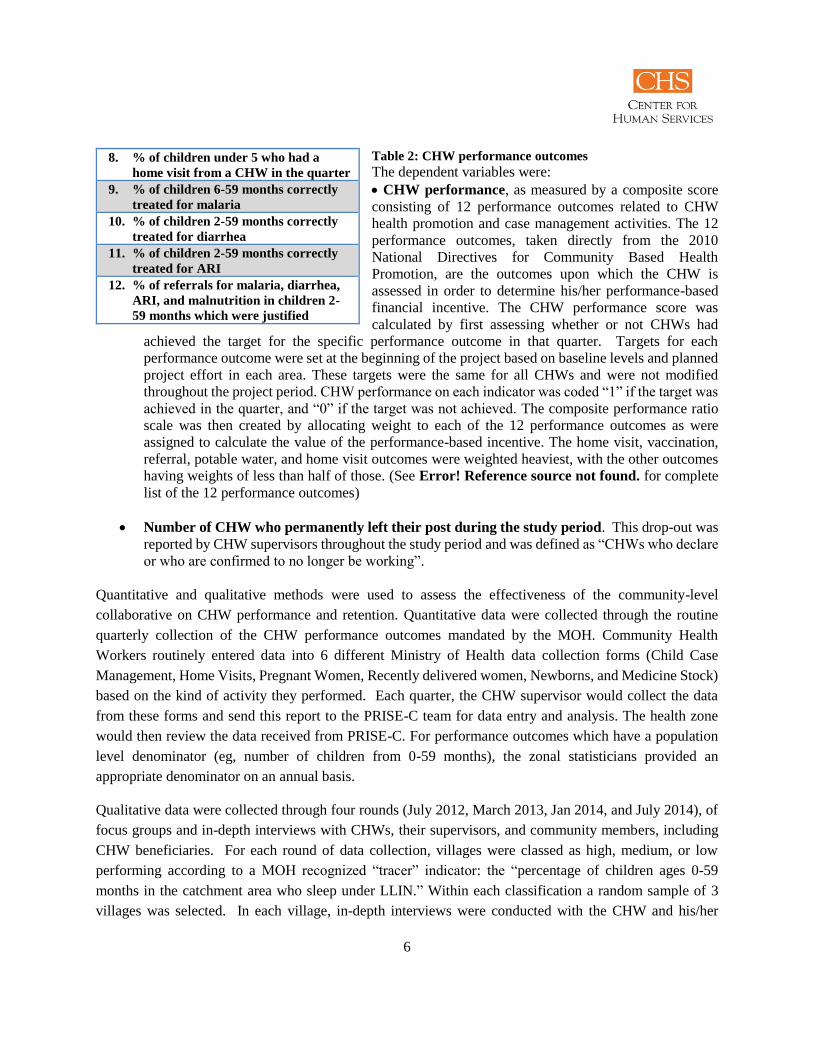
Table 2: CHW performance outcomes
The dependent variables were:
CHW performance, as measured by a composite score
consisting of 12 performance outcomes related to CHW
health promotion and case management activities. The 12
performance outcomes, taken directly from the 2010
National Directives for Community Based Health
Promotion, are the outcomes upon which the CHW is
assessed in order to determine his/her performance-based
financial incentive. The CHW performance score was
calculated by first assessing whether or not CHWs had
achieved the target for the specific performance outcome in that quarter. Targets for each
performance outcome were set at the beginning of the project based on baseline levels and planned
project effort in each area. These targets were the same for all CHWs and were not modified
throughout the project period. CHW performance on each indicator was coded “1” if the target was
achieved in the quarter, and “0” if the target was not achieved. The composite performance ratio
scale was then created by allocating weight to each of the 12 performance outcomes as were
assigned to calculate the value of the performance-based incentive. The home visit, vaccination,
referral, potable water, and home visit outcomes were weighted heaviest, with the other outcomes
having weights of less than half of those. (See Error! Reference source not found. for complete
list of the 12 performance outcomes)
Number of CHW who permanently left their post during the study period. This drop-out was
reported by CHW supervisors throughout the study period and was defined as “CHWs who declare
or who are confirmed to no longer be working”.
Quantitative and qualitative methods were used to assess the effectiveness of the community-level
collaborative on CHW performance and retention. Quantitative data were collected through the routine
quarterly collection of the CHW performance outcomes mandated by the MOH. Community Health
Workers routinely entered data into 6 different Ministry of Health data collection forms (Child Case
Management, Home Visits, Pregnant Women, Recently delivered women, Newborns, and Medicine Stock)
based on the kind of activity they performed. Each quarter, the CHW supervisor would collect the data
from these forms and send this report to the PRISE-C team for data entry and analysis. The health zone
would then review the data received from PRISE-C. For performance outcomes which have a population
level denominator (eg, number of children from 0-59 months), the zonal statisticians provided an
appropriate denominator on an annual basis.
Qualitative data were collected through four rounds (July 2012, March 2013, Jan 2014, and July 2014), of
focus groups and in-depth interviews with CHWs, their supervisors, and community members, including
CHW beneficiaries. For each round of data collection, villages were classed as high, medium, or low
performing according to a MOH recognized “tracer” indicator: the “percentage of children ages 0-59
months in the catchment area who sleep under LLIN.” Within each classification a random sample of 3
villages was selected. In each village, in-depth interviews were conducted with the CHW and his/her
8. % of children under 5 who had a
home visit from a CHW in the quarter
9. % of children 6-59 months correctly
treated for malaria
10. % of children 2-59 months correctly
treated for diarrhea
11. % of children 2-59 months correctly
treated for ARI
12. % of referrals for malaria, diarrhea,
ARI, and malnutrition in children 2-
59 months which were justified

7
supervisor as well as 2 members of the quality improvement team (in the intervention zone) and 2 members
of the village health and development committee (in the control zone). In each village, a focus group was
also held with 4 mothers of children under the age of 5.
Data were also collected on the costs of implementing the intervention, the community collaborative in
addition to the financial incentive program, as well as the costs of implementing the financial incentive
program alone in the control group, in order to calculate the cost-effectiveness of the improvement
intervention when used in combination with the performance-based incentive program for CHWs compared
to using only the performance-based incentive without additional intervention (Error! Reference source
not found.). Costs and effects were considered from the point of view of the program funder; therefore, the
effects on the patients and others in the health care system and society in general were not included in the
calculations.
The program outcome used was the difference in the proportion of CHWs achieving a high performance
score (defined as above 50% of the performance score) at end line compared to the proportion achieving a
high score at baseline. We used statistical analysis to estimate the effect of higher performance scores
attributable to the intervention. Cost data were collected from the project’s accounting records and divided
by the number of CHWs involved in the incentive program alone or the incentive program with the
improvement intervention. We used sensitivity analysis to determine how much influence each of the cost
inputs had on the cost-effectiveness model.
Results
Intervention Monitoring
In order to develop the intervention, formative research was conducted in the research area to determine
the demographic characteristics of both the CHWs and the beneficiary populations in the intervention and
control zones. Key community stakeholders were interviewed to develop quality improvement teams whose
composition was contextually appropriate.
In December 2011, the 31 villages in the intervention zone were divided into 4 collaboratives, and each
collaborative received a training in quality improvement. Thirty-four (34) of the 40 CHWs in the
intervention zone received the quality improvement training, along with approximately 2 community
representatives from each village. In January 2012, the project team traveled to each village to establish the
village Quality Improvement Teams, which would participate in the collaborative. One village had 2 QITS.
Each QIT was composed of:
o Community Health Worker
o Village Chief
o Secretary and Treasurer of the Village Health Committee
o Representative of the women
o Representative of the youth
o Representative from each village hamlet

8
o Representative from each ethnic group
o Representative from each religious group
PRISE-C monitored QITs from January 2012 until April 2014. Over the period, 75% of QITs held monthly
meetings with the CHW to review community health data, prioritize community health issues, and identify
strategies to address them.
Supervisors in the intervention zone received a 2 day coaching training in July of 2012, and worked with
the QIT at least once a month to present the performance outcome data back to the QIT.
Baseline
At baseline, there were no significant differences in number of trainings received, number of children
covered by each CHW, or number of households covered by each CHW between the two zones (Table 3).
Age was found to be significantly different, with the control zone having a slightly higher mean age than
the intervention zone (44 vs 37, p<.05).
Table 3: CHW background information
DAGLA SAO
Total N=48 Total N=39
N Mean N Mean p
Age 44 37 37 33 0.0283
Number of trainings
received 44 3 37 3 0.1321
Number of children
covered by each CHW 44 111 31 100 0.5489
Number of households
covered by each CHW 44 74 31 83 0.5771
Gender, occupation, and years of service as a CHW were all additionally found to be statistically different
at baseline. The control zone had more male CHWs and more farmer CHWs than the intervention zone.
The CHWs in the control zone also had been serving as CHWs for a longer period of time (Table 4).
Table 4: CHW socio-demographic information
DAGLA (Control) SAO (Intervention)

9
Total N N % Total N N % x2 p
Gender 48 39 7.8219 0.005
Male 34 70.83% 16 41.03%
Female 14 29.17% 23 58.97%
Occupation 48 38 10.5959 0.014
Farmer 34 70.83% 18 47.37%
Health Aide 1 2.08% 0 0%
Small Business 5 10.42% 15 39.47%
Housewife 8 16.67% 5 13.16%
Education Level 47 38 1.5221 0.467
Literate 2 4.26% 1 2.63%
No schooling 4 8.51% 1 2.63%
Attended School 41 87.23% 36 94.74%
Marital Status 47 37 3.6614 0.16
Single 3 6.40% 0
Divorced 0 1 2.70%
Married 44 93.60% 36 97.30%
Income Level 44 37 0.6602 0.883
<10,000 cfa 9 20.45% 7 18.92%
10,000-29,000 cfa 13 29.55% 14 37.84%
30,000-50,000 cfa 17 38.64% 12 32.43%
>50,000 cfa 5 11.36% 4 10.81%
Years as a CHW 43 37 8.5586 0.014
< 1 year 8 18.60% 16 43.24%
1-3 years 20 46.51% 7 62.16%
>3 years 15 34.88% 14 37.84%
Performance
The mean CHW performance scores in the 2 zones were compared using a t-test, and no statistical
difference was found at baseline (p=0.7723). Mean CHW performance scores were statistically different
at endline (p=0.0003) (Table 5). Trends over time in mean CHW performance score are shown in Figure
1.

10
Table 5: Mean CHW Performance Score
Baseline Endline
Mean CHW
performance score
Range Mean CHW
performance score
Range
Dagla (Control) n=48 n=42
0.197 .0014-.8874 0.490 .1094-.8874
Sao
(Intervention)
n=39 n=39
0.186 .0014-.5734 0.668 .1634-.9634
Since we were looking to see if there was a difference in the mean CHW performance over time between
the two groups, a repeated-measures analysis of variance (ANOVA) was used to examine the effects of the
intervention, time, and the interaction between them. Results showed a significant effect of the interaction
between the intervention and time on CHW performance score (F9, 86=8.23, p < .01). There was also a
significant effect of time (F9, 86=34.59, p < .01), but the effect of the intervention alone, not taking time
into account, was not significant (F1, 86=0.39, p = 0.535).
.2.4
.6.8
CH
W p
erfo
rman
ce s
core
1 2 3 4 5 6 7 8 9 10Quarter
SAO (Intervention) DAGLA (Control)
Mean CHW performance score over time in intervention and control zones
Figure 1: Mean CHW performance score over time
11
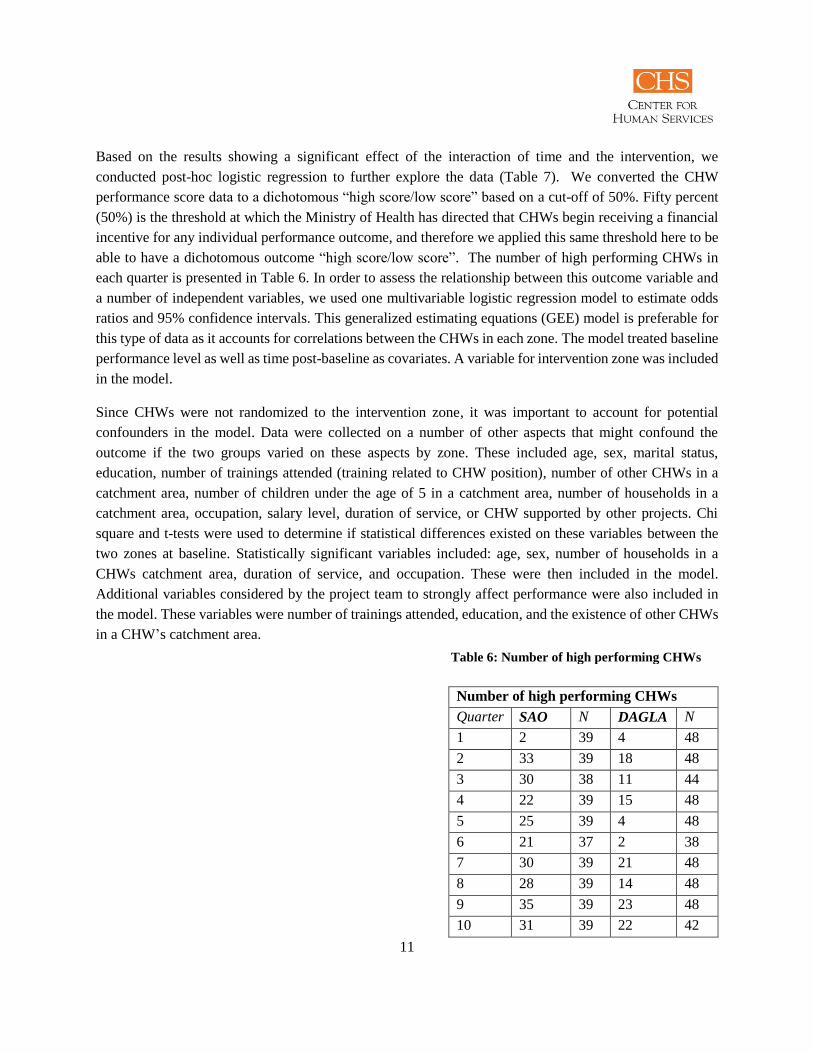
Based on the results showing a significant effect of the interaction of time and the intervention, we
conducted post-hoc logistic regression to further explore the data (Table 7). We converted the CHW
performance score data to a dichotomous “high score/low score” based on a cut-off of 50%. Fifty percent
(50%) is the threshold at which the Ministry of Health has directed that CHWs begin receiving a financial
incentive for any individual performance outcome, and therefore we applied this same threshold here to be
able to have a dichotomous outcome “high score/low score”. The number of high performing CHWs in
each quarter is presented in Table 6. In order to assess the relationship between this outcome variable and
a number of independent variables, we used one multivariable logistic regression model to estimate odds
ratios and 95% confidence intervals. This generalized estimating equations (GEE) model is preferable for
this type of data as it accounts for correlations between the CHWs in each zone. The model treated baseline
performance level as well as time post-baseline as covariates. A variable for intervention zone was included
in the model.
Since CHWs were not randomized to the intervention zone, it was important to account for potential
confounders in the model. Data were collected on a number of other aspects that might confound the
outcome if the two groups varied on these aspects by zone. These included age, sex, marital status,
education, number of trainings attended (training related to CHW position), number of other CHWs in a
catchment area, number of children under the age of 5 in a catchment area, number of households in a
catchment area, occupation, salary level, duration of service, or CHW supported by other projects. Chi
square and t-tests were used to determine if statistical differences existed on these variables between the
two zones at baseline. Statistically significant variables included: age, sex, number of households in a
CHWs catchment area, duration of service, and occupation. These were then included in the model.
Additional variables considered by the project team to strongly affect performance were also included in
the model. These variables were number of trainings attended, education, and the existence of other CHWs
in a CHW’s catchment area.
Number of high performing CHWs
Quarter SAO N DAGLA N
1 2 39 4 48
2 33 39 18 48
3 30 38 11 44
4 22 39 15 48
5 25 39 4 48
6 21 37 2 38
7 30 39 21 48
8 28 39 14 48
9 35 39 23 48
10 31 39 22 42
Table 6: Number of high performing CHWs

12
Table 7 : The adjusted effect of intervention/control group and baseline CHW performance on endline CHW
performance
Variable Adjusted
Odds Ratio
95% CI p-value
Intervention zone
REF: DAGLA (Control Zone)
11.56 6.21-21.52 0.00
Baseline high performance score (Yes/No)
REF: No high score at baseline
6.33 2.41-16.62 0.00
Time (Quarter) 1.09 1.02-1.17 0.01
Agef 1.05 1.01-1.10 0.007
Number of trainings receivedg 0.92 0.78-1.10 0.364
Number of other CHWs in the village 1.19 0.79-1.77 0.405
Education levelh
REF: No schooling
3.35 0.75-14.96 0.113
Sex
REF: Female
1.04 0.46-2.35 0.918
Number of households in the catchment area 1.00 .99-1.00 0.535
Years of service as a CHW 1.22 0.87-1.71 0.247
Occupationi
REF: Farmer
1.17 0.83-1.64 0.369
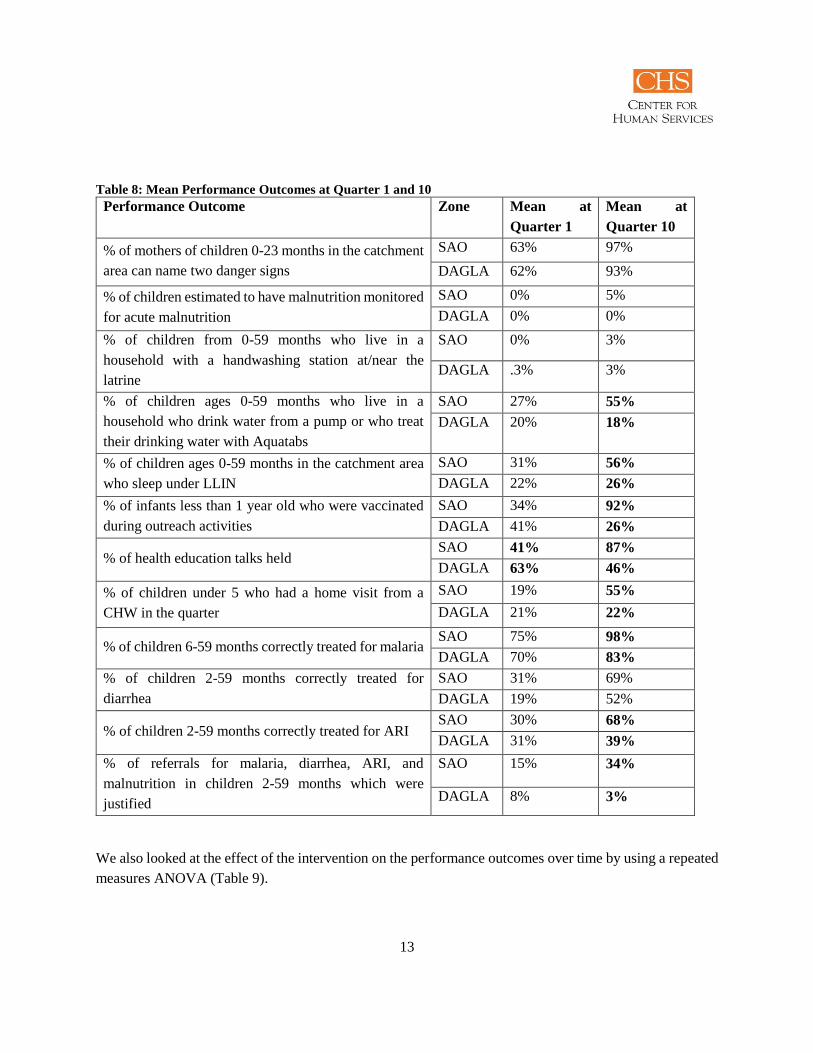
We also conducted analyses for each of the performance outcomes in the overall performance indicator.
We used t-test analysis to determine if there was a statistically significant difference between the means of
each indicator at baseline (quarter 1) and endline (Quarter 10) (Table 8). Statistically significant differences
in the means at each quarter are bold.
f Age in years at initiation of study g Number of trainings related to the CHW’s work that he/she ever has participated in h No schooling(REF)/Literate/Attended school i Farmer/Health Aide/Small Business Person/Housewife
13
Table 8: Mean Performance Outcomes at Quarter 1 and 10
Performance Outcome Zone Mean at
Quarter 1
Mean at
Quarter 10
% of mothers of children 0-23 months in the catchment
area can name two danger signs
SAO 63% 97%
DAGLA 62% 93%
% of children estimated to have malnutrition monitored
for acute malnutrition
SAO 0% 5%
DAGLA 0% 0%
% of children from 0-59 months who live in a
household with a handwashing station at/near the
latrine
SAO 0% 3%
DAGLA .3% 3%
% of children ages 0-59 months who live in a
household who drink water from a pump or who treat
their drinking water with Aquatabs
SAO 27% 55%
DAGLA 20% 18%
% of children ages 0-59 months in the catchment area
who sleep under LLIN
SAO 31% 56%
DAGLA 22% 26%
% of infants less than 1 year old who were vaccinated
during outreach activities
SAO 34% 92%
DAGLA 41% 26%
% of health education talks held SAO 41% 87%
DAGLA 63% 46%
% of children under 5 who had a home visit from a
CHW in the quarter
SAO 19% 55%
DAGLA 21% 22%
% of children 6-59 months correctly treated for malaria SAO 75% 98%
DAGLA 70% 83%
% of children 2-59 months correctly treated for
diarrhea
SAO 31% 69%
DAGLA 19% 52%
% of children 2-59 months correctly treated for ARI SAO 30% 68%
DAGLA 31% 39%
% of referrals for malaria, diarrhea, ARI, and
malnutrition in children 2-59 months which were
justified
SAO 15% 34%
DAGLA 8% 3%
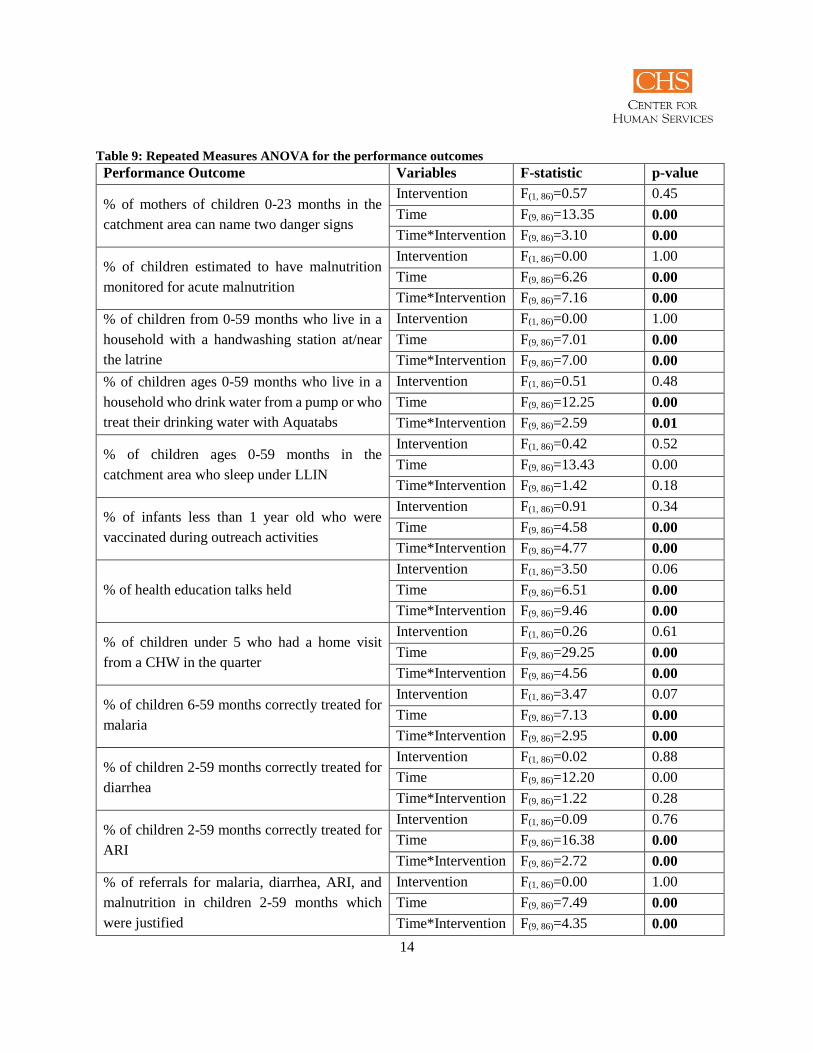
We also looked at the effect of the intervention on the performance outcomes over time by using a repeated
measures ANOVA (Table 9).
14
Table 9: Repeated Measures ANOVA for the performance outcomes
Performance Outcome Variables F-statistic p-value
% of mothers of children 0-23 months in the
catchment area can name two danger signs
Intervention F(1, 86)=0.57 0.45
Time F(9, 86)=13.35 0.00
Time*Intervention F(9, 86)=3.10 0.00
% of children estimated to have malnutrition
monitored for acute malnutrition
Intervention F(1, 86)=0.00 1.00
Time F(9, 86)=6.26 0.00
Time*Intervention F(9, 86)=7.16 0.00
% of children from 0-59 months who live in a
household with a handwashing station at/near
the latrine
Intervention F(1, 86)=0.00 1.00
Time F(9, 86)=7.01 0.00
Time*Intervention F(9, 86)=7.00 0.00
% of children ages 0-59 months who live in a
household who drink water from a pump or who
treat their drinking water with Aquatabs
Intervention F(1, 86)=0.51 0.48
Time F(9, 86)=12.25 0.00
Time*Intervention F(9, 86)=2.59 0.01
% of children ages 0-59 months in the
catchment area who sleep under LLIN
Intervention F(1, 86)=0.42 0.52
Time F(9, 86)=13.43 0.00
Time*Intervention F(9, 86)=1.42 0.18
% of infants less than 1 year old who were
vaccinated during outreach activities
Intervention F(1, 86)=0.91 0.34
Time F(9, 86)=4.58 0.00
Time*Intervention F(9, 86)=4.77 0.00
% of health education talks held
Intervention F(1, 86)=3.50 0.06
Time F(9, 86)=6.51 0.00
Time*Intervention F(9, 86)=9.46 0.00
% of children under 5 who had a home visit
from a CHW in the quarter
Intervention F(1, 86)=0.26 0.61
Time F(9, 86)=29.25 0.00
Time*Intervention F(9, 86)=4.56 0.00
% of children 6-59 months correctly treated for
malaria
Intervention F(1, 86)=3.47 0.07
Time F(9, 86)=7.13 0.00
Time*Intervention F(9, 86)=2.95 0.00
% of children 2-59 months correctly treated for
diarrhea
Intervention F(1, 86)=0.02 0.88
Time F(9, 86)=12.20 0.00
Time*Intervention F(9, 86)=1.22 0.28
% of children 2-59 months correctly treated for
ARI
Intervention F(1, 86)=0.09 0.76
Time F(9, 86)=16.38 0.00
Time*Intervention F(9, 86)=2.72 0.00
% of referrals for malaria, diarrhea, ARI, and
malnutrition in children 2-59 months which
were justified
Intervention F(1, 86)=0.00 1.00
Time F(9, 86)=7.49 0.00
Time*Intervention F(9, 86)=4.35 0.00

15
The qualitative data reveal how the CHWs, supervisors, and beneficiaries feel about the different
approaches to CHW motivation; the different ways that the approaches served to engage the community
with the CHW; and how the approaches impacted the performance of the CHWs.
One CHW in a high performing village in SAO (intervention zone) said:
“In the process of our work, we conduct evaluations (learning sessions). During the first
evaluation (learning session), I was ranked xj out of 9 CHWs. I wasn’t ready for that. Because of
this, I reapplied myself to my work to be able to be first or to keep my place in the rankings.”
A CHW from a high performing village in SAO (intervention zone) said:
“After each training, I come back and brief the QIT, and they help me to spread the message among
the population as well as do the work. The QIT members help a lot so that during the next learning
sessions we can remain on top. We can’t allow our activities to slip; we have to continue to do
better.”
Two beneficiaries, mothers of children under the age of 5, in a focus group in a high performing village in
SAO said:
“The members of the QIT also play their role…They come with me to conduct health education
sessions. If there are certain members of the community who don’t want to adopt healthy behaviors,
they lead the way to help convince them.”
And:
“When it was only her telling us, we ignored her; sometimes we would send her away. But now
that she works with the community members, we understand that [what she is telling us] is for our
own good.”
A CHW from a high performing village in DAGLA (control zone) said:
“(What motivates me?)…The first thing is training; the second is the financial incentives; and the
third is the support of the CVS (Village Health Committee), which manages everything.”
A supervisor from DAGLA (Control zone) observed:
j Rank not indicated to anonymize the data.
16
“There is a change in the CHWs, which has to do with the incentives they now receive. In addition,
there is supervision during which we tell them that we’re assessing the best performers and that
their incentive will be increased [if they perform]. Then they do their work better.”
A CHW from a low performing village in DAGLA (control zone) said:
“The fact that I am referred to as a health worker even though I am not, I am honored. When they
bring me a sick or malnourished child, I can care for them; that makes me happy, I have never
been so honored.”
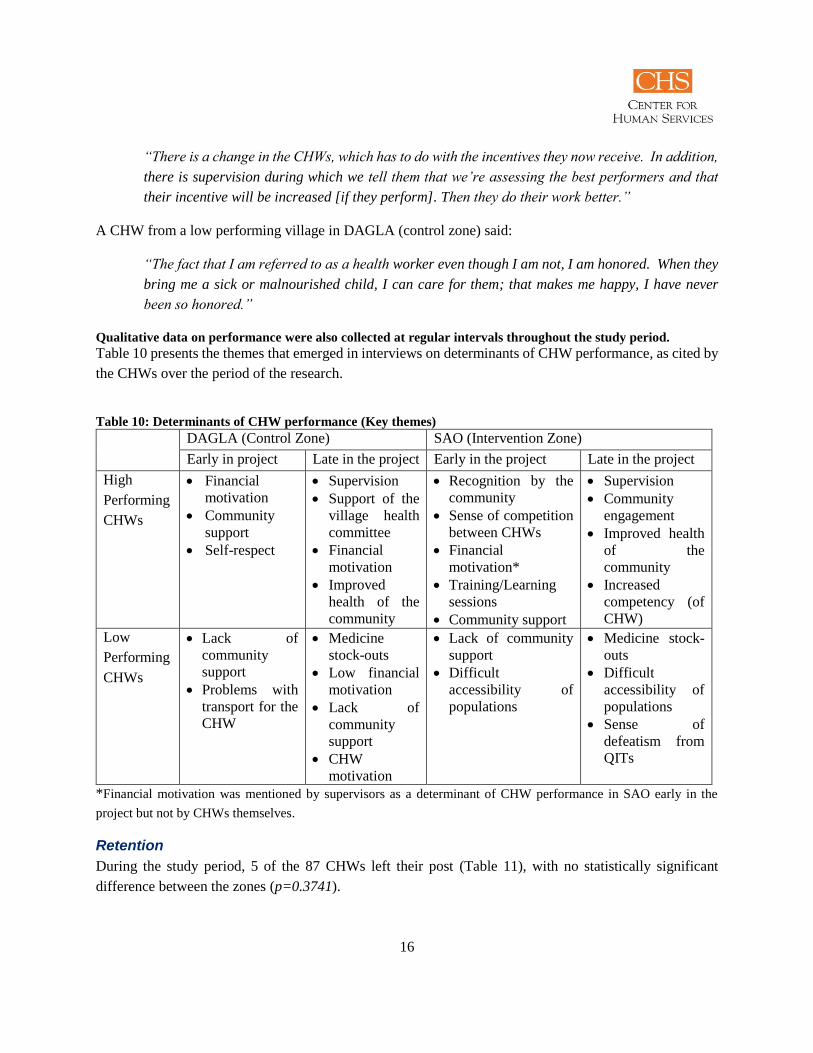
Qualitative data on performance were also collected at regular intervals throughout the study period.
Table 10 presents the themes that emerged in interviews on determinants of CHW performance, as cited by
the CHWs over the period of the research.
Table 10: Determinants of CHW performance (Key themes)
DAGLA (Control Zone) SAO (Intervention Zone)
Early in project Late in the project Early in the project Late in the project
High
Performing
CHWs
Financial
motivation
Community
support
Self-respect
Supervision
Support of the
village health
committee
Financial
motivation
Improved
health of the
community
Recognition by the
community
Sense of competition
between CHWs
Financial
motivation*
Training/Learning
sessions
Community support
Supervision
Community
engagement
Improved health
of the
community
Increased
competency (of
CHW)
Low
Performing
CHWs
Lack of
community
support
Problems with
transport for the
CHW
Medicine
stock-outs
Low financial
motivation
Lack of
community
support
CHW
motivation
Lack of community
support
Difficult
accessibility of
populations
Medicine stock-
outs
Difficult
accessibility of
populations
Sense of
defeatism from
QITs
*Financial motivation was mentioned by supervisors as a determinant of CHW performance in SAO early in the
project but not by CHWs themselves.
Retention
During the study period, 5 of the 87 CHWs left their post (Table 11), with no statistically significant
difference between the zones (p=0.3741).

17
Table 11: CHW attrition
The qualitative data revealed that
the majority (4/5) of CHWs left
their post because they no longer
lived in the village of service.
This was due to marriage, starting a job in another city, and other unspecified reasons. The remaining CHW
left his post because of a health problem with his eyes, which left him unable to read and complete the
registers. Four CHWs were able to be located to be asked further follow-up questions about their decision
to leave. All responded that the financial incentives were not bad but were insufficient. Two out of the four
(1/2) stated that their community encouraged them while they were in their role as CHW, while the other
two (1/2) stated that their community did not encourage them.
Cost-Effectiveness
The baseline proportion of CHWs who had a high performance score was 0.069. The increase in the
proportion attributable to the improvement intervention when combined with the incentive program was
0.92 compared to the effect of incentives alone. The cost of training and providing performance-based
incentives to the 48 CHWs in the control group was 5.3 million FCFA or 110,000 FCFA per CHW. The
cost of the training, performance-based incentive package, and improvement intervention combined was 13
million FCFA for the 39 CHWs or 340,000 FCFA per CHW participant (Table 12). Incremental cost-
effectiveness analysis allows us to determine the marginal or incremental cost for an additional unit of
health benefit when looking at two different interventions. The incremental cost-effectiveness ratio (ICER)
in this case tells us the cost per CHW achieving a high performance score. The ICER result was 650,000
FCFA per CHW who achieved a high performance score (95% CI 463,000 – 964,000).
Table 12: Observed costs in the intervention and control regions
Cost Item Costs (X
1,000 FCFA) Costs (USD)
DAGLA
(Dassa-
Glazoue)
Control
Zone
Travel - community health action plan meeting 84 $ 178
Per diems - community health action plan meeting 242 $ 512
Travel - IMCI-C trainings 288 $ 609
Travel & material - supervision refresher training 168 $ 355
Per diem - supervision refresher training 408 $ 863
Meals etc - supervision refresher training 349 $ 738
PRISE-C staff - supervision refresher training 264 $ 558
Travel / per diem - monthly supervision meetings 1176 $ 2,487
Travel - onsite-supervision 18 $ 38
PRISE-C staff providing support 32 $ 68
Performance-based incentives 2240 $ 4,737
DAGLA
(Control Zone)
SAO
(Intervention Zone)
CHWs leaving their post 4 1
CHWs retained 44 38

18
Total Costs DAGLA 5269 $ 11,142
SAO
(Save-
Ouesse)
Intervention
Zone
Travel - IMCI-C trainings 432 $ 914
Per diem - supervision refresher training 384 $ 812
Travel & material - supervision refresher training 239 $ 505
Meals etc - supervision refresher training 392 $ 829
PRISE-C staff - supervision refresher training 264 $ 558
Travel / per diem - monthly supervision meetings 1103 $ 2,332
Travel - onsite-supervision 25 $ 53
PRISE-C staff providing support to on-site supervisions 32 $ 68
Performance-based incentives 1822 $ 3,853
Travel for QI training 114 $ 241
Per diems for QI training 591 $ 1,250
Meals and other costs for the QI training 260 $ 550
Travel for coaching visits 34 $ 72
Salaries for coaches 178 $ 376
PRISE-C staff providing support to on-site coaching
visits 63 $ 133
Travel for learning sessions 1121 $ 2,370
Per diems for learning sessions 2607 $ 5,513
Meals and other costs for learning sessions 2126 $ 4,496
PRISE-C staff providing support to learning sessions 1468 $ 3,104
Communication costs for learning sessions 20 $ 42
Total Costs SAO 13273 $ 28,067
The tornado diagram in Figure 2 shows the relative effect of each variable on the incremental cost-
effectiveness ratio as the specified input decreases from the value in the model down to 0. The variable with
the greatest influence on cost-effectiveness is the effect of the intervention: as the effect of the intervention
diminishes to 0, the incremental cost-effectiveness ratio increases significantly from the baseline of 650,000
FCFA per CHW who achieved a high performance score to nearly 5,000,000 FCFA per CHW who achieved
a high performance score, holding all other variables constant. The number of CHWs trained in both the
intervention and control groups has the next most significant effect on the overall result. All of the cost
variables considered individually have a relatively insignificant effect on the overall result, with
performance-based incentives cost being the most influential.

19
Figure 2: Sensitivity analysis of cost-effectiveness model inputs
Discussion
Performance
The study demonstrates that it is possible to improve CHW performance through application of a
community-level quality improvement collaborative approach. The data demonstrate that the mean CHW
performance score differed significantly over time between the intervention and control group, and that this
0 2,000,000 4,000,000
Effect of intervention
Number of CHWs (int)
Number of CHWs (control)
Performance-based incentive (Int)
Performance-based incentive (Control)
Travel-monthly supervision (int)
Travel-monthly supervision (Control)
Per diems - QI training
Travel IMCI training (int)
Supervision refresher training (int)
Per diem - supervision refresher training (int)
Per diem - supervision refresher training (control)
Supervision refresher training (control)
QI training (int)
Travel - supervision refresher training (int)
Travel - IMCI-C trainings (control)
PRISE-C staff - supervision refresher training (control)
Salaries for coaches (int)
Travel - supervision refresher training (control)
Travel - QI training (int)
Per diems - community health action plans meeting (control)
PRISE-C staff - supervision refresher training (control)
PRISE-C staff - supervision refresher training (int)
Travel for onsite-supervision (control)
Travel for coaching visits (int)
Travel for onsite-supervision (int)
Change in incremental cost-effectiveness (FCFA) per CHW with a high performance score
Mo
de
l In
pu
ts
Sensitivity analysis of cost-effectiveness model inputs
650,000

20
pattern held for 10 of the 12k performance outcomes included in the overall performance score. Based on
observing the trend lines for mean CHW performance over time in the two zones (Figure 1) we can see a
large difference initially which then varies over time, diminishing in certain quarters. This variability in
the difference between performance in the two zones is likely the reason behind the significance of the
intervention over time, but the lack of significance of the intervention alone in the Repeated Measures
ANOVA analysis.
CHWs who received the community-level quality improvement collaborative intervention have over 11
times the odds of achieving a performance score above 50% as compared to CHWs who received financial
incentives alone. These results are likely due to certain activities of the intervention that drove an
appropriation of the indicators and by extension, the work of the CHWs, by the community itself. The
creation of the quality improvement team created a new kind of engagement for community. As opposed
to simply discussing community health activities once a year as a part of the annual work planning, as is
generally the case with the Village Health Committees (CVSs), the QIT is engaged in monthly meetings
with the CHW to analyze their indicators with the CHW and together make decisions on how to improve
on those indicators. In addition, QIT members expressed a feeling of responsibility for the health status of
the community, and provided instrumental support to the CHW to do his or her work. This instrumental
support was guided by discussions during coaching visits by supervisors, which allowed for facilitated
identification of problems and development of improvements which the QIT and CHW could undertake.
The quarterly learning sessions were a venue for CHWs and QITs to share experiences, and accelerated up-
take of improvements which worked. The learning sessions also created a sense of healthy competition
between the communities towards improvement on the indicators.
The two performance outcomes which did not show significant differences at endline were for proportion
of children under 5 sleeping under a long-lasting insecticide treated bednets and proportion of children
correctly treated for diarrhea. During data collection in both zones, it was observed that many mosquito
nets being used were damaged, which excluded them from being counted in the numerator. Unfortunately,
there was no distribution campaigns for nets after the initiation of the research, and health centers did not
have any in stock. The low performance on correct treatment for diarrhea may also be attributed to
challenges in the stock of ORS across the zones. These issues would have limited the number of CHWs in
either zone who could achieve a “high score” in each outcome.
Plateaus or drops in performance were observed over certain time periods, as mentioned above, typically
in both SAO and DAGLA. In quarters 2 through 4 of the study period, there were challenges in facilitating
the payments for some of the CHWs which caused delays in their payments and may have demotivated
them. Additionally this period coincides with critical harvest and planting seasons for staple crops (cashew
nuts and ignames) in Benin, and this may have resulted in CHWs not being able to carry out their
k Means for % of children sleeping under a LLIN and % of children correctly treated for diarrhea were not significantly different over time.
21
responsibilities. During this period there were also a number of supervisors who were not available to
conduct their monthly supervision visits, and so these visits did not occur with the required frequency during
this time.
The dramatic decline in mean performance in DAGLA during quarter 4 through 6 of the study period need
to be further explored. The drop-off in performance in both SAO and DAGLA from quarter 9 of the study
period is likely due to the circulation of the news of the end of the project. Many CHWs and supervisors
communicated that this was demotivating to them, since they did not know if the support they received,
through supervision visits, QIT encouragement, and financial incentives would be sustained after the end
of the project.
Qualitative data bear this out, as the sense of competition and community recognition were determinants of
CHW performance at the start of the intervention. Over the life of the intervention, though, these
determinants were replaced with community engagement and improved competency of the CHW.
Interestingly, supervision emerged as a determinant for both the intervention and control zone. This is likely
due to the overall project focus on strengthening the CHW supervisory system.
Our overall findings are in line with past evaluations in Benin, which have demonstrated that the
collaborative approach can show results in CHW performance indicators (Freeman P et al., 2012), as well
as findings that have shown the success of the collaborative approach to improve health worker performance
in health centers and hospitals in developing country settings, including Benin (Catsambas T et al., 2008;
Lynn Miller-Franco and Lani Marquez, 2011). This accomplishment is likely due to the way in which the
collaborative approach fosters the engagement of both the community health worker and the community
itself in the process of improvement and helps both sides understand how processes work and how to make
changes at the community level that have the potential to improve the community’s health (Catsambas T
et al., 2008). Furthermore, the sharing of changes and results motivates communities to work hard and
produce good results in a sustained manner.
It is important to note, however, that CHWs who started out with a high score at baseline have 6.33 times
the odds of having a high score at endline. This indicates that independent of the intervention, there is a
pattern in CHW performance that high performing CHWs at the beginning of this intervention are likely to
sustain that high performance throughout the intervention. There was no significant difference in the
proportion of CHWs with a high performance score at baseline between the intervention and control zone.
Retention
The study results do not demonstrate that the intervention is associated with higher rates of CHW retention.
Attrition rates for CHWs from 3.4% to 77% have been reported in the literature, with higher rates generally
associated with volunteer CHWs (Bhattacharyya K et al., 2001). Previous findings from other areas of
Benin report a 7% CHW annual attrition rate (Freeman P et al., 2012), although it is unclear how this
number was calculated. Our findings reflect even lower annual attrition rates (1%-3%) in the study zones

22
over the study period. With these low attrition rates, it would be difficult for an intervention to demonstrate
significant change in CHW retention.
The qualitative data show that the primary reason for the limited attrition in CHWs in the study zones is
relocation because of a new/different job which would provide a more consistent salary. Since the reason
behind the majority of the attrition was financial, it is logical that the intervention would not have a
significant impact on attrition. If alternatively, the reason for most of the attrition was poor motivation or
lack of community support, in that case, we would expect to see differences in the levels of attrition between
the intervention and control zones.
The fact that economics were the main driver for CHW attrition in this study reinforces the idea that one of
the challenges of the CHW role as it currently exists is that it is not a formal salaried position. The limited
financial incentive provided under the performance based incentives is primarily a recognition of time and
effort expended and is not sufficient to allow the worker to be able to support themselves. It is important
to differentiate these financial reasons for attrition which were seen in this study, from reasons which have
more to do with lack of interest in the content.
These data also demonstrate that the CHW is seen to be the holder of certain knowledge in the community,
and that this affords him or her a certain status in the community, which can motivate them to perform well
as shown in some of the qualitative data, and also keep the CHW in their position for a longer period of
time. This can have positive or negative impacts, depending on the level of performance of the CHW over
time. For example, if a CHW gained a high status in the community and then stated performing poorly,
their high status could make it difficult to replace them, unless the poor performance then resulted in a
diminished status in the community.
Cost-Effectiveness
Even though CHW programs are expected to improve the cost-effectiveness of health care systems by
reaching large numbers of previously underserved people with high-impact services at low cost, there is a
dearth of cost-effectiveness data on community health worker programs (Berman et al., 1987; Lehmann U
and Sanders D, 2007). This study found that the cost per additional CHW achieving a high performance
score is 650,000 or $1 290 USD, which is slightly less than two times the Gross Domestic Product per
capita of Benin (World Bank). The World Health Organization’s guidance states that for a health
intervention to be considered “highly cost-effective,” the cost-effectiveness must be less than the gross
domestic product per capita for each disability adjusted life year saved. This would mean that for the
program to be considered highly cost-effective, each CHW achieving a high performance score would need
to avert 1.7 DALYs more than a CHW achieving lower than the high score.
The Ministry of Health recently trained 100 additional CHWs in the intervention zone. These CHWs did
not participate in the intervention during the study period, but if these 100 additional CHWs were included
in a future improvement intervention, the cost-effectiveness would improve to approximately 30,800 FCFA
23
per CHW who achieved a high performance score (95% confidence interval: 23,000 – 39,000). The large
difference between this scenario and the one observed is because one of the main determinants of the result
is the number of CHWs participating at a given cost. The overall cost of the intervention is dependent on a
number of fixed costs which do not increase based on the number of participants, therefore increasing the
number of CHW participants from 39 to 139 for the same cost made for a dramatically more efficient
improvement intervention.
If 100 additional CHWs participate in the improvement intervention at no additional expense, the high-
scoring CHW would then only need to avert 0.07 DALYS, because the ICER drops to 30,000 CFA or $61
per additional CHW achieving a high score. With the current data available, we cannot estimate the value
in DALYs for improved CHW performance. Therefore we rely heavily on the validity of the performance
score in measuring their effectiveness at improving health outcomes among those under their care. A more
extensive, long term study is required to firmly establish the link between participation in the improvement
intervention with the incentive program and health outcomes among those served by the CHWs. Without
this additional information, we can only state that, with higher levels of CHW participation, cost of the
intervention per high performing CHW would decrease, which would increase the likelihood that the
improvement intervention may be acceptable to the Ministry of Health. Further assessment would be needed
to establish the number of CHWs needed for this intervention to be cost-effective according to the Ministry
of Health
From the sensitivity analysis, it appears that the cost of the performance-based incentives is a small part of
the overall cost of the intervention. Since the beginning of project activities, PRISE-C worked closely with
the mayor’s office in each zone, setting up the payment systems for the performance-based incentives in
collaboration with the mayor’s office, with the end goal of ultimately transitioning the budget for the
performance-based incentives to the mayor’s office in order to make the system more sustainable. This
effort has been successful, as it is planned, and has been budgeted, that the costs of the performance-based
incentives will be borne by the mayor’s offices in the project research zones starting in the next calendar
year. We believe that this contributes to the sustainability of these payments, since the mayor’s office is a
permanent structure, unlike project which are time-bound. Future funders of this intervention, be they
external or the MOH, would therefore likely see very little difference in the cost-effectiveness result, as
compared with results presented here, if they continue with implementing the intervention. The difference
would increase, though, if for some reason the mayor’s office is unable to cover the costs of the
performance-based incentives in the future.
Limitations
This research has several limitations. The study was limited by the choice of intervention and control zone
based on the zones in which the overall project was working. SAO and DAGLA share a border and the
control zone could potentially have been contaminated through hearing of the collaborative and its
activities. Choosing zones further apart could have reduced the likelihood of contamination. Furthermore,

24
the zones of SAO and DAGLA may not adequately represent the overall population of CHWs throughout
Benin.
A general limitation of the project is that since CHWs are not a part of the formal health system and are not
salaried workers, but rather receive a limited financial incentive to do their work, the level of effort they
can expend on CHW duties is often limited by the needs of their family. As seen in the sociodemographic
data, 52 of the 86 CHWs are farmers, who need to dedicate a significant amount of time to their fields.
Therefore, the performance of these farmer CHWs may be hampered by these competing activities and it
may never be able to reach the targets proposed by the project.
A limitation of the data analysis methodology is also that the chi-square tests for independence are based
on an assumption of randomization in the study design, which we were not able to do for this study.
As noted above, there was no direct way to link the performance of the CHWs with the health outcomes of
those whom they served. Having this information would have made for a more compelling case for the
efficiency of the intervention and allowed comparison with other health interventions. The economic
analysis considered only the perspective of the intervention funder or the health system and did not take
into account the broader economic impacts on beneficiaries receiving care from the CHWs, such as changes
in their out-of-pocket health spending. It is not clear whether inclusion of these amounts would have
increased or decreased the cost-effectiveness result.
Despite these limitations, there has already been strong interest in incorporating findings from this study
into local practice. The research team is working with the zonal health coordinator in the intervention
district to include several of the study’s indicators in routine supervisions of the CHWs. In addition, the
National Department of Public Health (DNSP) is examining how to scale-up the community empowerment
aspects of the community quality improvement collaborative.
Implications
The results of this operations research study shed a new light on a question which has remained elusive:
how to motivate community health workers to remain committed to their work, and to reach and maintain
strong performance. This study results demonstrate that in a low-resource setting a community-level quality
improvement collaborative combined with financial incentives provided to the health works is a feasible
and effective strategy to improve CHW performance as compared to financial incentives alone.in a low-
resource setting.
Inherent in the use of the improvement collaborative process are several features which are critical for
future program design and scale up of community health worker programs:
Engaging the community in a way that ensures responsibility for their own health situation: The
community-based improvement teams have proven to be an effective mechanism to do so as they
25
manage their own data, develop solutions that are doable and provide support for the CHWs to
achieve results.
The support and engagement on the part of the communities is embedded within the very process
of the collaborative- data review, finding their own solutions and ensuring that they are
implemented. The population has discovered that they could make improvements that were
within their reach, at low cost and that they could manage, pay for and continue implementing
them.
There are several potential angles for future related operations research. Among these are:
Community-based Quality Improvement Teams requires significant investment in time and
additional resources. A follow-on strategy worth studying would be the use of existing
community structures such as the Comité Villageois de Santé in Benin to assume similar roles
and responsibilities as a Quality Improvement Team. As such structures already often exist and
have legal status, there is a higher chance that they will continue carrying out measurement and
improvement activities.
Incorporation of psychosocial measures for the CHWs such as on self-efficacy would allow
researchers to better assess the mechanisms through which the intervention acts to improve
performance.
Testing additional modifications to the model used to reduce the number of learning sessions
from once a quarter to twice a year. Each arrondissement can hold its own review of results
during regular grouped supervision which would provide select lessons learned for the larger
learning sessions. If similar performance improvements are observed, this modified intervention
would be more cost-effective than the original.
When calculating the cost-effectiveness of a CHW intervention, it would be valuable to be able to
speak to the number of disability adjusted life years (DALYs) saved by high performance vs low
performance of the CHW package of services. Further research in this area would provide
important economic evidence to potentially allow for more effective advocacy for CHW
programming.
Testing the effects of the quality improvement collaborative as compared to a cadre of non-paid
volunteer CHWs. While not possible in Benin where payment of CHWs is now mandated by the
MOH, it would be interesting to measure the differences in the differences between performance
and retention of non-paid CHWs when they receive the quality improvement collaborative
intervention, and how that compares to the results seen here.

26
References
Alam, K., Tasneem, S., and Oliveras, E. (2012). Retention of female volunteer community health workers
in Dhaka urban slums: a case-control study. Health Policy Plan. 27, 477–486.
Banek, K., Nankabirwa, J., Maiteki-Sebuguzi, C., Diliberto, D., Taaka, L., Chandler, C.I., and Staedke,
S.G. (2014). Community case management of malaria: exploring support, capacity and motivation of
community medicine distributors in Uganda. Health Policy Plan.
Berman, P.A., Gwatkin, D.R., and Burger, S.E. (1987). Community-based health workers: head start or
false start towards health for all? Soc. Sci. Med. 1982 25, 443–459.
Bhattacharyya K, Winch P, LeBan K, and Tien M (2001). Community Health Worker Incentives and
Disincentives: How they Affect Motivation, Retention and Sustainability.
Catsambas T, Miller-Franco L, Guttman M, Knebel E, Hill P, and Lin Y (2008). Evaluating Health Care
Collaboratives: The experience of the Quality Assurance Project (Bethesda, MD: University Research Co.,
LLC).
Colvin, CJ (2013). What motivates Community Health Workers? Designing programs that incentivize
Community Health Worker performance and retention. In Developing and Strengthening Community
Health Worker Programs at Scale, (Washington DC: Jhpiego),.
Freeman P, Deussom G, Glele Y, and Paraiso N (2012). USAID/Benin: Integrated Community Case
Management (iCCM) Performance Evaluation.
George, A., Young, M., Nefdt, R., Basu, R., Sylla, M., Clarysse, G., Bannicq, M.Y., de Sousa, A., Binkin,
N., and Diaz, T. (2012). Community health workers providing government community case management
for child survival in sub-Saharan Africa: who are they and what are they expected to do? Am. J. Trop. Med.
Hyg. 87, 85–91.
Gray, DHH, and Ciroma J (19897). Attrition among Village Health Workers in Nigeria (Bethesda, MD:
PRICOR/University Research Co.,LLC).
Greenspan, J.A., McMahon, S.A., Chebet, J.J., Mpunga, M., Urassa, D.P., and Winch, P.J. (2013). Sources
of community health worker motivation: a qualitative study in Morogoro Region, Tanzania. Hum. Resour.
Health 11, 52.
Kaseje, D.C., Spencer, H.C., and Sempebwa, E.K. (1987). Characteristics and functions of community
health workers in Saradidi, Kenya. Ann. Trop. Med. Parasitol. 81 Suppl 1, 56–66.
Lehmann U, and Sanders D (2007). Community Health Workers: What do we know about them? (Geneva:
WHO).
Ludwick, T., Brenner, J.L., Kyomuhangi, T., Wotton, K.A., and Kabakyenga, J.K. (2014). Poor retention
does not have to be the rule: retention of volunteer community health workers in Uganda. Health Policy
Plan. 29, 388–395.

27
Lynn Miller-Franco, and Lani Marquez (2011). Effectiveness of collaborative improvement: evidence from
27 applications in 12 less-developed and middle-income countries. BMJ Qual. Saf. 20, 658–665.
Mamadou A, and Anato M (2009). Collaborative approach to community-baed malaria prevention in Benin
(Bethesda, MD: Plan USA).
Ministere de la Sante, Benin Annuaire des Statistiques Sanitaires 2013.
Olayo, R., Wafula, C., Aseyo, E., Loum, C., and Kaseje, D. (2014). A quasi-experimental assessment of
the effectiveness of the Community Health Strategy on health outcomes in Kenya. BMC Health Serv. Res.
14 Suppl 1, S3.
PISAF (2011). Rapport de l’atelier de partage des experiences sur la fonctionnalite des RC et la systeme de
supervision. (Bohicon).
The World Bank Benin GDP per capita, World Bank 2014, Website – World Bank Data,
http://data.worldbank.org/indicator/NY.GDP.PCAP.CD/countries/BJ?display=graph.
University Research Co., LLC (2012). PISAF Final Report (Bethesda, MD: URC).
Walt, G., Perera, M., and Heggenhougen, K. (1989). Are large-scale volunteer community health worker
programmes feasible? The case of Sri Lanka. Soc. Sci. Med. 1982 29, 599–608.
Wubneh H (1999). Gumer Child Survival Project and the Horses: an alternative and sustainable approach
to child survival programs. In Presented Papers: High Impact PVO Child Survival Programs, Volume 2,
(Published for the PVO community and the US Agency for International Development by the Child
Survival Collaboration and Resources Group (CORE) and Basic Support for Institutionalizing Child
Survival Project (BASICS II)), pp. 124–133.