Embed Size (px)
Citation preview

A Closer Look at Disproportionate Minority Confinement in the North Carolina
Juvenile Justice System
David Kelly Secretary, Department of Crime Control and Public Safety
'l /
t'v) CO C'q 130
Linda Hayes Chair, Governor's Crime Commission
David Jones Director, Governor's Crime Commission
February 2000


Report Prepared By:
Doug Yearwood, Director of the Governor's Crime Commission's Criminal Justice Analysis Center
Michael Wilson, Institute of Government Intern Tina Gillespie, Institute of Government Intern
Questions or comments can be referred to"
Criminal Justice Analysis Center Governor's Crime Commission
1201 Front St. Raleigh, NC 27616
(919) 733-4564 (919) 733-4625 Fax
*This document was supported by Federal Formula Grant # 99-JF-FX-O037 and printed at the cost of $1256.10 or $8.37 per copy for 150 copies.

T a b l e o f C o n t e n t s
List o f Figures . . . . . . . . . . . . . . . . . . . . . . . . . . . . . . . . . . . . . . . . . . . . . . . . . . . . . . . . . . . . . . . . . . . . . . . . . . . . . . . . . . . . ii
In t roduct ion and Literature Rev iew . . . . . . . . . . . . . . . . . . . . . . . . . . . . . . . . . . . . . . . . . . . . . . . . . . . . . . . . . . . 1
Hypotheses . . . . . . . . . . . . . . . . . . . . . . . . . . . . . . . . . . . . . . . . . . . . . . . . . . . . . . . . . . . . . . . . . . . . . . . . . . . . . . . . . . . . . . . 4
M e t h o d o l o g y . . . . . . . . . . . . . . . . . . . . . . . . . . . . . . . . . . . . . . . . . . . . . . . . . . . . . . . . . . . . . . . . . . . . . . . . . . . . . . . . . . . . . 5
Historical Trends in Dispropor t ionate Minor i ty Conf inement and Sys tem
Overrepresentat ion . . . . . . . . . . . . . . . . . . . . . . . . . . . . . . . . . . . . . . . . . . . . . . . . . . . . . . . . . . . . . . . . . . . . . . . . . . . . . . . 6
Compar i son between Indexes and Alternat ive Programs . . . . . . . . . . . . . . . . . . . . . . . . . . . . . . . . . . 11
Juveni le Arrests Control led by Type of Cr ime and Race . . . . . . . . . . . . . . . . . . . . . . . . . . . . . . . . . 13
Compar i son between Urban and Rural Count ies . . . . . . . . . . . . . . . . . . . . . . . . . . . . . . . . . . . . . . . . . . . 16
Quest ionnaire Results . . . . . . . . . . . . . . . . . . . . . . . . . . . . . . . . . . . . . . . . . . . . . . . . . . . . . . . . . . . . . . . . . . . . . . . . . . 18
Discuss ion . . . . . . . . . . . . . . . . . . . . . . . . . . . . . . . . . . . . . . . . . . . . . . . . . . . . . . . . . . . . . . . . . . . . . . . . . . . . . . . . . . . . . . . 21
Recommenda t i ons . . . . . . . . . . . . . . . . . . . . . . . . . . . . . . . . . . . . . . . . . . . . . . . . . . . . . . . . . . . . . . . . . . . . . . . . . . . . . . 23
References . . . . . . . . . . . . . . . . . . . . . . . . . . . . . . . . . . . . . . . . . . . . . . . . . . . . . . . . . . . . . . . . . . . . . . . . . . . . . . . . . . . . . . . 25
Appendix A . . . . . . . . . . . . . . . . . . . . . . . . . . . . . . . . . . . . . . . . . . . . . . . . . . . . . . . . . . . . . . . . . . . . . . . . . . . . . . . . . . . . . . 27
List of Figures
Figure 1
Figure 2
Figure 3
Figure 4
Figure 5
Figure 6
Figure 7
Figure 8
Figure 9
Figure 10
Figure 11
Figure 12
Figure 13
Figure 14
Figure 15
Figure 16
Figure 17
Figure 18
Figure 19
1997-1998 Juvenile Arrests by Minority Representation Status ....... ..... 8
1997-1998 Juvenile Detention School Admissions by Minority Representation Status . . . . . . . . . . . . . . . . . . . . . . . . . . . . . . . . . . . . . . . . . . . . . . . . . . . . . . . . . . . . . 9
1997-1998 Juvenile Training School Admissions by Minority Representation Status . . . . . . . . . . . . . . . . . . . . . . . . . . . . . . . . . . . . . . . . . . . . . . . . . . . . . . . . . . . . 10
Comparison of Arrest Index and Alternative Programs .. . . . . . . . . . . . . . . . . . . . 11
Comparison of Detention School Index and Alternative Programs ....... 12
Comparison of Training School Index and Alternative Programs ......... 12
1998 Juvenile Arrests for Robbery by Race . . . . . . . . . . . . . . . . . . . . . . . . . . . . . . . . . . 13
1998 Juvenile Arrests for Burglary by Race . . . . . . . . . . . . . . . . . . . . . . . . . . . . . . . . . . 13
1998 Juvenile Arrests for Aggravated Assault by Race . . . . . . . . . . . . . . . . . . . . . 13
1998 Juvenile Arrests for Larceny by Race . . . . . . . . . . . . . . . . . . . . . . . . . . . . . . . . . . . . 13
1998 Juvenile Arrests for Drug Related Offenses by Race ... . . . . . . . . . . . . . . . 13
1998 Juvenile Arrests for Disorderly Conduct by Race .. . . . . . . . . . . . . . . . . . . . . 13
Comparison between the Mean of White and Minority Juvenile Arrests . . . . . . . . . . . . . . . . . . . . . . . . . . . . . . . . . . . . . . . . . . . . . . . . . . . . . . . . . . . . . . . . . . . . 14
Regression Table: Determining Predictors of Detention Admission Levels . . . . . . . . . . . . . . . . . . . . . . . . . . . . . . . . . . . . . . . . . . . . . . . . . . . . . . . . . . . . . . . . . 15
Regression Table: Determining Predictors of Training School Admission Levels . . . . . . . . . . . . . . . . . . . . . . . . . . . . . . . . . . . . . . . . . . . . . . . . . . . . . . . . . . . . . . . . . 16
Arrest Totals and Community Type Variance . . . . . . . . . . . . . . . . . . . . . . . . . . . . . . . . 17
Detention School Admission Totals and Community Type Variance ..... 17
Training School Admission Totals and Community Type Variance ....... 17
Alternative Program Totals and Community Type Variance ................ 18

i i i
Figure 20
Figure 21
Figure 22
Figure 23
Figure 24
Results of Survey Question #1 . . . . . . . . . . . . . . . . . . . . . . . . . . . . . . . . . . . . . . . . . . . . . . . . . . 18
Results of Survey Question #3 . . . . . . . . . . . . . . . . . . . . . . . . . . . . . . . . . . . . . . . . . . . . . . . . . . 19
Results of Survey Question #11 . . . . . . . . . . . . . . . . . . . . . . . . . . . . . . . . . . . . . . . . . . . . . . . . 20
Results of Survey Question #16 . . . . . . . . . . . . . . . . . . . . . . . . . . . . . . . . . . . . . . . . . . . . . . . . 20
Results of Survey Question # 19 . . . . . . . . . . . . . . . . . . . . . . . . . . . . . . . . . . . . . . . . . . . . . . . . 21
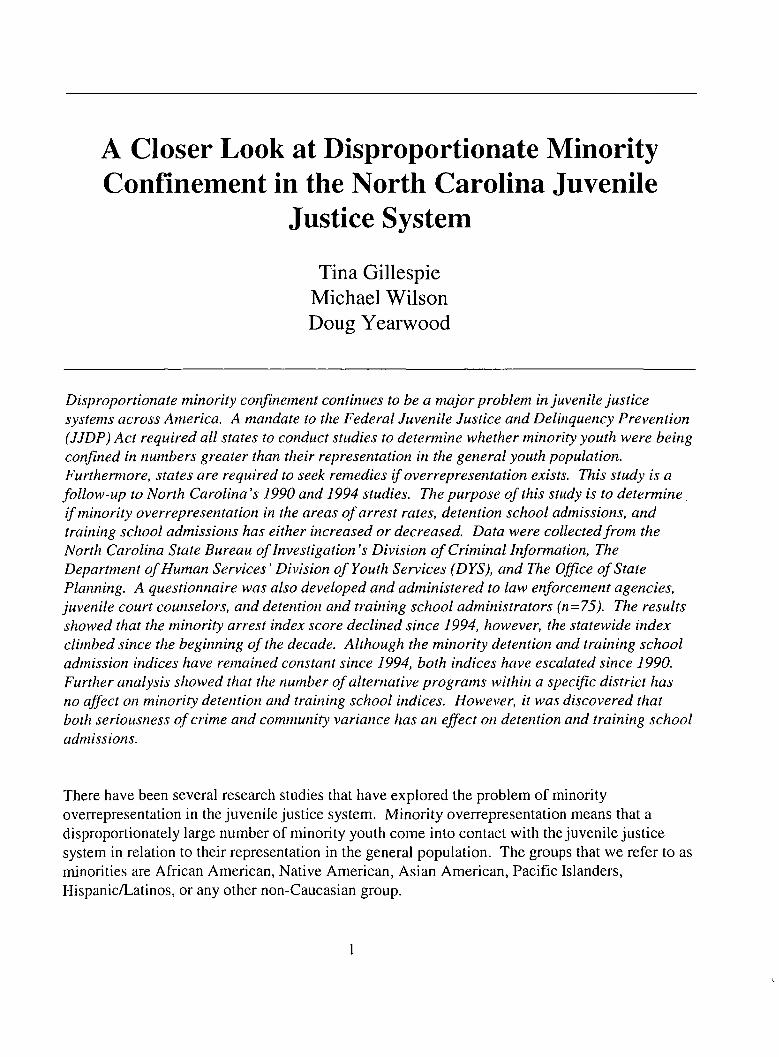
A Closer Look at Disproportionate Minority Confinement in the North Carolina Juvenile
Justice System
Tina Gillespie Michael Wilson Doug Yearwood
Disproportionate minority confinement continues to be a major problem in juvenile justice systems across America. A mandate to the Federal Juvenile Justice and Delinquency Prevention (JJDP) Act required all states to conduct studies to determine whether minority youth were being confined in numbers greater than their representation in the general youth population. Furthermore, states are required to seek remedies if overrepresentation exists. This study is a follow-up to North Carolina's 1990 and 1994 studies. The purpose of this study is to determine. if minority overrepresentation in the areas of arrest rates, detention school admissions, and training school admissions has either increased or decreased. Data were collected from the North Carolina State Bureau of lnvestigation's Division of Criminal hlformation, The Department of Human Services'Division of Youth Services (DYS), and The Office of State Planning. A questionnaire was also developed and administered to law enforcement agencies, juvenile court counselors, and detention and training school administrators (n= 75). The results showed that the minority arrest index score declined since 1994, however, the statewide index climbed since the beginning of the decade. Although the minority detention and training school admission indices have remained constant since 1994, both indices have escalated since 1990. Further analysis showed that the number of alternative programs within a specific district has no affect on minority detention and training school indices. However, it was discovered that both seriousness of crime and community variance has an effect on detention and training school admissions.
There have been several research studies that have explored the problem of minority overrepresentation in the juvenile justice system. Minority overrepresentation means that a disproportionately large number of minority youth come into contact with the juvenile just ice system in relation to their representation in the general population. The groups that we refer to as minorities are African American, Native American, Asian American, Pacific Islanders, Hispanic/Latinos, or any other non-Caucasian group.

There are many explanations that one can give to analyze the problem of minority overrepresentation. Some researchers feel in order to understand the problem of minority overrepresentation, one should examine the differences in arrest, diversion, prosecution, adjudication, and transfer rates of both minority youth and non-minority youth in the juvenile justice system (OJJDP, 1990). According to the Office of Juvenile Justice and Delinquency Prevention, minority youths are more likely than non-minority youths to be formally processed and held in detention (OJJDP, 1990). A study in North Carolina during the period of 1990-91 revealed that in the majority of counties minority youth were more likely to have been arrested, detained, and committed to a training school (Caliber Associates, 1996). A second study in 1993 replicated the results in the previous study stating that minority youth were more likely than white youth to be arrested and presented to a juvenile intake facility (Caliber Associates, 1996).
Hsia and Hampton (1998), during their study on minority overrepresentation, revealed that although minorities represented only 32% of the youth's population, they represented more than 68% of the juvenile population secure in detention and 68% of those in secure institutions such as training schools. Moreover, the Center for Juvenile Justice Training and Research revealed that between the years of 1989 to 1995 more than five times as many minority juveniles were transferred to criminal court compared to the rest of the general population (Hsia and Hampton, 1997).
A study in Ohio revealed that during the four stages of the juvenile justice process (official referral, preadjucicatory detention, adjudication, and disposition) minority youths "are overrepresented relative to their proportion to the population" (Dunn et. al, 1993). The researchers stated that in decisions leading to confinement more than 55% of all juveniles detained prior to adjudication were minorities and 60% of all juveniles receiving a disposition to confinement were minorities (Dunn et. al, 1993). These statistics alone would suggest that racial disparities in the juvenile justice process may lead to the overrepresentation of minority youths in secure confinements. According to a recent OJJDP North Carolina study, significant examples of juvenile justice system contributing factors include the lack of adequate diversion programs for minority juveniles, the lack of culturally appropriate juvenile services, a lack of cultural understanding among juvenile justice system staff, and perceived barriers to parental advocacy because of minority parents' often limited understanding of the system (Devine et. al, 1998).
Previous researchers have suggested that variables such as family background, socioeconomic status, and education can also play a role in the overrepresentation of minorities in secure confinements. Researchers at the University of North Carolina at Charlotte reported that study after study points
to the fact that those variables most predictive of delinquency and recidivism of delinquents usually include combinations of inner city residence, welfare income, minority status, broken families, criminality in the family, and low socioeconomic status (Winters et. al 1996). According to the OJJDP, single-parent families and their often associated high poverty levels were recognized as potential contributing factors, "because justice-involved minority juveniles reside disproportionately in single-parent, low-income households" (Devine et al, 1998).
Family background, for example, may determine if a judge will assign a juvenile delinquent to secure confinement or to other alternate correctional methods such as house arrest or community service.
2

According to the previous research, there are a disproportionate percentage of minority youths from impoverished families and single parent families (Caliber Associates, 1996). A juvenile with such a family background may lack parental guidance and supervision. Judges, as well as other decision- makers in the juvenile justice process, may decide that this lack of parental supervision and guidance may have led to the delinquent behavior in the first place. Therefore, officials may feel that it is the duty of the state to provide guidance to the juvenile and assign him or her to a correctional or training institution. Furthermore, North Carolina state data indicate that minority juveniles receive more out- of-home placements than do majority juveniles partly because of perceptions that minority family home environments are less stable (Devine et al, 1998). One may argue that minorities may be targeted by the courts for these reasons and be assigned to correctional or training institutions more often than non-minorities.
Socioeconomic status of a family can also play a critical role in minority overrepresentation. Past research has shown that the composition of impoverished people in America disproportionately weighs toward minority citizens. An overrepresentation study in Georgia suggested that race did affect decision making but primarily indirectly. Furthermore, "socioeconomic status is a consistently stronger predictor than race in accounting for the action taken at each decision point" (Kurtz et al, 1993). Minority parents who earn low salaries may find it difficult to take a day off from work and
attend juvenile court, whereas white parents who earn high salaries can afford time off to show their support. In addition, minority parents who earn low salaries may not have the assets to obtain counseling from outside sources as would white parents. The Georgia study mentioned above also found that judges' decisions were influenced strongly by the absence of an attomey or representation by a public defender (Kurtz et. al, 1993). The defendant's ability to obtain representation is greatly affected by the defendant's income and socioeconomic status.
Researchers have cited education as yet another factor in minority overrepresentation in secure confinements. Educational factors such as early school failures, dropouts, and the lack of vocational education plague minority communities. These educational factors may lead to numerous minorities committing more crimes than whites to overcome economic adversity. The OJJDP reported that all of the local community representatives identified some aspect of the educational system as contributing to disproportionate minority confinement (Devine et. al, 1998). Perceptions focused on either the failure of schools to adequately serve minority juveniles or the failure of minority juveniles to fully participate in the educational system. Examples of educational system failings included inadequate early childhood education, inadequate programs to prevent students from dropping out early, and a lack of appropriate cultural education, together with minority juvenile truancy, suspensions, and expulsions (Devine et. al, 1998). Jonas Mata, juvenile consultant for the Community Research Association in Denver, Colorado, stated that, "schools are turning increasingly to exclusions as means of discipline.., increasing his (the student's) detachment from school; this reduces his chances to succeed, and increases the likelihood he will drop out, in turn increasing the likelihood he will come into contact with the criminal justice system" (Mata, 1997).
Urbanization of minorities is considered an important contextual source of unequal treatment in punishment between minorities and whites, which may lead to minority overrepresentation in secure confinement (Myers and Talarico, 1996). Similar offenders may be treated differently depending
3
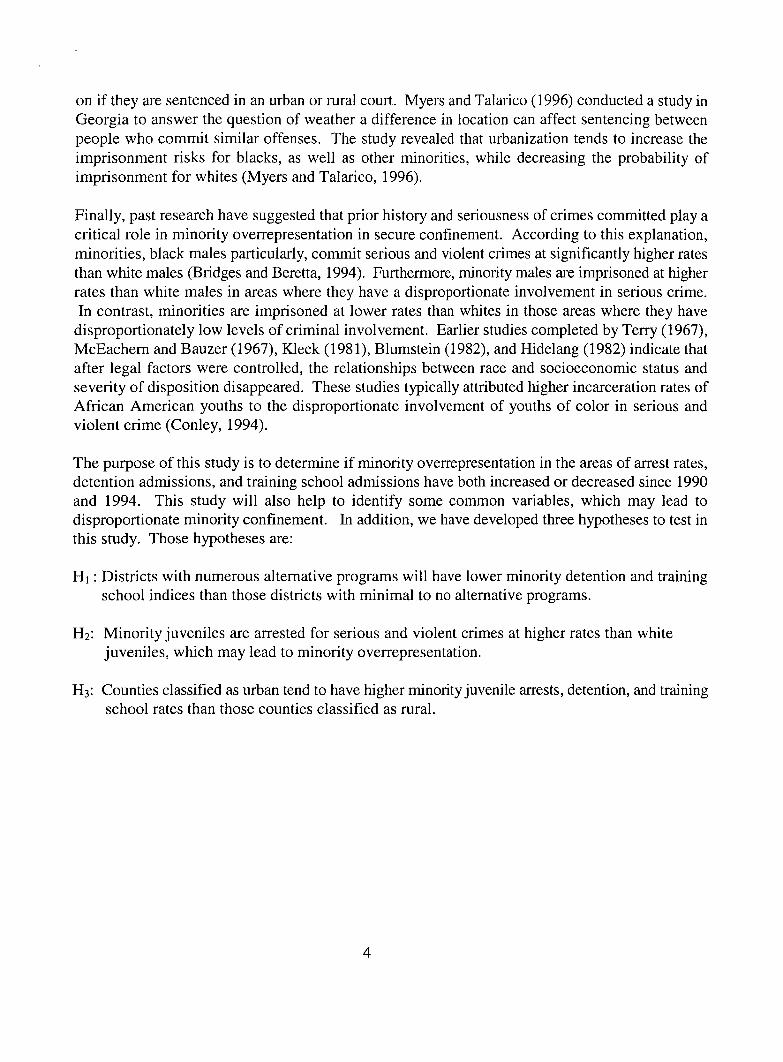
on if they are sentenced in an urban or rural court. Myers and Talarico (1996) conducted a study in Georgia to answer the question of weather a difference in location can affect sentencing between people who commit similar offenses. The study revealed that urbanization tends to increase the imprisonment risks for blacks, as well as other minorities, while decreasing the probability of imprisonment for whites (Myers and Talarico, 1996).
Finally, past research have suggested that prior history and seriousness of crimes committed play a critical role in minority overrepresentation in secure confinement. According to this explanation, minorities, black males particularly, commit serious and violent crimes at significantly higher rates than white males (Bridges and Beretta, 1994). Furthermore, minority males are imprisoned at higher rates than white males in areas where they have a disproportionate involvement in serious crime. In contrast, minorities are imprisoned at lower rates than whites in those areas where they have
disproportionately low levels of criminal involvement. Earlier studies completed by Terry (1967), McEachern and B auzer (1967), Kleck (1981), Blumstein (1982), and Hidelang (1982) indicate that after legal factors were controlled, the relationships between race and socioeconomic status and severity of disposition disappeared. These studies typically attributed higher incarceration rates of African American youths to the disproportionate involvement of youths of color in serious and violent crime (Conley, 1994).
The purpose of this study is to determine if minority overrepresentation in the areas of arrest rates, detention admissions, and training school admissions have both increased or decreased since 1990 and 1994. This study will also help to identify some common variables, which may lead to disproportionate minority confinement. In addition, we have developed three hypotheses to test in this study. Those hypotheses are:
Hi : Districts with numerous alternative programs will have lower minority detention and training school indices than those districts with minimal to no alternative programs.
H2" Minority juveniles are arrested for serious and violent crimes at higher rates than white juveniles, which may lead to minority overrepresentation.
H3: Counties classified as urban tend to have higher minority juvenile arrests, detention, and training school rates than those counties classified as rural.
4

Methodology
For the purpose of this study, we compared North Carolina's 1997-1998 arrest data for minority youth in the age range of 10 to 18 with previous data obtained from both the 1990 and 1994 studies. Data on detention and training school admissions for juveniles 10-15 were also compared to data from these earlier years. Arrest data were obtained from the State Bureau of Investigation's Division of Criminal Information while detention and training school admissions data were obtained from what was the Department of Health and Human Services' Division of Youth Services. State demographics were obtained from the Office of State Planning. The data reflects all 100 counties and show a breakdown of the number of minority juveniles per county who were arrested. Furthermore, the data show the number of minority juveniles per county who were confined in either a detention or training school.
To identify the significance of disproportionate minority confinement in the state of North Carolina, as well as within each county, we used the standard equation from the Office of Juvenile Justice and Delinquency Prevention for assessing the relationship between minority involvement in the juvenile justice system and minority representation in the general youth population. We used three formulas to analyze arrest, detention, and training school data individually. To analyze the arrest data we developed an index by dividing the percent of minorities who were arrested by the percent of the juvenile population which is minority. Through the use of this equation, we were able to establish an arrest index for each county as well as the entire state.
Arrest Index= % of Arrests who are Minority
% Of Juvenile Population who are Minority
A similar equation was used to establish both a detention and training school index within each county as well as for the state.
Detention School Index= % Of Detention Admissions who are Minority
% Of Juvenile Population who are Minority
5
Training School Index= % Of Training Admissions who are Minority
% Of Juvenile Population who are Minority
The product of each equation is an index ratio score, which signifies the presence or absence of minority overrepresentation in arrest, detention, or training school admission rates. The values of the iiadex ratio scores are proportionality measures, which reveals the ratio between the number of minority youth who were processed in the juvenile justice system and minority representation in the general youth population. Index ratio scores in the range of zero to one indicate an absence of minority overrepresentation; i.e., the percentage of all processed youth that were minorities is less than the percentage of minority youth in the total youth population. A score of one indicates that the index score is proportionate to the minority youth population, while a score above one indicates disproportionality or the presence of minority overrepresentation.
In addition, a questionnaire was developed to test the hypotheses mentioned in the purpose section of this study. The actual questionnaire can be found in the appendix. The intention of the questionnaire is to identify common explanations for minority overrepresentation among North Carolina's law enforcement agencies, juvenile court counselors, and detention and training school administrators. The questionnaire is divided into five sections. Each section measures a particular theory that has been tested in previous literature.
The first section of the questionnaire pertains to common perceptions toward disproportionate minority confinement. Our purpose in this section was to determine if criminal justice personnel find disproportionate minority confinement within their respective counties a problem. The second section is intended to identify the availability of alternative programs per county. Section three was established to obtain the prevalence of prior record and seriousness of crimes committed by minority juveniles compared to non-minority juveniles. Section four specifically focuses on law enforcement agencies and their contact with minority juveniles. Finally, section five of this questionnaire looks at what each county is doing to solve the problem of disproportionate minority confinement.
Results
Historical Trends in Disproportionate Minority Confinement and System Overrepresentation
The following section delineates trends in the number of counties with minority overrepresentation in their respective juvenile justice systems and in the rate at which minority
6
youth are committed to the state's detention facilities and training schools. Specifically, arrest, detention, and training school admission data for the years 1990 and 1994 will be compared to the most recent (1997-1998) data in order to assess the degree to which the state's minority overrepresentation has either improved or become worse over the course of the decade.
Juvenile Arrests (Under 19 years of age)
Arrest data for 1990 indicate that minority overrepresentation was apparent in 66 (66.7 percent of those counties reporting at least one arrest) of the state's counties. The index ratio scores varied considerably with 12 counties arresting minority youth at a rate of at least two or more times higher than their respective minority juvenile populations. Thirty counties (33.3%) did not encounter a minority overrepresentation problem in 1990 and three counties (3.0%) reported arrestifig minority youth in exact proportion to their minority youth populations. The statewide arrest index score was 1.26 in 1990 indicating a slight minority overrepresentation problem for the state as a whole.
Minority overrepresentation increased from 1990 to 1994 with the statewide index ratio score expanding 46.8% to 1.85. The number of counties with minority arrest overrepresentation swelled from 66 in 1990 to 84 counties in 1994. This represents an increase of 27.3 percent in the number of counties, which arrest minority youth at a higher rate than their respective minority youth populations. The 1994 data show that the number of counties in which minority arrests exceeded minority populations by a factor of at least two or more expanded to 27 by the end that year. The number of counties reporting an absence of minority arrest overrepresentation dropped from 30 in 1990 to 15 in 1994.
Figure 1 graphically represents the minority representation status for juvenile arrests in 1998. This most recent arrest data indicate that the statewide index arrest ratio score has declined slightly since 1994 with an index score of 1.7 being apparent in 1998. This equates to an 8.1 percent decline in the statewide index over this four-year period. The number of counties with minority overrepresentation in their arrests dropped a minimal amount to 83 counties in 1998. The number of counties with minority underrepresentation dropped from 15 in 1994 to 14 in 1998.
While marginal improvements were recorded from 1994 to 1998, the minority arrest overrepresentation has become more problematic in North Carolina with the statewide index ratio score climbing from 1.26 in 1990 to 1.7 in 1998 (34.9% increase). Consequently, the problem has expanded to more counties with the number of counties with minority overrepresentation in their respective arrests escalating from 66 in 1990 to 83 in 1998 (25.8% increase).

Figure 1
1997-1998 Juvenile Arrests by Minority Representation Status
MINORITY REPRESENTATION COMPARABLE TO POPULATION (INDEX EQUAL TO 1) PROVIDED NO ARREST DATA MINORITY UNDERREPRESENTATION (INDEX 0 TO .9)
/ _ ~ MINORITY OVERREPRESENTATION (INDEX GREATER THAN 1)
Detention School Admissions
At the beginning of the decade, 67 counties (70.5% of those with at least one detention school admission) experienced minority overrepresentation in their detention school admissions. Twenty-three of these counties committed minority youth at a disproportionate rate of at least two or more times greater than their respective minority juvenile populations. Twenty-eight counties (29.5%) did not demonstrate minority overrepresentation in their commitment decisions in 1990. The statewide detention admissions index score was 2.26 in 1990.
Cumulative data on the number of 1994 detention school admissions demonstrate a marginal decline of 5.8 percent in the state's index ratio score, a score that dropped from 2.26 in 1990 to 2.13 in 1994. The number of counties which admitted at least one of its youth to a detention facility grew to 77 by 1994. The number of counties with extreme overrepresentation, i.e. index ratio scores of 2.0 or greater, expanded considerably to 39 by the end of calendar year 1994. The number of counties not threatened by minority overrepresentation dropped slightly to 18.
8

Figure 2 graphically represents the minority representation status for juvenile detention school admissions in 1997-1998. This most recent detention school admission data indicate that the number of counties, with minority overrepresentation in their detention school admission rates grew slightly to 80 by the end of fiscal year 1997-1998. The statewide index remained relatively constant with a score of 2.13 in 1994 and a score of 2.1 in fiscal year 1997-1998. The statewide index score for minority detention admissions declined from 2.26 in 1990 to 2.1 for fiscal year
Figure 2
1997-1998 Juvenile Detention Center Admissions
by Minority Representation Status
MINORITY REPRESENTATION COMPARABLE TO POPULATION (INDEX EQUAL TO 1) MINORITY OVERREPRESENTATION (INDEX GREATER THAN 1)
[---'] MINORITY UNDERREPRESENTATION (INDEX 0 TO .9)
1997-1998 (7.1% drop). While the statewide index score has dipped slightly since 1990, the number of counties experiencing this problem has increased since the beginning of the decade. The number of counties that have minority overrepresentation or disproportionate minority confinement grew fi'om 67 in 1990 to 80 in fiscal year 1997-1998 (19.4 percent increase).
9
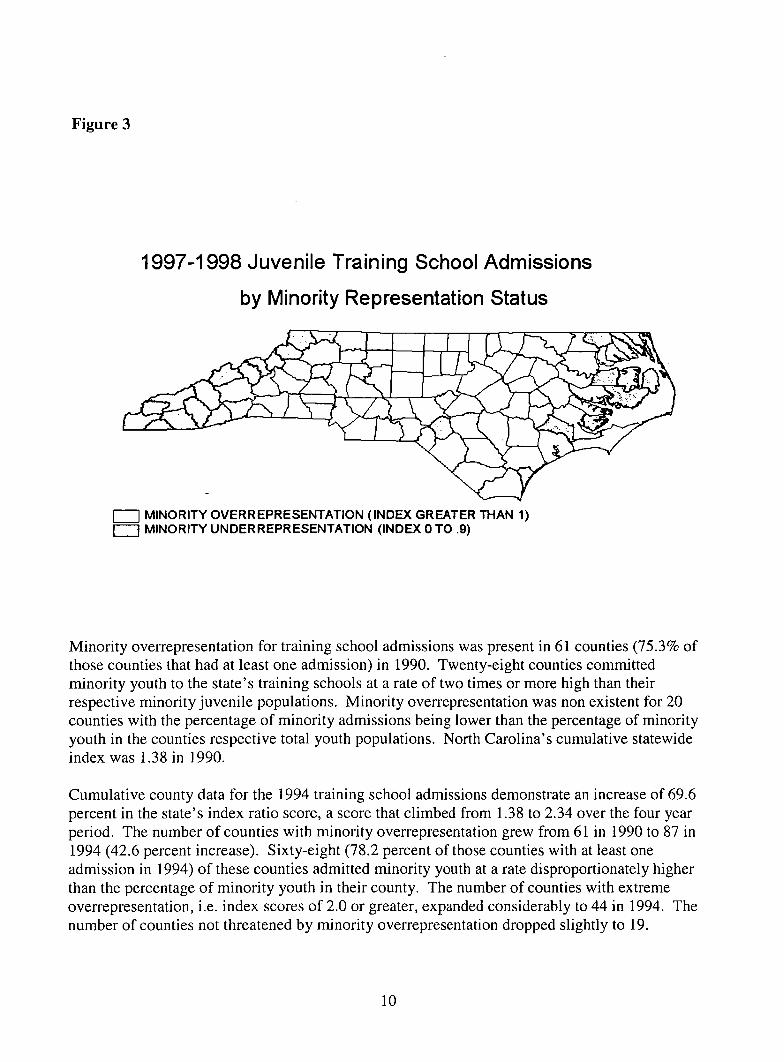
Figure 3
1997-1998 Juvenile Training School Admissions
by Minority Representation Status
MINORITY OVERREPRESENTATION (INDEX GREATER THAN 1) r----] MINORITY UNDERREPRESENTATION (INDEX 0 TO .9)
Minority overrepresentation for training school admissions was present in 61 counties (75.3% of those counties that had at least one admission) in 1990. Twenty-eight counties committed minority youth to the state's training schools at a rate of two times or more high than their respective minority juvenile populations. Minority overrepresentation was non existent for 20 counties with the percentage of minority admissions being lower than the percentage of minority youth in the counties respective total youth populations. North Carolina's cumulative statewide index was 1.38 in 1990.
Cumulative county data for the 1994 training school admissions demonstrate an increase of 69.6 percent in the state's index ratio score, a score that climbed from 1.38 to 2.34 over the four year period. The number of counties with minority overrepresentation grew from 61 in 1990 to 87 in 1994 (42.6 percent increase). Sixty-eight (78.2 percent of those counties with at least one admission in 1994) of these counties admitted minority youth at a rate disproportionately higher than the percentage of minority youth in their county. The number of counties with extreme overrepresentation, i.e. index scores of 2.0 or greater, expanded considerably to 44 in 1994. The number of counties not threatened by minority overrepresentation dropped slightly to 19.
10
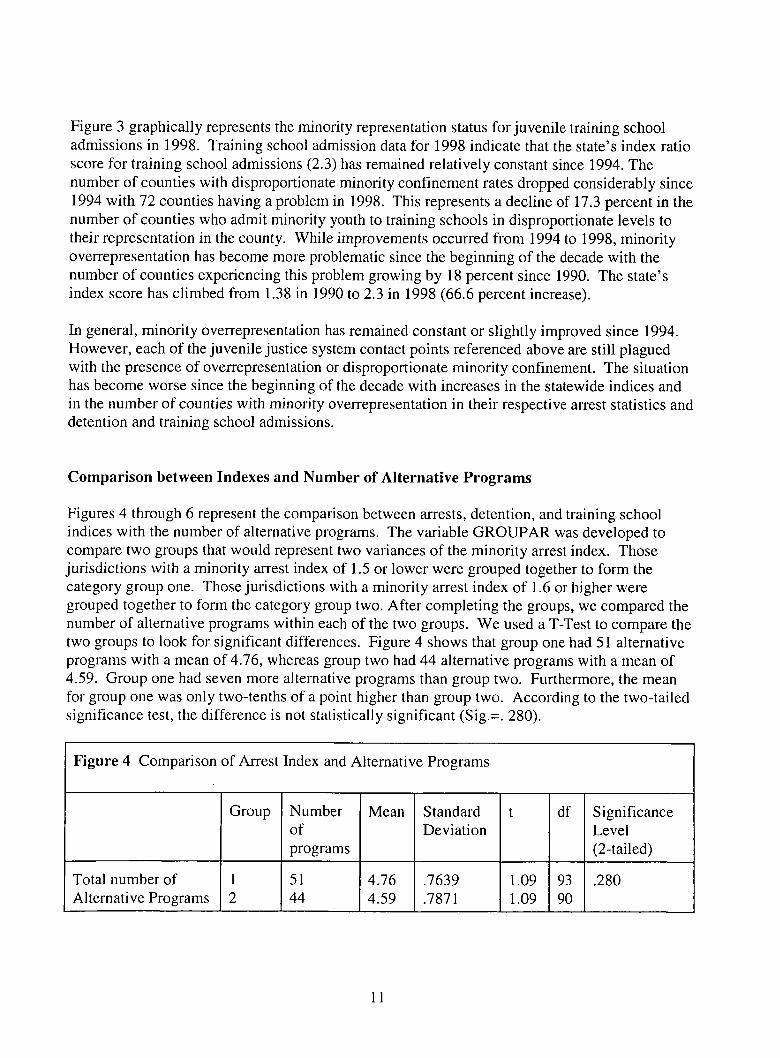
Figure 3 graphically represents the minority representation status for juvenile training school admissions in 1998. Training school admission data for 1998 indicate that the state's index ratio score for training school admissions (2.3) has remained relatively constant since 1994. The number of counties with disproportionate minority confinement rates dropped considerably since 1994 with 72 counties having a problem in 1998. This represents a decline of 17.3 percent in the number of counties who admit minority youth to training schools in disproportionate levels to their representation in the county. While improvements occurred from 1994 to 1998, minority overrepresentation has become more problematic since the beginning of the decade with the number of counties experiencing this problem growing by 18 percent since 1990. The state's index score has climbed from 1.38 in 1990 to 2.3 in 1998 (66.6 percent increase).
In general, minority overrepresentation has remained constant or slightly improved since 1994. However, each of the juvenile justice system contact points referenced above are still plagued with the presence of overrepresentation or disproportionate minority confinement. The situation has become worse since the beginning of the decade with increases in the statewide indices and in the number of counties with minority overrepresentation in their respective arrest statistics and detention and training school admissions.
Comparison between Indexes and Number of Alternative Programs
Figures 4 through 6 represent the comparison between arrests, detention, and training school indices with the number of alternative programs. The variable GROUPAR was developed to compare two groups that would represent two variances of the minority arrest index. Those jurisdictions with a minority arrest index of 1.5 or lower were grouped together to form the category group one. Those jurisdictions with a minority arrest index of 1.6 or higher were grouped together to form the category group two. After completing the groups, we compared the number of alternative programs within each of the two groups. We used a T-Test to compare the two groups to look for significant differences. Figure 4 shows that group one had 51 alternative programs with a mean of 4.76, whereas group two had 44 alternative programs with a mean of 4.59. Group one had seven more alternative programs than group two. Furthermore, the mean for group one was only two-tenths of a point higher than group two. According to the two-tailed significance test, the difference is not statistically significant (Sig.-. 280).
Figure 4 Comparison of Arrest Index and Alternative Programs
Total number of Alternative Programs
Group
1 2
Number Mean Standard of Deviation programs
51 4.76 .7639 44 4.59 .7871
1.09 1.09
df Significance Level (2-tailed)
93 .280 90
11
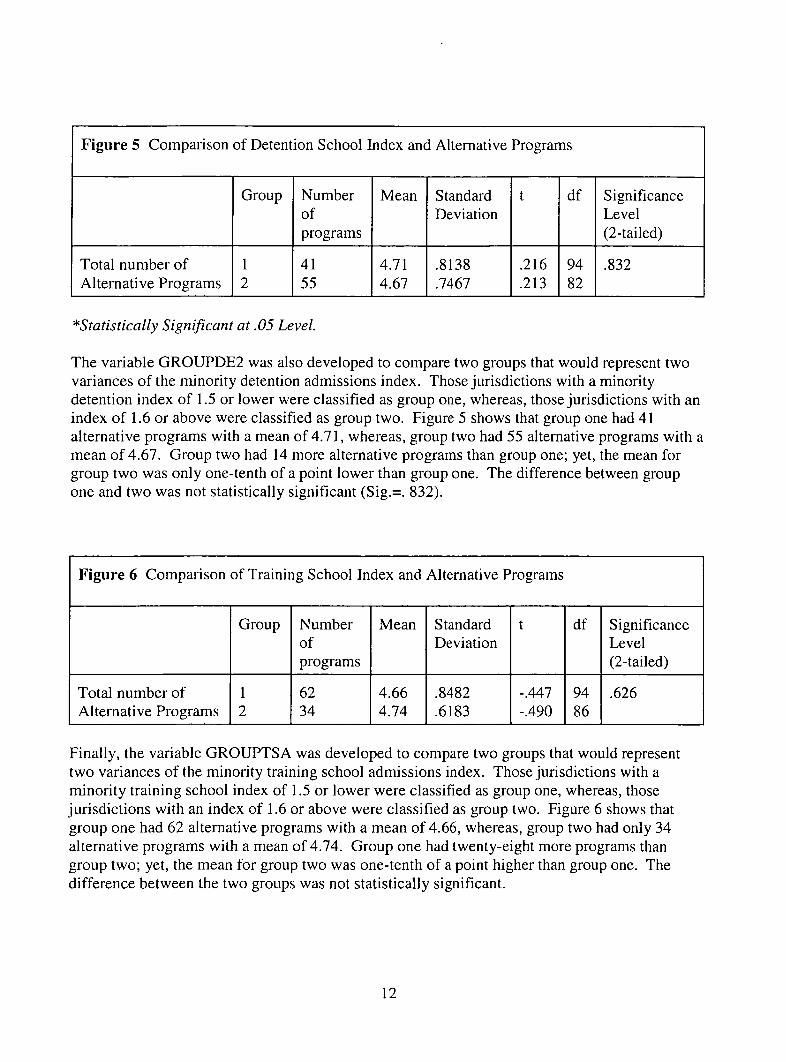
Figure 5 Comparison of Detention School Index and Alternative Programs
Total number of Alternative Programs
Group Number of programs
41 55
Mean
4.71 4.67
Standard t df Significance Deviation Level
(2-tailed)
.8138 .216 94 .832
.7467 .213 82
*Statistically Significant at. 05 Level.
The variable GROUPDE2 was also developed to compare two groups that would represent two variances of the minority detention admissions index. Those jurisdictions with a minority detention index of 1.5 or lower were classified as group one, whereas, those jurisdictions with an index of 1.6 or above were classified as group two. Figure 5 shows that group one had 41 alternative programs with a mean of 4.71, whereas, group two had 55 alternative programs with a mean of 4.67. Group two had 14 more alternative programs than group one; yet, the mean for group two was only one-tenth of a point lower than group one. The difference between group one and two was not statistically significant (Sig.=. 832).
F igu re 6 Comparison of Training School Index and Alternative Programs
Total number of Alternative Programs
Group
1 2
Number Mean Standard t df Significance of Deviation Level programs (2-tailed)
62 4.66 .8482 -.447 94 .626 34 4.74 .6183 -.490 86
Finally, the variable GROUPTSA was developed to compare two groups that would represent two variances of the minority training school admissions index. Those jurisdictions with a minority training school index of 1.5 or lower were classified as group one, whereas, those jurisdictions with an index of 1.6 or above were classified as group two. Figure 6 shows that group one had 62 alternative programs with a mean of 4.66, whereas, group two had only 34 alternative programs with a mean of 4.74. Group one had twenty-eight more programs than group two; yet, the mean for group two was one-tenth of a point higher than group one. The difference between the two groups was not statistically significant.
12
lqgure 7 Juvenile Ane~ fer ~ by Race 1998
82%
lqga.ue 8 Juvenile Arrests for Burglary by Race 1998
1%]
4 3 % ~ ' ,~mBj~o'54o/o
Hgure 9 Jmenile Arrests for Aggravated Assault by Race~1998
35°/°
figure 10 Juvenile Arrests for Larceny by Race 1998
49%
figure 11 Juvenile Arrest for DmgRelated Offea~ by Race 1998
49% ~ ' 5 0 %
figure 12 Juvenile Arrests for Disorderly Conduct by Race 1998
¼%
* Juvenile arrest data obtained from the North Carolina Uniform Crime Report.
Juvenile Arrests Controlled by Type of Crime and Race
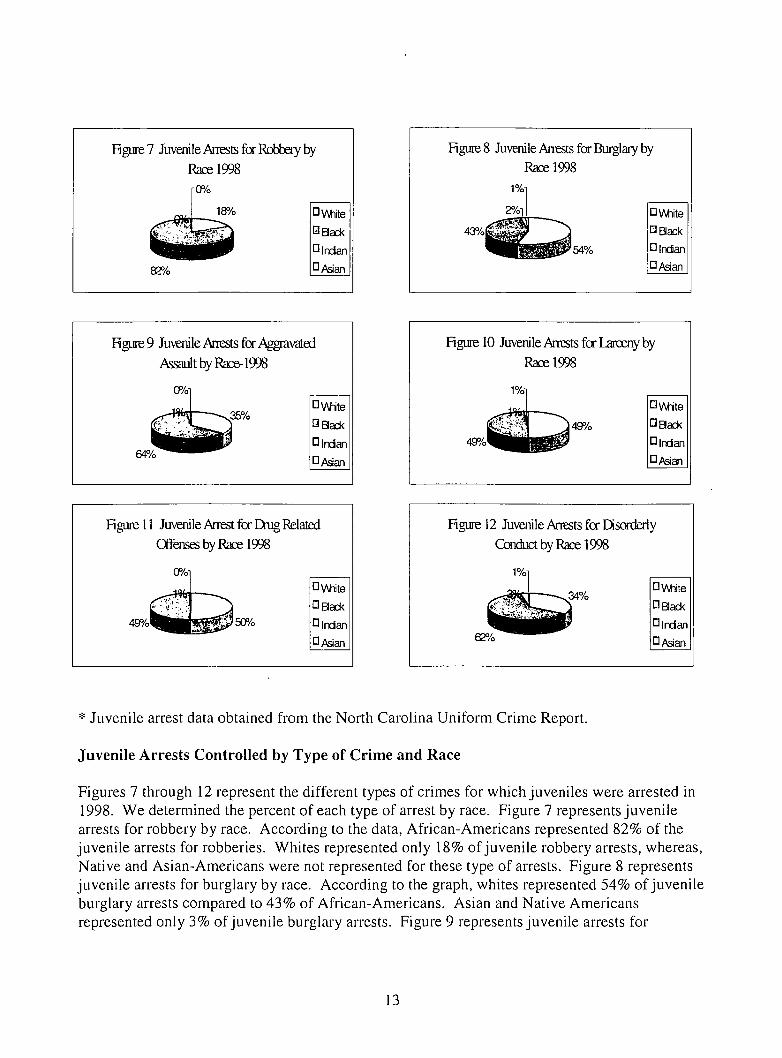
Figures 7 through 12 represent the different types of crimes for which juveniles were arrested in 1998. We determined the percent of each type of arrest by race. Figure 7 represents juvenile arrests for robbery by race. According to the data, African-Americans represented 82% of the juvenile arrests for robberies. Whites represented only 18% of juvenile robbery arrests, whereas, Native and Asian-Americans were not represented for these type of arrests. Figure 8 represents juvenile arrests for burglary by race. According to the graph, whites represented 54% of juvenile burglary arrests compared to 43% of African-Americans. Asian and Native Americans represented only 3% of juvenile burglary arrests. Figure 9 represents juvenile arrests for
13

aggravated assault by race. African-Americans represented an overwhelming 64% of arrests for this type of crime compared to 35% of white arrests. Asian and Native Americans represented a mere 1% of arrests for aggravated assault. Figure 10 represents juvenile arrests for larceny by race. Whites represented 49% of larceny arrests. Similarly, African-Americans represented 49% of larceny arrests. Asian and Native Americans represented 2% of larceny arrests. Figure 11 represents juvenile arrests for drug-related offenses. Whites and African-Americans were arrested for drug-related offenses at similar percentages. Whites represented 50% of the arrests, whereas, African-Americans represented 49%. Asian and Native Americans represented 1% of drug-related arrests. Finally, Figure 12 represents juvenile arrests for disorderly conduct by race. African-Americans represented 62% of disorderly conduct arrests while whites represented 34% of the arrests. Asian and Native Americans represented 4% of disorderly conduct arrests.
Figure 13 Comparison Between the Mean of White and Minority Juvenile Arrests
Pair 1
Pair 2
Pair 3
Pair 4
Pair 5
Pair 6
# of Minority Larcenies # of White Larcenies
# of Minority Robberies # of White Robberies
# of Minority Drug Arrests # of White Drug Arrests
# of Minority Disorderly Conduct Arrests # of White Disorderly Conduct Arrests
Mean
50.82 50.03
6.28 1.37
21.79
21.99
25.73
13.23
Number of Counties
100 100
100 100
100
100
100
100
# o f Minority 13.83 100 Aggravated Assaults # of White Aggravated 7.82 100 Assaults
# of Minority Burglaries 17.57 100 # of White Burglaries 21.06 100
Mean Differenc e
.79
4.91
-.20
12.50
6.01
-3.49
.160
4.125
-.079
3.451
2.835
-1.54
Sig. Level (2-tailed)
.873
.000"
.937
.001"
.006*
.126
* Statistically Significant a t . 05 level.
14

Further analysis was done to determine if the differences between white and minority arrests were statistically significant. We used a paired samples t-test to compare the means of white and minority arrests for the six crimes indicated above. Figure 13 shows this comparison. In this figure, we compare the number of arrests for minority larcenies, robberies, drug-related offenses, aggravated assaults, burglaries, and disorderly conduct arrests with similar white arrests. The results from the test showed that three of the paired samples reveal statistical significance. The first paired sample that shows statistical significance is the comparison between the number of minority and white robbery arrests. According to the figure, the mean for county-reported- minority-robbery arrests was 6.2 per 1000 compared to a white mean of 1.4. The mean difference was 4.9. The two-tailed significance level was .000, which was statistically significant. The second result that showed statistical significance was the comparison between the number of minority and white disorderly conduct arrests. The mean for county-reported- minority-disorderly-conduct arrests was 25.7 per 1000 compared to a white mean of 13.2 with a significance level of .001. The mean difference between minority and white disorderly conduct arrests was 12.5. Finally, the difference between the number of minority and white aggravated assault arrests was statistically significant. The mean for county reported minority aggravated assault arrests was 13.8 per 1000 compared to a white mean of 7.8 with a mean difference of 6. The significance level was .006.
A final analysis was done with the arrest data to determine some predictors that would determine the level of minority detention and training school admissions. To do this we used a stepwise regression with the following independent variables: Number of minority disorderly conduct arrests, total alternative programs, number of minority burglaries, number of minority aggravated assaults, number of minority robberies, and total number of juvenile arrests. The first dependent variable we used was total number of detention school admissions.
Figure 14 Regression Table: Determining Predictors of Detention School Admissions Levels
Model Summery R I R Square I Adjusted R Square
.935a .874 .865 Std. Error of the Estimate
30.72
Coefficients Variable
# of Alternative Programs # of Minority Robbery Arrests
Standardized Coefficients
Beta .065 .230
1.714 2.015
# of Juvenile Arrests .575 4.059 # of Minority Aggravated .328 3.144 Assault Arrests # o Minority Burglary .005 .070 Arrests # of Minority Disorderly I -.252 -4.233 Conduct Arrests f
t .090 .047
.000
.002
.945
.000
Sig.
15

Figure 14 represents the regression table. According to the table, all of the variables survived the analysis. The r-squared value was .874. Thus, 87.4% of the variance in the counties total number of total detention school admissions can be explained by the independent variables tested in the regression table.
Figure 15 represents the regression table using the following independent variables: Total number of detention school admissions, number of minority burglary arrests, number of minority disorderly conduct arrests, number of minority robbery arrests, and number of minority aggravated assaults. The dependent variable is the total number of training school admissions. All of the variables survived the analysis. The r-squared value was .891, which means that 89.1% of the variance in the counties total number of training school admissions can be explained by the independent variables in the table.
Figure 15 Regression Table: Determining Predictors of Training School Admission Levels
R R Square Model Summary
Adjusted R Square Std. Error of the Estimate
.944a .891 •885 6.72
Coefficients Variables
# of Minority Robbery Arrests # of Minority Aggravated Assault Arrests # of Minority Burglary Arrests # of Minority Disorderly Conduct Arrests # of Minority Detention School Admissions
Standardized Coefficients Beta -.371
.421
.649
•-049
.380
-4.184
4.546
10.773
-.844
4.063
Sig. .000
.000
.000
.401
.000
Comparison between Urban and Rural Counties
Figures 16 through 19 represent the comparison of arrest, detention school, training school, and alternative program admission totals with community type. The variable COMMTYP was
16

created to compare two community variances. Group one consists of all counties classified as urban and group two consists of all counties classified as rural, Here again we used a T-Test to compare the two groups to look for significant differences. Figure 16 shows that the urban group (n-34) had a mean minority arrest total of 534.18, whereas, the rural group (n=66) had a mean of 185.71. The rural group consisted of 31 more counties than the urban group; yet, the mean minority arrest total for the urban group was 348.47 points higher. The difference between the urban and rural groups was statistically significant (Sig.=.001). Figure 17 shows that the urban group (n=34) had a mean detention school admissions total of 114.68, whereas, the rural group (n=66) had a mean of only 32.64. The rural group consisted of 32 more counties than the urban group; yet, the mean detention school admissions total for the urban group was 82.04 points higher. The difference between the urban and rural groups was statistically significant (Sig.=.000).
Figure 16 Arrest Totals and Community Type Variance
Community Number of Mean Significance Types Counties Level
Total number of Urban 34 534.18 .001" Minority Arrests Rural 66 185.71
Figure 17 Detention Schools Admission Totals and Community Type Variance
Total number of Detention Admissions
Community Types
Urban Rural
Number of Counties
34 66
Mean
114.68 32.64
Significance Level
.000"
Figure 18 Training Schools Admission Totals and Community Type Variance
Community Number of Mean Significance Types Counties Level
Total number of Urban 34 23.97 .000" Training Admissions Rural 66 8.26
*Statistically Significant at .05 level.
17

Figure 18 reveals that the urban group (n=34) had a mean training school admissions total of 23.97, and the rural group (n=66) with a mean of 8.26. Here again the rural group consisted of 32 more counties than the urban group. However, the mean training school admissions total for the urban group was 15.71 points higher. The difference between the urban and rural groups was statistically significant (Sig.=.000).
Figure 19 Alternative Program Totals and Community Type Variance
Total number of Alternative Programs
Community Types
Urban Rural
Number of Counties
32 64
Mean
4.75 4.66
Significance Level
.196
Finally, figure 19 shows that the urban group (n=32) had a mean alternative program total of 4.75 and the rural group (n=64) with a mean of 4.66. The rural group consisted of 32 counties with only a mean of one-tenth of a point higher than the urban group. The difference between the urban and rural groups was not statistically significant (Sig.=. 196).
Quest ionnaire Results
A questionnaire for North Carolina's law enforcement agencies, juvenile court counselors, and detention and training school administrators was developed to identify common perceptions and explanations for minority overrepresentation. In this section, we give the results to the questions that we found to be important.
Figure 20 Results of Survey Question #1
Frequency Percent Valid Percent
Valid
Missing
Total
strongly agree agree somewhat agree disagree strongly disagree Total System Missing Total
9 24 12 25 5 75 1 1 76
11.8 31.6 15.8 32.9 6.6 98.7 1.3 1.3 100.0
12.0 32.0 16.0 33.3 6.7 100.0
18

Figure 20 represents question one on the survey, which asked respondents if they felt there was a problem with disproportionate minority confinement in their respective counties. According to the figure, 33.3% of the respondents who answered this question (n=75) disagreed that disproportionate minority confinement was a problem in their county compared to 32% who agreed that disproportionate minority confinement was a problem in their county. Moreover, 12% who answered this question strongly agreed that there was a problem with disproportionate minority confinement in their county, and 6.7% strongly disagreed that disproportionate minority confinement was a problem. The results show that there are mixed perceptions to the problem of minority overrepresentation among law enforcement agencies, court counselors, and detention and training school administrators. However, what we found to be interesting about these findings is that some of the respondents who felt disproportionate minority confinement was not a problem actually had indices of 1.9 or higher in both detention and training school admissions within their respective counties.
Figure 21 Results of Survey Question #3
Frequency Percent Valid Percent
Valid
Missing
Total
gotten better gotten worse stayed about the same no problem Total System Missing Total
7 7 38 22 74 2 2 76
9.2 9.2 50.0 28.9 97.4 2.6 2.6 100.0
9.5 9.5 51.4 29.7 100.0
Figure 21 represents question three, which asked respondents if the problem of minority overrepresentation in their county has gotten better or worse. According to the figure, 51.4% of the respondents who answered this question (n=74) felt that the problem has stayed about the same. In contrast, 9.5% of the respondents who answered the question reported that the problem has gotten better, and 9.5% of the respondents said that the problem has gotten worse.
19

F Figure 22 Results of Survey Question #11
Frequency Percent Valid Percent
Valid
Missing
Total
0 0 0 0 0 strongly agree agree somewhat agree disagree Total System Missing Total
1 4 7 5 1 3 14 2 13 50 26 26 76
1.3 5.3 9.2 6.6 1.3 3.9 18.4 2.6 17.1 65.8 34.2 34.2 100.0
2.0 8.0 14.0 10.0 2.0 6.0 28.0 4.0 26.0 100.0
Figure 23 Results of Survey Question #16
Frequency Percent Valid Percent
Valid
Missing
Total
Believe somewhat believe do not believe Total System Missing Total
3 9 29 41 35 35 76
3.9 11.8 38.2 53.9 46.1 46.1 100.0
7.3 22.0 70.7 100.0
3'igures 22 and 23 represent questions 11 and 16, which asked law enforcement agencies, uvenile court counselors, and detention and training school administrators separately if minority ¢ouths commit serious crimes at higher rates than white youths. According to juvenile court :ounselors and detention and training school administrators, 28% of the respondents who mswered the question (n=32) agreed that minority juveniles commit serious crimes at higher • ates than white youths compared to 26% who disagreed. Among the law enforcement agencies, )nly 7.3% of the respondents who answered the question (n=41) agreed that minority juveniles :ommit serious crimes at higher rates than whites compared to 70.7% who disagreed.
20

Figure 24 Results of Survey Question #19
Valid
Missing
Total
Yes No do not know Total System Missing Total
Frequency
34 14 19 67 9 9 76
Percent Valid Percent
44.7 50.7 18.4 2O.9 25.0 28.4 88.2 100.0 11.8 11.8 100.0
Finally, figure 24 represents question 19, which asked respondents if they believe that their county has been proactive to the problem of disproportionate minority confinement. Out of the respondents who answered this question, 50.7% (n=67) felt that their county was proactive to the problem of disproportionate minority confinement compared to 20.9% who felt that their county was not proactive.
Discussion
The results of this study show that disproportionate minority confinement still exists within North Carolina's juvenile justice system. Moreover, the problem has become worse since the previous studies in 1990 and 1994. The number of counties experiencing minority overrepresentation in arrest rates has increased from 66 in 1990 to 83 in 1998. Furthermore, the statewide minority arrest index has increased from 1.26 in 1990 to 1.7 in 1998. The number of counties experiencing minority overrepresentation in detention and training school admissions has also increased since 1990. The number of counties experiencing minority overrepresentation in detention school admissions has increased from 67 in 1990 to 80 in 1997/1998. However, the statewide minority detention index has declined slightly from 2.26 in 1990 to 2.13 in 1994 and finally to 2.1 in 1997/1998. Finally, the number of counties experiencing minority ovenepresentation in training school admissions has increased from 61 in 1990 to 72 in 1998. The statewide minority training school index has soared from 1.38 in 1990 to 2.3 in 1998.
Further analysis has shown that the number of alternative programs within a particular district has virtually no effect on detention and training school indices. The results show no correlation between the number of alternative programs per district and detention and training school indices. Paradoxically, districts with detention school index scores of 1.5 or lower did not have as many alternative programs as those districts with indexes of 1.6 or higher. In contrast, districts with training school indices of 1.5 or lower had more alternative programs than districts with index scores of 1.6 or higher, yet, the difference was not statistically significant. One explanation as to why the number of alternative programs have no effect on detention and
21

training school rates may be that the programs have reached over capacity and are thus unable to provide the one-on-one assistance necessary to suppress future delinquent behavior. Yet another explanation could be that judges in juvenile courts have bypassed alternative programs altogether in their adjudication of minority juveniles. The bypass of alternative programs could be occurring because judges feel that mitigating factors such as single-parent families, low education, disorganized neighborhoods, and crime-infested environments have plagued minority youth, therefore, not providing them adequate discipline. As a result, judges may adjudicate minority youth more often to detention and training schools for fear that the alternative programs are not going to provide the adequate amount of discipline necessary to suppress the delinquent behavior. This assumption creates a "net-widening effect" where an exorbitant number of minority youth find themselves sentenced to the more severe punishment instead of being adjudicated to an alternative program. Therefore, an excellent area for continual studies would be to look at decisions made among judges within the same district as well as from different districts to determine any significant differences which may lead to minority overrepresentation.
Another intriguing finding from this study is that minority youth, especially African-Americans, were arrested for a significant number of serious and violent crimes, which supports the previous theory that minority youth commit serious and violent crimes more often than white youth. Subsequently, minority youth represented 82% of the robbery arrests and 64% of the aggravated assault arrests in North Carolina for 1998. As a result, minority youth who were arrested for these types of crimes and eventually adjudicated may not have been qualified for alternative programs due to the seriousness of their crimes, which may lead to minority overrepresentation. The question here is whether minority youths that commit serious and violent crimes are equally sentenced to detention and training schools according to their representation in the general population when compared to white juveniles who commit similar offenses.
Our study also showed that community variance may have an impact on minority overrepresentation in the juvenile justice system. The results showed that counties classified as urban have higher detention and training school indices than those counties classified as rural. This may be due to the location of detention and training schools. Most of the detention and training schools are located within the larger counties. Therefore, counties classified as urban could easily send juvenile delinquents to these schools, whereas rural counties may find themselves more dependent on alternative programs as their primary means of correction for juvenile delinquents.
Finally, we were able to determine some significant perceptions of disproportionate minority confinement from the survey of law enforcement agencies, juvenile court counselors, and detention and training school administrators. One interesting finding from this survey was that some of the respondents who felt that disproportionate minority confinement was not a problem actually had indices of 1.9 or higher in both detention and training school admissions within their respective counties. This may mean that some of the agencies may not be aware of the problem, which may explain one reason why the problem continues to exist. Another finding from this survey was that 51.4% of the respondents felt that the problem of disproportionate minority confinement has stayed about the same compared to only 9.5% reporting the problem has gotten
22

better and 9.5% reporting the problem has gotten worse. The fact that the majority of the respondents felt that the problem has stayed about the same may be an indication that the intervention mechanisms may not be working to suppress the problem, or that nothing is being done to deal with the problem. Finally, we discovered that court counselors felt that minority youth commit serious and violent crimes at higher rates than white youth, which once again supports the previously-stated theory.
Recommendations
Now that an assessment of the severity of disproportionate minority confinement in the state of North Carolina has been made, recommendations for approaches to prevention and intervention strategies can be reviewed. The Office of Juvenile Justice and Delinquency Prevention reported in 1998 Pennsylvania's process as an example of efforts to approach the problem of DMC. Pennsylvania began its efforts in 1986 with the Pennsylvania Commission on Crime and Delinquency (PCCD) and the Juvenile Advisory Committee (JAC). In 1990, JAC established the Minority Confinement Subcommittee to focus on the disproportionate minority confinement issue. As a result, prevention and intervention programs were implemented in target counties.
From the evaluation of the Harrisburg programs (state capital area), officials found that of the 200 adolescent clients referred to the coalition during its first year of operation, 169 satisfied the minimum attendance criterion. Fifty percent of the coalition clients had a prior involvement with the juvenile justice system, yet, only twenty percent were referred to juvenile probation subsequent to their involvement with the coalition. Furthermore, the most outstanding outcome reported was from the period of 1992-1993. Over a three-year period, the recidivism rate for the high-attendance group was 25.8 percent in contrast to the low-attendance control group, which had a recidivism rate of 53 percent for the same period (Hsia and Hampton, 1997)
These results are an outcome of five prevention and intervention programs developed in the Harrisburg area. The Business Entrepreneur Club was created to help young, minority females learn work and life skills; Targeted Outreach was developed to provide educational, physical, social, and vocational programs to minority youth through the Boys and Girls Club to minority youth; Positive Choice was developed to give educational assistance to minority juveniles and to help youth make positive choices for the future; Project Connect works to improve school attendance and academic achievement by addressing social and familial needs in hopes of preventing youth from dropping out of school; and Hispanic Center After-School Program, which focuses on at-risk Hispanic students, helps to improve their school performance and reduce the rate of school failure and dropping out (1997).
Other recommendations for North Carolina include the following: Analyzing and comparing the decision-making process of judges in different districts, comparing decisions made by juvenile court judges within districts for significant differences, and looking at the percent of minorities arrested for specific crimes who are sent to detention and training schools, and further comparing those results to white juveniles who commit similar offenses. Another suggestion is determining if prior record is a variable that may lead to minority overrepresentation. Finally, research of the
23

existing alternative programs and obtaining a measure of their effectiveness in minority communities is crucial to the efforts in approaching the problem of DMC in North Carolina.
24

References
Bridges, G.S. and M. Myers (1994). Inequality, Crime, and Social Control. Boulder, Co: Westview Press, 158-175.
Caliber Associates (1996). Evaluation of the Disproportionate Minority Confinement Initiative. Washington, DC: U.S. Department of Justice, Office of Justice Programs, Office of Juvenile Justice and Delinquency Prevention.
Conley, Darlene J. (1994). Adding Color to a Black and White Picture: Using Qualitative Data to Explain Racial Disproportionality in the Juvenile Justice System. Journal of Research in Crime and Delinquency., 31,135-148.
Devine, Patricia, Kathleen Coolbaugh, and Susan Jenkins (1998). Disproportionate Minority Confinement: Lessons Learned from Five States. Washington, DC: U.S. Department of Justice, Office of Justice Programs, Office of Juvenile Justice and Delinquency Prevention.
Dunn, Christopher, Robert L. Perry, Stephen Cernkovich, and Jerry Wicks (1993). Race and Juvenile Justice in Ohio: The Overrepresentation and Disproportionate Confinement of African American and Hispanic Youth. Bowling Green, Ohio: Bowling Green State University.
Hsia, Heidi M., Ph.D. and Hamparian, Donna (1997). Disproportionate Minority Col~nement: 1997 Update. Washington, DC: U.S. Department of Justice, Office of Justice Programs, Office of Juvenile Justice and Delinquency Prevention.
Kurtz, P. David, Ph.D., Martha M. Giddings, Ph.D, and Richard Sutphen, Ph.D. (1993). A Prospective Investigation of Racial Disparity in the Juvenile Justice System. Juvenile and Family Court Journal, 43-59.
Mata, Jonas (1997). Overrepresentation of Hispanic/Latino Youth. Washington, DC: Coalition for Juvenile Justice.
Myers, Martha A. and Susette M. Talarico (1986). Urban Justice, Rural hjustice? Urbanization and Its Effects on Sentencing. Criminology, 24, 367-391.
North Carolina Criminal Justice Analysis Center of the Governor's Crime Commission: Raleigh, NC, (1996). Minority Overrepresentation in North Carolina's Juvenile Justice System: A Comparison of 1990 and 1994 Arrest and Admission Data.
U.S. Department of Justice and Office of Juvenile Justice and Delinquency Prevention: Washington, DC, (1990). Disproportionate Minority Confinement Technical Assistance Manual: Technical Reference and Information Series.
25

Winters, Oakley, Ed.D., Dean, Charles, Ph.D., Hirschel, David, Ph.D., and Brame, Bobby, M.S. (1996). Developing a Model Program Response to the Problem of Overrepresentation of Minorities in the Juvenile Justice System of the Four States. Charlotte, NC: University of North Carolina at Charlotte.
26
Appendix A
My name is with the Governor's Crime Commission. May I speak with someone in your department that is knowledgeable with juvenile crime?
Hello, my name is I 'm calling from the Governor's Crime Commission. The commission is conducting a study on disproportionate minority confinement within North Carolina's juvenile justice system and your county has been randomly selected to participate in a telephone survey. The term "Disproportionate Minority Confinement" has been used to describe the phenomenon of disproportionately large numbers of minority youth, eighteen years of age and under, who come into contact with the juvenile justice system at various stages, including, but not limited to, secure confinement in detention and training schools. The groups that we refer to as minorities are African Americans, Native Americans, Asian-Americans, Hispanic and Latinos, or any other non-Caucasian group. This study is important because it will help determine the significance of disproportionate minority confinement in North Carolina. Moreover, the study will be used as a reference tool to help policymakers create solutions for the problem of disproportionate minority confinement. Do you mind answering a few questions? Your input will be a significant contribution to our study.
General Information
What is your title/occupation?
What is your county/jurisdiction?
How long have you been in your position?
Section 1 : General Perceptions of DMC
1. Would you agree that there is a problem with disproportionate minority confinement in your county?
a. Strongly agree b. Agree c. Somewhat agree d. Disagree e. Strongly disagree
27

. Would you say that your county experienced problems with disproportionate minority confinement in the past?
a. Yes b. No c. Do not know
.
.
If there is a problem with disproportionate minority confinement in your county, would you say that the problem has:
a. Gotten better b. Gotten worse c. Stayed about the same d. There is no problem in your county
Why do you believe there is a problem with disproportionate minority confinement in your county (That is if you have a problem)?
.
Section 2: Information pertaining to alternative programs
Out of the following alternative programs, which would you say exist in your county as an alternative to detention and training schools?
a. House arrest b. Electronic Monitoring c. Intensive Supervision Probation d. Communi ty Service e. Day Incarceration Center f. Other
6. How long have these programs been in existence?
a. 0 to 5 years b. 6 to 10 years c. 10 years or more
7. Do you know which alternative program is utilized the most?
a. Yes b. No
28

7a. If so, which one?
8. How far are these alternative programs from the center of the county? arrest)
a. 0 to 10 miles b. 11 to 20 miles c. 21 to 30 d. 30 miles and over
(To exclude house
9. Have the alternative programs in your county reached over capacity?
a. Yes b. No c. Do not know
10. In your opinion, would you agree that alternative programs are effective in reducing the recidivism rates of juvenile offenders?
a. Strongly agree b. Agree c. Somewhat agree d. Disagree e. Strongly disagree
***Skip to section 4 if interviewee is a law enforcement officer***
Section 3: Perceptions on prior record and seriousness of crime
I 1. Would you agree that minority youths commit serious crimes at higher rates than white youths?
a. Strongly agree b. Agree c. Somewhat agree d. Disagree e. Strongly disagree
29

12. Do you think the prior records of minority youths are more extensive than prior records of white youths?
a. Yes b. No c. Do not know
13. Approximately what percent of minorities are arrested for the following crimes?
a. Robbery b. Burglary c. Aggravated Assault d. Drug Related Offenses e. Larceny
f. Disorderly Conduct g. Truancy
*** Skip to section 5 if not a law enforcement officer ***
Section 4: Arrest and Patrol Practices
14. Would you agree that minority youths come into contact with law enforcement more often than white youths during routine patrols?
a. Strongly agree b. Agree c. Somewhat agree d. Disagree e. Strongly disagree
15. Would you agree that patrols in your county are concentrated more in areas where there are a substantial number of minorities?
a. Strongly agree b. Agree c. Somewhat agree d. Disagree e. Strongly disagree
30
16. Do you believe that minority youths commit more serious and violent crimes than white youths?
a. Believe b. Somewhat believe c. Do not believe
17. Do you agree that demeanor plays an important role in decisions made by police officers to detain a juvenile delinquent?
a. Strongly agree b. Agree c. Somewhat agree d. Disagree e. Strongly Disagree
18. Would you agree that minority youths accumulate more charges than white youths that commit similar crimes?
a. Strongly agree b. Agree c. Somewhat agree d. Disagree e. Strongly disagree
Section 5: Policy and Prevention
19. Do you believe that your county has been proactive to the problem of disproportionate minority confinement?
a. Yes b. No c. Do not know
20. What has your county done to deal with the problem of disproportionate minority confinement? (Open-ended question)
21. Do you feel that there should be future policies implemented in the juvenile justice system to deal with the problem of disproportionate minority confinement?
a. Yes a. No
31

22. How would you address the problem of disproportionate minority confinement within your county? (Open-ended question)
32