Embed Size (px)
Citation preview
REVIEW
A biogeographical regionalization of Angolan mammalsPatrícia RODRIGUES Instituto de Investigação Científica Tropical, R. da Junqueira, 86 – 1°, 1300-344Lisboa, Portugal, and CIBIO/InBio – Centro de Investigação em Biodiversidade e Recursos Genéticos,Universidade do Porto, Campus Agrário de Vairão, 4485-661 Vairão, Portugal.E-mail: [email protected] FIGUEIRA Instituto de Investigação Científica Tropical, R. da Junqueira, 86 – 1°, 1300-344 Lisboa,Portugal, and CIBIO/InBio – Centro de Investigação em Biodiversidade e Recursos Genéticos,Universidade do Porto, Campus Agrário de Vairão, 4485-661 Vairão, Portugal.E-mail: [email protected] VAZ PINTO CIBIO/InBio – Centro de Investigação em Biodiversidade e Recursos Genéticos,Universidade do Porto, Campus Agrário de Vairão, 4485-661 Vairão, Portugal, Departamento deBiologia, Faculdade de Ciências, Universidade do Porto, Rua do Campo Alegre s/n. 4169-007 Porto,Portugal, ISCED – Instituto Superior de Ciências da Educação da Huíla, Rua Sarmento Rodrigues,Lubango, Angola, and The Kissama Foundation, Rua Joaquim Capango n°49, 1°D, Luanda, Angola.E-mail: [email protected] B. ARAÚJO Departmento de Biogeografía y Cambio Global, Museo Nacional de CienciasNaturales, CSIC, Calle José Gutiérrez Abascal, 2, 28006 Madrid, Spain, CIBIO/InBio, Universidade deÉvora, Largo dos Colegiais, 7000 Évora, Portugal, and Center for Macroecology, Evolution andClimate, Natural History Museum of Denmark, University of Copenhagen, Universitetsparken 15,DK-2100 Copenhagen, Denmark. E-mail: [email protected] BEJA* CIBIO/InBIO – Centro de Investigação em Biodiversidade e Recursos Genéticos,Universidade do Porto, Campus Agrário de Vairão, 4485-661 Vairão, Portugal, Departamento deBiologia, Faculdade de Ciências, Universidade do Porto, Rua do Campo Alegre s/n. 4169-007 Porto,Portugal, and ISCED – Instituto Superior de Ciências da Educação da Huíla, Rua Sarmento Rodrigues,Lubango, Angola. E-mail: [email protected]
Keywordsenvironmental gradient, historical distribution,South-West Africa, vertebrates, zoogeography
*Correspondence author.
Submitted: 2 July 2014Returned for revision: 11 November 2014Revision accepted: 15 January 2015Editor: KH
doi:10.1111/mam.12036
ABSTRACT
1. We developed a biogeographical regionalization of Angolan mammals basedon data collected before major declines occurred during the civil war (1975–2002). In terms of its biodiversity, Angola is one of the least known of all Africancountries.2. We used 9880 grid records of 140 species (rodents, ungulates and carnivores)collected mainly in 1930–80, at a quarter degree cell resolution. Biogeographicalregions were identified by using cluster analysis, based on βsim dissimilarity matri-ces and a hierarchical classification using Ward’s method. An indicator valueanalysis was used to identify species characterizing each region. Distance-basedredundancy analysis was used to investigate the environmental correlates of mam-malian assemblages.3. Four biogeographical subdivisions emerged from ungulate distributions, whilerodent and carnivore data were largely uninformative. In the north, the Zaire-Lunda-Cuanza region was mainly characterized by ungulate species associatedwith Congolian forests. In the south, the Namibe and Cunene-Cuando Cubangoregions were mainly characterized by ungulates widespread in south-western andsouthern Africa. In between these regions, the Central Plateau region was mainly
bs_bs_banner
Mammal Review ISSN 0305-1838
103Mammal Review 45 (2015) 103–116 © 2015 The Mammal Society and John Wiley & Sons Ltd
characterized by a few widespread ungulate species that are relatively common indense miombo woodlands.4. Biogeographical patterns were significantly associated with a dominant north–south gradient of decreasing humidity and increasing temperature, and with aconcurrent gradient from dense forests and woodlands to open savannas, grass-lands and deserts.5. The biogeographical regions we identified in Angola were largely consistentwith other bioregionalizations developed using various taxonomic groups at largerspatial scales. Biogeographical patterns reflected the southward penetration ofCongolian forest species in the north, and the northward penetration of southernAfrican desert/grassland species in the south-west and of open savanna species inthe south. These processes seem to be controlled by the distribution of vegetationtypes, which in turn are associated with climatic gradients and soil types. Thestronger patterns observed for ungulates than for other mammals may reflect theclose association of ungulates to specific vegetation types.
INTRODUCTION
Biogeographical regionalizations allow the definition ofhomogeneous regions in terms of species assemblages, andthe identification of factors potentially shaping the spatialdistribution of such assemblages. Therefore, they areincreasingly regarded as a preliminary step towards theplanning of conservation efforts (Ladle & Whittaker 2011).Despite their value, development of accurate biogeographi-cal regionalizations is limited by the shortage of informa-tion on species’ distributions, particularly in poorlyexplored regions of the world. In such areas, species’ distri-bution data often reflect the distribution of researchers’interests rather than that of species, creating a number ofspatial biases that may confound biological patterns (Pyke& Ehrlich 2010). Furthermore, the time frame for data col-lection may be considerably different from the time frameof the analysis, thus bringing in additional inaccuracies withregard to the current situation (Pyke & Ehrlich 2010). Thepractical application of these studies may also be limitedbecause data resolution may be too coarse to delineate accu-rately the boundaries between adjacent regions. Develop-ment of biogeographical regionalizations in poorly knownareas thus remains a theme of major applied value, whichmay help to validate studies conducted at larger spatialscales and contribute towards refining the prioritization ofconservation action.
Efforts to develop comprehensive biogeographical regio-nalizations for Africa have a long history. Early researchersinvestigated the biogeographical patterns of the plants(Lebrun 1947, Monod 1957, White 1965), butterflies(Carcasson 1964), amphibians (Poynton 1964) and birds(Chapin 1932) of Sub-Saharan and Southern Africa. Researchon this topic has proceeded during the past two decades, andbiogeographical regionalizations have been proposed for
amphibians (Penner et al. 2011), birds (de Klerk et al. 2002,Muñoz et al. 2003) and mammals (Gelderblom et al. 1995,Rowe-Rowe & Taylor 1996, Grubb et al. 2000). Researchersanalysing both plant and animal distributions proposed thedivision of Sub-Saharan Africa into the Saharan, Sudanian,Ethiopian, Somalian, Congolian, Zambezian and SouthernAfrican regions (Linder et al. 2012). These broad biogeo-graphical regions, however, were recognized as containingsubstantial internal structure, corresponding to sub-regionscharacterized, for instance, by particular environmental con-ditions or by the presence of centres of endemism and islandsof high diversity (Linder et al. 2012). Accurate identificationof sub-regions would require analyses conducted at finerresolution than typically carried out; such analyses couldstrongly contribute to improving our knowledge of Africanbiogeography.
In this study, we undertake a biogeographical regio-nalization of Angola based on previously unavailable dataon the historical distribution of mammalian species. Angolais a large and biodiverse country in south-western Africa,which includes areas of global conservation importancesuch as the coastal escarpment, but where biodiversityresearch is largely lacking (Myers et al. 2000, Figueiredoet al. 2009, Mills 2010, Romeiras et al. 2014). Linder et al.(2012) classified most of the country as falling into theZambezian region, with a transition fringe in the Congolianbiogeographical unit in the north (Shaba), and transitionfringes in the South African unit in the south-west (south-western Angola) and in the south (Kalahari). The boundar-ies between units, however, were highly sketchy and variedto some extent depending on the taxonomic group (Linderet al. 2012). Furthermore, within the large Zambezianregion, there is probably much biotic heterogeneity, as sug-gested for instance by the identification of several vegetationunits in early phytogeographic research (Barbosa 1970) and
Biogeographical regionalization of Angolan mammals P. Rodrigues et al.
104 Mammal Review 45 (2015) 103–116 © 2015 The Mammal Society and John Wiley & Sons Ltd
by high levels of species turnover (Linder et al. 2012). Theanalysis of mammalian data could contribute towardsresolving these uncertainties, as mammals are a relativelyspecious group for which a wealth of information existsfrom colonial times (mainly from the 20th century; Linderet al. 2012). Although humans have a strong impact onmammalian distributions, particularly on those of largecarnivores and ungulates, most of the data we used werecollected before the civil war (1975–2002) when wide-spread poaching strongly affected a range of species(Crawford-Cabral & Veríssimo 2005, Chase & Griffin 2011).
The aims of this study were to: (1) review and compile ina digital format the data on mammalian species’ distribu-tions for Angola; (2) use the data to identify biogeo-graphical units or regions, based on repeatable statisticalprocedures; (3) identify ‘indicator’ species that discriminatethe different regions; and (4) identify the environmentalcorrelates of the biogeographical patterns uncovered.Results were interpreted in the light of current understand-ing of the biogeography of this region of Africa.
METHODS
Study area
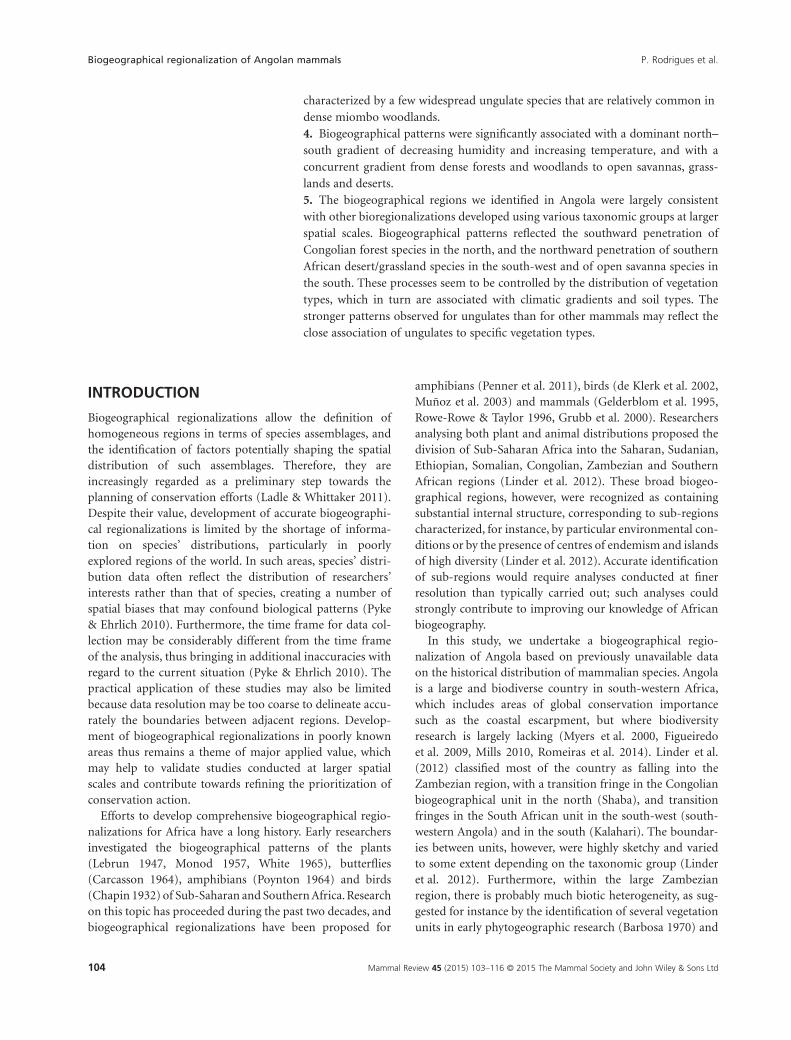
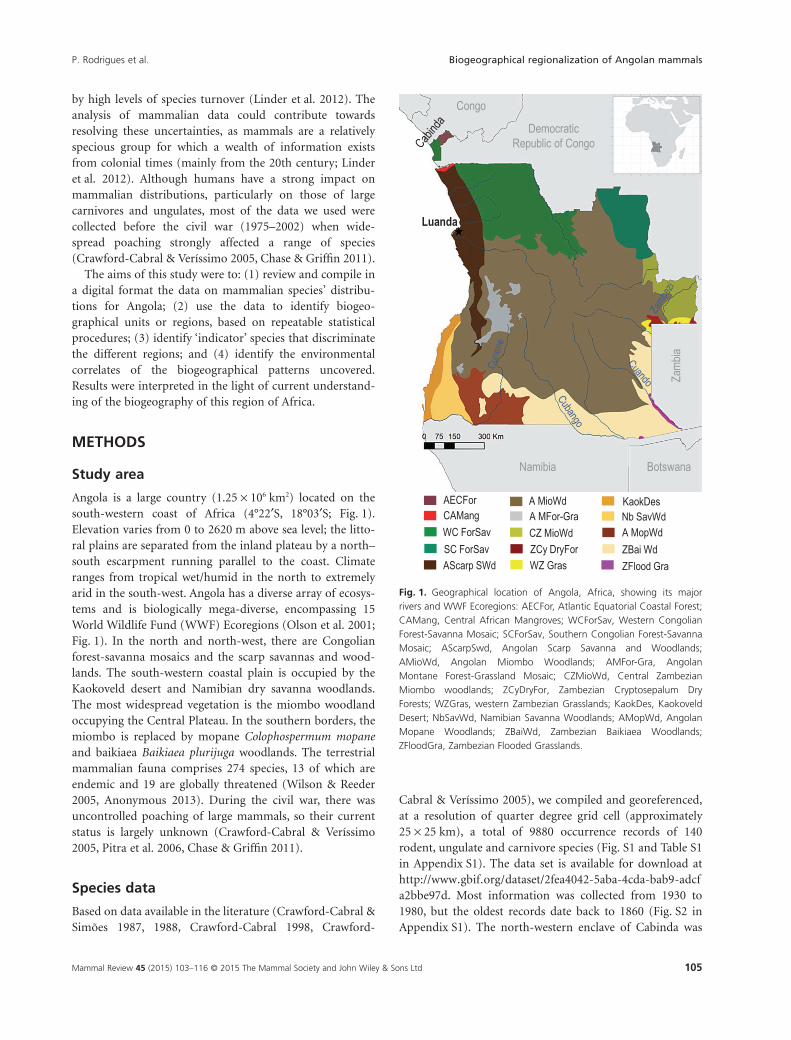
Angola is a large country (1.25 × 10⁶ km2) located on thesouth-western coast of Africa (4°22′S, 18°03′S; Fig. 1).Elevation varies from 0 to 2620 m above sea level; the litto-ral plains are separated from the inland plateau by a north–south escarpment running parallel to the coast. Climateranges from tropical wet/humid in the north to extremelyarid in the south-west. Angola has a diverse array of ecosys-tems and is biologically mega-diverse, encompassing 15World Wildlife Fund (WWF) Ecoregions (Olson et al. 2001;Fig. 1). In the north and north-west, there are Congolianforest-savanna mosaics and the scarp savannas and wood-lands. The south-western coastal plain is occupied by theKaokoveld desert and Namibian dry savanna woodlands.The most widespread vegetation is the miombo woodlandoccupying the Central Plateau. In the southern borders, themiombo is replaced by mopane Colophospermum mopaneand baikiaea Baikiaea plurijuga woodlands. The terrestrialmammalian fauna comprises 274 species, 13 of which areendemic and 19 are globally threatened (Wilson & Reeder2005, Anonymous 2013). During the civil war, there wasuncontrolled poaching of large mammals, so their currentstatus is largely unknown (Crawford-Cabral & Veríssimo2005, Pitra et al. 2006, Chase & Griffin 2011).
Species data
Based on data available in the literature (Crawford-Cabral &Simões 1987, 1988, Crawford-Cabral 1998, Crawford-
Cabral & Veríssimo 2005), we compiled and georeferenced,at a resolution of quarter degree grid cell (approximately25 × 25 km), a total of 9880 occurrence records of 140rodent, ungulate and carnivore species (Fig. S1 and Table S1in Appendix S1). The data set is available for download athttp://www.gbif.org/dataset/2fea4042-5aba-4cda-bab9-adcfa2bbe97d. Most information was collected from 1930 to1980, but the oldest records date back to 1860 (Fig. S2 inAppendix S1). The north-western enclave of Cabinda was
Luanda
AECForCAMang
WC ForSav
SC ForSavAScarp SWd
A MioWdA MFor-Gra
CZ MioWd
ZCy DryForWZ Gras
KaokDesNb SavWdA MopWd
ZBai Wd
ZFlood Gra
Congo
Democratic Republic of Congo
BotswanaNamibia
Zam
bia
Fig. 1. Geographical location of Angola, Africa, showing its majorrivers and WWF Ecoregions: AECFor, Atlantic Equatorial Coastal Forest;CAMang, Central African Mangroves; WCForSav, Western CongolianForest-Savanna Mosaic; SCForSav, Southern Congolian Forest-SavannaMosaic; AScarpSwd, Angolan Scarp Savanna and Woodlands;AMioWd, Angolan Miombo Woodlands; AMFor-Gra, AngolanMontane Forest-Grassland Mosaic; CZMioWd, Central ZambezianMiombo woodlands; ZCyDryFor, Zambezian Cryptosepalum DryForests; WZGras, western Zambezian Grasslands; KaokDes, KaokoveldDesert; NbSavWd, Namibian Savanna Woodlands; AMopWd, AngolanMopane Woodlands; ZBaiWd, Zambezian Baikiaea Woodlands;ZFloodGra, Zambezian Flooded Grasslands.
P. Rodrigues et al. Biogeographical regionalization of Angolan mammals
105Mammal Review 45 (2015) 103–116 © 2015 The Mammal Society and John Wiley & Sons Ltd
excluded from analysis because this small area is disjointedfrom the rest of the country and has very distinct environ-mental conditions (Barbosa 1970). Therefore, the bushpigPotamochoerus porcus, occurring only in Cabinda, wasexcluded from analysis. The African manatee Trichechussenegalensis was also excluded because it is exclusivelyaquatic. The subspecies considered in the original publica-tions were maintained because they correspond to taxa thatcould be easily recognized by field observers. In commonwith other biogeographical and phylogeographical studies(e.g. Lorenzen et al. 2012), we used the term ungulate in adescriptive sense to refer to hoofed mammals, though itdoes not correspond to a well-defined taxonomic unit.Nomenclature follows Wilson and Reeder (2005), unlessindicated otherwise (Table S1 in Appendix S1).
Environmental data set
Relationships between species assemblages and environ-mental conditions were explored by using climate, soil,landform and vegetation variables (Tables S2 and S3 inAppendix S1). Climate data were obtained from WorldClim(version 1.4) at a resolution of 2.5 arc-min, using the 19variables describing aspects of temperature and precipita-tion (Hijmans et al. 2005), and elevation. They encom-passed the period from 1950 to 2000 and were resampled tomirror species data resolution. A principal componentanalysis was performed to investigate multicollinearity andreduce dimensionality (Dormann et al. 2013). The fourmost uncorrelated climate variables were carried on to sub-sequent analysis (Table S2 in Appendix S1). The dominantsoil type and landform of each grid cell were extracted fromthe Soil and Terrain Digital Database for Southern Africa vs.1.0 (SOTERSAF, available at http://www.isric.org/data/soil-and-terrain-database-southern-africa-ver-10-sotersaf). Soilcategories were placed in major groups according to theWorld Reference Base for Soil Resources (Anonymous2006). The dominant vegetation type was extracted fromthe phytogeographic map of Angola (Barbosa 1970). Thetotal number of species records per grid cell was included toaccount for the possibility of sampling effort influencingperceived variation in species assemblage patterns (Barbosaet al. 2010).
Data analysis
IDENTIFICATION OF BIOGEOGRAPHICAL REGIONS
Data analysis was designed to identify biogeographicalregions, corresponding to sets of grid cells that are moresimilar in species composition to each other than to anyother set of grid cells. Separate analyses were carried out forthe overall data set, and for the rodent, carnivore and ungu-
late data sets, in order to check whether the different groupspresented similar patterns. Cells with fewer than five specieswere excluded because preliminary analysis suggested thatthis cut-off represented a good compromise between elimi-nating potential biases and the artefacts created by fewrecords per cell, and the need to retain a sufficiently largenumber of cells to obtain meaningful spatial patterns(Heikinheimo et al. 2007, Kreft & Jetz 2010). Dissimilaritybetween each pair of cells was estimated using the Simpsondissimilarity index (βsim) because it is independent of speciesrichness gradients and does not take double absences intoaccount (Koleff et al. 2003, Kreft & Jetz 2010). The cells werethen clustered by applying Ward’s minimum variance clus-tering method to the βsim dissimilarity matrix (Borcard et al.2011). To determine the optimal number of clusters, weexamined fusion level plots of the merging height of nodesin the dendrogram against the number of clusters andapplied the L-method (Salvador & Chan 2004). We evalu-ated the validity of cluster results by using the copheneticcorrelation coefficient (Legendre & Legendre 1998, Kreft &Jetz 2010). We also mapped the spatial distribution of thegroups to check for spatial coherence (i.e. the association ofa group with a well-defined spatial region). When groupswere not associated with well-defined regions, we reducedthe number of groups to maximize spatial interpretability(Legendre & Legendre 1998). Analyses were implemented inr v.3.0.1 (Anonymous 2005) using the ‘cluster’ (Maechleret al. 2014) and ‘vegan’ (Oksanen et al. 2013) packages.
To visualize the spatial pattern of biogeographical regionsobtained for carnivores, ungulates and rodents at each levelof cluster analyses, we converted grid cells into a network ofThiessen polygons (Schulman et al. 2007, Vale & Jenkins2012). Each Thiessen polygon contained the centre of asingle grid cell with species occurrence records (anchorpoint), and delimited the area within which any locality iscloser to its anchor point than to the anchor point of allother Thiessen polygons (Lo & Yeung 2002). Thiessen net-works provide a simple method to visualize spatial variationin collection intensity because polygons tend to be largerwhere sampling was sparser (Schulman et al. 2007, Vale &Jenkins 2012). The average area of Thiessen polygons thusprovided a surrogate of sampling effort in different biogeo-graphical regions (Schulman et al. 2007, Vale & Jenkins2012).
INDICATOR SPECIES
Indicator species analysis was used to explore the composi-tion of mammal assemblages in the biogeographic regionsand to identify which species discriminate the differentregions well and can thus be interpreted as being character-istic of them (Dufrêne & Legendre 1997, Proches &Ramdhani 2012). An indicator value (IndVal) was estimated
Biogeographical regionalization of Angolan mammals P. Rodrigues et al.
106 Mammal Review 45 (2015) 103–116 © 2015 The Mammal Society and John Wiley & Sons Ltd
for each species, as the product of the relative frequency ofthe species in the target site group divided by the sum ofrelative frequencies over all groups, and the relative fre-quency of occurrence of the species inside the target sitegroup. The maximum value (IndVal = 1) is given to aspecies when it is found in all sites of a group (maximumspecificity) and exclusively in that group (maximum fidel-ity). We considered a species to be an indicator when itsIndVal > 0.50 for a P < 0.05. The statistical significance ofeach IndVal was assessed though a randomization proce-dure with 999 permutations. Analysis was performed usingthe function ‘multipatt’ from the r package ‘indicspecies’(De Cáceres & Legendre 2009).
ENVIRONMENTAL RELATIONSHIPS
Distance-based redundancy analysis (dbRDA) was used toinvestigate the influences of environmental variables on thespecies composition of mammalian assemblages, thus con-tributing to our interpretation of the results of the clusteranalysis. The dbRDA technique uses redundancy analysisbut allows the analysis to be based on a range of ecologicallymeaningful measures of dissimilarity, through the use ofprincipal coordinate analysis (Legendre & Anderson 1999).Dissimilarity was based on βsim to maintain consistency withthe cluster analysis, but values were square-root trans-formed to eliminate negative eigenvalues from the principalcoordinate analysis (Legendre & Anderson 1999). Westarted analysis by building a full model including the sevenenvironmental variables and the surrogate of samplingeffort. A backward elimination procedure was then used toremove the variables least related to variation in mamma-lian assemblage. We eliminated all variables with P > 0.05, asjudged from Monte Carlo permutation tests (1000 permu-tations). The overall significance of the reduced model andthat of individual axes was also assessed with permutationtests. All analyses were performed in r using ‘vegan’(Oksanen et al. 2013).
RESULTS
Biogeographical regions
Dendrograms produced in cluster analysis retained about40–50% of pairwise dissimilarity between grid cells, consid-ering either the overall data set or each of the three speciesgroups (carnivores, ungulates and rodents; Table S4 inAppendix S2). The numbers of clusters identified by theL-method were five for carnivores, 11 for ungulates, and 12for rodents and the overall data set (Fig. S3 in Appen-dix S2). However, visual inspection of maps suggested thatthe number of subdivisions identified was overly large asthere was no clear matching between clusters of grids and
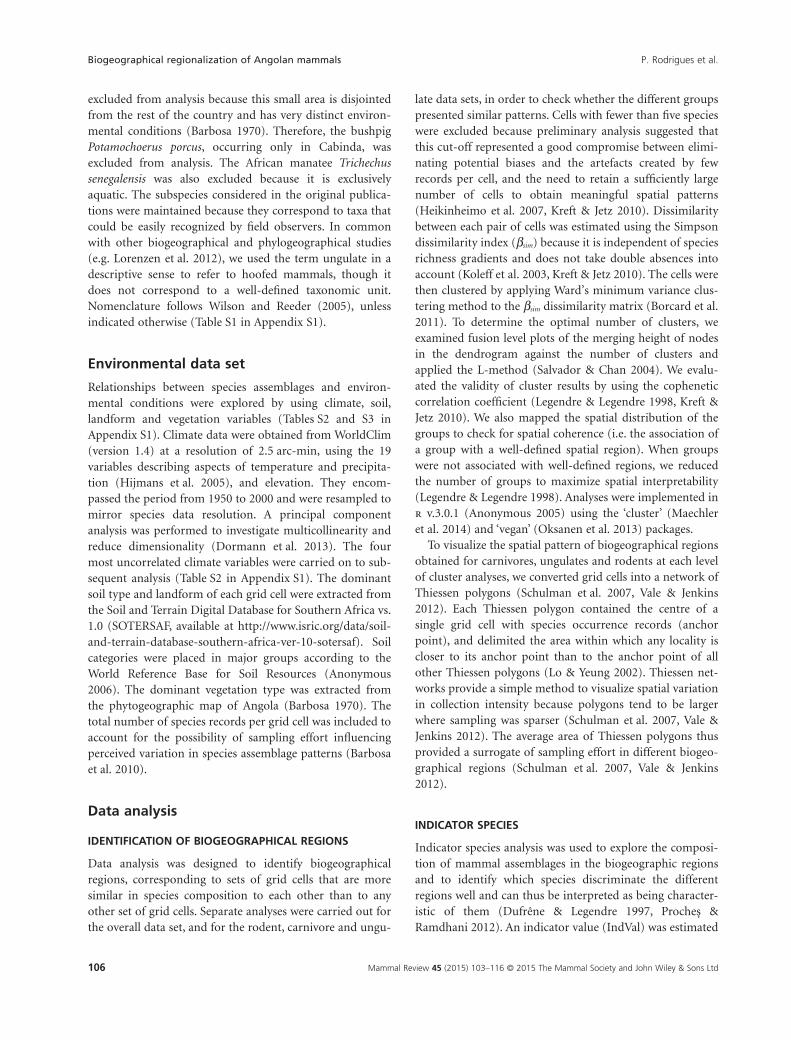
coherent geographical regions. Maps produced usingsmaller numbers of clusters suggested that maximumspatial interpretability was reached for subdivisions in threeor four clusters (Fig. 2).
For the overall data set, the first split retrieved two well-defined regions, one in northern and central Angola, andanother in the south and extreme east of the country(Fig. 2a). The second split (three clusters) largely retainedthe north-central region, while in the south, it separated theNamibe region, roughly corresponding to the Kaokovelddesert and the Namibian dry savanna woodlands of thesouth-western coastal plain, and the Cunene-CuandoCubango region, mainly encompassing the Mopane andbaikiaea woodlands along the border with Namibia. Spatialcoherence was largely lost in the third and fourth splits,though the Namibe and Cunene-Cuando Cubango regionsretained their identity. The Central Plateau was divided intotwo or three loosely defined regions, which stronglyintergraded into each other.
Clusters identified using the ungulates shared some simi-larities to those obtained with the overall data set, thoughwith some differences (Fig. 2b). The first split also separatedthe northern from the southern regions, but in contrast tothe global analysis, part of the Central Plateau was assignedto the southern region. The second split separated theNamibe region from the rest of the southern region. Thethird split further subdivided the southern region, separat-ing the Cunene-Cuando Cubango region from the southernpart of the Central Plateau. The northern-central regionwas subdivided in the fourth split, largely separating theCongolian woodland-savanna mosaics of the north andnorth-west, from the southern miombo woodlands of theCentral Plateau. However, the two subregions did not showwell-defined boundaries, intergrading to some extent intoeach other.
Clustering for rodents and carnivores showed weakspatial patterns (Fig. 2c, d). Nevertheless, the Namibe regionwas clearly identified from the carnivore data set, which alsoshowed some separation between the northern and south-ern regions of Angola (Fig. 2d).
Indicator species
For the overall data set and considering the division in threebroad regions (Fig. 2a), a total of 18 species (all ungulates)showed an IndVal > 0.50 for a P < 0.05 and were thus iden-tified as indicators (Fig. 3a; Table S5 in Appendix S2). Thenorthern-central region was mostly associated with thepresence of African forest buffalo Syncerus caffer nanus,bushbuck Tragelaphus scriptus, bushpig Potamochoeruslarvatus and hippopotamus Hippopotamus amphibius. TheNamibe region was characterized primarily by the presenceof springbok Antidorcas marsupialis, Kirk’s dik-dik
P. Rodrigues et al. Biogeographical regionalization of Angolan mammals
107Mammal Review 45 (2015) 103–116 © 2015 The Mammal Society and John Wiley & Sons Ltd
Madoqua kirkii, klipspringer Oreotragus oreotragus, gems-bok Oryx gazella, mountain zebra Equus zebra, greater kuduTragelaphus strepsiceros, steenbok Raphicerus campestris andBurchell’s zebra Equus burchellii. The Cunene-CuandoCubango region was associated with blue wildebeestConnochaetes taurinus, roan antelope Hippotragus equinus,elephant Loxodonta spp., buffalo Syncerus caffer caffer,common tsessebee Damaliscus lunatus and sable antelopeHippotragus niger niger. Albeit with much lower IndVals,there were some rodents and carnivores associated with thethree regions, including for instance in the north-centralregion: Mastomys angolae (0.44), Southern savanna gerbil
Gerbilliscus validus (0.39) and Griselda’s LemniscomysLemniscomys griselda (0.38); Cunene-Cuando Cubangoregion: highveld gerbil Gerbilliscus brantsii (0.30), black-tailed Thallomys Thallomys nigricauda and spotted hyenaCrocuta crocuta; Namibe region: Cape fox Vulpes chama(0.44), Namaqua rock rat Aethomys namaquensis (0.44) androck hyrax Procavia (capensis) welwitschii (0.42).
Considering the four broad regions identified for ungu-lates (Fig. 2b), the species with strong IndVals for theNamibe region were the same as those identified in theoverall analysis, though there were some differences in theirrelative importance (Fig. 3b, Table S6 in Appendix S2).
Fig. 2. Sequence of clustering of the mammal data cells for the first four splits of the cluster analysis and for each data set: (a) all species; (b) ungu-lates; (c) rodents; (d) carnivores. Colours are used to differentiate clusters within each image and do not imply one-to-one matches between imagesof the same data set.
Biogeographical regionalization of Angolan mammals P. Rodrigues et al.
108 Mammal Review 45 (2015) 103–116 © 2015 The Mammal Society and John Wiley & Sons Ltd
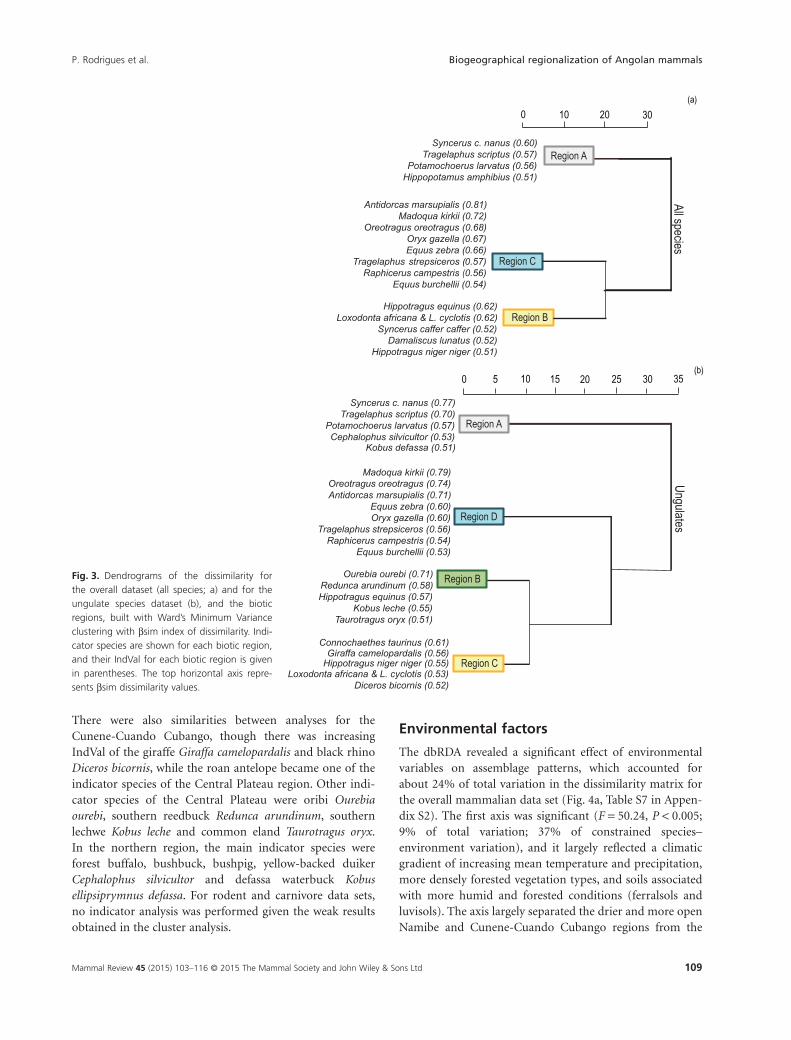
There were also similarities between analyses for theCunene-Cuando Cubango, though there was increasingIndVal of the giraffe Giraffa camelopardalis and black rhinoDiceros bicornis, while the roan antelope became one of theindicator species of the Central Plateau region. Other indi-cator species of the Central Plateau were oribi Ourebiaourebi, southern reedbuck Redunca arundinum, southernlechwe Kobus leche and common eland Taurotragus oryx.In the northern region, the main indicator species wereforest buffalo, bushbuck, bushpig, yellow-backed duikerCephalophus silvicultor and defassa waterbuck Kobusellipsiprymnus defassa. For rodent and carnivore data sets,no indicator analysis was performed given the weak resultsobtained in the cluster analysis.
Environmental factors
The dbRDA revealed a significant effect of environmentalvariables on assemblage patterns, which accounted forabout 24% of total variation in the dissimilarity matrix forthe overall mammalian data set (Fig. 4a, Table S7 in Appen-dix S2). The first axis was significant (F = 50.24, P < 0.005;9% of total variation; 37% of constrained species–environment variation), and it largely reflected a climaticgradient of increasing mean temperature and precipitation,more densely forested vegetation types, and soils associatedwith more humid and forested conditions (ferralsols andluvisols). The axis largely separated the drier and more openNamibe and Cunene-Cuando Cubango regions from the
Region A
Region B
Region C
Syncerus c. nanus (0.60)Tragelaphus scriptus (0.57)
Potamochoerus larvatus (0.56)Hippopotamus amphibius (0.51)
Antidorcas marsupialis (0.81)Madoqua kirkii (0.72)
Oreotragus oreotragus (0.68)Oryx gazella (0.67)Equus zebra (0.66)
Tragelaphus strepsiceros (0.57)Raphicerus campestris (0.56)
Equus burchellii ( 0.54)
Connochaethes taurinus (0.71)Hippotragus equinus (0.62)Loxodonta africana & L. cyclotis (0.62)
Syncerus caffer caffer (0.52)Damaliscus lunatus (0.52)
Hippotragus niger niger (0.51)
All species0 10 20 30
(a)
Fig. 3. Dendrograms of the dissimilarity forthe overall dataset (all species; a) and for theungulate species dataset (b), and the bioticregions, built with Ward’s Minimum Varianceclustering with βsim index of dissimilarity. Indi-cator species are shown for each biotic region,and their IndVal for each biotic region is givenin parentheses. The top horizontal axis repre-sents βsim dissimilarity values.
P. Rodrigues et al. Biogeographical regionalization of Angolan mammals
109Mammal Review 45 (2015) 103–116 © 2015 The Mammal Society and John Wiley & Sons Ltd
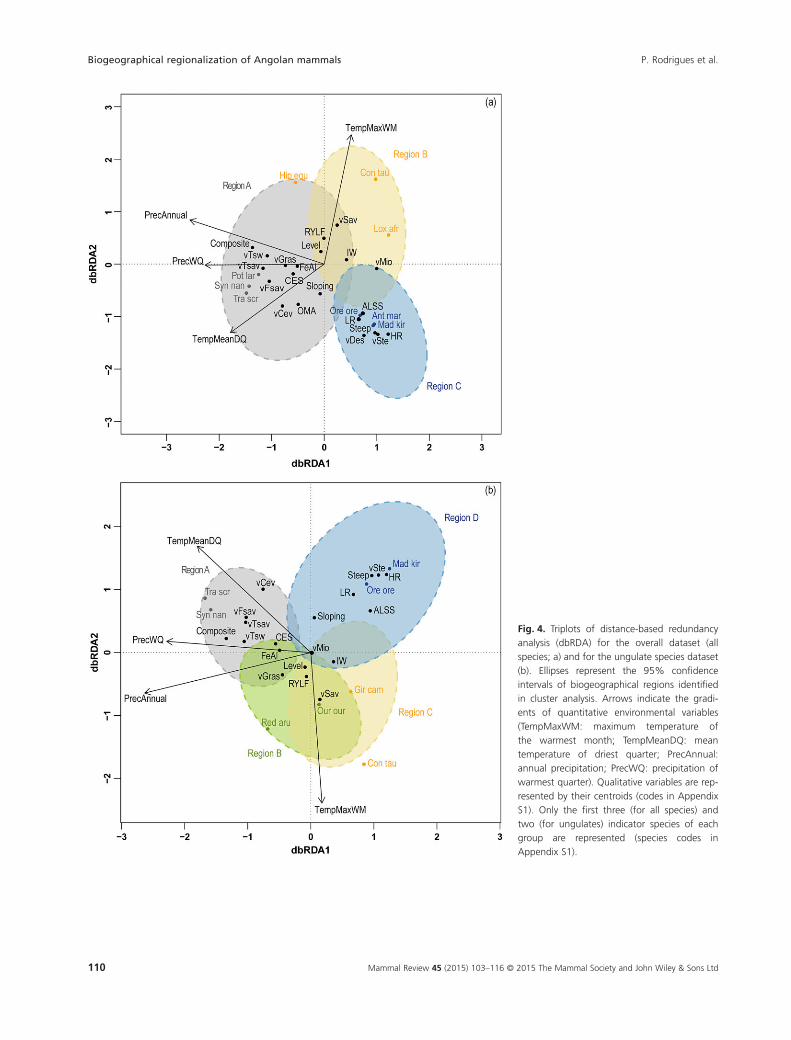
Fig. 4. Triplots of distance-based redundancyanalysis (dbRDA) for the overall dataset (allspecies; a) and for the ungulate species dataset(b). Ellipses represent the 95% confidenceintervals of biogeographical regions identifiedin cluster analysis. Arrows indicate the gradi-ents of quantitative environmental variables(TempMaxWM: maximum temperature ofthe warmest month; TempMeanDQ: meantemperature of driest quarter; PrecAnnual:annual precipitation; PrecWQ: precipitation ofwarmest quarter). Qualitative variables are rep-resented by their centroids (codes in AppendixS1). Only the first three (for all species) andtwo (for ungulates) indicator species of eachgroup are represented (species codes inAppendix S1).
Biogeographical regionalization of Angolan mammals P. Rodrigues et al.
110 Mammal Review 45 (2015) 103–116 © 2015 The Mammal Society and John Wiley & Sons Ltd
moister and more forested northern-central region. Thesecond axis was also significant (F = 32.8, P < 0.005; 6% oftotal variation; 24% of constrained variation), and it mainlycorresponded to a gradient of increasing maximum tem-perature of the warmest month. Along this axis, there was aseparation of the two drier biogeographical regions. TheNamibe region was associated with desert and steppe veg-etation, hard rock, shallow and stony soils (leptosols), orarid zone soils (calcisols), and steep landforms. In contrast,the Cunene-Cuando Cubango region was associated withhigher temperature in the warmest months, and shrub andtree savanna vegetation.
The species–environment relationships extracted by thedbRDA for ungulates were also significant, accounting forabout 32% of total variation in the dissimilarity matrix forthe ungulate data set (Fig. 4b, Table S8 in Appendix S2). Thefirst axis was significant (F = 68.6, P < 0.005; 14% of totalvariation; 43% of constrained species–environment varia-tion), and it also highlighted a gradient stretching from thedrier Namibe and Cunene-Cuando Cubango regions to themoister and more forested northern region. The CentralPlateau had an intermediate position along this axes, reflect-ing smooth north–south transitions rather than sharp dis-continuities between regions. The second axis was alsosignificant (F = 40.89, P < 0.005; 8% of total variation; 26%of constrained variation); it mainly separated the Namiberegion from the Cunene-Cuando Cubango region and wasalso defined by the gradient of increasing temperature inthe warmest months identified for the overall assemblage.
DISCUSSION
We identified four main biogeographical units in Angola:one northern region (Zaire-Lunda-Cuanza), one centralregion (Central Plateau) and two regions in the south(Namibe and Cunene-Cuando Cubango). Although theseregions emerged clearly when we considered ungulate dis-tributions, the results for rodents and carnivores werelargely inconclusive. The biogeographical patterns identifiedwere associated with a marked environmental gradient,from more humid and forested areas in the north andnorth-west, to drier and more open woodlands and savan-nas in the south and south-east. Overall, our results are inline with the recent biogeographical regionalization ofAfrica proposed by Linder et al. (2012), though we suggestsome refinements to the boundaries between regions andadd detail to regions previously recognized as largely homo-geneous. Our results also agree with a recent worldwideanalysis that places northern Angola in the transitionbetween Guineo-Congolian and South African regions,though it does not recognize the three regions identified byour study within the latter region (Holt et al. 2013).
Limitations and potential shortcomings
Although our study has some limitations and potentialshortcomings, these are unlikely to affect our key conclu-sions. In common with other studies based on biologicalsurveys in remote regions (Ponder et al. 2001, Pyke &Ehrlich 2010), our study was affected by the concentrationof records in National Parks and Game Reserves, alongroads and railway lines, near human settlements and farms,and in otherwise more visited areas (Crawford-Cabral &Mesquitela 1989). Also, observers ranged from professionalzoologists to inexperienced travellers and hunters, whichmay have biased the data in less explored regions towardsthe most conspicuous species. This might have contributedtowards enhancing the identification of biogeographicalregions for which more data were available, particularlythe Namibe and the Cunene-Cuando Cubango regions.However, these regions are unlikely to be artefacts becausethey are associated with very particular environmental con-ditions and with a set of mammalian species that are rare orabsent elsewhere in Angola (Crawford-Cabral & Veríssimo2005). Moreover, the north–south division into two or threebiogeographical regions is unlikely to be a product of biaseddata, because it was associated with marked environmentalgradients that are expected to influence the distributions ofmammalian species. Including the number of records ofmammals per cell as a surrogate of sampling effort did notaffect the results of dbRDA, further suggesting that sam-pling bias did not contribute significantly to the main pat-terns we observed.
Another potential problem was that the overall data setwas dominated by ungulate data; far fewer records wereavailable for rodents and carnivores. This probably explainsthe similarity of the results obtained in the overall analysisand those obtained from the ungulate data sets, though thelatter provided more detailed geographical patterns. Itcannot be ruled out, however, that the stronger associationsobserved for ungulates resulted from their closer associationto specific vegetation types than rodents and carnivores,though further information would be needed to supportthis view. Overall, biogeographical regions should be identi-fied by considering the ungulate data, pending furtherinformation to assess whether the results for ungulatesapply generally to mammalian groups.
Biogeographical units
Based on the results for ungulates (Fig. 4b), we suggest thatAngola can be divided into four biogeographical regions,each characterized by a set of indicator species and associ-ated with particular environmental conditions and vegeta-tion types.
P. Rodrigues et al. Biogeographical regionalization of Angolan mammals
111Mammal Review 45 (2015) 103–116 © 2015 The Mammal Society and John Wiley & Sons Ltd
ZAIRE-LUNDA-CUANZA
The Zaire-Lunda-Cuanza region corresponds to a rough tri-angle with vertices in the provinces of Zaire, Lunda Norteand Cuanza Sul, located in north and north-west Angola. Itemerged from the analysis of ungulates, while in the overallanalysis, it was lumped with the Central Plateau. The regionmatches the Angolan portion of the Shaba region identifiedby Linder et al. (2012), which represents the transitionbetween Guineo-Congolian rain forests and the Zambezianregion. It matches reasonably well to WWF Ecoregions,encompassing the blend of humid evergreen and semi-deciduous forests, woodlands, shrublands and grasslandscharacterizing the western Congolian forest-savanna mosaic(Olson et al. 2001, Fig. 1). Along the coastal belt, it includesmost of the Angolan scarp savanna and woodlands. Theregion also encompasses the northern part of the deciduousbroadleaf savannas and woodlands characterizing theAngolan miombo woodlands. Two key indicator specieswere the forest buffalo and the yellow-backed duiker, whichhave their core range within the Congo Basin forests, reach-ing their southern limit in Angola. Other indicators showmuch the same pattern, including blue duiker Philantombamonticola, black-fronted duiker Cephalophus nigrifrons andbay duiker Cephalophus dorsalis. The other species with highIndVal were bushpig, bushbuck and defassa waterbuck,which have a relatively wide distribution both in Sub-Saharan Africa and Angola, but which, in this region,occupy a band below the southern limit of the Congo Basinforest, spreading from the coast into Zambia. These speciestend to be rare or absent in southern Angola.
CENTRAL PLATEAU
The Central Plateau region corresponds to the south andsouth-eastern parts of the central plateau of Angola. It inter-grades to some extent with the Zaire-Lunda-Cuanza region,suggesting that there is a north–south gradient in mamma-lian assemblages, rather than two well-defined regions. Thisview is supported by the lumping of the two regions in theanalysis using the overall data set. The Central Plateau isincluded in the Zambezian region of Linder et al. (2012)and encompasses to a large extent the WWF Ecoregion ofthe Angolan miombo woodlands (Olson et al. 2001). Itcomprises moist, deciduous broadleaf savannas and wood-lands dominated by the genera Brachystegia, Julbernardiaand Isoberlinia, interspersed with grassland areas. The mainindicator species are widespread in Africa, occurring in thebelt of woodlands and savannas surrounding the Guineo-Congolian region: oribi, roan antelope, elande, commonwarthog Phacochoerus africanus and bush duiker Sylvicapragrimmia. Also characterizing this region is the local endemicgiant sable antelope Hippotragus niger variani. The southern
lechwe and the southern reedbuck also showed a highIndVal for this region, though they are widespread else-where in Angola.
CUNENE-CUANDO CUBANGO
The Cunene-Cuando Cubango region was clearly identifiedin the analyses of both the overall and the ungulate datasets. It encompasses a band running along the southernborder of Angola with Namibia, eastward of the Namiberegion and continuing farther north along the border withZambia. The region is interrupted by a strip running alongthe Cubango River and showing affinities with the CentralPlateau. Although the overall biogeographical regionali-zation of Linder et al. (2012) includes the entire Cunene-Cuando Cubango region within the Zambezian region, inthe partial analysis for mammals, it is included to a consid-erable extent within the South African/Kalahari region. TheCunene-Cuando Cubango region therefore probably corre-sponds to the northern limit of the Kalahari sub-region(Linder et al. 2012). In terms of WWF Ecoregions, most ofthe Cunene-Cuando Cubango region is included in theZambezian baikiaea woodlands, though in the border withthe Namibe region, it encompasses the Angolan mopanewoodlands. Most indicator species have a large natural dis-tribution in savannahs of southern and eastern Africa, butthey have a restricted distribution elsewhere in Angola:wildebeest, giraffe, sable antelope, black rhino, commontsessebee, buffalo, hartebeest Alcelaphus buselaphus andimpala Aepyceros melampus melampus. Elephants in Angolaare mostly associated with the Cunene-Cuando Cubangoregion and are largely absent from the miombo woodlands,though they also occur in the Congolian forest-savannamosaics (Crawford-Cabral & Veríssimo 2005).
NAMIBE
The Namibe region was identified by both the overall andthe ungulate data sets, and encompasses south-westernAngola. It matches closely the south-western Angola regiondefined by Linder et al. (2012), which is part of the largeSouthern Africa Region. It has also a strong correspondencewith the WWF Ecoregions of the Kaokoveld desert, repre-senting the northern part of the vast Namib Desert, and theNamibian savanna woodlands. Rock hyrax Procavia(capensis) welwitschii and black-faced impala Aepycerosmelampus petersi are characteristic of the region, beingendemic to south-western Angola and north-westernNamibia. Yellow-spotted rock hyrax Heterohyrax brucei,Kirk’s dik-dik and, to a lesser extent, klipspringer also have arestricted distribution, though they also occur in arid andsemi-arid habitats in disjointed areas of north-eastern andeastern Africa. Other indicators such as springbok, gemsbok
Biogeographical regionalization of Angolan mammals P. Rodrigues et al.
112 Mammal Review 45 (2015) 103–116 © 2015 The Mammal Society and John Wiley & Sons Ltd
and mountain zebra are associated with dry grasslands,bushland and/or shrubland of south-western and southernAfrica, showing a marginal extension into south-westernAngola. Steenbok, greater kudu and Burchell’s zebra arewidespread in eastern and southern Africa, but in Angola,they occur primarily in the south and south-west.
Environmental influences onbiotic regionalization
The results of dbRDA revealed a north–south sequence ofintergrading biogeographical regions which follows thedominant climate gradients in this region of Africa (LeHouérou 2009), and the associated variation in soil and veg-etation types. This sequence also matches closely a strongnorth–south gradient in closed canopy forest cover (Hansenet al. 2013) with a progressive southwards transition tosavannahs (Murphy & Bowman 2012). In the north andnorth-west, the climate is predominantly humid equatorial,with high precipitation following a bimodal pattern, rainconcentrated in summer and temperature with low annualamplitude (Le Houérou 2009). These conditions are associ-ated with dense evergreen forest and woodland mosaics(Hansen et al. 2013), which allow the penetration ofCongolian elements into the Zaire-Lunda-Cuanza region.The southern penetration of Congolian species seems to befavoured also by the presence of dense gallery forests, whichmay provide suitable habitat conditions for them in other-wise drier forest areas (Crawford-Cabral & Veríssimo 2005).Southward, the climate progressively ranges from tropicalhumid to semi-arid, with declining annual precipitation,and increases in the annual amplitude of temperature andin the temperature of the warmest month (Le Houérou2009). Except for the desert region of Namibe, the driestextreme of the climate gradient is found in the Cunene-Cuando Cubango region, which is occupied by dry-deciduous savannas and allows the northward penetrationof many species widespread elsewhere in southern Africa.
The Central Plateau occupies an intermediate position inthe north–south gradient, showing a set of a few character-istic species that are widespread in southern and easternAfrica, and also occur elsewhere in other regions of Angola.The only exception is the endemic giant sable antelope,which has a very small natural range covering only a smallproportion of the region. Therefore, the Central Plateauappears to be separated from the other regions, mainlybecause it is occupied at relatively low density by a fewwidespread species (Huntley 1974), rather than being char-acterized by a particular set of unique species. This may be aconsequence, at least partly, of the poor browsing condi-tions provided by the dry miombo woodlands covering thisregion: there is a shortage of browse in the dry season, thequality of leaf matter is low, and the canopies of most trees
are high and inaccessible (Frost 1996). Furthermore, manysavanna herbivores prefer areas of low tree density (Riginos& Grace 2008), which contributes to the absence of manyspecies in dense miombo woodland. The region thus prob-ably represents a barrier that prevented the penetrationsouthwards of Congolian species, and the penetrationnorthwards of species from southern Africa.
The coastal Namibe region seems to be somewhat eccen-tric to the dominant north–south climate gradient (LeHouérou 2009): it is an arid to hyper-arid tropical regionwith relatively low temperature and little annual variationin temperature, which is shaped by the local effects of thecold Benguela current. The region shares with westernNamibia a range of unique mammalian species adaptedto desert conditions and favours also the occurrence ofother dry grassland and open savanna species. Recentphylogeographic studies suggest that this region was a Pleis-tocene refugium for a number of species, some of whichshow genetic divergence from populations elsewhere inAfrica (Lorenzen et al. 2012).
Although human activities are known to affect Africanmammals strongly (Ceballos & Ehrlich 2002, Craigie et al.2010), it is unlikely that humans have shaped to a significantextent the large-scale biogeographical patterns observed inthis study. This is because the study was based on data col-lected from a long period before intense poaching resultedin major population declines and local extirpation of largeungulates and carnivores in Angola (Crawford-Cabral &Veríssimo 2005, Pitra et al. 2006, Chase & Griffin 2011).Therefore, the data set probably reflects the natural distri-bution of most species, as suggested for instance by the rela-tively large ranges observed for sensitive species such aselephants and black rhinos (Crawford-Cabral & Veríssimo2005). Also, there is no evidence that the data set includedoccurrences of species that had been translocated outsidetheir natural ranges, although translocation is known tohave occurred in other regions of Africa (Spear & Chown2009). Finally, it is unlikely that anthropogenic fires influ-enced our results significantly, though they are widespreadin African ecosystems and are known to affect Africanmammals strongly at the local and landscape scales (e.g.Bond & Archibald 2003). This view is supported by recentresearch suggesting that the large-scale distribution offorests and savannahs is mostly determined by climatic andedaphic controls (Murphy & Bowman 2012, Zeng et al.2014), despite the influence of fire on local vegetation struc-ture (e.g. Ryan & Williams 2011). Therefore, we believe thatthe Angolan biogeographical regionalization described herelargely reflects the operation of natural rather than anthro-pogenic processes and thus, it provides a baseline for assess-ing changes induced by relatively recent impacts such aspoaching (Crawford-Cabral & Veríssimo 2005) and defores-tation (Hansen et al. 2013).
P. Rodrigues et al. Biogeographical regionalization of Angolan mammals
113Mammal Review 45 (2015) 103–116 © 2015 The Mammal Society and John Wiley & Sons Ltd
Overall, our results suggest that the biogeographical pat-terns observed in this study are shaped to a large extent bythe position of the country at the crossroads between thehumid, evergreen forests of the Congolian Basin, the desertand arid savannas of south-western Africa, and the drydeciduous woodlands and savannahs of southern andeastern Africa (Le Houérou 2009). Each of these habitattypes is associated with a characteristic set of mammalianspecies that penetrate into Angola and intergrade into eachother to a variable extent, probably depending on the domi-nant vegetation types, which in turn are shaped by climateand edaphic factors. It is likely that the same gradients alsoaffect mammalian groups not analysed here, as well as otherplant and animal groups (Linder et al. 2012). Analysing theconsistency of the patterns observed for a wide range ofspecies would be a valuable subject for further research.Such research could contribute greatly towards conservationplanning in Angola and towards our understanding ofAfrican biogeography.
ACKNOWLEDGEMENTS
This work was carried out in the scope of a partnership,funded by the Portuguese Science Foundation through thefellowship SFRH/BI/51642/2011, EDP Biodiversity Chair,Spanish National Research Council and EC IC&DT Call No1/SAESCTN/ALENT-07-0224-FEDER-001755. Thanks aredue to J. Crawford-Cabral, Luís N. Veríssimo, FrançoisGuilhaumon, A. Márcia Barbosa, Miguel Porto and HugoRebelo for providing help in assembling information,analysing data and interpreting results. This is scientificpaper no. 2 from the Portuguese-Angolan TwinLab estab-lished between CIBIO/InBIO and ISCED/Huíla, Lubango.
REFERENCES
Anonymous (2005) R: A Language and Environment forStatistical Computing. Version 3.0.1. R foundation forStatistical Computing, Vienna, Austria.http://cran.r-project.org/
Anonymous (2006) World Reference Base for Soil Resources 2006.World Soil Resources Reports No. 103. FAO, Rome, Italy.
Anonymous (2013) IUCN Red List of Threatened Species, version2013.1. http://www.iucnredlist.org.
Barbosa AM, Fontaneto D, Marini L, Pautasso M (2010) Is thehuman population a large-scale indicator of the speciesrichness of ground beetles? Animal Conservation 13:432–441.
Barbosa LAG (1970) Phytogeographic Map of Angola. Instituto deInvestigação Científica de Angola, Luanda, Angola.
Bond WJ, Archibald S (2003) Confronting complexity: firepolicy choices in South African savanna parks. InternationalJournal of Wildland Fire 12: 381–389.
Borcard D, Gillet F, Legendre P (2011) Numerical Ecology withR. Springer, New York, USA.
Carcasson RH (1964) A preliminary survey of the zoogeographyof African butterflies. East African Wildlife Journal 2: 122–157.
Ceballos G, Ehrlich PR (2002) Mammal population losses andthe extinction crisis. Science 296: 904–907.
Chapin JP (1932) The birds of the Belgian Congo. I Bulletin ofthe American Museum of Natural History 65: 1–756.
Chase MJ, Griffin CR (2011) Elephants of south-east Angola inwar and peace: their decline, re-colonization and recentstatus. African Journal of Ecology 49: 353–361.
Craigie ID, Baillie JE, Balmford A, Carbone C, Collen B, GreenRE, Hutton JM (2010) Large mammal population declines inAfrica’s protected areas. Biological Conservation 143:2221–2228.
Crawford-Cabral J (ed) (1998) The Angola rodents of thesuperfamily Muroidea. An account on their distribution. In:Estudos Ensaios e Documentos, 161, 222. Instituto deInvestigação Científica Tropical, Lisboa, Portugal.
Crawford-Cabral J, Mesquitela LM (eds) (1989) Índicetoponímico de colheitas zoológicas em Angola. In: EstudosEnsaios e Documentos, 151, 206. Instituto de InvestigaçãoCientífica Tropical, Lisboa, Portugal.
Crawford-Cabral J, Simões AP (1987) Distributional data andnotes on Angolan carnivores (Mammalia: Carnivora) I –Small and medium-sized species. Garcia de Orta, Série deZoologia 14: 3–27.
Crawford-Cabral J, Simões AP (1988) Distributional data andnotes on Angolan carnivores (Mammalia: Carnivora)II – Larger species. Garcia de Orta, Série de Zoologia 15:9–20.
Crawford-Cabral J, Veríssimo LN (eds) (2005) The ungulatefauna of Angola. Systematic list, distribution maps, databasereport. In: Estudos Ensaios e Documentos, 163, 277. Institutode Investigação Científica Tropical, Lisboa, Portugal.
de Klerk HMD, Crowe TM, Fjeldså J, Burgess ND (2002)Biogeographical patterns of endemic terrestrial Afrotropicalbirds. Diversity and Distributions 8: 147–162.
De Cáceres M, Legendre P (2009) Associations between speciesand groups of sites: indices and statistical inference. http://cran.r-project.org/web/packages/indicspecies/index.html.
Dormann CF, Elith J, Bacher S, Buchmann C, Carl G, Carré Get al. (2013) Collinearity: a review of methods to deal with itand a simulation study evaluating their performance.Ecography 36: 27–46.
Dufrêne M, Legendre P (1997) Species assemblages andindicator species: the need for a flexible asymmetricalapproach. Ecological Monographs 67: 345–366.
Figueiredo E, Smith GF, César J (2009) The flora of Angola: firstrecord of diversity and endemism. Taxon 58: 233–236.
Frost P (1996) The ecology of miombo woodlands. In: CampbellB (ed) The Miombo in Transition: Woodlands and Welfare inAfrica, 11–57. CFIOR, Bogor, Indonesia.
Gelderblom CM, Bronner GN, Lombard AT, Taylor PJ (1995)Patterns of distribution and current protection status of the
Biogeographical regionalization of Angolan mammals P. Rodrigues et al.
114 Mammal Review 45 (2015) 103–116 © 2015 The Mammal Society and John Wiley & Sons Ltd
Carnivora, Chiroptera and Insectivora in South Africa. SouthAfrican Journal of Zoology 30: 103–114.
Grubb P, Sandrock O, Kullmer O, Kaiser TM, Schrenk F (2000)Relationships between Eastern and Southern African mammalfaunas. In: Bromage T, Schrenk F (eds) African Biogeography,Climate Change and Early Hominid Evolution, 253–267.Oxford University Press, New York, USA.
Hansen MC, Potapov PV, Moore R, Hancher M, TurubanovaSA, Tyukavina A et al. (2013) High-resolution global maps of21st-century forest cover change. Science 342(6160): 850–853.
Heikinheimo H, Fortelius M, Eronen J, Mannila J (2007)Biogeography of European land mammals showsenvironmentally distinct and spatially coherent clusters.Journal of Biogeography 34: 1053–1064.
Hijmans RJ, Cameron SE, Parra JL, Jones PG, Jarvis A (2005)Very high resolution interpolated climate surfaces for globalland areas. International Journal of Climatology 25: 1965–1978.
Holt BG, Lessard JP, Borregaard MK, Fritz SA, Araújo MB,Dimitrov D et al. (2013) An update of Wallace’szoogeographic regions of the world. Science 339(6115):74–78.
Huntley BJ (1974) Outlines of wildlife conservation in Angola.Journal of the Southern African Wildlife ManagementAssociation 4: 157–166.
Koleff P, Gaston KJ, Lennon J (2003) Measuring beta diversityfor presence-absence data. Journal of Animal Ecology 72:367–382.
Kreft H, Jetz W (2010) A framework for delineatingbiogeographical regions based on species distributions.Journal of Biogeography 37: 2029–2053.
Ladle RJ, Whittaker RJ (2011) Conservation Biogeography.Blackwell Publishing, Oxford, UK.
Le Houérou HN (2009) Bioclimatology and Biogeography ofAfrica. Springer, Heidelberg, Germany.
Lebrun J (1947) La végétation de la plaine alluviale au sud dulac Édouard. Exploration du Parc National Albert. Intitut desParcs Nationaux du Congo Belge. Bruxelles. Fascicule 1,1–800.
Legendre P, Anderson MJ (1999) Distance-based redundancyanalysis: testing multispecies responses in multifactorialecological experiments. Ecological Monographs 69: 1–24.
Legendre P, Legendre L (1998) Numerical Ecology, 2nd Englished. Elsevier Science B.V., Amsterdam, The Netherlands.
Linder HP, de Klerk HM, Born J, Burgess ND, Fjeldså J, RahbekC (2012) The partitioning of Africa: statistically definedbiogeographical regions in sub-Saharan Africa. Journal ofBiogeography 39: 1189–1205.
Lo CP, Yeung AKW (2002) Concepts and Techniques ofGeographic Information Systems. Prentice Hall, Upper SaddleRiver, New Jersey, USA.
Lorenzen ED, Heller R, Siegismund HR (2012) Comparativephylogeography of African savannah ungulates. MolecularEcology 21: 3656–3670.
Maechler M, Rousseeuw P, Struyf A, Hubert M, Hornik K(2014) Cluster: cluster analysis basics and extensions, version
1.15.2. http://cran.r-project.org/web/packages/cluster/index.html.
Mills MSL (2010) Angola’s central scarp forests: patterns of birddiversity and conservation threats. Biodiversity andConservation 19: 1883–1903.
Monod T (1957) Les Grands Divisions Chronologiques del’Afrique. C.S.A./C.C.T.A. Publ. No. 24,1–150. C.S.A./C.C.T.A.,London, UK.
Muñoz AR, Real R, Olivero R, Márquez AL, Guerrero JC,Bárcena SB, Vargas JM (2003) Biogeographical zonation ofAfrican hornbills and their biotic and geographiccharacterizations. Ostrich 74: 39–47.
Murphy BP, Bowman DMJS (2012) What controls thedistribution of tropical forest and savanna? Ecology Letters 15:748–758.
Myers N, Mittermeier RA, Mittermeier CG, Da Fonseca GA,Kent J (2000) Biodiversity hotspots for conservationpriorities. Nature 403: 853–858.
Oksanen J, Blanchet FG, Kindt R, Legendre P, Minchin PR,O’Hara RB, Simpson GL, Solymos P, Stevens MHH, WagnerH (2013) Vegan: community ecology package, version 2.0–8.http://cran.r-project.org/web/packages/vegan/index.html.
Olson DM, Dinerstein E, Wikramanayake ED, Burgess ND,Powell GVN, Underwood EC et al. (2001) Terrestrialecoregions of the world: a new map of life on Earth.Bioscience 51: 933–938.
Penner J, Wegmann M, Hillers A, Schmidt M, Rödel MO (2011)A hotspot revisited – a biogeographical analysis of WestAfrican amphibians. Diversity and Distributions 17:1077–1088.
Pitra C, Vaz Pinto P, O’keefe B, Munro S, Van Vuuren B,Robinson T (2006) DNA-led rediscovery of the giant sableantelope in Angola. European Journal of Wildlife Research 52:145–152.
Ponder WF, Carter GA, Flemons P, Chapman RR (2001)Evaluation of museum collections data for use inbiodiversity assessment. Conservation Biology 15:648–657.
Poynton JC (1964) The Amphibia of southern Africa. Annals ofthe Natal Museum 17: 1–334.
Proches S, Ramdhani S (2012) The world’s zoogeographicalregions confirmed by cross-taxon analyses. Bioscience 62:260–270.
Pyke GH, Ehrlich PR (2010) Biological collections andecological/environmental research: a review, someobservations and a look to the future. Biological Reviews 85:247–266.
Riginos C, Grace JB (2008) Savanna tree density, herbivores, andthe herbaceous community: bottom-up vs. top-down effects.Ecology 89: 2228–2238.
Romeiras MM, Figueira R, Duarte MC, Beja P, Darbyshire I(2014) Documenting biogeographical patterns of Africantimber species using herbarium records: a conservationperspective based on native trees of Angola. PLoS ONE 9(7):e103403.
P. Rodrigues et al. Biogeographical regionalization of Angolan mammals
115Mammal Review 45 (2015) 103–116 © 2015 The Mammal Society and John Wiley & Sons Ltd
Rowe-Rowe DT, Taylor PJ (1996) Distribution patterns ofterrestrial mammals in KwaZulu-Natal. South Africa Journal ofZoology 31: 131–144.
Ryan CM, Williams M (2011) How does fire intensity andfrequency affect miombo woodland tree populations andbiomass? Ecological Applications 21: 48–60.
Salvador S, Chan P (2004) Determining the number ofclusters/segments in hierarchical clustering/segmentationalgorithms. Proceedings of the 16th IEEE – InternationalConference on Tools with Artificial Intelligence, 576–584.Institute of Electrical and Electronics Engineers, Piscataway,New Jersey, USA.
Schulman L, Toivonen T, Ruokolainen K (2007) Analysingbotanical collecting effort in Amazonia and correcting for itin species range estimation. Journal of Biogeography 34:1388–1399.
Spear D, Chown SL (2009) The extent and impacts of ungulatetranslocations: South Africa in a global context. BiologicalConservation 142: 353–363.
Vale MM, Jenkins CN (2012) Across-taxa incongruence inpatterns of collecting bias. Journal of Biogeography 39:1744–1748.
White F (1965) The savanna-woodlands of the Zambezian andSudanian domains. Webbia 19: 651–681.
Wilson DE, Reeder DM (2005) Mammal Species of the World: aTaxonomic and Geographic Reference, 3rd ed. The JohnHopkins University Press, Baltimore, USA.
Zeng Z, Chen A, Piao S, Rabin S, Shen Z (2014) Environmentaldeterminants of tropical forest and savanna distribution: aquantitative model evaluation and its implication. Journal ofGeophysical Research: Biogeosciences 119: 1432–1445.
SUPPORTING INFORMATION
Additional supporting information may be found in theonline version of this article at the publisher’s web-site.
Appendix S1. Supplementary materials and methods – listsof species and environmental correlates.Appendix S2. Supplementary results.
Biogeographical regionalization of Angolan mammals P. Rodrigues et al.
116 Mammal Review 45 (2015) 103–116 © 2015 The Mammal Society and John Wiley & Sons Ltd