Embed Size (px)
Citation preview

A BETTER LIFE WITH A HEALTHY PLANETPATHWAYS TO NET-ZERO EMISSIONSA NEW LENS SCENARIOS SUPPLEMENT
A BETTER LIFE WITH A HEALTHY PLANETPATHWAYS TO NET-ZERO EMISSIONSA NEW LENS SCENARIOS SUPPLEMENT
ENTER

Foreword 03
Introduction: Scenarios and a Net-Zero Emissions World 04
Executive Summary: A Better Life with a Healthy Planet 08
Chapter 1: Where We Are Now 18
Chapter 2: A Healthy Planet: Necessary Structural Transformations 26
Power Generation
Buildings
Transport
Industry
Chapter 3: Meeting Human Aspirations: Development and the Energy Ladder 44
Chapter 4: Moving Ahead Together: Technology and Policy 52
Chapter 5: An Accelerated Net-Zero Emissions Scenario 64
Concluding Remarks 71
CONTENTS
Supporting Insights 72
Economic Growth and Energy: a Perspective from India – A View from IRADe
Empire State Building Retrofit – A View from Rocky Mountain Institute
The Material Demand Conundrum
Transforming Personal Mobility in US Cities – A View from Rocky Mountain Institute
Energy Efficiency in Buildings – A Comprehensive Approach from the World Business Council for Sustainable Development
Technological Revolutions and Political Choices – A view from Professor Carlota Perez
Collaboration
Resilient Cities
Climate Change Attitudes – A view from Professor Chris Rapley
Human Behaviours
Footnotes 92
CONTENTS
Note: “The New Lens Scenarios” and “A Better Life with a Healthy Planet” are part of an ongoing process – scenario-building – used in Shell for more than 40 years to challenge executives’ perspectives on the future business environment. We base them on plausible assumptions and quantification, and they are designed to stretch management thinking and even to consider events that may only be remotely possible. Scenarios, therefore, are not intended to be predictions of likely future events or outcomes, and investors should not rely on them when making an investment decision with regard to Royal Dutch Shell plc securities.
It is important to note that Shell’s existing portfolio has been decades in development. While we believe our portfolio is resilient under a wide range of outlooks, including the IEA’s 450 scenario, it includes assets across a spectrum of energy intensities, including some with above-average intensity. While we seek to enhance our operations’ average energy intensity through both the development of new projects and divestments, we have no immediate plans to move to a net-zero emissions portfolio over our investment horizon of 10–20 years. Net-zero emissions, as discussed in this document, is a collective ambition that is applied in the aggregate, with technical and other considerations determining the net-positive or net-negative emissions for any individual industry sector or company. It must be driven by society, governments and industry through an effective overall policy framework for the energy system as a whole, integrating consumption and production. We believe the Paris Agreement is a start towards creating such a framework, and we look forward to playing a role as society embarks on this very important journey1.
1
TO NAVIGATE
CLICK on the on the RED ARROWS from the contents below or side menu to navigate page by page.
CLICK on the MENU ICON in the side menu to come back to the contents from any page.
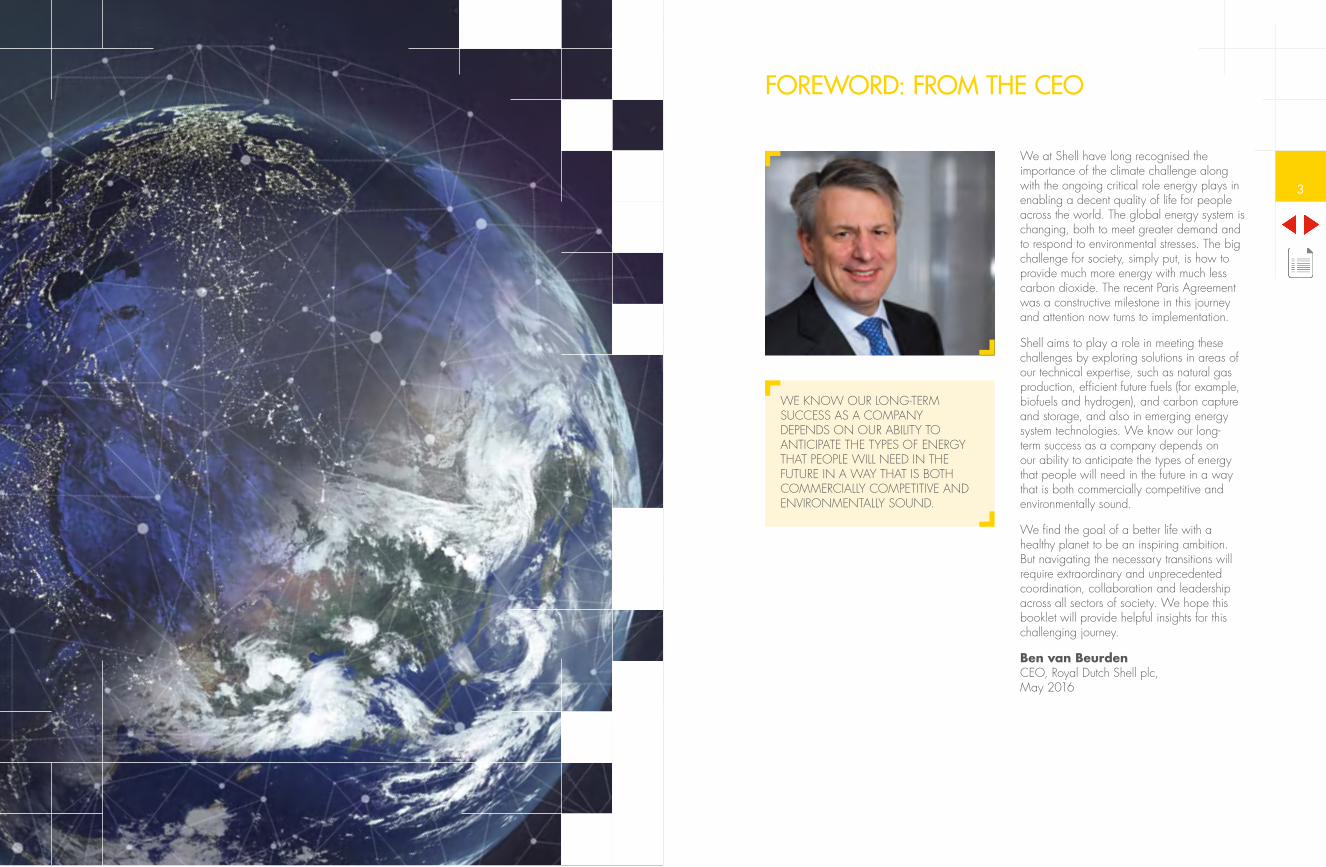
We at Shell have long recognised the importance of the climate challenge along with the ongoing critical role energy plays in enabling a decent quality of life for people across the world. The global energy system is changing, both to meet greater demand and to respond to environmental stresses. The big challenge for society, simply put, is how to provide much more energy with much less carbon dioxide. The recent Paris Agreement was a constructive milestone in this journey and attention now turns to implementation.
Shell aims to play a role in meeting these challenges by exploring solutions in areas of our technical expertise, such as natural gas production, efficient future fuels (for example, biofuels and hydrogen), and carbon capture and storage, and also in emerging energy system technologies. We know our long-term success as a company depends on our ability to anticipate the types of energy that people will need in the future in a way that is both commercially competitive and environmentally sound.
We find the goal of a better life with a healthy planet to be an inspiring ambition. But navigating the necessary transitions will require extraordinary and unprecedented coordination, collaboration and leadership across all sectors of society. We hope this booklet will provide helpful insights for this challenging journey.
Ben van Beurden CEO, Royal Dutch Shell plc, May 2016
FOREWORD: FROM THE CEO
WE KNOW OUR LONG-TERM SUCCESS AS A COMPANY DEPENDS ON OUR ABILITY TO ANTICIPATE THE TYPES OF ENERGY THAT PEOPLE WILL NEED IN THE FUTURE IN A WAY THAT IS BOTH COMMERCIALLY COMPETITIVE AND ENVIRONMENTALLY SOUND.
3

Our work has led us to conclude that providing the necessary energy in the context of net-zero CO2 emissions is technically feasible. But it will be very challenging. We know that such a future will be built on a patchwork of solutions, not a single pathway. Solutions may work in one place even if they aren’t necessarily suitable for every situation. And it may be difficult to predict whether a solution that works well in the lab or on a small scale can succeed in deploying globally.
In this booklet, we distil what we have learned so far in an attempt to answer a fundamental question: How could the energy system evolve from now to provide “a better life for all with a healthy planet?”
We begin with “where we are now”, recognising the challenges that face society. We then summarise what we mean by “a better life with a healthy planet” and how the energy system may evolve in future to deliver those objectives. The rest of the booklet offers a more detailed study of three key areas: the necessary transformations in both the consumption and production side of the energy system; economic growth pathways in developing countries; and the policies needed to support those transformations. We end with “An Accelerated Net-Zero Emissions Scenario”, the story of one possible pathway involving a patchwork of solutions that could result in a better life with a healthy planet on a timescale consistent with global aspirations.
Jeremy Bentham Vice President Global Business Environment, Head of Shell Scenarios
INTRODUCTION: SCENARIOS AND A NET-ZERO EMISSIONS WORLD
This report is a supplement to the Shell New Lens Scenarios (NLS) published in 2013. Scenarios offer plausible alternative stories of the long-term future. They do not describe what will happen (a forecast) or what should happen (a policy prescription), but what could happen. The NLS scenarios – Mountains and Oceans – considered alternative ways influence in society could evolve and described different routes for the future evolution of the global energy system. We continue to learn from these scenarios what is needed, practically, to have a healthy planet while at the same time responding to the natural human striving for a better quality of life.
The energy system responds to the demands of a growing number of people in the world with aspirations to make life materially better for themselves and their children. Meeting this demand will probably require approximately doubling the size of the global energy system over the course of this century. And that means the potential growth of atmospheric CO2 and other greenhouse gases – unless something is done at the same time to reduce these emissions so that there are no net additions.
It is valuable to recognise, however, that a net-zero emissions world is not necessarily a world without any emissions anywhere. It is a world where remaining emissions are offset elsewhere in the system, an outcome that is more rapidly achievable and hence more consistent with limiting the accumulation of greenhouse gases. This means that the world will need “negative” emissions in some sectors to offset remaining emissions in others such that zero additional emissions enter the atmosphere – the so-called “net zero.”
OUR WORK HAS LED US TO CONCLUDE THAT PROVIDING THE NECESSARY ENERGY IN THE CONTEXT OF NET-ZERO CO2 EMISSIONS IS TECHNICALLY FEASIBLE. BUT IT WILL BE VERY CHALLENGING. WE KNOW THAT SUCH A FUTURE WILL BE BUILT ON A PATCHWORK OF SOLUTIONS, NOT A SINGLE PATHWAY.
5

EXECUTIVE SUMMARY
A BETTER LIFE WITH A HEALTHY PLANET

Gigawhat?
How do we quantify this?
1x GIGAJOULE= 1 BILLION JOULES
1x JOULE =ENERGY TO LIFT AN APPLE ONE METRE AGAINST THE EARTH’S GRAVITY
100 JOULES PER SECOND =THE ENERGY USAGE OF ASTANDARD 100 WATT LIGHTBULB
PARIS TO SINGAPORE RETURN FLIGHT
RUNNING ON ATREADMILL
10 300
YOU TYPICALLY BURN ENERGY AT A RATE OF 100W OF ENERGY PER PASSENGER
*Approximately, based on a distance of 5,793 nautical miles (10729 km) from Paris Charles de Gaulle Airport to Singapore Changi International Airport.
=100 GIGAJOULES*
=1 GIGAJOULEX
1100W
100g
HOURS A DAY
DAYS A YEAR
EXECUTIVE SUMMARY: A BETTER LIFE WITH A HEALTHY PLANETThe internationally agreed UN Sustainable Development Goals2 frame some of the great practical issues of our age, including eliminating poverty, providing energy and addressing climate stress.
Governments and the global community are attempting in many ways to address the challenge of poverty, spreading the benefits of a decent standard of living from the minority toward the majority of people – a better life for all. But there is a greater force at work than this collective desire from governmental organisations for a better world, and that is the drive of billions of individuals themselves to create a better material life for their families.
These demands for a better life will inevitably increase energy needs. The challenge is how to supply this demand while at the same time halting the accumulation of CO2 in the atmosphere – ensuring a healthy planet. The rising level of CO2 not only puts pressure on the climate, but also warms and acidifies the oceans, raises sea levels, threatens land-based ecosystems and affects patterns of food production. There is broad scientific consensus that the quality of life for hundreds of millions of people stands to suffer from this second challenge.
Energy: enabling the material basis for “a better life”Our understanding and use of “a better life” is quite specific. It refers to a world in which the basic material needs associated with housing, healthcare, adequate sanitation and effective transport are extended to everyone on the planet. It does not mean a TV in every room in the house, a new smartphone every year, three-car families or the “use once and throw away” practices that have become common in much of the rich world in the last 50 years. The question then becomes: how much energy is needed for a better life?
A common measurement of energy is a “gigajoule”.3 A single intercontinental long-haul flight from Cape Town to London requires an average of 40 gigajoules’ energy use per passenger. A physical labourer may deliver work that is roughly the equivalent of a gigajoule per year. If we take the United States, the current primary energy consumption is around 300 gigajoules per person per year – roughly similar to 300 physical labourers for every man, woman and child in the country. A more modest and energy-efficient economy, such as Japan or most European countries, averages around 150 gigajoules per person per year.
As we consider the future development of economies, and assume significant energy efficiency improvements, we estimate that an average of about 100 gigajoules of primary energy per person is approximately what is required to fuel the energy-based services that support the decent quality of life to which people naturally aspire. And if we assume a future population of around 10 billion people by the end of the century, and multiply it by a hundred gigajoules per capita, we see that the global energy need would be about 1,000 exajoules (one exajoule is equal to one billion gigajoules) a year – which is roughly twice the size of the current energy system. Such a rough estimate is consistent with much more detailed modelling exercises that have been conducted. It indicates both the scope for efficiency improvements and demand reduction in many already industrialised economies and also the growing need for energy in developing economies.
9

high process-temperatures and dense energy storage are necessary, such as in iron, steel and cement manufacturing, and in heavy freight and air transport. They will also be required in the production of chemicals (such as solvents) and materials such as plastics. So some economic sectors will inevitably prove more challenging to decarbonise than others.
Similarly, some regions will decarbonise at a slower pace than others, either for political and economic reasons or because they have a particularly high or low population density and hence have either land-use constraints on the availability of renewables or relatively high infrastructure costs and transport needs. So there will be a co-evolution and integration of the fossil fuel and renewable components of the energy system. Inevitably, some level of emissions from certain sectors and regions will remain for the foreseeable future. As a result, the energy system in an emerging net-zero emissions world will be
something of a patchwork. Different degrees of decarbonisation and energy efficiency will be achieved at different paces, in different places and in different sectors of the economy. To mop up remaining emissions, CO2 capture and storage (CCS) will need to be deployed at scale, and selectively combined with sustainable biomass use to provide offsets or “negative emissions”.
The four essential policy leversSpecialists know a lot about technical best practice in land use, compact urban development with public transport, integrated infrastructures, high-energy-efficiency with low-emissions transport, reforestation, soil regeneration and many other areas. Although there are costs in moving to this smarter, better world, many economists estimate that these costs are manageable from an economy-wide perspective – a few percentage points of global GDP over the next couple of decades.4
Renewables and hydrocarbonsIn order to come close to a net-zero CO2 emissions sum, societies throughout the world will need to call on an array of carbon-free energy sources, such as wind, solar and nuclear. Because these sources produce electricity, and because new renewable technologies are already becoming established and increasingly cost-effective, in a net-zero emissions world, electricity will likely become the most prominent energy carrier [see page 40, “The Growth of
Renewables and New Energy Technologies”, for further details].
Renewable energy technologies producing electricity have an indispensable role to play, but on their own they can’t address all current energy needs. Renewables vary in availability and in intermittency, and – more importantly – electricity itself is currently the vehicle for less than one-fifth of total end-use energy consumption. While renewables will grow significantly, for the foreseeable future, hydrocarbons will still be required where
The four pillars of the energy system
POWERZero-emission technologies, including current and future renewable technologies and nuclear, will need to progressively displace coal and become the largest share of the power sector, with a reduced relative share for hydrocarbons, including gas and biomass combined with CCS.
BUILDINGSHigh energy-efficiency standards in building design and operation will need to be implemented and enforced. This greater efficiency is an enabler of full electrification of buildings, which will become much more widespread. The majority of new construction in both developed and emerging economies is already all-electric, driven both by economics and better regulations.
TRANSPORTPassenger road travel will increasingly need to be electrified or rely on hydrogen, while longer-distance freight, shipping and aviation will continue to rely on energy-dense liquid fuels, including oil, biofuels, liquefied natural gas and hydrogen into the foreseeable future.
INDUSTRYCertain industrial activities, such as light manufacturing and low-temperature processes, will be able to electrify and therefore decarbonise relatively quickly, while others, particularly in heavy industry, will be more expensive, take longer, or simply lack viable options to transition away from hydrocarbon thermal fuels in the foreseeable future. CCS seems the only viable route to eliminate the bulk of emissions from activities such as steel- and cement-making on a reasonable timescale.
To achieve net-zero emissions requires the transformation of the entire global economy, especially in four foundational areas where a significant proportion of energy-related emissions of CO2 occurs: power, buildings, transport and industry.
In addition, steps designed to limit emissions from agricultural practices and land-use change will also be essential. Currently, these emissions account for nearly a quarter of all global emissions. [See page 39 “The Key Role of Land Use”].
11

However, because costs are unevenly distributed, the more difficult problem is that such a dramatic transformation will inevitably create relative winners and losers, generating socio-political tensions. Excessive disruption itself can also be extremely costly, impacting not just individual companies and sectors but society as a whole. While the transformation can’t be perfectly planned and project-managed top-down, policy needs to be directed at managing these impacts so as to minimise obstacles to change. Almost everyone would suffer in a disorderly transition, so as smooth a transition as possible requires early economy-wide responses rather than late knee-jerk reactions.
Given the urgency and challenging timeframes involved, government policy has a critical role to steer and accelerate the journey in the right direction and provide the certainty required for companies to invest with confidence. Four essential policy levers can help push society from simply knowing the best steps to take to actually taking them:
1. Long-term policy frameworks that support and incentivise the building of necessary infrastructure to enable the take-up of new low-carbon materials and technologies.
2. Economy-wide carbon pricing – whether through carbon trading, carbon taxes or mandated carbon-emissions standards. It provides an efficient and cost-effective way of aligning incentives and motivating action across the economy to reduce carbon emissions.
3. Policies that mitigate the negative effects of the transition on the most vulnerable sectors of the economy and segments of society. Such policies would be time-limited, but are critical for reducing disruptions as the economy goes through the restructuring necessary to become net-zero in its emissions.
4. Other financial support and incentives for low-carbon research and development, particularly for early-stage development and deployment of promising technologies across all key sectors. This support will ensure that technological progress continues apace as carbon pricing ramps up and becomes more effective and widespread in its use.
The human dimensionFor global primary energy demands in our net-zero world to remain around 100 gigajoules per year for every person on this planet, while allowing for a decent quality of life, sustained efforts to improve efficiency will be essential. Without such efforts, total energy consumption will not just be double today’s level, but could grow to three times greater or more, making the quest for net-zero emissions essentially impossible because the capacity to include biomass in the energy system would be exceeded. There’s enough biomass potential to offset double energy use – but not triple.
There is an individual human dimension to these efforts as well. Consumers will need to choose lighter cars with more efficient drives. They will need to employ heat pumps, LED lighting and other energy-efficient appliances as well as increase recycling. Collectively, they can insist on structural efficiencies in their cities with good public transport, integrated waste, water, power and heat management, efficient construction and good building standards. Once built, such major infrastructures stay in place – and shape our energy needs – for decades. So it is critical they are designed and implemented as efficiently as possible from the outset. And by choosing to live in compact cities, consumers lower demand for energy because they don’t need to travel as far.
It will also be helpful if concepts such as the sharing economy drive material efficiency – an important factor in keeping in check the growing need for hydrocarbons for chemicals, as well as the demands for products from energy-intensive heavy industry.

Can the world do it?An important and constructive milestone on the journey was the recent Paris climate conference (COP21) in December 2015. At this, 196 countries adopted the Paris Agreement, which will enter into force after 55 countries that account for at least 55% of global greenhouse emissions have deposited their instruments of ratification. The agreement sets out a global action plan intending to put the world on track to avoid dangerous climate change by limiting global warming to well below 2°C.
The architecture of this agreement has been described as a “motorway” to address climate challenges in which there are different lanes, with different economies going along these lanes at different speeds and using different vehicles.5 But they will all be moving in the same general direction on the same motorway – and this movement, over the course of the century, will bring us towards increasing decarbonisation of our economies and transitions in the way energy is used. Through adopting the Paris Agreement, countries have signalled their intention to enter the motorway, from which, in principle, there are no exits.
This is a valuable platform, differing from the Kyoto Agreement in being a bottom-up, national approach, which is likely to be more politically resilient. The currently identified contributions to reducing emissions are not sufficient and do not look far enough into the future to realise the overall long-term ambition of the Paris Agreement on their own. However, governments agreed to come together every five years to set more ambitious targets, report to each other and the public on how well they
are doing to implement their targets and track progress towards the long-term goal.
To stabilise the climate requires achieving net-zero emissions globally to arrest the accumulation of CO2 in the atmosphere and bring down the concentration of other greenhouse gases such as methane. The more quickly this is realised, the lower the risks and impacts of climate change – which is why it is essential to grapple with the practical nitty-gritty realities of what needs to change to achieve net-zero emissions as early as possible. It is also essential to consider the whole pathway to net-zero emissions and not just the first steps. There is a very real danger that policymakers could focus only on the short-term, easier options that can be realised in the next decade or so, and then find that progress runs into a wall because the more technically or socio-politically difficult sectors of the economy have been neglected.
In spite of the many challenges, the practical details of providing enough energy for a better life for everyone with net-zero emissions can be envisaged – and that is reassuring, even inspiring. But getting there will not be easy. The world will need huge and courageous progress in economic restructuring, co-evolution of the emerging and established components of the global energy system and the large-scale implementation of alternative technologies. Above all, we will need the active cooperation of millions of citizens, policymakers, civil society leaders, and businesses across the planet.
IN SPITE OF THE MANY CHALLENGES, THE PRACTICAL DETAILS OF PROVIDING ENOUGH ENERGY FOR A BETTER LIFE FOR EVERYONE WITH NET-ZERO EMISSIONS CAN BE ENVISAGED – AND THAT IS REASSURING, EVEN INSPIRING.
7+bn~500
10bn WORLDPOPULATION
WORLDPOPULATION
2015 2100
EXAJOULESENERGY CONSUMPTION PER YEAR ~1000EXAJOULES
ENERGY CONSUMPTION PER YEAR
DOUBLE WORLDENERGY USAGE
As we consider the future development of economies, and assume significant energy improvements, we estimate that an average of about 100 gigajoules of primary energy per person is approximately what is required to fuel the energy-based services that support the decent quality of life to which people naturally aspire.
How large could the energy system grow?
Average current primary energy use*Gigajoules per person per year
300150100
* Source: Shell analysis
15

WHERE WE ARE NOW
1

1. WHERE WE ARE NOW
Since the start of the Industrial Revolution, human-based, or “anthropogenic”, activities have significantly raised the concentration of the three most important trace greenhouse gases (GHG) in the atmosphere: carbon dioxide, methane and nitrous oxide. In 2014, the 5th Assessment Report (AR5) of the Intergovernmental Panel on Climate Change (IPCC) concluded that warming of the climate system is unequivocal and that the rising level of these gases, together with other anthropogenic drivers, are extremely likely to have been the dominant cause of the observed warming since the mid-20th century.
Of the main anthropogenic GHGs, CO2 is the principle determinant of eventual peak warming, because of both the scale of emissions and the longevity of the gas in the atmosphere. Unlike methane, which is a more powerful GHG but breaks down over time, CO2 is very slow to be removed from the atmosphere, so tends to accumulate over time. Climate system models show that peak warming has an approximately linear relationship with post-1750 cumulative CO2 emissions. By contrast, although they need to be addressed, current methane emissions contribute more to the current rate of warming than eventual peak warming.
The Paris Agreement seeks to hold the increase in the global average temperature to well below 2°C above pre-industrial levels and to pursue efforts to limit the temperature increase to 1.5°C above pre-industrial levels. To achieve this goal the Paris Agreement calls for a “balance between anthropogenic emissions by sources and removals of greenhouse gases by sinks in the second half of the century”. Such a balance would in effect mean that global anthropogenic emissions were at “net zero”.
The Paris Agreement’s emphasis on net-zero emissions is a critical development and recognises the cumulative issue presented by CO2 emissions in particular. Even very low annual emissions will continue to add to the stock. Expressed in tonnes of carbon,
cumulative emissions stand at some 600 billion tonnes as of early 2016.6 Even if annual global CO2 emissions remain steady at their current level, the cumulative emissions consistent with a rise of 1.5°C could be reached as early as 2028.7 For these reasons, the primary focus of this booklet is on the need to bring energy-related CO2 emissions from fossil fuel use to net zero.
Achieving net-zero emissions – where the concentration of CO2 in the atmosphere actually stops rising – is an essential step to limit peak warming. The more ambitious that temperature goal, the earlier net zero needs to be reached. If total cumulative emissions overshoot a particular threshold, it may be necessary to go beyond net zero and achieve “net-negative” emissions, where more CO2 is extracted from the atmosphere than continues to be released.
Along with the biosphere’s natural capacity to absorb CO2, which could be enhanced through mass reforestation and changes in farming practices, geological storage of CO2 is expected to form a critical component of both the journey to and achievement of net-zero emissions. Net-negative emissions will almost certainly require this technology. When biomass is used as an energy source (BE), some or all of its CO2 emissions from combustion can be captured and stored, which indirectly offers a route for extracting CO2 from the atmosphere, because the
carbon in biomass came from there in the first instance. Today, even direct capture of CO2 from the atmosphere (DAC) is being tested in early-stage pilot applications, which, if eventually successful, scaled and combined with geological storage (CCS), might offer another route to net-zero and net-negative emissions.
While a variety of emission trajectories can be theorised to limit the cumulative CO2 consistent with a given temperature goal, the ambition embedded within the Paris Agreement offers little room for flexibility. It implies dramatic and simultaneous shifts in both the composition of energy supplies – with extraordinary growth of lower- and zero-carbon energy sources, including renewables, nuclear and fossil fuels with CCS – and the way whole sectors and
Source: UN Climate Change Secretariat.
19

individuals use energy. This will require radical changes across the entire modern industrial system, including in manufacturing, transport and power generation. Alternatives would have to be found for many petroleum-based products, and a new, large-scale, synthetic hydrocarbon industry may be needed for sectors such as aviation and shipping. Methane and nitrous oxide emissions, which are prevalent across both the industrial and agricultural systems, will also need to be managed.
All this needs to be achieved over the course of this century, although a mid-century date will loom large as policymakers consider the 1.5°C ambition coming from Paris. And it assumes CCS is actually deployed. If it isn’t, then we are left to deal with a clear message from IPCC AR5: “Many models could not limit likely warming to below 2°C if bioenergy, CCS and their combination (BECCS) are limited (high confidence).”
CARBON DIOXIDE REMOVALUltimately, it may be necessary to remove CO2 from the atmosphere. A variety of technologies, several of which are listed below, are available to do this. They all face one or more major issues, including scalability, technology hurdles, cost and practical pathways to implementation. CO2 removal may even begin to fall into the category of geoengineering, that is, deliberate, large-scale intervention in the earth’s natural systems to counteract climate change. The scale, responsibility and ethical issues related to such action would be daunting. Consideration of geoengineering also raises the question of solar radiation management (SRM), a type of geoengineering that seeks to reflect sunlight and therefore reduce warming.
Bioenergy with carbon capture and storage (BECCS)
Plants take in CO2 from the atmosphere as they grow. If that CO2 is captured and geologically stored when the plant is combusted for energy use, then there is a net removal from the biosphere.
Direct CO2 capture from the air with storage (DACCS)
CO2 can be removed directly from the air by chemical absorption. A regeneration step releases the CO2 as a pure stream, which can then be geologically stored.
Soil carbon uptake Through relatively simple changes in farming practices or the addition of biochar (partly burnt biomass) to the soil, the overall level of carbon in the farm soil can be raised, effectively sequestering CO2 from the atmosphere. Biochar also makes soil more fertile.
Building with biomass While common in many countries, building with wood is not a universal practice. Reintroducing wood into housing construction can sequester carbon for decades or even centuries.
Reforestation Large-scale tree planting increases natural storage of carbon in biomass and forest floor soil. During the Great Depression, the US planted several billion trees to create hundreds of new national forests. Today, annual net sequestration of carbon in managed US forests offsets approximately 15% of the annual emissions of carbon that result from the combustion of fossil fuels.
Enhanced ocean uptake
The ocean is a huge store of CO2, although increasing levels dissolved in the water are raising ocean acidity. However, uptake could be safely enhanced by increasing marine photosynthesis, such as through large-scale cultivation of seaweed in shallow areas.
Mineralisation and enhanced weathering
Mineral carbonation involves reactions of magnesium or calcium oxides (typically contained in mineral silicates and industrial wastes) with CO2 to give inert carbonates. These reactions occur slowly in nature and over time trap vast quantities of carbon, but pilot facilities have been built to do this on an industrial scale and produce useful products.
What it will takeThere is significant uncertainty about the impact of different atmospheric concentrations of CO2 on eventual warming of the climate system. Commonly published scenarios by institutions such as the International Institute for Applied Systems Analysis (IIASA), the Potsdam Institute for Climate Impact Research (PIK) and the Massachusetts Institute of Technology (MIT) indicate that, roughly speaking: to limit the temperature rise to 3°C would require achieving net-zero emissions during the first half of the next century; 2.5°C would require net-zero emissions by 2100; 2°C would require net-zero emissions by around 2070; and 1.5°C would require net-zero emissions around 2050, followed thereafter by net-negative emissions. Most pathways for 2°C require emissions reductions beginning by 2020. Every year society delays action to substantially and steadily reduce global emissions brings forward by at least a year the point at which emissions of CO2 must reach net zero. Given the lifetimes of the capital stock of factories, cities, homes and essential infrastructure, it may well be that the period of net-negative emissions will be prolonged over many decades from 2050.
21
insight into...
To reach net-zero emissions more quickly – and hence limit temperature increases to lower levels – will require the combination of all the most optimistic outcomes described in both scenarios and more. The scenarios have helped us consider what a “Goldilocks” pathway might look like that aligns the most supportive features of other pathways (e.g. global growth being neither too fast nor too slow, energy prices being neither too high nor too low) and that might lead to achieving net-zero emissions more quickly, in line with the aspiration to remain below 2°C warming. The Accelerated Net-Zero Emissions Scenario that ends this booklet summarises the lessons we’re learning.
Further details on the Shell Scenarios can be found on www.shell.com/scenarios.
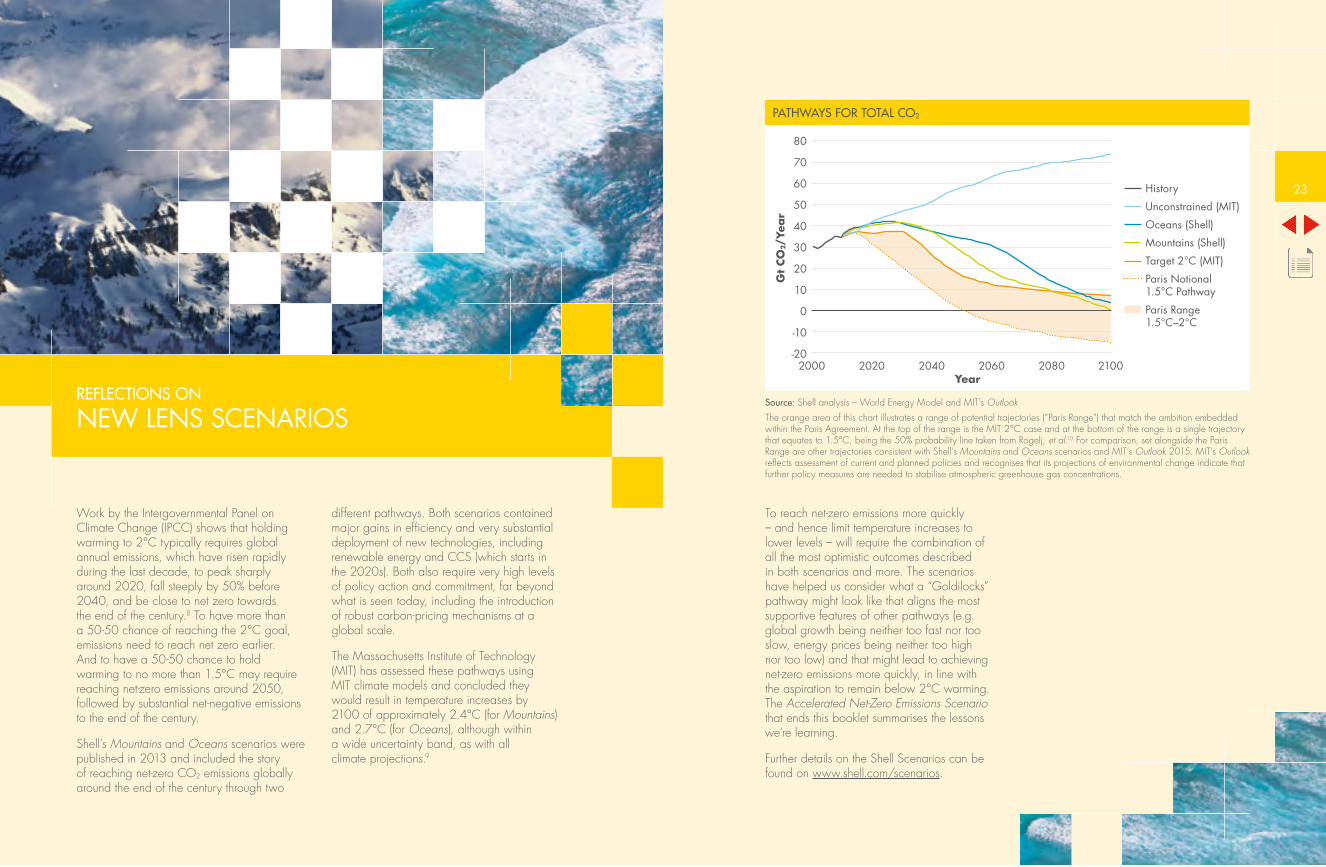
PATHWAYS FOR TOTAL CO2
80
70
60
50
40
30
20
10
0
-10
-202000 210020802060
Year20402020
Gt
CO2/
Yea
r
History
Unconstrained (MIT)
Oceans (Shell)
Mountains (Shell)
Target 2°C (MIT)
Paris Notional 1.5°C Pathway
Paris Range 1.5°C–2°C
Source: Shell analysis – World Energy Model and MIT’s OutlookThe orange area of this chart illustrates a range of potential trajectories (“Paris Range”) that match the ambition embedded within the Paris Agreement. At the top of the range is the MIT 2°C case and at the bottom of the range is a single trajectory that equates to 1.5°C, being the 50% probability line taken from Rogelj, et al.10 For comparison, set alongside the Paris Range are other trajectories consistent with Shell’s Mountains and Oceans scenarios and MIT’s Outlook 2015. MIT’s Outlook reflects assessment of current and planned policies and recognises that its projections of environmental change indicate that further policy measures are needed to stabilise atmospheric greenhouse gas concentrations.
Work by the Intergovernmental Panel on Climate Change (IPCC) shows that holding warming to 2°C typically requires global annual emissions, which have risen rapidly during the last decade, to peak sharply around 2020, fall steeply by 50% before 2040, and be close to net zero towards the end of the century.8 To have more than a 50-50 chance of reaching the 2°C goal, emissions need to reach net zero earlier. And to have a 50-50 chance to hold warming to no more than 1.5°C may require reaching net-zero emissions around 2050, followed by substantial net-negative emissions to the end of the century.
Shell’s Mountains and Oceans scenarios were published in 2013 and included the story of reaching net-zero CO2 emissions globally around the end of the century through two
different pathways. Both scenarios contained major gains in efficiency and very substantial deployment of new technologies, including renewable energy and CCS (which starts in the 2020s). Both also require very high levels of policy action and commitment, far beyond what is seen today, including the introduction of robust carbon-pricing mechanisms at a global scale.
The Massachusetts Institute of Technology (MIT) has assessed these pathways using MIT climate models and concluded they would result in temperature increases by 2100 of approximately 2.4°C (for Mountains) and 2.7°C (for Oceans), although within a wide uncertainty band, as with all climate projections.9
REFLECTIONS ON
NEW LENS SCENARIOS
23

A HEALTHY PLANET – NECESSARY STRUCTURAL TRANSFORMATIONS
2

To achieve net-zero emissions requires the widespread transformation of the energy system, including not only the volume and proportion of different primary energies consumed (oil, gas, coal, solar, wind, nuclear, etc.) and the energy carriers they produce (electricity, liquid fuels, etc.), but also how consumers use energy in homes, offices, transport systems and industries. How quickly and how far society can decarbonise depends on whether and how much historic patterns of energy and material demand can be changed.
These structural transformations will occur at different speeds, at different times and in different locations and will be determined both by political and economic local circumstance and by the technical potential for change in key sectors.
Structural transformations in the broader economyMost man-made CO2 emissions from the use of primary fossil-fuel energy (coal, gas and oil) occur in four sectors: power generation, buildings, transport and industry. Each sector presents a different level of technical challenge and has specific characteristics that will determine its potential decarbonisation. In addition, non-technical factors – such as cost, social inertia and institutional capacity – may be equally or even more important in determining the eventual pace and extent of change.
Power generationThe power generation sector currently accounts for around 40% of global energy-related CO2 emissions. It differs from the other sectors in being “intermediate” – that is, it converts primary energy into the electricity used in other end-use sectors. Because electricity is emission-free at its point of use, the decarbonisation of the
power sector can enable decarbonisation elsewhere throughout the economy. Today, electricity provides less than 20% of global final energy consumption. That will need to grow to well over half of total demand in the net-zero world.
There are three fundamental ways to decarbonise the power system: through renewables (wind, solar PV, biomass, hydropower); through the application of CCS to coal and gas-fired electricity generation to prevent most of the CO2 from entering the atmosphere; and through nuclear. Because of this variety of options that could be deployed at scale, the power sector is generally thought to have relatively low technical barriers to decarbonisation. There are other, non-technical barriers, however – for example, the poor acceptance, for different reasons, of onshore wind, nuclear and CCS and the unwillingness to reform power markets to provide incentives for back-up power for intermittent renewables.
Because renewable energy sources generate electricity, the eventual size of their share in the overall energy mix will depend largely on how far energy demand in other sectors can be electrified. While not all countries and regions are equally sunny or windy, evidence suggests that available solar and wind resources would be adequate to meet current and future power needs, even in densely populated regions, as long as transmission over a few hundred kilometres is feasible and acceptable and there is adequate storage to manage daily and seasonal intermittency.11
Hydrocarbons are themselves, in effect, a form of energy storage. Coal and gas, which currently fuel about 60% of global power generation, are always available, and this ensures that power production can seamlessly follow the variations in demand. When the world moves to decarbonise the power sector,
2. A HEALTHY PLANET: NECESSARY STRUCTURAL TRANSFORMATIONS
Since the early 1970s, while final energy consumption has doubled, the mix of fuels has been relatively static, with hydrocarbons contributing a steady 80% or so. The remainder of the energy mix includes approximately 10% biomass (mostly dung and wood), 6% nuclear, 3% hydropower and around 1–2% of the “new renewables” (solar photovoltaic and wind). Yet as we look at the continued growth of new renewables in combination with emerging technological possibilities and the environmental pressures of the 21st century, we see a new phase of transition. The dynamics of change in the next 50 years will be much more apparent than they have been in the past decades. There will
be not only growth, as prosperity and the benefits of modern living continue to become more widespread, but also transformation in economic structures and transition in the technologies applied in the energy system. However, because of the convenience of oil and gas and the cheapness of coal, the shift will not happen by itself.
THE LONG VIEW – PAST AND FUTURE ENERGY TRANSITIONSEnergy Transition Triangle
100%
80%
60%
40%
20%
100% 80% 60%
21001850
1900
1950
2050
19702010
40% 20%
100%
80%
60%
40%
20%
Renewables, Biomass and Nuclear
Oil & Gas
Coal
Mountains Scenario
Oceans Scenario
IEA 450 Pathway to 2040
History
Source: Graph based on L. Barreto, et al., Int. J. H2 Energy 28 (2003) 267. Data prior to 1960 was taken from the IIASA PFU database (Version 0.0.2) https://tntcat.iiasa.ac.at/PFUDB; data 1960–2014: IEA and Shell; data 2015–2100: Shell New Lens Scenarios.The grey line in this graphic depicts how the relative shares of different primary energy sources (coal, oil and gas, and non-fossil) have evolved since 1850 through to the early 21st century. The blue, green and orange lines have been added to the original chart to reflect the future evolution of the energy mix described in the Shell Mountains and Oceans scenarios and in the IEA 450 Pathway. This shows the potential rise in the share of new non-fossil sources, including renewables, hydrogen, and nuclear. Perhaps surprisingly, as expressed in these buckets (coal, oil and gas, non-fossil), the energy mix has stayed constant in the almost 50 years since the 1970s, in spite of oil shocks that induced a shift from oil to gas in the past half century (not visible in this chart).
27

Today, there remains significant uncertainty about how power systems will cope with the growing and diversified supply of intermittent renewable sources. Various combinations of back-up generation (whether coal, gas, nuclear or hydrogen), daily and seasonal storage and demand management will be necessary in different configurations depending on local geography and energy resources, affordability and technology developments over time. But grids have proved capable of accommodating higher percentages of intermittent renewables than had been expected just a few years ago. A lot of innovation is underway which will determine where the limits lie.
BuildingsThe buildings sector is responsible for nearly one-third of global final energy consumption. This results in around 7% of direct energy-related CO2 emissions and also is the source of a large proportion of electricity demand and therefore emissions in the power sector. The primary use of energy in buildings is for heating or cooling, lighting and cooking,
all of which can be powered by electricity. The degree of electrification in buildings will depend both on how efficiently new buildings are designed and on how fast and to what extent the existing stock of buildings around the world can be retrofitted.
In developed economies, the emerging standard for new buildings is “all-electric”. The combination of heavy insulation, triple glazing, electric boilers, heat pumps (effectively air conditioners working in reverse to heat a space) and rooftop solar PV power means that house builders can already build commercially viable, low-rise “net-zero energy” homes (those that generate as much energy as they draw from the grid) in many places. For high-rise buildings and in densely populated cities, where the lack of rooftop space and the intensity of energy consumption make it more difficult for residents to achieve net-zero energy, municipalities may have the option to install district heating networks that pipe recycled or waste heat in the form of steam from nearby industrial and power facilities. Such systems are already common in
however, the share of coal and gas in the energy mix will progressively be replaced by new energies which will increase the need for storage.
Some 95% of today’s power storage on the grid is in the form of pumped hydroelectricity. The regional endowment of hydro potential is therefore an enabler of large-scale power systems that rely exclusively or mainly on renewables. Biomass-fired power is another option, but neither hydro nor biomass will be universally available at the required level. Nevertheless, progress – supported by much investment – continues in relation to non-hydro storage options (compressed air, batteries, hydrogen). And the growing penetration of electric battery vehicles coupled with smart technology may one day provide a decentralised and flexible storage capacity, allowing for power to be stored or drawn by
the grid from each vehicle battery in response to hourly and daily needs. Time will tell how far these solutions can be scaled.
The remaining two ways to decarbonise the power system – CCS and nuclear – are technically proven in whole or in part, but face a number of non-technical challenges, especially in relation to permitting and financing. To get CCS off the ground at scale, favourable geology must be combined with socio-political support and financing mechanisms. The choice for or against further expansion of nuclear is fundamentally a national political one, based on local socio-political and economic conditions. Given its expense, risks and potential liabilities, government support is absolutely necessary for the development of nuclear energy.
ENERGY FLOWS INTO BUILDINGS
Coal and oil Gas Electricity Heat (Traditional) Biomass
Services
Services
Appliances
Appliances
Residentialheating andcooking
Non-OECD buildings (66 EJ) per yearOECD buildings (50 EJ) per year
Residential heating and cooking
Source: Shell analysis
SOURCES OF ENERGY-RELATED CO2 EMISSIONS IN KEY SECTORS
Coal15.3Gt
Indirectemissions15.1Gt
Directemissions17.2Gt
Industry13Gt
Lessdifficult
Other enduse 1.6Gt
Buildings9.3Gt
Transport8.5Gt
Naturalgas 6.5Gt
Crude oil11.4Gt
Less difficult or More difficult is a technical assessment
Coal Natural gas Oil Oil products Indirect emissions Direct emissions
Powergeneration
13.6Gt
Fueltransformation
12.9Gt
Lessdifficult
Moredifficult
Moredifficult
Source: Shell analysisThe graph above explains the relative difficulty to decarbonise key economic sectors. The term “direct emissions” refers to energy-related emissions that occur at the point of use – for example, when someone uses heating oil in the home to heat the building. “Indirect emissions” refers to energy-related emissions during the chain of activities required to deliver that energy service – for example, those generated during the process of heat production in power plants or industrial facilities that supply district heating schemes.
29

the colder climates of Northern and Eastern Europe and are highly CO2-efficient compared to homes fitted with independent heaters. While these systems may be efficient at the point of end users, the heat pumps and district heating systems that lie behind them must be decarbonised for the buildings to be considered net-zero. Where such options are not available, gas boilers remain an efficient option. [See page 74 “Empire State Building Retrofit”].
Retrofitting existing housing stock for a whole country is a multi-decade endeavour. The Energy Technologies Institute (ETI) in the UK has calculated the necessary scale and pace of rolling out district heating required to decarbonise a significant proportion of the UK’s stock of 25 million homes.12 In the ETI scenario – called Clockwork – the plan would require financing (including significant government subsidies), stable policy to incentivise private-sector investment, national and local regulation to set technical and safety standards, the education and training of tens of thousands of skilled technicians to execute the work and the consent of voters and taxpayers to get off the ground. It would also need to start in the next few years and scale up over time. Clearly, this is no small effort, but it is an entirely knowable and technically achievable agenda if supported by clear policy signals.13
Almost all future growth in the construction of buildings is set to take place in emerging and developing countries, particularly in their cities, which brings multiple challenges associated with multiple objectives. People in most developing countries have a greater need for cooling than heating, reinforcing electricity as the preferred energy carrier. Governments and municipalities can encourage momentum towards the use of electricity and gas in buildings by conducting smart macro-level city planning and introducing micro-level building standards. They may also support use of hydrogen in cities, where it can be derived from natural gas to use as feedstock in power plants and as fuel for medium- and heavy-duty
vehicles. Having such dual infrastructure – combining electricity grids together with either gas or district heating grids – is also a feature of resilient systems.
TransportThe direct, energy-related CO2 emissions from transport account for around 20% of global emissions of CO2. The growing and more prosperous global population of a net-zero world will need far greater levels of transport both for personal mobility and for the trade and transport of goods. Energy-service demands for transport are likely to grow three to four times larger than they are today, even assuming significant energy efficiency improvements and a far greater proportion of the global population living closer together in highly compact cities (where they will travel fewer passenger kilometres).
At the moment, the global transport sector, with the exception of rail, is almost entirely powered by liquid hydrocarbons, including petrol, diesel and bunker fuel for shipping. The potential to decarbonise varies across different transport subsectors.
Passenger road transport will be the easiest to electrify, with battery and fuel cell electric vehicles potentially reaching 80% of the global passenger car fleet over coming decades. EVs are particularly suited for short- and medium-distance travel in urban environments and densely populated regions, where recharging points can be easily concentrated to minimise the risk of batteries running out of power mid-journey.
Unlike passenger road transport, the movement of heavy freight over longer distances in ships and trucks requires more energy-dense fuels. Here, alongside growing use of batteries for shorter freight needs, such as inside cities, the use of hydrogen (which emits no CO2) and liquefied natural gas (LNG) – both energy-dense liquid fuels – will complement and eventually displace a proportion of conventional fuels over time.
1,400,000HOMES
CUMULATIVE HOMES WITH DISTRICT HEATING(APPROXIMATE)
500,000HOMES
HOMES ADDED200 DAILY70,000 ANNUALLY
2030
2020
20509,300,000
HOMES
4,300,000HOMES
2040
NET-ZEROENERGYHOME
UK district heating roll-outSpeed of district heating roll-out: Energy Technologies Institute Clockwork scenario
HOMES ADDED800 DAILY300,000 ANNUALLY
HOMES ADDED1,900 DAILY700,000 ANNUALLY
HOMES ADDED300 DAILY100,000 ANNUALLY
31

take the lead in trying to demonstrate such systems, although doing so will require costly reinforcements to the grid to handle the higher voltages likely to be necessary.
The growth of hydrogen as a transport fuel will depend not only on technological progress, but also on institutional capability to build-out the necessary infrastructure and pipeline systems. If the mechanisms are mastered and hydrogen roll-out is achieved globally, hydrogen might take over a significant share of the hydrocarbon needs.
Of course, it is not possible to predict with complete confidence technical advances as far out into the future as the middle of this century and beyond. But it is apparent that the decarbonisation of transport – which today relies overwhelmingly on hydrocarbon fuels – is composed of a series of different tasks for different transport modalities, each with its own specific technical considerations. After the train, the easiest mode of transport to tackle is the private car. Solutions for freight, shipping and aviation are much more challenging.
IndustryThe industrial sector accounts for around a further 15% of direct energy-related CO2 emissions and also is the source of a large proportion of electricity demand and therefore emissions in the power sector. It is made up of a huge variety of industries and sub-sectors with varying energy needs.
Whether a particular industrial sector can decarbonise depends on whether its fundamental processes require very high temperatures and whether certain chemical reactions are involved. Some light-industry sectors, such as the manufacture of clothes, wood, paper and food, require either no process heat or relatively modest temperatures of less than 250°C. Sewing machines, saw mills, steam-heated paper-pulping machines and food pasteurisation vats, for example, can all run on electricity and so these industries can be powered in a zero-emissions way.
Heavy industry, on the other hand, is different. The primary production of iron and steel relies on intense heat (above 1,200°C) in furnaces. Today’s industrial process technologies
And for the longest journeys by air and sea, where the size and weight of batteries will probably remain prohibitive for the foreseeable future, liquid hydrocarbons and biofuels are likely to dominate for a long time to come.
Today, less than 1% of the global vehicle fleet is electric. For light-duty use, that figure will rise significantly in coming years as the price and range of battery-electric and hydrogen-fuel-cell-electric vehicles improve over time. The evolution of battery technology is one of the most important variables that will shape the eventual pace of electrification. Beyond the natural time cycle required for cars to be replaced with newer models, there are few hurdles to the take-up of advanced
batteries as breakthroughs occur beyond ensuring sufficient supply of key resources, such as lithium. Eventually, advanced batteries may even allow some hybridisation of air transport.
In the longer term, the growth of vehicles with batteries may one day provide one of the solutions to the intermittency of renewable energy sources: smart IT technology and algorithms could enable an individual car owner to trade the power storage capacity of a car battery sitting in a garage to help balance the power grid. Car owners could charge utilities to store excess or draw-down power from their vehicle batteries to match supply and demand. Densely populated cities in affluent countries are most likely to
TOTAL FINAL ENERGY CONSUMPTION IN INDUSTRY AND AGRICULTURE
Coal 36EJ
Oil 29EJ
Natural gas 24EJ
Biomass, wasteand otherrenewables 8EJ
Electricity and heat 29EJ
Iron and steel26EJ
Chemicals andpetrochemicals36EJ
Aluminium 4EJ
Cement 11EJ
Pulp and paper6EJ
Other industry44EJ
Source: Based on IEA data from IEA ETP2012. The flow of energy carriers into the industry in 2009 (from IEA ETP2012). Note that the flows into iron and steel include 10 EJ coal for blast ovens and 23 EJ chemical feedstock.
THE FUTURE OF TRANSPORT ENERGY
Ship19EJ/year
Road – freight67 EJ/year
Air30 EJ/year
Rail5 EJ/year
Road – passenger64 EJ/year
Size of the pie indicates the energy required in terms of hydrocarbons based on passenger and freight kilometres.
Hydrocarbons
Hydrogen
Electricity
Wind (Sail)
Source: Shell analysisThis graphic describes our most ambitious scenario, where all technologies – even those that are now only in early stages of research and development – have been implemented globally to their maximum plausible extent in our view. It shows how those future transport energy needs could be met with a broader fuel mix including electricity and hydrogen. (Note that biofuels are pooled with hydrocarbons in this analysis.) The size of each circle is proportional to that subsector’s total consumption of energy if all services were delivered in hydrocarbons.
33

depend on hydrocarbons as thermal fuels to produce these high temperatures. Hydrogen could also possibly be used in future. But there is as yet no clear path for electricity to deliver at industrial scale the high-temperature heat necessary. A particular issue for the iron and steel industry is that iron reduction also requires a source of carbon to convert the iron ore to the elemental metal; CO2 is released as a result and CCS is the only viable route to deal with this. The production of Portland cement – the most commonly used cement in the world – also involves both high temperatures and the release of CO2 as part of the underlying chemical process that occurs. And the various processes involved in the production of base chemicals from petroleum products require high temperatures as well as oil and gas as feedstocks.
While there is ongoing research, it is hard to see any near-term technology breakthroughs that will radically reduce or eliminate the need for thermal fuels and carbon in these basic industrial processes at scale in the foreseeable future.
Yet societies can’t easily do without these material products. They form the building blocks of the modern industrial and agricultural economy. Cement is fundamental to infrastructure development, including construction of buildings (houses, hospitals, airports, etc.) and sanitation services (water treatment plants, sewage systems). Iron and steel are pivotal to the construction of transport systems (car manufacture, railways, ships) and cities (high-rise towers, bridges, tunnels). Natural gas is used to make fertilisers which are an essential input to maintain and increase the production of both food and non-food crops. And base chemicals provide unique and special characteristics for innumerable products that are embedded in our day-to-day lives, such as solvents, detergents, adhesives, plastics, resins, man-made fibres, lubricants and hand-wash gels, to name just a few.
In a world growing towards 10 billion inhabitants, demand is expected to rise for these materials throughout the century, even assuming order-of-magnitude improvements in the efficiency with which economies produce, consume and recycle them.
So, how can these sectors, and with them, our modern industrial economies be decarbonised? There are a number of practical and technical possibilities that can all play a role to some extent, such as more recycling of carbon-intensive materials to reduce the need to produce them in the first place (offset in part by the energy required to recycle) and switching to lower-carbon (gas, biomass) and zero-carbon (hydrogen) thermal fuels. Hydrogen would be a particularly promising alternative if it were produced from renewable electricity by electrolysis of water instead of from natural gas, as is the common practice today, or from natural gas combined with CCS. But even with such promising developments, significant emissions from large industrial plants and processes will continue for decades to come. The only known way to prevent these CO2 emissions from reaching the atmosphere is to use CCS to capture and store them securely underground.
If technical factors determine the potential for decarbonising industries, the level of actual progress will be determined by non-technical factors, including both regulation and cost. There is huge variability across industries. The iron, steel and cement sectors, for example, release about 7kg of CO2 for every dollar of value-added produced. The added value created per unit of energy used in these heavy industries is around ten times less than across the economy as a whole, highlighting the relative difficulty for those industries to finance CO2-mitigation activities.
So what does this mean for transitions ahead in key sectors that are necessary to decarbonise the heavy industries of the modern economy?
CHALLENGES TO AFFORDABILITY OF INDUSTRY DECARBONISATION
Pulp
& p
aper
Other industry
Alu
min
ium
Iron
& s
teel
Cem
ent
Che
mic
als
& p
etro
chem
ical
s
Emis
sion
Int
ensi
ty (
kg C
O2/$
valu
e added
)
Cumulative Industry Energy Consumption (EJ/year)
8
7
6
5
4
3
2
1
0 20 40 60 80 100 120 140
Process emissions from calcination
All energy-related emissions
Direct energy-related emissions
Source: Shell analysis based on data from IEA and Oxford Economics.A histogram of sectoral CO2 emissions against their total final energy consumption in 2012. The economic viability of decarbonisation options can be assessed by looking at the ratios between the energy consumed and CO2 emitted and the value added by each industrial sector, which gives an indication of the likely relative affordability to mitigate emissions.
For steel-making, much of the growth of additional supply in this century could come from increasing the production of recycled (or secondary) steel using electric arc furnaces and gas-fired furnaces. The International Energy Agency describes this possible shift towards greater recycling as the single most important contributor to making steel-making less carbon-intensive in future. But demand for steel is expected to double over the period, and half of steel production will continue to be produced as it is today, by reducing iron ore with cokes in emission-intensive coal-fired blast oxygen furnaces. Industry experts believe improvements in process efficiency could shave a further 20% from steel-making
emissions compared to today’s state-of-the art facilities, most of which are found in the OECD and Europe. Spreading such best-practice technologies to become standard across the global fleet would help. Beyond that, the only plausible technical option for deeper decarbonisation is the use of CCS.
The cement industry faces a similar challenge: extremely low added value per unit of energy used and per kg of CO2 emitted (see chart). On its own, cement accounts for around 5% of global man-made CO2 emissions. For every 1 kg of cement produced, almost 0.9 kg of CO2 is released. Approximately half the emissions
35

from cement production come from the energy used to fire the kiln during the calcination reaction to produce clinker. Coal is most commonly used to fire kilns because it is relatively cheaper, but less CO2-intensive fuels (gas, biomass, hydrogen) could be used instead. The remaining half of emissions from cement production comes from the CO2 that is released during the calcination reaction itself. For a comprehensive solution to decarbonise cement, CCS is again the only viable option, allowing both energy and process emissions to be removed.
In summary, while a large proportion of industry appears capable of being electrified at moderate cost, mitigating CO2 emissions across large swathes of fundamental industrial activity will be more challenging and costly to achieve and will depend inescapably on the use of CCS technology, the deployment of which, in turn, will depend on being financed one way or another.
GROWTH AND DECARBONISATION POTENTIAL OF INDUSTRY
Reliance on hydrocarbons
2013
Future projection
Strongest
Iron & steel
Chemicals &petrochemicals
Light industry
Pulp &paper
Agriculture
Non-ferrousmetals
Non-metallicminerals
Weakest
Biomass (recycled own waste)
Source: Shell, IEA, FAOThis chart presents our analysis of the likely growth across the different subsectors of industry and agriculture from 2013 until the early part of the second half of the century and the potential to decarbonise each of these in a net-zero emissions world. The analysis is based on challenging and optimistic assumptions for the deployment of new technologies and efficiency improvements. The middle, blue circle represents the 2013 breakdown of total final energy consumption of light industry, agriculture (including the relatively minor sectors of forestry and fishing) and the five sub-sectors of heavy industry: pulp and paper, iron and steel, non-ferrous metals, chemicals and petrochemicals, and non-metallic minerals, including cement.14 The output growth of each sector is indicated by the size of the coloured pies, and their colours indicate our qualitative assessment of the difficulty of decarbonising them.
Priority of actionsAs demand evolves across these key areas of the economy, including power, buildings, transport and industry, the energy system will witness an extended period of disruption and co-evolution between established and emerging technologies. When we put the sector-by-sector analyses together, something of a logical order-of-priority of actions to decarbonise the system over time emerges:
1. redoubling efficiency measures and extending electrification across the economy wherever and whenever possible;
2. sustaining momentum of renewables production growth, particularly solar PV and wind, and maximising the ability of the grid to handle their intermittency;
3. accelerating the switch from coal to gas to immediately reduce power-sector emissions while ensuring supply to meet demand – a way of keeping cumulative emissions to a minimum during the transition;
4. improving buildings and city infrastructure to lower energy service demand significantly;
5. accelerating government-directed efforts to promote low-carbon technologies and infrastructures, including nuclear, CCS, hydrogen transport, responsible bio-energy and sustainable forestry, agriculture and land-use practices.
Our analysis suggests that by 2035–50, the first three of these priority actions could bring the world to the halfway point in the transition to net-zero emissions, when much of the global growth in energy demand will have been realised (with the likely exception of Africa), and the relatively easy decarbonisation actions will have been taken. But decarbonisation efforts could run out of steam at this point unless work also gets underway in earnest now on the fourth and fifth area of actions, which are longer-term and will often require decades to plan and implement. This is particularly true
for tackling heavy industry, where mandates will be necessary, and where often the only foreseeable technically feasible option to decarbonise at scale will be through CCS (as in the steel industry). It is also true for the problematic sub-sectors of transport (freight, aviation and shipping) and with regions that lag behind in motivation or ability to address the global challenge. The resilient approach for society is to start testing and building out now the necessary infrastructures, scaling the supply chains they will rely upon and boosting R&D efforts to explore new technology options.
If society succeeds, we will find ourselves with an energy system that is very unfamiliar to us. The proportion of electricity as a share of final energy consumption will grow from around 20% today to well over 50%. Given overall increases in energy demand over this period, this means growth of more than five times today’s total electricity supply.
And the primary energy mix will look very different, too: perhaps 40% of primary energy will be from wind and solar – particularly solar, which is developing so rapidly today. About 20% will come from nuclear and hydroelectricity, with potentially some growth in geothermal developments, and about 15% from the “bio” domain, whether from biofuels, for example in vehicles, or biomass that is combined with gasification and used in industrial processes with CCS to achieve negative emissions.
And that leaves about 20–25% hydrocarbon fuels, primarily oil and gas, in the global energy mix in a net-zero emissions world. Much of the hydrocarbon slice of the mix will be gas, which will have displaced coal as a significantly lower-emissions thermal fuel on the journey. Oil use will continue in heavy-duty long-distance transport, and hydrocarbons will still be used to manufacture petrochemicals. But the world of the net-zero future is a complete turnaround from today, when hydrocarbons constitute more than 80% of the energy system.
37

THE KEY ROLE OF LAND USENearly a quarter of anthropogenic greenhouse gas emissions today comes from agriculture, forestry and other land use. And as the global population grows and becomes wealthier over time, demand for crops, pasture to feed animals, wood products and biomass are all set to rise further. So if we hope to achieve net-zero emissions, it is vitally important to control land-use emissions.
First, the highest priority is to stop and reverse conversion of natural forests, peat-lands and high-carbon grassland to agricultural use. Indeed, this is considered by many to be as important as reducing a similar amount of CO2 from coal power stations, given the other benefits that natural ecosystems provide, both short- and long-term. These benefits include biodiversity, water cycle management, soil protection and maintenance of the natural carbon cycle.
Diverse land types and uses require a variety of approaches. By 2050, the world may need a 60% increase in crop yields from the land already cultivated. And the amount of food and agricultural products that are simply wasted through poor harvesting, processing and distribution practices must be cut down from the 30–50% of total production that is wasted today.
Second, the world must reduce emissions from rearing animals. 80% of agricultural land is used as pasture to feed animals. Without stringent controls, emissions from livestock of methane – which is a far more potent greenhouse gas than CO2 – could more than double from 2010 to 2100. Many experts in food policy see the growth in most current patterns of meat production and consumption as the outstanding
challenge in reaching a sustainable agriculture. While global meat consumption will surely rise in future, a shift to alternative diets would help moderate demand growth overall.
Third, agricultural production must significantly reduce nitrous oxide (N2O) emissions from the use of fertilisers, which are on course to double or even triple over the century. Nitrous oxide is approximately 300 times more potent as a greenhouse gas than CO2 and remains in the atmosphere for over a hundred years. The IPCC argues that prospects for reducing CO2 from land-use by mid-century are more promising than from most energy and energy-use sectors, but acknowledges that “some sources of these non-CO2 gases are difficult to mitigate, such as N2O emissions from fertiliser use and methane emissions from livestock. As a result, emissions of most non-CO2 gases will not be reduced to zero, even under stringent mitigation scenarios.”15
Changing land-use practices for the better will require action in five broad areas: the production of food, feed, fibre and energy, and the management of nature. The higher the growth that can be achieved in crop yields, the less dramatic will be the changes and trade-offs required among meat production, bio-energy and re-wilding. Clear policies are required to set the framework for sustainable intensification of land use, particularly in underdeveloped economies. Stimulating investment is key, and prices on greenhouse gases will help drive this.
Fossil Approximately 50% electrification of end use.With Carbon Capture and Storage
EmergingNet-ZeroEmissions
World
2015
Plausible energy mix in an emerging net-zero emissions world
Source: Shell analysis
For a world with widespread prosperity, the energy system will double over the course of this century.
ENERGY SOURCE GAS OIL COAL BIOENERGY NUCLEAR SOLAR WIND OTHER
2015 21% 31% 28% 11% 5% 0.5% 0.5% 3%
Net-Zero emissions world 9% 7% 9% 15% 8% 30% 12% 10%
39
insight into...

ENERGY TECHNOLOGY DEPLOYMENT
109
108
107
106
105
104
103
1960
1970s to 2000Creating the technologies
2000 to 2030Technologies to scale
Post 2025Making the system work
Materiality
20502040203020202010Year
2000
Total
Oil
Nuclear
LNG
Biofuels – 1st gen
Biofuels – 2nd gen
Solar PV
Wind
CCS
Observed and projected deployment
199019801970
TJ/Y
ear
Blueprints’ projections
Source: Gert Jan Kramer and Martin Haigh, “No Quick Switch to Low Carbon Energy”, Nature (December 2009), 568–69.When a technology produces 1,000 terajoules a year (equivalent to 500 barrels of oil a day), the technology is “available.” It can take 30 years to reach materiality (1% of world energy mix). This was identified as one of the “laws” of historical energy deployment. Projections after 2007 taken from Shell’s previously published Blueprints scenario 2008.
in 20 years (two more decades of one order-of-magnitude-per-decade growth). But analysis demonstrates that after passing the 1% threshold, the rate of growth of new energy technologies as a share of the total energy system naturally tends to slow as the supply chain and industry mature, even as actual deployment rates continue to grow. This appears to be because bigger and bigger absolute investments are required in supply chains – with associated financial risks and needs for scarce skilled labour – and also because advantaged niche positions are already filled, so “mainstream” competition is increasingly relevant.
So what does this mean for the future role of the current generation of “mature” renewable energies (solar PV, wind, first-generation biofuels)? In the Shell Oceans scenario we describe an ambitious pathway in which solar grows from 1% today to become the largest single primary energy source in the energy system by 2060, accounting for 40% of total primary energy. To achieve such growth would require higher fossil-energy prices relative to solar, significant innovation in technology (such as battery storage capacity and integration of solar with building materials), worldwide markets of solar products that appeal to the rich as well as the poor, a high electrification of stationary energy uses and a commitment by many people worldwide to sustainable sources of energy. Clearly, this is no quick or easy journey, but it is feasible.
For newer energy technologies that are still in the lab or early demonstration phase, such as second-generation biofuels, advanced nuclear and CCS, we believe the 30-year “rule” is still a useful predictor of the pace of change.
One factor that affects the penetration of all new technologies is the rate at which existing energy infrastructure can be replaced. Unlike consumer goods, much of the capital stock of today’s energy system (for example, the large, capital-intensive, centralised power plants) can typically operate for up to 50 years – which has led to very slow historical replacement rates because
investors will normally consider early retirement of such facilities only if the total capital and operating costs of the new technology fall below the operating cost of the old.
In future, as the cost of renewable energy falls, and as technical breakthroughs occur in storage and smart-grid technology, which will trigger a market response and business model innovations, it is possible that more facilities will be retired early, as is already happening in a number of countries today. And the growth of rooftop solar and smaller-scale, cost-competitive, decentralised energy infrastructure will further shorten infrastructure lifecycles and churn rates. If new energy sources are to be deployed more quickly and cost-effectively, then wisely designed subsidy and tax policy frameworks will need to be put into place in order to make the transition cost-effective and to minimise excessively costly write-off of assets.
IN FUTURE, AS THE COST OF RENEWABLE ENERGY FALLS, AND AS TECHNICAL BREAKTHROUGHS OCCUR IN STORAGE AND SMART-GRID TECHNOLOGY, WHICH WILL TRIGGER A MARKET RESPONSE AND BUSINESS MODEL INNOVATIONS, IT IS POSSIBLE THAT MORE FACILITIES WILL BE RETIRED EARLY, AS IS ALREADY HAPPENING IN A NUMBER OF COUNTRIES TODAY.
41
THE GROWTH OF RENEWABLES AND NEW ENERGY TECHNOLOGIESThe net-zero emissions energy system would feature a far larger role for renewable energy sources like wind, solar, hydro, geothermal and other new energy sources. Thirty years after the first generation of wind and solar technologies first left the lab in the 1970s and 80s, they have recently surpassed the point of materiality (more than 1% of the global energy mix) and are being deployed at impressive rates.
This 30 year journey from lab to material impact is typical for any new generation of energy technology. The necessary research starts small
and takes time to spread. Government funds are often required to build demonstration projects for the most promising options. And, finally, private finance helps successful new technologies scale up more rapidly.
During this early “take-off” phase, new technologies can enjoy exponential growth. The 20th century was characterised by a scale-up rate of new energy technologies of one order of magnitude a decade (corresponding to 26% annual growth). If the exponential growth could continue, all energy would be renewable

MEETING HUMAN ASPIRATIONS: DEVELOPMENT AND THE ENERGY LADDER
3

0
50
100
150
200
250
300
350
TECH
NO
LOG
ICA
L M
AN
IND
UST
RIA
L M
AN
AD
VAN
CED
AG
RICU
LTU
RA
L M
AN
PRIM
ITIV
E A
GRI
CULT
UR
AL
MA
N
HU
NTI
NG
MA
N
PRIM
ITIV
E M
AN
TRANSPORTATIONFOOD HOME ANDCOMMERCE
INDUSTRY ANDAGRICULTURE
A view on evolution of primary energy consumption by individuals
Primary energy use:gigajoules per capita per annum
3. MEETING HUMAN ASPIRATIONS: DEVELOPMENT AND THE ENERGY LADDER
The economic “growth escalator” that the US has been on for over a century is the common aspiration of most, if not all, emerging and developing economies. This growth has coincided with a massive expansion in US per capita energy consumption.
Yet modern economic theories do not typically refer to energy as an important determinant of economic growth. Instead, the focus is on the growth of the labour force, the educational level of the labour force (what economists refer to as “human capital”), the growth in physical capital and the elusive magnitude called “total factor productivity”, which reflects an amalgam of incentives, institutions and management practices. A closer examination of how energy consumption facilitates development is required to better understand how the aspirations for a decent quality of life for the global majority will affect the world’s energy needs over the remainder of the century.
Source: The Flow of Energy in an Industrial Society, Earl Cook, Scientific American, 1971
45

increases in overall energy use as less energy-intensive sectors, like services, become more prominent and efficiency improvements play a role. Growth in energy use per person at a national level may plateau or even decline once the material needs for a decent modern quality of life have been met. However, the eventual energy use per person recorded in developed countries may be lower than the actual energy used because imports replace some domestic production.
The level of the primary energy plateau depends on local circumstances like climate, social norms, industrial structures and whether compact or sprawling models of urban development have predominated. [See page 72 “Economic Growth and Energy”].
A global picture for the 21st centuryThe evidence from historical development, combined with future possibilities for improvements in structural and end-use energy efficiency and taken together with detailed studies from currently developing economies,16 suggest that approximately 100 GJ per capita per year primary energy is a reasonable
benchmark for the average energy needs for people to experience a decent, modern quality of life. For illustration, a snapshot of current circumstances, taking the UN Human Development Indicator as a reference, is also consistent with this estimate, as shown in the chart.
Around this average benchmark, significant variation will almost certainly persist as a result of geography and legacy circumstances. But for many currently developed economies this conclusion highlights the potential for becoming much more efficient in resource use – and hence for reducing their demand overall – while for developing economies, it provides some sense of the scale of the energy system that needs to be put in place. In a world of 10 billion people by the end of this century, aspirations for reasonably widespread prosperity will be associated with a global energy system approximately twice as large as at the beginning of this century.
Victorian Britain was the first “modern” industrial society able to provide the essential services expected in the modern age. This was before widespread electrification but involved a step change in energy use as compared with the largely rural, agricultural society that it replaced. What is of equal significance, however, is that even after the initial industrial era, energy use expanded even more. This evolution of energy use, highlighted by Earl Cook in the 1970s (see page 45 “A view on evolution of primary energy consumption by individuals”), is linked not just to rising affluence, but also to the availability of electricity as an easy-to-use energy source and to the widespread access to transportation services. While 21st-century efficiency will certainly temper eventual energy use per person, particularly against Cook’s 1970s estimates, the premise of rising energy demand at a global level nevertheless stands.
Historically, the growth pathway has been paved with coal, at least at the outset, as industrial capacity grows and large-scale power generation is needed. Coal is a relatively easy resource to tap into and make
use of. It requires little technology to get going but offers a great deal, such as electricity, railways (in the early days), heating, industry and, very importantly, smelting for metal refining, where carbon is required as the reducing agent. In the case of Great Britain and the US, coal provided the impetus for the Industrial Revolution. For the latter, very easy-to-access oil soon followed and mobility flourished, which added enormously to the development of the continent.
The national energy ladderIn contrast to Cook’s analysis, which looks globally at human development through energy-use archetypes of individuals over the sweep of history, if we simply consider energy use per person in national economies as they develop, a somewhat different story emerges in the form of a “national energy ladder”. Energy use first rises gently with increasing economic activity until there is a transition into the industrialisation phase of development, including the implementation of utility and transport infrastructures, which is very energy-intensive. Once this foundation of economic development is in place, subsequent economic growth is accompanied by lower
ANNUAL ENERGY USE PER PERSON
GDP/capita (PPP 2010 USD)
GJ/
capita
(Ene
rgy
sour
ce)
USA & Canada Europe China Latin America
Other Asia Middle East & Africa India 2014
350
300
250
200
150
100
50
00 20,000 40,000 60,000 80,000 100,000
Source: Shell analysis – World Energy Model Oceans
PER CAPITA PRIMARY ENERGY DEMAND IN 2014 VS UN HUMAN DEVELOPMENT INDEX
Hum
an
Dev
elop
men
t In
dex
GJ/capita
1
0.9
0.8
0.7
0.6
0.5
0.4
0.3
0.2
0.1
00 50
Sudan
Angola
100 150 200 250 300 350
Indonesia
BrazilEcuador
BangladeshKenya
Morocco
Mexico
Spain/Italy
South AfricaChinaUkraine
Iran
United Kingdom
FranceJapan
Germany
Russia
South Korea
Saudi Arabia
USA Canada
India
DR Congo
Tanzania
Source: Shell analysis – UN Human Development Index
47

The costs of decarbonisation for developing countries
While decarbonisation efforts generate some economic activity, there seems little doubt that the initial impact of energy decarbonisation would be to impose adjustment costs on all economies. These costs would have a greater impact on less developed societies, whose economies and institutions are considered to be less flexible and for whom the economic opportunity loss of not having fossil energy to fuel development (including quality of life, health, education, etc.) is much higher than for richer economies. Much of this burden of adjustment would fall on energy-intensive intermediate goods, such as steel and cement, which are currently of central importance in investment. At the same time it is these countries that may well suffer the more severe consequences of climate change, which is why their leaders have accepted the scientific and economic consensus that for the global community to act now is also in their interest.
A first impression of these costs – and of the willingness of countries to pursue decarbonisation – has appeared in the Nationally Determined Contributions (NDCs) tabled by some 189 countries as part of the Paris Agreement. The NDCs come in many flavours, but numerous submissions specifically reference ambitious reductions in emissions.
Even for a relatively modest population base, such as that in Kenya, the anticipated cost for a 40% deviation from a business-as-usual energy-emissions trajectory through to 2030 is some $25 billion, as estimated in the Kenyan NDCs. This represents a cost of about $25 per tonne of CO2, which is not exceptional – in fact, it is at the lower end of what might prompt, for example, a switch from coal to natural gas as the preferred fuel. But scaled up across the least developed economies and the 3 billion people within them over the period 2020–30, the level of support needed for a very different energy pathway approaches $2 trillion. This is a relatively small
proportion of global economic activity for the period and it forms the basis for the $100 billion per annum floor in the mobilisation of climate finance from developed countries to developing countries to which the Paris Agreement refers. The challenge is to have effective mechanisms that bring various sources of funding together with appropriate investments at scale. One such mechanism is the Green Climate Fund, a nation-state-funded global initiative to respond to climate change by investing in low-emission and climate-resilient development.The provisions within the Paris Agreement for carbon market development also offer the potential for channelling this level of funding.
Much uncertainty remains in relation to the longer-term impact on both growth and well-being as a result of countries taking very different energy pathways as well as different relative price structures across the various forms of future energy supply. Sustained long-term growth is ultimately a matter of institutions for innovation. What we can say on the basis of the limited evidence available is that the demand for energy services can certainly be expected to increase as societies become more complex and also that the restructuring of consumer aspirations and industrial investment to reflect new, policy-imposed patterns of moderation is at least a generation-long project, which will be full of political complexities.
Development and emissionsThe rise in average per capita income that occurs as countries move from low to higher income levels has historically been accompanied by a more than four-fold increase in per capita greenhouse gas (GHG) emissions. Not surprisingly, the increase in emissions is particularly pronounced for countries where significant domestic fossil reserves have driven the current levels of prosperity – but have also resulted in high levels of per capita energy consumption and GHG emissions.
The refining and fabrication of raw materials and the necessary infrastructure for this, together with the manufacture of goods, account for a large part of the global economy, one that is critically important in the early stages of growth and development in most economies. These energy-intensive steps are on the critical path to economic well-being – but as we have shown in the previous chapter, they are also the most difficult and costly to decarbonise.
As a recently emerging economy, China, for example, has grown rapidly on the back of large-scale manufacturing while at the same time building vast swathes of infrastructure, from cities such as Shanghai and Chongqing to the high-speed rail networks that now connect them. This infrastructure includes many of the basic requirements of a decent life, ranging from schools to hospitals, roads to sewers. Energy use and emissions have soared, but, for the most part, this increase hasn’t been for personal domestic use, such as home electricity and heating, but to make products for consumers in China and for export – and exports have, in turn, financed the necessary domestic infrastructure.
As was the case for Great Britain, the US and others before it, China’s development path to date has also led to environmental problems, not just in CO2 emissions, but also in local air and water quality. Despite the newly found affluence for many of its people,
quality of life hasn’t followed in lock step, and a potentially costly reworking of the energy system will be necessary in order for China to improve environmental outcomes and meet its international climate contribution. This adds to the incentive to find an alternative route forward for countries further down the development ladder.
Between 1995 and 2015 cumulative emissions from China amounted to some 130 billion tonnes of CO2, or around 100 tonnes per person. Various raw-material processing and manufacturing facilities in combination with the transportation of heavy goods account for more than a third of the 100 tonnes and are the backbone for the strategy of export-led development followed so successfully in now-affluent parts of Asia. But this 100 tonnes per person of development emissions includes the hardest and arguably the most expensive to decarbonise, which is problematic for economies in the earlier stages of rapid development looking to build steel mills, cement plants, chemical plants and manufacturing plants. Much of the remainder of the 100 tonnes is from coal-fired power stations, producing electricity both for industry and residential use. Policymakers are now focusing on this end of the energy system as a means of reducing both CO2 emissions and local pollutants. But expanding efforts to reduce industrial emissions while maintaining a reasonable level of economic growth will present an even greater challenge.
These realities lead to key questions related to human quality of life, global development and energy use. How they are answered will have a lot to say about the willingness and ability of the currently less developed economies to embark on fundamentally different trajectories from the coal and oil pathways followed by their predecessors.
MUCH UNCERTAINTY REMAINS IN RELATION TO THE LONGER-TERM IMPACT ON BOTH GROWTH AND WELL-BEING AS A RESULT OF COUNTRIES TAKING VERY DIFFERENT ENERGY PATHWAYS.
49

MOVING AHEAD TOGETHER: TECHNOLOGY AND POLICY
4
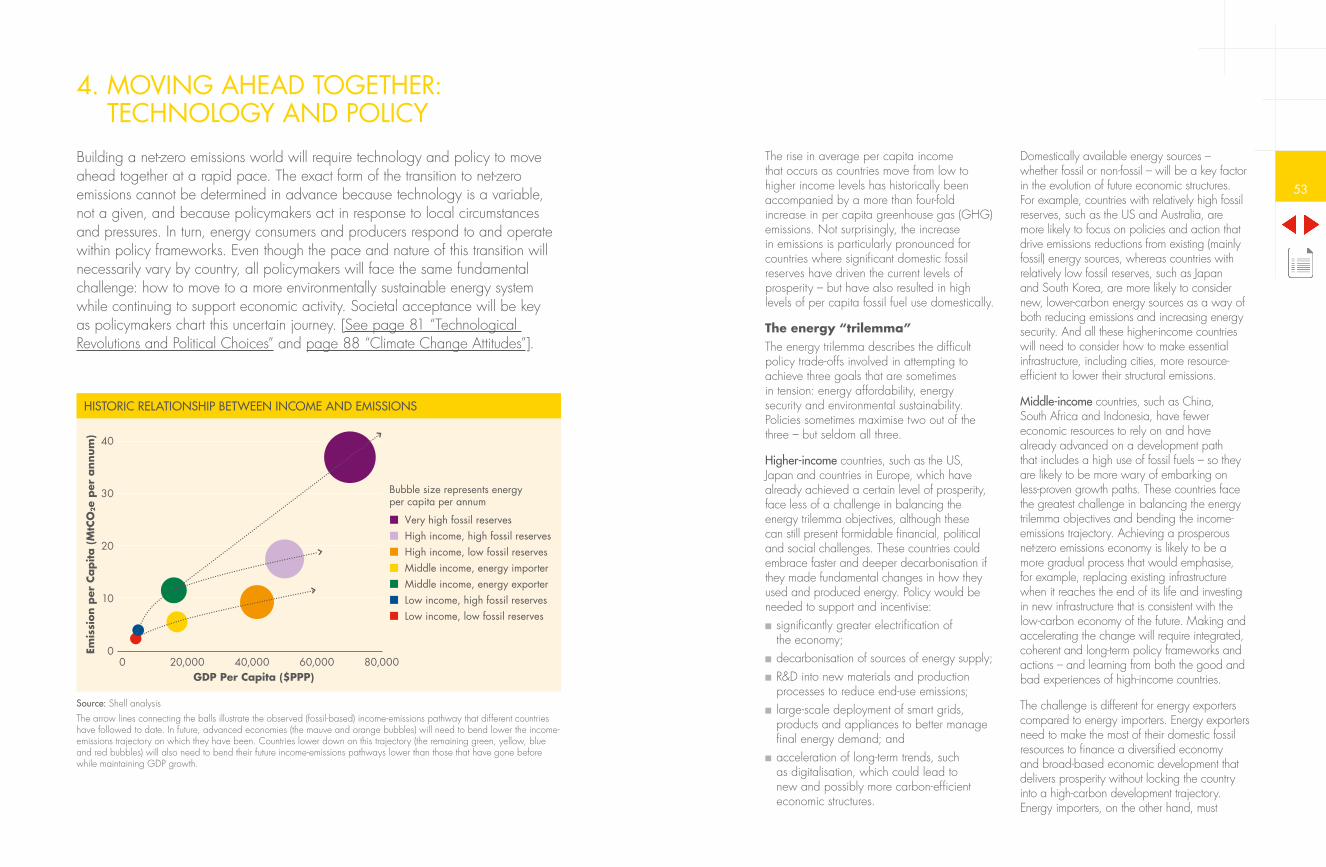
HISTORIC RELATIONSHIP BETWEEN INCOME AND EMISSIONS
Emis
sion
per
Capita
(M
tCO
2e
per
ann
um)
GDP Per Capita ($PPP)0
40
30
20
10
040,00020,000 60,000 80,000
Very high fossil reservesHigh income, high fossil reservesHigh income, low fossil reservesMiddle income, energy importerMiddle income, energy exporterLow income, high fossil reservesLow income, low fossil reserves
Bubble size represents energy per capita per annum
Source: Shell analysisThe arrow lines connecting the balls illustrate the observed (fossil-based) income-emissions pathway that different countries have followed to date. In future, advanced economies (the mauve and orange bubbles) will need to bend lower the income-emissions trajectory on which they have been. Countries lower down on this trajectory (the remaining green, yellow, blue and red bubbles) will also need to bend their future income-emissions pathways lower than those that have gone before while maintaining GDP growth.
The rise in average per capita income that occurs as countries move from low to higher income levels has historically been accompanied by a more than four-fold increase in per capita greenhouse gas (GHG) emissions. Not surprisingly, the increase in emissions is particularly pronounced for countries where significant domestic fossil reserves have driven the current levels of prosperity – but have also resulted in high levels of per capita fossil fuel use domestically.
The energy “trilemma”The energy trilemma describes the difficult policy trade-offs involved in attempting to achieve three goals that are sometimes in tension: energy affordability, energy security and environmental sustainability. Policies sometimes maximise two out of the three – but seldom all three.
Higher-income countries, such as the US, Japan and countries in Europe, which have already achieved a certain level of prosperity, face less of a challenge in balancing the energy trilemma objectives, although these can still present formidable financial, political and social challenges. These countries could embrace faster and deeper decarbonisation if they made fundamental changes in how they used and produced energy. Policy would be needed to support and incentivise:
■ significantly greater electrification of the economy;
■ decarbonisation of sources of energy supply; ■ R&D into new materials and production processes to reduce end-use emissions;
■ large-scale deployment of smart grids, products and appliances to better manage final energy demand; and
■ acceleration of long-term trends, such as digitalisation, which could lead to new and possibly more carbon-efficient economic structures.
Domestically available energy sources – whether fossil or non-fossil – will be a key factor in the evolution of future economic structures. For example, countries with relatively high fossil reserves, such as the US and Australia, are more likely to focus on policies and action that drive emissions reductions from existing (mainly fossil) energy sources, whereas countries with relatively low fossil reserves, such as Japan and South Korea, are more likely to consider new, lower-carbon energy sources as a way of both reducing emissions and increasing energy security. And all these higher-income countries will need to consider how to make essential infrastructure, including cities, more resource-efficient to lower their structural emissions.
Middle-income countries, such as China, South Africa and Indonesia, have fewer economic resources to rely on and have already advanced on a development path that includes a high use of fossil fuels – so they are likely to be more wary of embarking on less-proven growth paths. These countries face the greatest challenge in balancing the energy trilemma objectives and bending the income-emissions trajectory. Achieving a prosperous net-zero emissions economy is likely to be a more gradual process that would emphasise, for example, replacing existing infrastructure when it reaches the end of its life and investing in new infrastructure that is consistent with the low-carbon economy of the future. Making and accelerating the change will require integrated, coherent and long-term policy frameworks and actions – and learning from both the good and bad experiences of high-income countries.
The challenge is different for energy exporters compared to energy importers. Energy exporters need to make the most of their domestic fossil resources to finance a diversified economy and broad-based economic development that delivers prosperity without locking the country into a high-carbon development trajectory. Energy importers, on the other hand, must
4. MOVING AHEAD TOGETHER: TECHNOLOGY AND POLICY
Building a net-zero emissions world will require technology and policy to move ahead together at a rapid pace. The exact form of the transition to net-zero emissions cannot be determined in advance because technology is a variable, not a given, and because policymakers act in response to local circumstances and pressures. In turn, energy consumers and producers respond to and operate within policy frameworks. Even though the pace and nature of this transition will necessarily vary by country, all policymakers will face the same fundamental challenge: how to move to a more environmentally sustainable energy system while continuing to support economic activity. Societal acceptance will be key as policymakers chart this uncertain journey. [See page 81 “Technological Revolutions and Political Choices” and page 88 “Climate Change Attitudes”].
53

4. Hydro-deprived, anti-nuclear nations are those, like Germany, whose populations and governments rule out nuclear as a sustainable energy option. Initially, these nations may attempt to rely almost fully on wind, solar and other, less prominent but more continuous sources of renewable energy, such as geothermal and ocean energy. As they move towards deeper stages of transition, they may encounter difficulties in meeting the aspiration of full decarbonisation and may then choose to deploy CCS to maintain affordable progress. Efficiency and other measures to consume less energy – such as improving energy productivity in production processes – will also be a particular focus in the long term.
5. Laggards are those nations and regions that, for whatever socio-political or economic reasons, will not significantly decarbonise their power systems in the
decades ahead. These systems might still look much the same as they do today: 80% fossil-fuel-based thermal generation with small elements of nuclear, hydro and other renewables. In 2050, how large will this category be, and who will be in it? While the answer to this question is impossible to know, we do know that most nations are currently in this “laggards” category. The question then is: When will countries move away from this insufficient decarbonisation position? And through what path?
We don’t know when and through what path decarbonisation will occur – but we can make some informed guesses. First, we should expect that the progress of decarbonisation in the power sector will be politically determined within the developing framework of technology options available and that a patchwork of regional and national approaches is almost inevitable. Solar and wind will naturally have
balance the economic development benefits of fossil fuels as a cheap, abundant and efficient energy source with the environmental sustainability and energy-security benefits of reducing their dependence on fossil fuels.
Lower-income countries, such as Bangladesh, Vietnam and Ethiopia, are not yet locked into the prevailing fossil-fuel-based development model and thus have a greater opportunity for taking a less energy-intensive pathway to development. These countries also tend to be the most vulnerable to the impacts of climate change and the least resilient. By adopting new technologies and production processes, shifting to new energy sources and investing in the necessary enabling infrastructure, lower-income countries could “leapfrog” to a net-zero emissions economy.
However, leapfrogging to a different development path requires financial, technological and other support from the broader international community to help build local capacity. Where necessary, international finance, lending and aid could support the development of domestic fossil resources in countries with relatively high fossil reserves in such a way as to avoid locking them permanently into a high-carbon economy. This support could also encourage the deployment of low-carbon technologies, processes and infrastructure at scale in countries with low fossil reserves. (See page 84 “Collaboration”).
Very high-fossil reserve countries, such as the Gulf Cooperation Countries, have high per capita emissions, accounting for about 5% of total energy-related CO2 emissions. They face the challenge of fundamentally changing their economic growth model. Growth in these countries has been driven and sustained through development of domestic fossil reserves. Continuing to deliver growth and prosperity in the longer term will require shifting to a more economically sustainable growth path and a diversified economy that is reliant not just on fossil fuels. This shift could be approached, for example, by using fossil export revenues
to drive energy efficiency improvements, to support the development of domestic renewable resources, such as solar, and to invest in skills and education required to achieve broad-based economic and human development.
Example: Power sector archetypesGiven these considerations and the geographically determined relative availability of alternatives, it seems likely that five power sector archetypes could emerge by 2050:
1. Renewable-rich regions, which will have an essentially all-renewables power system by virtue of their diverse renewables resource base in combination with a relatively low population density. Examples may include Nordic countries and some countries in Europe and Latin America – particularly Brazil.
2. Nuclear nations, which will adopt, or have already adopted, nuclear as the backbone of their power system. France’s power system, with 80% nuclear and 15% hydro, is a present-day example. In time, France may rebalance its portfolio to include a larger share of intermittent renewables at the expense of nuclear.
3. Densely populated regions with limited availability of underutilised land, such as urban area in South Asia and China, will be driven by significant pressures to reduce emissions in general to protect air and water quality but may find it difficult to supply power to their megacities at a sufficient scale from renewables alone. In response to their significant need for large-scale baseload power supply, they will likely rely upon a broad mix of sources, including nuclear, and deploy CCS at scale. These countries would first attempt to decarbonise their coal- and gas-fired power plants. Over time, with the substitution of biomass-fired power generation, they might generate net-negative emissions to offset remaining emissions elsewhere in their energy systems.
55

THE DEVELOPMENT OF A GLOBAL CARBON MARKET THROUGH LINKAGE
*Japan’s JointCrediting
Mechanism
Forestry/REDD+
CCS certificates
Large-scale project activity
California
Quebec
Ontario
Washington
2020 2025 2030 2035 2040
Singapore
China
Australia
New Zealand
North America
n Club
Global Mec
hanismsAsia/Pacific
For further explanation on carbon pricing see page 61 “Explicit and implicit carbon pricing”. *The Japanese Government promotes a Joint Crediting Mechanism which is an example of national policy development. Visit http://gec.jp/jcm/about/index.html
More countries join the EU ETS
a high prominence, though they will continue to need supportive policy frameworks. Eventually – barring technology breakthroughs that would provide a truly scalable and lowest-cost solution for (seasonal) storage – the political debate will focus on decisions to embrace nuclear and, in combination, fossil fuels with CCS to provide a secure backbone and back-up of the power delivery system.
Paying for the transitionThe transition to a significantly less CO2-intensive economy will incur a range of adjustment costs, including:
■ increased costs to some businesses and industries – for example, a fall in demand and/or loss of competitiveness;
■ displacement of investment, innovation and jobs from some areas as the economy rebalances towards low-carbon energy consumption;
■ diminished returns as some investments – particularly unabated hydrocarbon infrastructure – become redundant; and
■ sectoral and distributional considerations to address the possible negative impacts on vulnerable sections of society and energy-intensive and trade-exposed sectors of the economy.
While these costs are likely to be a relatively small share of overall GDP (assuming moderate economic growth over a number of decades), how the cost is distributed between various economic players, including tax payers and energy consumers and the triggers to accelerate low-carbon investment, will require government policy intervention in some form.
Carbon pricingOne way to ensure an efficient allocation of the costs and resources across the economy is for government to introduce what is commonly called a “carbon price” mechanism. The purpose of such a price is to:
■ reduce CO2 emissions by reducing incentives for the use and production of carbon-intensive fuels and increasing the incentives
for the use and production of low- or no-carbon fuels and energy sources, as well as emission-reduction technologies like CCS;
■ create incentives for innovation in low-carbon technologies, production processes, products and low-carbon infrastructure investment; and
■ trigger behaviour change in how energy is used across the economy to create a “pull” for low-carbon technologies, products and lifestyles.
The government implementation of a carbon price would create a new cost-ranking of goods and services based on their carbon emissions. In turn, this cost would influence the purchasing decisions of consumers. Products with a high carbon footprint would become more expensive, leading to their disappearing from the market, or to the stimulation of greater end-use efficiency, or to decisions by manufacturers to invest in projects to lower their footprint.
To overcome the likely resistance of voters or other stakeholders, governments could choose to return the collected carbon revenue to consumers in the form of reductions in other types of taxes or use it to support climate policy objectives such as funding low carbon R&D, providing income support, or driving energy efficiency improvements. Whatever mechanisms are used for returning the revenues, they need to be carefully designed so as not to undermine the carbon price in the first place.
To be truly effective in reducing global emissions, carbon pricing needs to be implemented across as much of the global economy as possible – effectively creating a global price. While national or state level schemes may succeed in reducing the production or consumption of fossil fuels in a given region, they may also simply result in producing more emissions elsewhere – so-called “carbon leakage”. Border tax adjustments on imports may turn out to be a necessary step in addressing this challenge.
The Paris Agreement has provided useful language for the eventual development of a broad-based carbon-pricing system, but significant effort and policy development will be required to implement such a global structure. A global carbon price is likely to be achieved only by progressively interweaving systems through linkage as they are developed at a national or even lower level (see illustration above). The cap-and-trade systems in California and Quebec are linked, and Ontario is now joining this “carbon club”, creating a bottom-up linked version of the Emissions Trading Scheme implemented across Europe from 2005.
By 2020, when the Paris Agreement fully enters into force, explicit carbon-pricing policies could be operating in the EU, China, parts of North America, Australia, New Zealand, several Latin American countries, South Africa and Korea. But these policies are not the equivalent of a global approach with
sufficient breadth, maturity and robustness to deliver lasting change. Even after Paris, and with concerted efforts by governments, an effective global approach may take another decade; and even then, it will still require considerable calibration to actually deliver on the Paris ambition.
The need for technology investmentNew technologies become cheaper only as a result of on going demonstration and eventually mass production. While carbon pricing can jump-start emissions reductions in some parts of the economy, it won’t be sufficient in the near term to support the much more expensive fundamental research and early demonstration stage of the next generation of low-CO2 technologies. Their development must get underway as early as possible to ensure that they are available and affordable for large-scale deployment. But because of the uncertainty
57

of future CO2 policy and the high-risk nature of such unproven options, the private sector is reluctant to invest. So more direct government-backed funding is critical. This support could be time-limited and focused on promising, pre-commercial, low-CO2 technology. Once technologies mature, they could compete in the market without on going public sector support.
Funding CCSThe IPCC has estimated that keeping to a 2°C pathway would cost global society approximately 140% more without CCS. CCS is a capital-intensive technology. To date, individual CCS projects have largely relied on a combination of major capital grants from government to underpin construction costs and access to a modest price on CO2 for on going commercial viability. The very large-scale deployment of CCS required to achieve net-zero emissions, however, cannot sustainably proceed on the back of such grants. Commercial viability for a CCS plant would currently require a mechanism (for example, a carbon price) to reward capture and storage of CO2 at over $100 per tonne, but this cost could decline to around $70 per tonne in the early 2030s as more CCS plants are built and the supply chains they rely upon mature. This would put the price of CCS-based power generation from natural gas on a par with offshore wind.
Given the present lack of effective carbon pricing, financial support for low-carbon technologies (as is offered to renewables in many countries) could be extended to include CCS. Such a mechanism could encourage the continuation of CCS R&D and deployment until carbon pricing ramps up to levels sufficient to support commercial deployment. This is particularly the case for developing countries, where the financial impact of carbon pricing on business and society is likely to delay the introduction of sufficient carbon pricing to drive CCS. Mechanisms such as the Green Climate Fund could consider providing funds to support CCS projects.
Policy challenges for the built environmentThe commercial and residential sector is an area where there is a particularly strong case for additional action. Either directly or indirectly, buildings account for at least a third of global energy use and therefore a significant proportion of global emissions. Yet adding a carbon cost to the use of electricity in buildings may have only a muted impact due to the nature of the sector itself. One example is the relationship between landlords and tenants, where the latter pays the electricity bill and the former controls the capital budget that ultimately establishes the efficiency of the building. The World Business Council for Sustainable Development (WBCSD) has proposed a comprehensive series of efficiency improvement measures that target regulators, investors, developers and occupiers of buildings. (See page 80 “Energy Efficiency in Buildings” and page 85 “Resilient Cities”).
An integrated approach to policy-makingInitially, getting to a prosperous net-zero emissions world is likely to require greater effort from higher-income countries, who can move fastest to decarbonise (and help others to do the same) to compensate for the inevitable slower pace of change in countries further behind on the development trajectory. The framework of Nationally Determined Contributions (NDCs) endorsed in the Paris Agreement recognises that a family of approaches with differences as well as similarities is to be expected. But regardless of their stage of development or individual circumstances, national governments will need to provide the appropriate policy frameworks and incentives to change the way energy is both used and produced. This will require more comprehensive and better coordinated policy approaches. And given the complexity of the challenge, society must be ready to learn from the inevitable policy failures that will mark progress along the way.
The key elements of an integrated approach to policy-making would include:
■ R&D support – direct and indirect, to accelerate innovation in low-carbon materials, processes and technologies;
■ support to enable large scale demonstration of promising pre-commercial low carbon technologies;
■ carbon-pricing mechanisms – particularly those that ensure the efficient allocation of resources across the economy in order to (a) reduce GHG emissions, (b) stimulate energy efficiency and (c) encourage the development and deployment of low-carbon technologies, including renewables, nuclear and CCS;
■ targeted energy-efficiency measures – to overcome non-market barriers to the take-up of cost-effective actions to improve energy efficiency;
■ necessary infrastructure – to enable and support the decarbonisation of energy supply as well as consumption;
■ integrated planning processes, including climate objectives, to maximise the emissions-reduction potential from the built environment and the trend towards greater urbanisation;
■ a shift in cultural and behavioural norms – to speed up the adoption of low-carbon technologies and lifestyles;
■ wider economic and social policies – to manage the energy transition and the winners and losers it creates in the near term; and
■ international cooperation and action – to support the less developed countries onto a new and lower income-emissions trajectory.
The Paris Agreement provides a structure for developing such approaches as well as for reviewing national-level commitments, contributions and progress.
59

APPROACHES TO CREATING AN EFFECTIVE CARBON PRICE
Narrow
Implicit Carbon Price
(Regulation-based)
Explicit Carbon Price(Market-based)
Emissions Coverage Complete
Potential economicburden for the economy
Most effectiveLost opportunities
Economicallyinefficient
Performancestandards
Projectmechanism
Single-sectorcap-and-trade
Baseline-and-credit
Broad cap-and-trade
Economy-wide carbon tax
Energy mixtargets
61
insight into...
EXPLICIT AND IMPLICIT CARBON PRICINGFour clear approaches, varying in effectiveness, have emerged for governments to introduce an explicit carbon price.
Cap-and-trade (also referred to as an “emissions trading system” or ETS): A notional cap is placed over some or all of the economy. This limit is expressed in terms of allowances that the government issues to an emitter, who surrenders one allowance for each tonne of CO2 emitted. The allowances are transferable through trade and have a value determined by the market.
Carbon tax: The government imposes a fixed tax on CO2 emissions from specific sources in various parts of the economy. This could be offset by tax reductions in other areas.
Baseline-and-credit: The government establishes a baseline emission for each sector, typically on a unit-of-production basis, that is, tonnes of CO2 per tonne of product made. The participants earn tradable credits by operating their facilities at lower emissions intensity than the baseline – or they surrender credits if they exceed it.
Project mechanism: A project is developed, and emissions are compared with a baseline, which may represent best available technology or typical practice for a particular country. If the project emissions are lower than the baseline, credits are issued. These credits are tradable, and may be bought directly by governments, or used as compliance instruments in cap-and-trade systems in other jurisdictions.

AN ACCELERATED NET-ZERO EMISSIONS SCENARIO
5

5. AN ACCELERATED NET-ZERO EMISSIONS SCENARIO
Challenges to economic growth – and opportunities for AsiaThe present period of relatively modest global economic growth and related energy demand, combined with the expansion in new material oil and gas supplies from North American shale, stresses the finances of countries dependent on oil revenue to fulfil their social contract, leading to varied political responses and in some cases unrest disrupting supply. The impact of such turbulence creates new uncertainties about security of supply. This situation sustains global investments in a relentless efficiency drive and alternative energy deployment, as countries do what they can to ensure their energy security.
Economic growth in Asia continues, but slows when it reaches the level of middle-income development at which additional financial, legal and industrial reforms are necessary to sustain progress. The associated slower growth in global energy demand allows the deployment of new technology to catch up and prevents coal being the de-facto energy source for development.
This slowdown also creates opportunities in China, where the concern of the urban middle classes over local environmental pollution is already pushing the government to act. Old, inefficient, coal-fired facilities are increasingly replaced by highly efficient ones at a distance from cities, alongside long-distance transmission lines. But transporting electricity this way can be inefficient, and the large water footprint associated with using coal for power generation is problematic for water-stressed areas in China. So the government takes further steps, most notably accelerating the construction of additional nuclear, gas and renewable energy facilities, such that the use of coal peaks around 2020.
While the Asian middle classes are concerned about local environmental pollution, they are nevertheless eager to travel. Although many
aspire to drive cars, this aspiration is blunted by road congestion. Despite continued improvements to public transportation, in many cities there is only one way to satisfy the feeling of freedom by personal transport, and that is through scooters and motorbikes. The authorities tighten emission standards, promote electrification and design road space to favour these two-wheelers. Better spatial planning and significant reforms in city funding mechanisms reduce the incentives for urban sprawl, enabling more efficient infrastructure developments, often centred around a dual energy system of electricity and natural gas (later hydrogen). Tax-financed support encourages significant improvements in industry, transport and building efficiency.
Energy transition in the USIn the US, more people become aware of the costs of adaptation to climate change because of increased turbulent weather patterns and the impacts of ecological events on international (and hence national) security, trade and investment. Insurers become wary of the financial risks of such events, and this new awareness of risks impacts major business investment decisions. In addition, there is growing appreciation of the contribution that inexpensive and abundant natural gas is already making to domestic emissions reduction as it replaces coal in power generation. The administration is able to overcome legal challenges and build on the regulatory approach championed by the Environmental Protection Agency, which further accelerates the transition to natural gas, while also managing fugitive methane emissions.
The grounds of debate about addressing climate-change shift, with the East Coast states joining California and the West Coast states in taking the lead. These states increase their coordination with the Canadian Western Provinces, where CCS and carbon pricing initiatives had already begun around 2010.
While of course different details are possible, we have found it useful to explore what an optimistic pathway to a net-zero emissions world might look like in practice, realised on a timescale even more rapid than previously published Shell scenarios and consistent with internationally expressed aspirations for limiting climate pressures.
Achieving net-zero emissions will require a strongly supportive “macro” environment, along with urgent and coherent international, national and local policy and technology choices, as well as consumer choices, carbon pricing or taxation, and continuing rapid reductions in the costs of key technologies. Economic growth must be neither too fast, so that there is time for adjustment, nor too slow, choking funds for investment. There must be enough energy security so that policymakers and society don’t get distracted from efforts to reduce emissions by concerns over energy supplies, but not so much security in the form of energy over-supply that low prices would discourage investment in new technologies and efficiency.
The most important near-term step would be a transition away from coal burning at scale for power generation. A significant and rapid shift from coal to natural gas would not only reduce emissions quickly and significantly at low cost but would also buy further time while the manufacture and deployment of renewables technologies continues to grow at speed.
What follows is a scenario story, which takes the most optimistic features of our New Lens Scenarios Mountains and Oceans and combines them with individually plausible further shifts in policy, technology deployment, circumstances and events that might move the world onto a new, even lower-emission trajectory, leading to an early peak in CO2 emissions and resulting in net-zero emissions in the second half of the century as targeted in the Paris Agreement.
An accelerated net-zero scenario – beginning with ParisOur story starts in Paris. Although the initial Nationally Determined Contributions (NDCs) are inadequate to meet the aspiration of well below 2°C, the architecture of the Paris Agreement, with its flexibility, assessment and improvement cycles, proves robust over time. Beyond undertaking the more obvious and short-term decarbonisation actions in the first decade of its implementation, individual governments initiate some of the longer-term reforms that subsequently enable emissions reduction to be continued at pace beyond 2030. Public support for these steps increases substantially, partly because social media and the growing “internet of things” facilitate surprisingly quick shifts in social norms around personal consumption of energy services and the type of energy used for these services.
A US-China pivotIn this scenario, a US-China pivot and EU Commission support are instrumental for global change. The US and China leverage the Paris Agreement for an institutional framework that enables legislation for some variants of carbon pricing to be implemented domestically, delivering a politically powerful signal to other nations. By 2020, when the agreement fully enters into force, carbon-pricing policies are operating in the EU, China, parts of North America, Australia, New Zealand, several Latin American countries, South Africa and South Korea. Although a good start, this is not yet the equivalent of a global approach to deliver lasting change, which will take another decade to put in place.
65

Arguments highlighting the relatively modest additional costs versus the potential liabilities or longer-term benefits of taking action to decarbonise become mainstream. State-level actions gain momentum and enable significant emissions reductions in the US. Leading states adopt stringent fuel-economy standards, provide attractive terms for low-carbon power, and effectively prevent the licensing of new coal-fired stations without CCS while accelerating early decommissioning of older plants. Under this range of pressures, and with the experience of the early application of CCS in China and elsewhere, the dynamics within the US coal states also change, as do the interests of the centralised utility companies, which are increasingly squeezed. CCS is aggressively promoted as a national solution to maintaining the competitive advantage of the US through its endowment of inexpensive coal and gas.
A world of electricityBeginning in the 2020s, a new federal US green technology programme gathers momentum. While it is focused on IT and smart systems, the programme also competes with China on mass manufacturing of components and solar panels. At the high-tech end of manufacturing on items like machinery for renewables production, China also competes with Germany. This green technology race is intensified by a rising cost for carbon in evolving pricing systems, the threat of border tax adjustments and a moderate pick-up in global economic growth that stimulates rising energy prices. In this way, low-carbon innovation and technology become new drivers of economic growth and productivity.
By 2030, the cost of solar PV combined with daily storage from batteries directly competes with other forms of power generation in residential and service sectors. In some locations the total cost of solar and wind power, including storage, falls below the variable cost of some coal and gas power plants and hastens the decommissioning of older inefficient power plants. In turn, investors
who face the prospect of holding “stranded” capital in power generation successfully instigate market reform such that the best existing plant is kept as back-up, and a whole new capacity market emerges.
It is not all plain sailing for investors in wind and solar. The growing prevalence of rooftop solar PV and other forms of distributed power-generation, like small-scale wind, means that fewer consumers are left to cover transmission and grid costs. So utility-supplied electricity costs rise, creating an additional incentive to invest in distributed power and creating a “bubble”. This is not a viable long-term situation, and the energy security costs of “system back-up” when there is insufficient sun or wind to produce enough electricity eventually needs to be either socialised or charged back to renewable production.
The US chooses a market-based approach, and variable pricing is introduced, making wind and solar a “normal” business. But changes in the regulatory regime also strand older wind and solar facilities in economic terms. Nevertheless, this prompts widespread upgrading with more efficient wind and solar technologies that also solve most of the intermittency problems.
Developing nations are stimulated to move fasterThe fast pace of transformation in the US and China enables newly emerging economies to benefit earlier from the falling costs of technology and to potentially leapfrog more advanced economies in specific sectors. The Indian and other governments absorb lessons from the Chinese experience in grappling with growth, industrial restructuring and socio-environmental pressures. From an earlier stage of economic development, the value is recognised of both encouraging market-based resource pricing and of managing emissions, water stress, urban development and infrastructure efficiency. Coal remains an important source of primary energy in Indian development for the next
IN THE SECOND HALF OF THE CENTURY, WITH ECONOMIC ACTIVITY HELPING TO FULFIL THE ASPIRATIONS OF MOST OF THE WORLD’S POOREST PEOPLE AND WITH NET-ZERO EMISSIONS BECOMING A GLOBAL REALITY IN TIME TO LIMIT AVERAGE WARMING TO BELOW 2°C, THERE IS A BETTER LIFE FOR MANY AND A HEALTHY PLANET.

decade, but growth in coal emissions is moderated by the opening up of natural gas grids and the combination of low-cost distributed solar power supplemented with storage options or low-capital, gas-fired power stations to manage intermittency. As a result, Indian emissions flatten in the 2030s, a massive achievement given where India was on the development ladder in 2016. These developments are made possible by fundamental changes to electricity markets in India as obstacles and opposition to liberalisation are overcome.
The EU – a ring of cooperationIn Europe, Germany’s energy transition (Energiewende) has dramatically expanded renewable capacity, and in 2016 solar PV and wind supply stood at 30 GW each. Germany leads a European drive to large-scale energy-systems integration and deeper electrification of the economy. Intermittency issues are managed progressively over time, through a more integrated market design via public-private collaboration. Improvement in energy security is also enabled by a growing deployment of cost-effective heat and battery storage and, later, through the development of hydrogen energy storage, which is generated from electrolysis when wind and solar electricity production exceeds demand. These developments, which support hydrogen-fuelled and electric vehicles, lead to zero-emissions zones in the larger cities.
The southern countries focus mainly on solar, while the northern countries develop wind. The offshore wind parks of the UK, Belgium, the Netherlands, Germany and Denmark all become interconnected via an offshore ring to balance supply with demand between countries. This ring also allows a connection to hydro storage in Norway and Scotland. However, the real milestone is reached when an offshore hydrogen electrolysis system is built utilising the growing surplus electrons from those wind farms. Redundant oil and gas facilities are repurposed for hydrogen gas storage and transport. Using electrolysis, the
system is capable of producing more than 2 million barrels of oil equivalent a day of hydrogen, greatly enhancing energy security. Oil and gas imports continue to fall year after year as hydrogen paves the way for large-scale application in the EU’s transportation sector. The development of new technologies, logistics and processes proves to be an enormous economic boost.
The “easy” part of the EU energy transformation already shows results in the first couple of decades following Paris, when the focus is on efficiency and substitution on the supply side. The real challenge comes in sustaining the necessary efforts to undertake large transformations in physical infrastructure, such as switching from natural gas to electricity in industry and integrating solar PV and district heating in buildings. These efforts require large-scale government intervention in planning, financing and tax relief to upgrade facilities “street by street and building by building” in a decades-long programme. Before the end of the century, under pressure of large cities in pursuit of clean air, another revolution has occurred: all cars are fuelled by electricity or hydrogen fuel cells.
Efficiency and decarbonisation go hand-in-hand with electrification. EU electricity production more than doubles between now and the end of the century, an achievement that requires an immense build-out of electricity transmission lines and hydrogen pipelines. Because sectors can switch demand to electricity only after the power supply is secure and affordable, the anticipatory increase in capacity requires a new public-private collaboration in market redesign. This collaboration allows investors to recover their pre-investments over time, as well as to recover the costs for large-scale CCS in the power sector required to store CO2 from gas-fired back-up generation. It also paves the way for CCS on large quantities of biomass, which is needed for offsetting emissions elsewhere in the system.
Plausible Balance in an Emerging Net-Zero Emissions World
0
+20
+15
+10
+5
-5CO2 (G
t per
yea
r)
-10 -21
NETZERO=
+
–
+6.8-6.8
-15
-20 +3.5 re-emitted from biofuel
+10.7 re-emitted from bioconversion processes
negative emissions
remainingemissions
CO2 captured in 200 EJ biomass
CO2 equivalent of thefossil resources used
-5.7 embedded in materials
-1.8 in biomaterials
-5.9 CCS
CCS
Bio
mass
Coal
Oil
Gas
+19.4
Source: Shell analysis, “Colours of Energy, Essay Towards net-zero emissions. An outlook for a prosperous world.”
Meeting the goal of the Paris Agreement by balancing emissions from sources and removals by sinksThe diagram shows how the balance is met. The upper section of the diagram shows the emissions from fossil fuels. Most CO2 is either captured by CCS or embedded in materials produced by the chemicals industry; the remaining 6.8 Gt CO2 is emitted to the atmosphere. The lower part of the diagram shows the accounting from the biomass resource base with 6.8 Gt CO2 of net-negative emissions. The configuration of the energy system, across fossil energy and biomass, nets out to zero CO2 emissions.
69

While income per capita in the EU increases by a factor of three over this period, overall primary energy consumption remains mostly flat as a result of relentless efficiency drives across all sectors, especially in buildings, industry and passenger transport.
The share of oil and gas in the overall energy mix has fallen from 57% to around 15% and coal from 14% to around 7%, with much being used as chemicals feedstock. In this use, the fuel is not burnt and thus does not contribute to CO2 emissions. The non-fossil-fuel share is just under 80%, with wind and solar delivering a third of the EU’s primary energy. Well before the end of the century, the EU has built a digitally-enabled net-zero emissions energy system.
A better life with a healthy planetIn summary, the trajectory of global emissions is dramatically turned around in the next 20 years through a string of significant developments in key countries with attention across six critical areas – sector-specific market reforms (emissions, investments and cost-recovery); financial and insurance markets; efficient and integrated infrastructure (physical and IT); highly efficient end-use applications; clean and green
energy research, development and application; and both coherent domestic policy and international coordination. Older technologies are phased out. Countries throughout the world increasingly adopt leading standards and technologies in the power, construction, building, transport, industry, services, energy production and agriculture sectors. In the second half of the century, with economic activity helping to fulfil the aspirations of most of the world’s poorest people and with net-zero emissions becoming a global reality in time to limit average warming to below 2°C, there is a better life for many and a healthy planet.
WORLD CUMULATIVE CO2 EMISSIONS
Unconstrained
Scenario
2061–2100
2031–2060
2016–2030
1751–2015
Oceans Mountains MIT’s 2°C Pathway
8,000
7,000
6,000
5,000
4,000
3,000
2,000
1,000
0
Gt
CO2
Source: Shell analysis
CONCLUDING REMARKS
There is a tide in the affairs of men Which taken at the flood leads on to fortune; Omitted, all the voyage of their life Is bound in shallows and in miseries. On such a full sea are we now afloat, And we must take the current when it serves, Or lose our ventures.William Shakespeare, Julius Caesar
This supplement has attempted to describe some of the most important shifts and transformations in the energy system that will be required over coming decades to support a “better life with a healthy planet”, at least as we understand them. Our hope is that this work will help build insights and shared perspectives among businesses, national governments and civil society more broadly. A shared understanding would recognise the necessity not only to undertake the relatively simple near-term actions to start to decarbonise the global economy but also to begin now, in earnest, the deeper structural transformations required to sustain economic growth and decarbonisation in the longer term.
An aim of the scenario approach in strategic planning is to develop leaders who are better at seeing challenges, opportunities and patterns of behaviour that may differ from a conventional view of the world. They help us appreciate the most significant features and uncertainties in the future environment and recognise that there may be a breadth of possible outcomes to events that cannot be fully controlled, nor ignored, but may be influenced. We hope this work will help inform and inspire leaders to influence key developments constructively.
We are grateful to the many experts outside Shell with whom we have worked to reach this understanding. Specific pieces by a number of these experts can be found in the online version of this document.17 We have also drawn on the talents of the many specialists inside our company, particularly our technical, economic, social-political and energy modelling teams.
71

insight into...
ECONOMIC GROWTH AND ENERGYA PERSPECTIVE FROM INDIA
AS COUNTRIES GROW AND HOUSEHOLDS BECOME BETTER OFF, THEIR NEEDS, WANTS, AND TASTES EVOLVE. THE HABITATION OF MANY YOUNG INDIANS IS CHANGING FROM A RURAL TO AN URBAN ONE, EITHER BECAUSE THEY ARE MOVING FROM THE COUNTRYSIDE TO CITIES, OR BECAUSE THEIR VILLAGES ARE BECOMING TOWNS. THIS ECONOMIC AND SOCIAL TRANSFORMATION, IN TURN, IS DRIVING AN EXPANSION IN OVERALL DEMAND FOR ENERGY AS WELL AS CHANGES IN THE MIX OF FUELS DEMANDED AND HOW THESE FUELS ARE USED.
This economic and social transformation, in turn, is driving an expansion in overall demand for energy as well as changes in the mix of fuels demanded and how these fuels are used.
At Shell’s request1, the Indian organisation ‘Integrated Research and Action for Development’ (IRADe) modelled how this process may unfold over time in India, using its proprietary integrated assessment model (IRADe-IAM)2, which provides insight on the drivers of energy demand over the forty-year horizon, 2010-2050. Over this period, India’s population is projected to increase by a third, from 1.2 billion to 1.6 billion. Real per capita GDP3 is expected to increase more than ten-fold, to reach roughly the levels of Western
Europe today. Real output, accordingly, is estimated to increase fifteen-fold, representing an average compound growth rate of 7% per year over the whole period.
This growth is made possible by abundant labour and rising labour productivity as an expanding work force moves out of agriculture into manufacturing and services. A favourable demographic structure also provides the savings needed to sustain high investment rates with only limited recourse to net foreign capital. In brief, the model expects that India will follow the path blazed by other labour-abundant but energy-constrained Asian peers, such as South Korea. This implicitly assumes that the international economic and political environment remains as supportive for global engagement in the next half-century as it has been since the end of the Second World War.
One of key insights of this work is the projected growth in energy demand, which rises from 360 kilograms of oil equivalent (kgoe) in 2010 to approximately 2550 kgoe per capita in 2050. That equates to a rise in energy use per person from around 15 GJ to just over 100 GJ per capita a year by 2050, consistent with our approximation of future average global energy demand per person in a net-zero emission world.
73
Economic Growth and Energy Sources:
1 Shell sponsored IRADe to do this work. The study was conducted by Kirit Parikh, Probal Ghosh, and Jyoti Parikh. IRADe model’s explorations of Indian energy demand are independent of and do not necessarily reflect assumptions made by Shell in its own world energy model. These views and conclusions do not necessarily reflect those of Shell.
2 These models are commonly used to understand the prospects for greenhouse gas emissions over long periods of time. 3 Measured at purchasing-power parity (USD PPP) exchange rates of 2007-08.
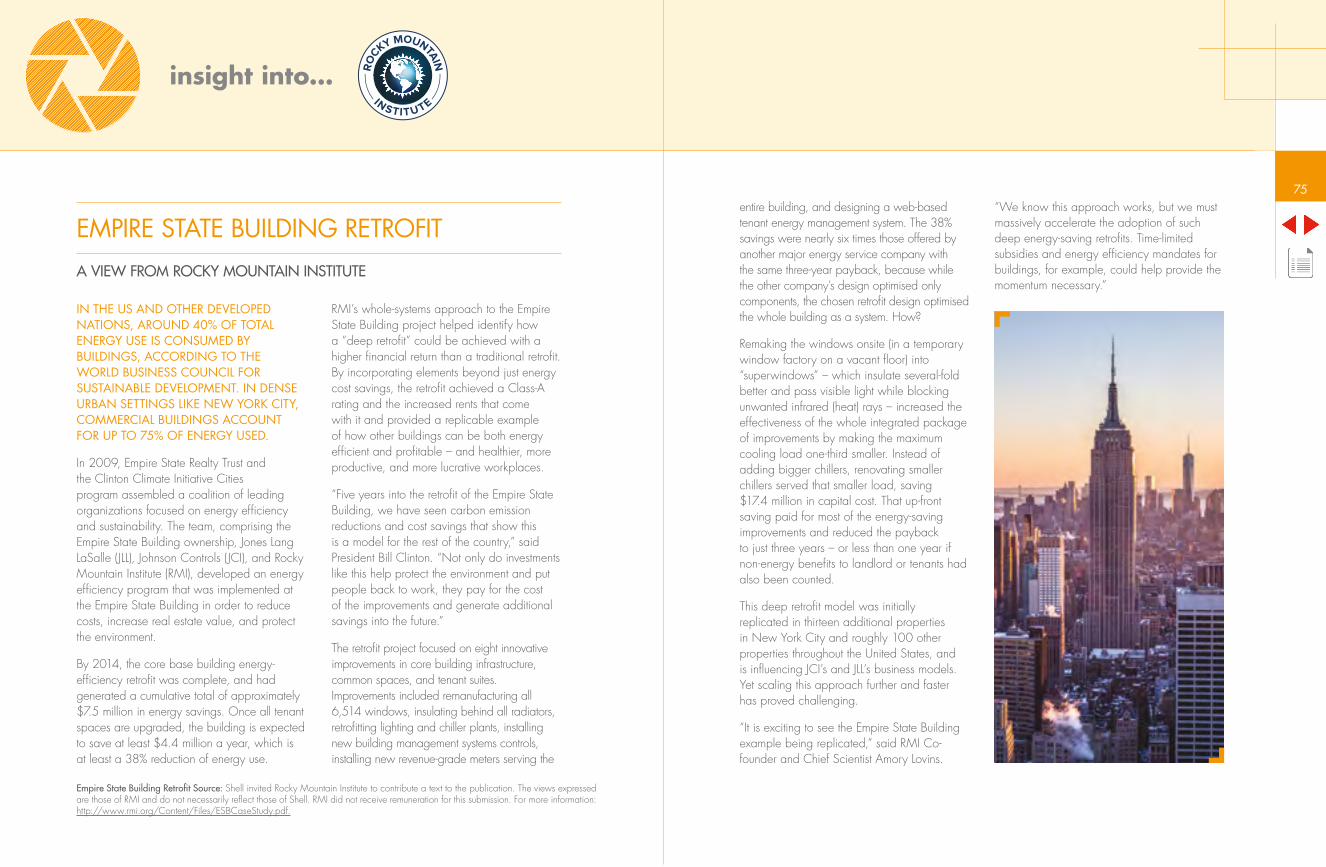
insight into...
EMPIRE STATE BUILDING RETROFIT A VIEW FROM ROCKY MOUNTAIN INSTITUTE
IN THE US AND OTHER DEVELOPED NATIONS, AROUND 40% OF TOTAL ENERGY USE IS CONSUMED BY BUILDINGS, ACCORDING TO THE WORLD BUSINESS COUNCIL FOR SUSTAINABLE DEVELOPMENT. IN DENSE URBAN SETTINGS LIKE NEW YORK CITY, COMMERCIAL BUILDINGS ACCOUNT FOR UP TO 75% OF ENERGY USED.
In 2009, Empire State Realty Trust and the Clinton Climate Initiative Cities program assembled a coalition of leading organizations focused on energy efficiency and sustainability. The team, comprising the Empire State Building ownership, Jones Lang LaSalle (JLL), Johnson Controls (JCI), and Rocky Mountain Institute (RMI), developed an energy efficiency program that was implemented at the Empire State Building in order to reduce costs, increase real estate value, and protect the environment.
By 2014, the core base building energy-efficiency retrofit was complete, and had generated a cumulative total of approximately $7.5 million in energy savings. Once all tenant spaces are upgraded, the building is expected to save at least $4.4 million a year, which is at least a 38% reduction of energy use.
RMI’s whole-systems approach to the Empire State Building project helped identify how a “deep retrofit” could be achieved with a higher financial return than a traditional retrofit. By incorporating elements beyond just energy cost savings, the retrofit achieved a Class-A rating and the increased rents that come with it and provided a replicable example of how other buildings can be both energy efficient and profitable – and healthier, more productive, and more lucrative workplaces.
“Five years into the retrofit of the Empire State Building, we have seen carbon emission reductions and cost savings that show this is a model for the rest of the country,” said President Bill Clinton. “Not only do investments like this help protect the environment and put people back to work, they pay for the cost of the improvements and generate additional savings into the future.”
The retrofit project focused on eight innovative improvements in core building infrastructure, common spaces, and tenant suites. Improvements included remanufacturing all 6,514 windows, insulating behind all radiators, retrofitting lighting and chiller plants, installing new building management systems controls, installing new revenue-grade meters serving the
Empire State Building Retrofit Source: Shell invited Rocky Mountain Institute to contribute a text to the publication. The views expressed are those of RMI and do not necessarily reflect those of Shell. RMI did not receive remuneration for this submission. For more information: http://www.rmi.org/Content/Files/ESBCaseStudy.pdf.
RO
C
KY MOUNTAIN
INSTIT UTE
75entire building, and designing a web-based tenant energy management system. The 38% savings were nearly six times those offered by another major energy service company with the same three-year payback, because while the other company’s design optimised only components, the chosen retrofit design optimised the whole building as a system. How?
Remaking the windows onsite (in a temporary window factory on a vacant floor) into “superwindows” – which insulate several-fold better and pass visible light while blocking unwanted infrared (heat) rays – increased the effectiveness of the whole integrated package of improvements by making the maximum cooling load one-third smaller. Instead of adding bigger chillers, renovating smaller chillers served that smaller load, saving $17.4 million in capital cost. That up-front saving paid for most of the energy-saving improvements and reduced the payback to just three years – or less than one year if non-energy benefits to landlord or tenants had also been counted.
This deep retrofit model was initially replicated in thirteen additional properties in New York City and roughly 100 other properties throughout the United States, and is influencing JCI’s and JLL’s business models. Yet scaling this approach further and faster has proved challenging.
“It is exciting to see the Empire State Building example being replicated,” said RMI Co-founder and Chief Scientist Amory Lovins.
“We know this approach works, but we must massively accelerate the adoption of such deep energy-saving retrofits. Time-limited subsidies and energy efficiency mandates for buildings, for example, could help provide the momentum necessary.”

HISTORICAL CONTRAST: ENERGY EFFICIENCY (OCEANS)
insight into...
THE MATERIAL DEMAND CONUNDRUM
IT IS COMMON TO BELIEVE THAT TECHNOLOGY REVOLUTIONS – OR AT LEAST MAJOR EVOLUTIONS – USHER IN MORE EFFICIENT USE OF MATERIALS AND ENERGY OVER TIME. OUR WORK ON HISTORICAL EFFICIENCY IMPROVEMENTS CERTAINLY INDICATES WE CAN EXPECT DRAMATIC IMPROVEMENTS IN THE ENERGY REQUIRED TO PRODUCE THE MOST IMPORTANT OF THEM IN FUTURE
Yet building out the necessary infrastructure to deploy a new technology at mass scale can offset some or all of the gains. For example, the emergence of digital devices like e-readers, smartphones, and tablets means that each of us can consume our preferred media – books, newspapers, films, music
In these sectors, efficiency has doubled over the last 50 years and could double again, or better, over the next 50 years.
1960 2010 2060
– without buying them as physical products made of plastic, paper, film, etc. However, demand is growing for the materials required to build components for electronic devices – plastics, metals, sapphire glass screens, batteries, chargers – not to mention the data storage facilities, fibre optic data cables, and signal broadcast equipment necessary to keep us all “connected” 24/7.
According to recent research, there are likely to be 20 billion connected devices on the planet by 20201. Some of this additional demand and the energy and carbon requirements it generates can be offset by much more systematic and efficient recycling of materials.
The Material Demand Conundrum Source: 1 http://www.gartner.com/newsroom/id/3165317
To make 1 tonne of steel, enough to build one car:
To travel 350km your car uses:
Your fridge uses in 1 year:
Lighting uses:
0% 100%
25GJ
2GJ
3GJ
0.8GJ
0% 100%
13GJ
1GJ
1GJ
0.4GJ
0% 100%
6GJ
0.5GJ
0.3GJ
0.04GJ
77
insight into...
TRANSFORMING PERSONAL MOBILITY IN US CITIES A VIEW FROM ROCKY MOUNTAIN INSTITUTE
THE WAY WE TRANSPORT OURSELVES IS ON THE VERGE OF A MAJOR CHANGE, ESPECIALLY FOR THOSE OF US WHO LIVE IN CITIES. THIS CHANGE WILL SIGNIFICANTLY AFFECT TRANSPORTATION FUEL DEMAND AND EMISSIONS, AND NOT A MOMENT TOO SOON – PRIVATELY OWNED VEHICLES PRODUCE 15% OF CO2 EMISSIONS IN THE US AND 10% GLOBALLY. THE INEFFICIENCY OF PRIVATE CARS – WHICH SIT UNUSED AN AVERAGE OF 95% OF THEIR LIVES – IS GIVING WAY TO A NEW MOBILITY FUTURE.
The mobility vision Rocky Mountain Institute (RMI) works to achieve is of electric (and eventually autonomous) vehicles operating within transit-friendly, walkable, and bikeable cities to deliver mobility as a service and as part of an intelligent, interoperable transit system. Vehicles operating when and where they are needed mean fewer vehicles to do the same job at lower cost, while intelligent, connected vehicles (and in due course autonomous vehicles) reduce costs further.
The US passenger transport fleet costs its owners $1.2 trillion per year, and costs society twice that again for lost productivity,
medical costs associated with accidents, and for the building and maintaining of overburdened roads and of parking (there are more than four spaces for every car). Initiatives now taking shape in many US cities could save as much as 80% of that cost and prevent the bulk of transport-related deaths and injuries, while decreasing carbon emissions by one gigaton per year.
Guided by this vision, RMI has joined with the city governments and academic and business communities in two US cities – Austin, Texas and Denver, Colorado – to plan five major changes.
First, interoperable transit data will be shared among transit modes from buses, light rail, and road networks to smartphone apps in a bicyclist’s pocket. These data will allow seamless, just-in-time interconnection between transit modes.
Second, citizens, beginning with commuters, will rely on mobility as a service (MaaS) to transport them when they need it. Small companies will collaborate to offer such services at scale to their employees.
Third, electric vehicles (EVs) will be ubiquitous, better supported, and more useful as large
RO
C
KY MOUNTAIN
INSTIT UTE

high-mileage vehicle fleets electrify and EVs are integrated into the electric grid, both with widespread charging and through the use of their batteries to provide ancillary services to the electric system while connected.
Fourth, autonomous vehicles (AVs) will be welcomed into the cities with enabling legislation and other groundwork so that AV pilots, already underway from California to Michigan, can begin and scale up. Eventually, AVs are expected to predominate in urban cores. Studies suggest that AVs share data and avoid collisions so adroitly that congestion and – most crucially – most accidents should disappear. This last effect will not just save lives; it will reduce the need for expensive insurance and allow for vehicle light-weighting.
And fifth, on-going urban development will bring together the places where people live, work, and play so that cross-town travel is less frequent, and will connect people to alternative transportation modes, so that travel is safer, greener, and less wasteful.
More than 75 other US cities have similar initiatives underway. Nearly 80 mid-sized US cities are currently competing for a $50
million public/private grant to be awarded by the Department of Transportation to connect transportation assets in a low-carbon, interactive network. This Smart City Challenge will help integrate AVs and EVs into already data-driven and forward-looking transportation systems across the country.
And the US is far from alone. China is rapidly scaling up its EV fleet with hefty subsidies and widespread charging infrastructure. The country aims to have 5 million EVs on the road by 2020 and will spend more than $15 billion to do it. Certain European countries are even farther ahead. EVs exceed 1% of the vehicle fleet in three countries other than the US, all in Northern Europe: Sweden, the Netherlands, and Norway, where nearly one in four new vehicles sold is an EV.
The Netherlands has had small-scale, permanently car-free city centres since 1965, when Utrecht made the leap. Now others, including Paris, Madrid, and Milan, are planning to follow suit. One of the leaders is Oslo, Norway, which is putting in place a well-planned public-transit and bicycle infrastructure in preparation for banning cars from the city centre starting in 2019.
insight into... RO
C
KY MOUNTAIN
INSTIT UTE
CONTINUED
TRANSFORMING PERSONAL MOBILITY IN US CITIES A VIEW FROM ROCKY MOUNTAIN INSTITUTE
Transforming Personal Mobility in US Cities Source: Shell invited Rocky Mountain Institute to contribute a text to the publication. The views expressed are those of RMI and do not necessarily reflect those of Shell. RMI did not receive remuneration for this submission.
79
The most exciting leader is Helsinki, Finland. The Finnish capital is aggressively piloting a comprehensive MaaS system to replace private cars. Over the next five years, people in Helsinki will purchase a ticket from point A to point B, without regard to the means of travel. They might travel by a shared bike, a car-sharing service, train, bus, and then another shared bike. This transport-on-demand model, made possible by the intelligent interconnectedness of transport modes, will be cheaper for the city and for its users and will be able to accommodate a car-free city centre and AVs as part of the mix.
The mobility transformation is happening fast, and it is accelerating. Current technology makes it possible for the transportation
industry to save about $1 trillion per year while becoming safer, easier to use, more accessible, and less carbon intensive. These incentives are driving widespread – if not yet widely visible – development. The US government has already recognized AVs as meeting the legal definition of a driver for the purposes of regulation.
A sea change in how we travel is under way, from using personally owned, individually driven, gasoline¬-powered, steel-dominated vehicles to using shared, electric, autonomous, lightweight, service vehicles. We have a rare opportunity to reduce congestion, decrease costs, enhance safety, reduce emissions, and ensure greater and more sustainable prosperity for all.

insight into...
ENERGY EFFICIENCY IN BUILDINGS A COMPREHENSIVE APPROACH FROM THE WORLD BUSINESS COUNCIL FOR SUSTAINABLE DEVELOPMENT
Target Group Area of Action Category DescriptionPolicy makers and energy regulators
Control and regulatory instruments
Building energy codes
Mandatory codes for new and existing buildings, tightening over time, with a longer-term focus on zero-net energy use for certain building categories.
Appliance standards Standards that tighten over time, following best practice, such as Top-Runner in Japan.
Labelling Common energy labelling adopted as widely as possible.
Energy audits Focus on energy audits for commercial buildings as part of existing Health, Safety and Environment (HSE) requirements. Domestic building transactions (home sales) backed by a recent energy audit.
Metering Individual metering with smart meters.
Urban planning Best practices identified and promoted, including a shift towards densely populated, resource-efficient urban layouts and infrastructure.
Fiscal incentives, e.g. capital grants and subsidies
A range of measures to support first-of-a-kind developments, net-zero energy homes, and best available technologies deployment.
Investors Education and training Public bodies and private associations established to disseminate best practice information.
Asset portfolio management
Evaluation Energy audits, benchmarks, energy efficiency goals.efficiency goals.
Developers Education and training Best practices publicly shared through associations and industry groups.
Specifications Ambitious energy performance targets set as a primary design goal.
Procurement Supply chains managed with a focus on energy.
Occupiers Information Energy performance information readily available.
Energy awareness developed through transparent billing and smart meters.
81
insight into...
TECHNOLOGICAL REVOLUTIONS AND POLITICAL CHOICES A VIEW FROM PROFESSOR CARLOTA PEREZ
SINCE THE INDUSTRIAL REVOLUTION, EACH SUBSEQUENT TECHNOLOGICAL REVOLUTION HAS GONE THROUGH TWO DIFFERENT PERIODS.
The first is installation, when unfettered markets in a financial frenzy set up a huge market experiment to define the products and the companies that will be the winners for the future; when the new infrastructures (canals, railways and telegraph, ports and steamships, highways and electricity or internet) are installed; and when the new paradigm is learned and adopted by companies and people. It is a time of ‘creative destruction’ as the Austrian economist Joseph Schumpeter rightly defined it. But the process often leads to a major bubble or two and can end in a huge financial crash. The recessions that follow reveal how much ‘destruction’ had gone on under the shine of the boom, including how much inequality resulted from the success of the relatively few involved in the bubble prosperity.
It is by coming out of those recessions that past periods of golden age prosperities have been unleashed – bringing the second period of each technological revolution. They require government involvement to tilt the
playing field in a direction that will reduce the risk for all and increase profitability through generating synergies in common suppliers, skills, knowledge, and consumer requirements. This is possible because each of the installed revolutions provides an enormous potential for transforming the whole economy and changing lifestyles in many possible directions.

insight into...
For example, the mass production revolution of the 20th century was shaped very differently by Nazi Germany, the Soviet Union, and the Western democracies. The latter provided clear directions for innovation to serve suburbanisation, European reconstruction, and the Cold War. What became the all-electric home with multiple appliances for cooking, freezing, and entertainment, with innumerable plastic objects, often meant for disposability, and a car at the door gave a clear direction for innovation and a well-defined shape to demand.
Yet this was not achieved by markets alone but by a favourable context for markets to act. In the US and Europe, for example, that context included the welfare state, the consumer society, unemployment insurance (for uninterrupted payment of consumer credit), pensions (to safely spend monthly incomes without worrying about old age), and a progressive tax system able to fund the welfare state, the Cold War, massive state employment, education and health services, roads, and so on. And, while the income of public servants went into increasing demand, the publicly provided services freed income for consumption.
The world is now in a similar historical moment requiring equally bold and systemic institutional and policy changes to harness the true potential offered by the digital and IT revolution of the last two decades and to give a direction to innovation. It is not to be any direction but one that has roots in the nature of the new technologies and in the problems inherited from the old ones. That direction is “green growth,” widely understood as increasing the proportion of services and intangibles in GDP, world trade, and in lifestyles. Green growth involves reducing the amount of materials and energy in tangible products, decreasing or eliminating waste through reuse and recycling in the circular economy, making products really durable while moving to rental and maintenance, including 3D printing of parts for upgrading, and changing the ideal of a good life to one that involves fewer material goods, with an emphasis on exercise, creativity, preventive health care, unprocessed food (preferably grown nearby), community, communications activities, computer or smart phone-based music, films, books, education through a combination of online courses and face-to-face interactions, experiential entertainment, and so forth. All this requires a massive shift
CONTINUED
TECHNOLOGICAL REVOLUTIONS AND POLITICAL CHOICES A VIEW FROM PROFESSOR CARLOTA PEREZ
Technological Revolutions and Political Choices Sources: Professor Carlota Perez is author of “Technological Revolutions and financial Capital: the Dynamics of Bubbles and Golden Ages”. Shell invited Professor Perez to contribute some thoughts on the economic and environmental transition and paid an honorarium for her time. The views expressed are those of Professor Perez and do not necessarily reflect those of Shell.
83to policies of indirect energy conservation, contributing to reduce carbon emissions. Most importantly, it makes it possible for the people of the whole world to aspire to a good life that is viable on our single planet.
In addition to this change in consumer behaviour, many profound changes also have to take place in manufacturing, power generation, land use, and other aspects of production in order to make the best of the IT revolution. In the current playing field, such a transformation cannot be achieved by markets alone. The field has to be tilted by state action, and this time also at the global level.
Fortunately the transition to green growth has already begun to happen. The upper and educated layers of the population – together with many of the young –are adopting the ICT-intensive mode of living, together with health, exercise, adventure and concerts rather than purchasing commodities as entertainment. Imitation will follow as has happened historically – but it may not happen quickly or at an equal rate everywhere.
Each technological revolution provides a new space of the possible that is then shaped by socio-political choice in the deployment period. That is the choice the world has ahead now. We can continue to a “gilded age” with financial markets and the military shaping the playing field, and with growing inequality and environmental degradation for the new millions who will inhabit our planet. Or we can create policies that
encourage green growth, bringing social and environmental sustainability across the world with a rising standard of living even for the poorest. It is a task equivalent to what the welfare state and the new international institutions (World Bank, IMF, etc.) did for the post-war boom in the advanced countries of the West. It will require an equivalent amount of imagination and a huge dose of bold, collaborative political and business leadership.
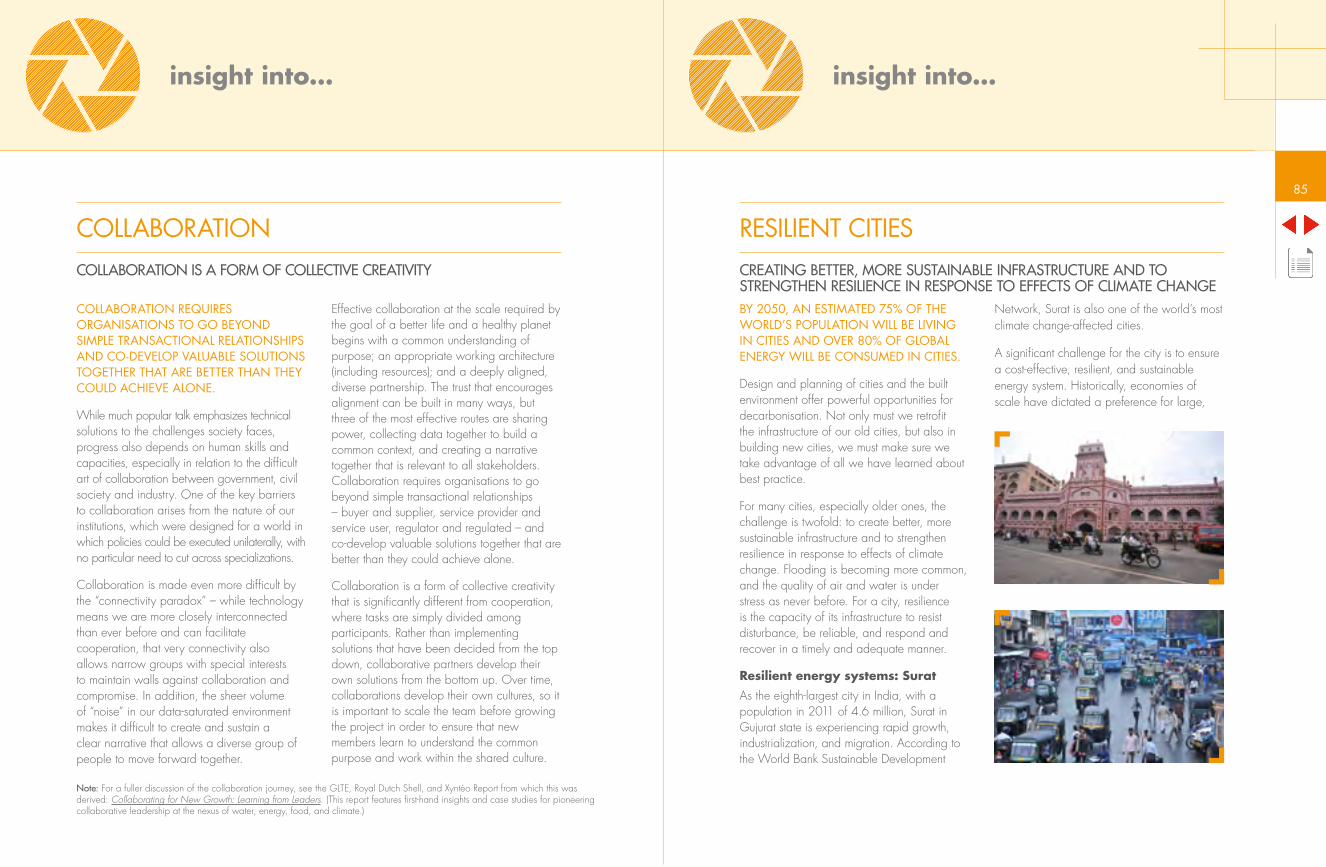
insight into...
Note: For a fuller discussion of the collaboration journey, see the GLTE, Royal Dutch Shell, and Xyntéo Report from which this was derived: Collaborating for New Growth: Learning from Leaders. (This report features first-hand insights and case studies for pioneering collaborative leadership at the nexus of water, energy, food, and climate.)
COLLABORATIONCOLLABORATION IS A FORM OF COLLECTIVE CREATIVITY
COLLABORATION REQUIRES ORGANISATIONS TO GO BEYOND SIMPLE TRANSACTIONAL RELATIONSHIPS AND CO-DEVELOP VALUABLE SOLUTIONS TOGETHER THAT ARE BETTER THAN THEY COULD ACHIEVE ALONE.
While much popular talk emphasizes technical solutions to the challenges society faces, progress also depends on human skills and capacities, especially in relation to the difficult art of collaboration between government, civil society and industry. One of the key barriers to collaboration arises from the nature of our institutions, which were designed for a world in which policies could be executed unilaterally, with no particular need to cut across specializations.
Collaboration is made even more difficult by the “connectivity paradox” – while technology means we are more closely interconnected than ever before and can facilitate cooperation, that very connectivity also allows narrow groups with special interests to maintain walls against collaboration and compromise. In addition, the sheer volume of “noise” in our data-saturated environment makes it difficult to create and sustain a clear narrative that allows a diverse group of people to move forward together.
Effective collaboration at the scale required by the goal of a better life and a healthy planet begins with a common understanding of purpose; an appropriate working architecture (including resources); and a deeply aligned, diverse partnership. The trust that encourages alignment can be built in many ways, but three of the most effective routes are sharing power, collecting data together to build a common context, and creating a narrative together that is relevant to all stakeholders. Collaboration requires organisations to go beyond simple transactional relationships – buyer and supplier, service provider and service user, regulator and regulated – and co-develop valuable solutions together that are better than they could achieve alone.
Collaboration is a form of collective creativity that is significantly different from cooperation, where tasks are simply divided among participants. Rather than implementing solutions that have been decided from the top down, collaborative partners develop their own solutions from the bottom up. Over time, collaborations develop their own cultures, so it is important to scale the team before growing the project in order to ensure that new members learn to understand the common purpose and work within the shared culture.
85
insight into...
RESILIENT CITIESCREATING BETTER, MORE SUSTAINABLE INFRASTRUCTURE AND TO STRENGTHEN RESILIENCE IN RESPONSE TO EFFECTS OF CLIMATE CHANGEBY 2050, AN ESTIMATED 75% OF THE WORLD’S POPULATION WILL BE LIVING IN CITIES AND OVER 80% OF GLOBAL ENERGY WILL BE CONSUMED IN CITIES.
Design and planning of cities and the built environment offer powerful opportunities for decarbonisation. Not only must we retrofit the infrastructure of our old cities, but also in building new cities, we must make sure we take advantage of all we have learned about best practice.
For many cities, especially older ones, the challenge is twofold: to create better, more sustainable infrastructure and to strengthen resilience in response to effects of climate change. Flooding is becoming more common, and the quality of air and water is under stress as never before. For a city, resilience is the capacity of its infrastructure to resist disturbance, be reliable, and respond and recover in a timely and adequate manner.
Resilient energy systems: SuratAs the eighth-largest city in India, with a population in 2011 of 4.6 million, Surat in Gujurat state is experiencing rapid growth, industrialization, and migration. According to the World Bank Sustainable Development
Network, Surat is also one of the world’s most climate change-affected cities.
A significant challenge for the city is to ensure a cost-effective, resilient, and sustainable energy system. Historically, economies of scale have dictated a preference for large,

insight into...
CONTINUED
RESILIENT CITIES CREATING BETTER, MORE SUSTAINABLE INFRASTRUCTURE AND TO STRENGTHEN RESILIENCE IN RESPONSE TO EFFECTS OF CLIMATE CHANGE
centralised power plants in most places in the world, including India. To supply electricity to the city there is a network of high-voltage transmission and low-voltage distribution lines. Though this arrangement is efficient, it has resilience weaknesses with little redundancy in the system, so that if an individually significant part of the network is taken out of action, power failures can occur in a wide-ranging area and be expensive and difficult to recover from. In a city such as Surat, which can face extreme weather events and environmental stresses, this is a problem.
Shell has worked with the Surat municipal authorities and other local groups – including representatives of local businesses – to explore future possible options in response to these challenges. One option is the use of micro-grids for the production and distribution of clean, reliable energy. A “micro-grid” is a small-scale grid with various distributed energy technologies – such as solar panels, small-scale wind, biomass boilers, plug-in electric cars, and back-up generators. The grid could connect renewable energy sources with the wider, large-scale utility grid so that it can dynamically deal with supply and demand while efficiently and cost-effectively managing and improving the fuel mix of the system.
Such a grid could not only improve local air quality if it displaced unabated fossil-fuel use, but it would also take full advantage of renewable resources of solar energy while ensuring dependable energy supplies to protect the energy-intensive industries, such as textile production and diamond processing on which the city’s economy depends.
Solutions for flooding: Marikina CityMarikina City (a part of Metro Manila in the Philippines) is another city experiencing resilience challenges. Shell has partnered with city officials and other local stakeholders in a three-step co-creation process: 1) understand the city; 2) identify key constraints, concerns, and aspirations; 3) collaborate, using both global expertise and local knowledge.
The initiative identified five major challenges common to many cities around the globe:
1. Affordable and dependable electricity
2. Road and public transport infrastructure
3. Waste management
4. Flood management
5. Governance and co-ordination of information
Resilient Cities Sources: City Resilience Study: Challenges and Opportunities for Surat City and Challenges and Opportunities for Marikina City. For more information please visit http://www.shell.com/energy-and-innovation/the-energy-future/future-cities.html
87
The project group discovered not only that the five challenges were interconnected, but also that one solution could form an integrated response to tackle multiple problems. In response to the perennial threat of flooding, for example – which has led to electricity blackouts – cost-effective incorporation of “green infrastructure” (the use of natural features and materials to reduce flood risk) could strengthen resilience, improve quality of life, and encourage coordinated urban planning.
Building resilience through green infrastructure in Marikina City would include restoration and enhancement of riverbanks, levee systems, and spillways, and the development of open green recreation spaces that can assist in absorbing heavy rains and tropical storms. Upgraded evacuation routes, increased
bikeway networks, and public transport could improve access to these “active” green spaces. If connections were made to Marikina City’s restaurant districts, then enhancing resilience in relation to flooding could also result in a unique area that would attract residents, visitors, and tourists. Rooftop and vertical gardening, and planting of trees on walkways and roadways could also be considered.
While some cost would be associated with maintenance of these green spaces, this cost is significantly less than that of other, more heavily engineered potential solutions. Results in other locations have shown that, when implemented correctly, high-performing green spaces provide real economic, ecological, and social benefits.

insight into...
CLIMATE CHANGE ATTITUDES A VIEW FROM PROFESSOR CHRIS RAPLEY
KEY TO THE SUCCESS OF ZERO-CARBON-EMISSIONS INITIATIVES WORLDWIDE WILL BE THE SUPPORT OF THE GENERAL PUBLIC.
However, opinion polls suggest that while citizens do recognize that the threat of climate change is a serious challenge and want action to be taken, they commonly place the issue low on their list of immediate priorities. In some nations, “climate denial” is rife.
What explains this inconsistency? At root it appears the people don’t yet fully appreciate the nature, scale, and urgency of the challenge. Yet without public “permissions,” the ability to take the radical actions necessary across the economy to decarbonize will be compromised.
Climate science has revealed the need for action and is essential for illuminating the way forward. Climate scientists remain the primary source of knowledge and information, not least because the evidence requires expertise to deliver with authority. But whilst scientists are generally well-trusted, their established method of communication, based on the assumption that a disconnected, or even hostile, public is simply caused by a lack of information – the “information deficit”
model – is not well suited to the task. This is especially so since the messages delivered raise feelings of anxiety, guilt, loss, and helplessness as well as challenging strongly held values and beliefs and raising powerful issues of identity. Traditional approaches to training scientists leave them ill-equipped
Climate Change Attitudes Sources: Chris Rapley is Professor of Climate Science at University College London and author with the playwright Duncan Macmillan of “2071 – The World We’ll Leave Our Grandchildren.” Shell invited Professor Rapley to contribute a text to this publication and paid an honorarium for his time. The views expressed are those of Professor Rapley and do not necessarily reflect those of Shell.
89to deal with the backlash that results. Additionally, on a topic that has become highly politically and ideologically polarized, scientists find themselves at a disadvantage when confronted by opponents who use facts selectively and engage in rhetoric, unconstrained by the practices and norms of reasoned and balanced academic discussion.
New approaches are needed. These include the use of narrative, the ability to step aside from the formalities and engage as an “expert citizen” who expresses views and feelings, the use of dialogue rather than debate, and the development of the skills to handle the rough and tumble of discussion in the public square.
Increasingly, climate scientists are seeking new ways to engage with the public, working, for example, with artists, writers,
psychologists, and faith communities, as well as through traditional and electronic media. Examples include the London Science Museum’s “atmosphere” climate science gallery, which has received nearly four million visitors, and the play, “2071 – The World We’ll Leave Our Grandchildren,” performed to critical acclaim at the Royal Court Theatre in London’s West End.
These and other novel interventions can be seen as a growing movement by academics to develop a “Mission Conversation” to raise the profile of climate change as a pre-eminent contemporary topic. The objective is to allow the public an informed and constructive role in a meaningful public discourse. We all need to be part of the answer to the question, “What kind of future do we want to create?”

insight into...
HUMAN BEHAVIOURSINDIVIDUALS SHAPE THE DEMAND FOR ENERGY THROUGH THE PRODUCTS AND SERVICES THEY CONSUME
As global society searches for solutions to the energy and climate challenge, individuals, too, wish to play a constructive role. A net-zero emissions future requires extraordinary moderation in the growth of energy demand at a global level. The largest proportion of change will have to be delivered through the changes that are often unnoticed and unseen at the level of the individual – industrial-process innovation, smart urban planning, and mandates and regulations to spur efficiency improvements in cars and products.
Nevertheless, because individuals shape the demand for energy through the products and services they consume, they do have an important role to play in achieving net-zero emissions. Some of the approaches to lowering
energy use are familiar – ride-sharing, cycling, more use of public transportation, conservation practices, telecommuting, LED lighting, rooftop solar panels, the choice of more fuel-efficient cars, and more energy-efficient appliances.
Other approaches may emerge from shifts in values and lifestyles. In some developed countries, the aspiration for car ownership has fallen among younger generations, while
Human Behaviours Source:1 Rick Tetzeli, “Lyft to Uber: The Race is On,” Fast Company 16 March 2016.
http://www.fastcompany.com/3057421/lyft-to-uber-the-race-is-on
“OUR CUSTOMERS ARE DEMONSTRATING TO US THROUGH THEIR ACTIONS THAT WHILE THEY STILL WANT THE CONVENIENCE OF A CAR, THEY DON’T WANT THE HASSLE OF OWNERSHIP, PARTICULARLY IN URBAN ENVIRONMENTS.”1
Daniel Ammann, President of General Motors
91
co-housing is becoming more common along with a migration away from the suburbs back to smaller apartments in city centres. This movement is partly the result of a growing emphasis on quality of life with a focus on convenience. The aging population in these countries is also contributing to the emphasis of services over goods.
In OECD countries, where energy use may already have peaked, and where the “use once, throw away” culture of consumption is the norm for many, unnecessary material waste may one day become as socially unacceptable as driving while drunk or other social behaviours that are now frowned upon or illegal.
In many other countries, the coming decades will see terrific growth in the energy and material consumption of individuals as they progress up the development ladder. In some countries, letting little go to waste is already a feature of individual behaviour, perhaps driven more by necessity than by environmental concern as yet. Here, too, the social mechanisms and business models may encourage individual “moderation” and help lower energy demand at the margin

FOOTNOTES
1. “Shell: Energy Transitions and Portfolio Resilience” report addresses Shell’s approach and portfolio resilience to the energy transition, and its strategy to succeed through changing times. The report describes the key drivers in the energy mix and sets out how Shell is investing in low-carbon energy – “new energies” – while reflecting on the wide range of business choice it can make until 2035, and beyond.For more information, please see: http://www.shell.com/investors/environmental-social-and-governance/environmental-and-social/sri-presentations.html
2. http://www.un.org/sustainabledevelopment/
3. The equivalent of 277 kilowatt hours of electricity.
4. See The Stern Review on the Economics of Climate Change, 2006.
5. The image of the motorway was used by Christiana Figueres, during her time as Executive Secretary of the UN Framework Convention on Climate Change (UNFCCC).
6. Oxford Martin School et. al., http://trillionthtonne.org
7. Calculated as a midpoint in a range of uncertainty.
8. IPCC, Summary for Policymakers, 2014.
9. “Scenarios of Global Change: Integrated Assessment of Climate Impacts”, MIT Joint Program, Report 291, February 2016.
10. “Energy system transformations for limiting end-of-century warming to below 1.5°C”, Nature Climate Change, June 2015.
11. Yvonne Y. Deng, Martin Haigh, Willemijn Pouwels, Lou Ramaekers, Ruut Brandsma, Sven Schimschar, Jan Grözinger, and David de Jager, “Quantifying a Realistic, Worldwide Wind and Solar Electricity Supply”, Global Environmental Change 31 (March 2015). http://www.sciencedirect.com/science/article/pii/S0959378015000072.
12. Shell is one of the six industry members of the ETI along with the UK Government.
13. http://www.eti.co.uk/wp-content/uploads/2015/03/Options-Choices-Actions-Hyperlinked-version-for-digital.pdf. The Clockwork scenario describes a high level of policy-driven coordinated change to decarbonise the UK economy by 80% by 2050, as required by the UK Climate Change Act 2008.
14. Emissions from non-metallic minerals refers to fuel combustion emissions from the production of glass, ceramic, cement, etc.
15. Climate Change 2014: Synthesis Report, p. 95.
16. Shell sponsored the Indian research organisation, IRADe, to analyse the potential future economic transformation of India. One outcome of their research was indeed that energy use in India may grow to approximately 100 GJ/capita/year by 2050. The work was independent of and not necessarily related to assumptions made by Shell in its own energy model. Please see www.shell.com/scenarios. (See page 72 “Economic Growth and Energy”).
17. www.shell.com/scenarios.
Cautionary Note for Investors
The companies in which Royal Dutch Shell plc directly and indirectly owns investments are separate entities. In this supplement “Shell,” “Shell group,” and “Royal Dutch Shell” are sometimes used for convenience where references are made to Royal Dutch Shell plc and its subsidiaries in general. Likewise, the words “we,” “us,” and “our” may also be used to refer to subsidiaries in general or to those who work for them. These expressions are also used where no useful purpose is served by identifying the particular company or companies.
This supplement contains forward-looking statements that could be interpreted as concerning the financial condition, results of operations, and businesses of Royal Dutch Shell. All statements other than statements of historical fact are, or may be deemed to be, forward-looking statements. Forward-looking statements are statements of future expectations that are based on management’s current expectations and assumptions and involve known and unknown risks and uncertainties that could cause actual results, performance, or events to differ materially from those expressed or implied in these statements. Forward-looking statements include, among other things, statements concerning the potential exposure of Royal Dutch Shell to market risks and statements expressing management’s expectations, beliefs, estimates, forecasts, projections, and assumptions. These forward-looking statements are identified by their use of terms and phrases such as “anticipate,” “believe,” “could,” “estimate,” “expect,” “goals,” “intend,” “may,” “objectives,” “outlook,” “plan,” “probably,” “project,” “risks,” “schedule,” “seek,” “should,” “target,” “will,” and similar terms and phrases. There are a number of factors that could affect the future operations of Royal Dutch Shell and could cause those results to differ materially from those expressed in the forward-looking statements included in this supplement, including (without limitation): (a) price fluctuations in crude oil and natural gas; (b) changes in demand for Shell’s products; (c) currency fluctuations; (d) drilling and production results; (e) reserves estimates; (f) loss of market share and industry competition; (g) environmental and physical risks; (h) risks associated with the identification of suitable potential acquisition properties and targets, and successful negotiation and completion of such transactions; (i) the risk of doing business in developing countries and countries subject to international sanctions; (j) legislative, fiscal, and regulatory developments, including
regulatory measures addressing climate change; (k) economic and financial market conditions in various countries and regions; (l) political risks, including the risks of expropriation and renegotiation of the terms of contracts with governmental entities, delays or advancements in the approval of projects, and delays in the reimbursement for shared costs; and (m) changes in trading conditions. All forward-looking statements contained in this supplement are expressly qualified in their entirety by the cautionary statements contained or referred to in this section. Readers should not place undue reliance on forward-looking statements. Additional risk factors that may affect future results are contained in Royal Dutch Shell’s 20-F for the year ended December 31, 2015 (available at www.shell.com/investor and www.sec.gov). These risk factors also expressly qualify all forward-looking statements contained in this supplement and should be considered by the reader. Each forward-looking statement speaks only as of the date of this supplement (May 2016). Neither Royal Dutch Shell plc nor any of its subsidiaries undertake any obligation to publicly update or revise any forward-looking statement as a result of new information, future events, or other information. In light of these risks, results could differ materially from those stated, implied, or inferred from the forward-looking statements contained in this supplement.
We may have used certain terms, such as “resources,” in this supplement that United States Securities and Exchange Commission (SEC) strictly prohibits us from including in our filings with the SEC. US Investors are urged to consider closely the disclosure in our Form 20-F, File No 1-32575, available on the SEC website www.sec.gov.
93

www.shell.com/scenarios
© 2016 Shell International BV
All rights reserved. No part of this publication may be reproduced, stored in a retrieval system, published or transmitted, in any form or by any means, without the prior written permission of Shell International BV.