Embed Size (px)
Citation preview
149
Belgian Journal of Zoologywww.belgianjournalzoology.be
This work is licensed under a Creative Commons Attribution 3.0 License. ISSN 2295-0451
R e s e a r c h a r t i c l e
https://doi.org/10.26496/bjz.2018.24
A 3D quantitative method for analyzing bone mineral densities: a case study on skeletal deformities in the gilthead sea bream,
Sparus aurata (Linnaeus, 1758)
Nguyen Phuc Thuong 1,2, Manuel Dierick 3,Tania De Wolf 4 & Dominique Adriaens 1,*
1 Evolutionary Morphology of Vertebrates, Ghent University, K.L. Ledeganckstraat 35,Ghent B-9000, Belgium.
2 Faculty of Fisheries, Nong Lam University – Ho Chi Minh City, Linh Trung Ward,Thu Duc District, Ho Chi Minh City, Vietnam.
3 Center for X-ray Tomography (UGCT), Department of Physics and Astronomy, Ghent University,Proeftuinstraat 86, Ghent B-9000, Belgium.
4 INVE, Maricoltura di Rosignano Solvay, srl, Via P. Gigli (Loc Lillatro),I-57013 Rosignano Solvay, Italy.
* Corresponding author: [email protected]
Abstract. Skeletal deformities, one of the major threats for aquaculture, have been studied extensively. These include opercular malformations in gilthead sea bream (Sparus aurata), a key fish species for Mediterranean aquaculture. What is causing it and at what morphogenetic level it arises, however, is still unclear. Here we focus on bone formation, at the level of bone mineralization. Several methods have been used to study bone mineralization density (BMD), however, these are frequently limited when targeting a high-resolution, three-dimensional mapping of BMD. We used micro-computed tomography (micro-CT) data to perform such a 3D quantification of BMD levels in gilthead sea bream that showed different levels of opercular bone deformations. This approach has the advantage of not having to rely on calibration phantoms, as long as relative BMD values are needed. The results show an increased BMD in deformed opercles compared to normal ones, especially in a bilaterally-deformed specimen. Furthermore, we show that opercular deformations are not necessarily associated with similar mineralization patterns in other mineralized cranial elements, except for the otoliths. Also, mineralization seems to occur left-right independently, matching earlier observations of such an independency of the opercular phenotype as a whole. This study confirms that a quantitative characterization of BMD patterns in 3D is feasible, even in smaller specimens, and that it has several advantages over other commonly used approaches.
Keywords. Bone mineralization density, opercular deformities, micro-CT, Sparus aurata.
Thuong N.P., Dierick M., De Wolf T. & Adriaens D. (2018). A 3D quantitative method for analyzing bone mineral densities: a case study on skeletal deformities in the gilthead sea bream, Sparus aurata (Linnaeus, 1758). Belgian Journal of Zoology 148 (2): 149–166. https://doi.org/10.26496/bjz.2018.24
Introduction
Skeletal deformities are currently one of the major threats for farmed fish production, especially those at early stages of the fish development (Daoulas et al. 1991; Divanach et al. 1996; KoumounDouros
150
Belg. J. Zool. 148 (2): 149–166 (2018)
et al. 1997b; haga et al. 2003; Fraser & De nys 2005). As such, many studies have focused on the biology of bone development in fish, trying to tackle aspects of bone morphogenesis, possible causal factors related to rearing conditions, or just the categorization of deformity types resulting from intensive fish culture (e.g., villeneuve et al, 2005; lall & lewis-mccrea 2007; Darias et al. 2011; holmes 2012). Still, many questions remain, including the level at which impaired bone morphogenetic processes result in deformed skeletal phenotypes. Impaired bone mineralization is one such an example, where proper insights are mainly constrained because of methodological limitations or accessibility, especially considering the non-medical context for studying fish skeletal deformities.
Several X-ray based approaches are commonly used to measure bone mineral density (BMD), especially for medical purposes (celenK & celenK 2012). Different approaches have been used to qualitatively visualize mineralized tissues, some in a more quantitative manner (for an overview, see also Zanette et al. 2014 and Bruneel & witten 2015). However, a detailed quantification of BMD levels (both density levels and spatial distribution patterns) using readily accessible X-ray imaging for non-medical purposes is rather challenging. As such, alternative and easily accessible methods such as Alizarin red S staining are by far the most common and feasible approach to studying both normal skeletal phenotypes in a comparative and ontogenetic context, and to screening for skeletal deformities in fishes (KoumounDouros 2010; yelicK & connolly 2010; anDreeva et al. 2011). Also calcein has proven to be useful, because of its calcium-binding capacities and it being applicable as a vital stain (connolly & yelicK 2010; Bensimon-Brito et al. 2016). Quantifying bone mineralization using Alizarin red S involved measuring the area (Fontagne et al. 2009) or aspect ratio (Bensimon-Brito et al. 2016) of bony structures in 2D, giving an overall estimate of BMD. Still, several factors are known to influence staining intensity of Alizarin red S, as well as its affinity for binding also to compounds other than only calcium-binding ones, and its decalcifying effect (even in an alkaline solution), thereby compromising the accuracy of this method (Puchtler et al. 1969; hosen et al. 2013).
More promising is the increasing performance and accessibility of micro-CT scanners that are quite readily available at research institutes. Not only do they reach high resolution of X-ray attenuation data (voxel sizes below micron level are achieved with regular micro-CT scanning), they have the potential to correlate attenuation levels (translated into grey values of voxels) to mineralization levels and gather data on the internal structure (wagner et al. 2011). Even higher resolution and contrast information can be obtained using high-energy synchrotron scanning, however, these are less accessible for daily routine research (eFimova et al. 2013). Using regular micro-CT scanning has become common practice to obtain 3D data on both skeletal and soft tissue anatomy (when combined with contrast staining) (gignac et al., 2016), and has been extensively applied to qualitative studies on fish skeletal deformities (e.g., Atlantic salmon, zebrafish, guppy, medaka, sea bass, sea bream) (norDviK et al. 2005; neues & ePPle, 2008; morel et al. 2010; DeBusschere et al. 2016). However, micro-CT allows reliable quantification of bone mineralization, both in generating BMD values and also in mapping that in 3D. Because of the correlation between grey values of voxels and mineralization density, absolute levels of BMD can be quantified through micro-CT scanning by using phantom objects of known mineralization density (generally calcium hydroxyapatite samples of various densities), both for ex and in vivo studies (camPBell & soPhocleous 2014). This has been used to quantify the overall (and thus average) BMD of individual bones in fish (asharani et al. 2012; shKil et al. 2014).
Although extremely powerful for quantification of BMD, the use of the above-mentioned approaches comes with limitations. Using Alizarin red S (whether or not with double staining using acid free cartilage staining) (walKer & Kimmel 2007) or calcein has very limited quantification potential (only in 2D and sensitive to staining variability). The same applies for using X-ray radiographs (Fisher et al. 2003). This can be overcome by using micro-CT scanning with those phantoms. However, phantoms are quite expensive and generally produced at a size that is relevant for particular medical applications. Phantoms scaled to be used with micro-CT scanning of small fish are potentially still too large (considering that voxel resolution correlates with the distance between the X-ray beam and the detector, and thus the diameter
151
of the rotating object that is being scanned), are less common and are substantially more expensive (smallest micro-CT phantoms with a minimal dimension of 38 mm cost more than 2,000 €). Furthermore, the accuracy for studying BMD in fish bone does depend on the density range of available phantoms, whereas extrapolations beyond the phantom range are prone to errors (Deuerling et al. 2010).
Because of that, we propose a method that allows comparing relative BMD levels across samples, applying standardization criteria that rely on histogram data from the sample’s voxel grey values (thus without the need of phantoms). Quantitative threshold identification approaches for grey values are common practice for automated segmentation of CT data (ParKinson et al. 2008; camPBell & soPhocleous 2014). However, this is mainly to discriminate bone matrix from the surrounding tissue, and not to discriminate between BMD levels within bony tissue. As such, we suggest objective but qualitative criteria to define thresholds for the identification of different BMD levels within bones, using histogram data of voxel grey values.
As a case study, we explored differences in BMD levels in normal versus deformed opercular bones in gilthead sea bream Sparus aurata (Linnaeus, 1758), and compared those with mineralization patterns in other cranial elements (premaxilla, first vertebra, otolith). Gilthead sea bream is one of the most intensively cultivated fish species in the Mediterranean, but is also the subject of numerous studies that focus on skeletal anomalies (PaPerna 1978; Francescon et al. 1988; anDraDes et al. 1996; KoumounDouros et al. 1997a; galeotti et al. 2000; Boglione et al. 2001; FernánDeZ et al. 2008; Prestinicola et al. 2014). Among these skeletal anomalies, opercular deformities are frequently found both during early life stages [in larvae from 17 days post hatching (DPH)] and in adults of farmed gilthead sea bream (KoumounDouros et al. 1997b; galeotti et al. 2000; BeralDo et al. 2003; ortiZ-DelgaDo et al. 2014). This type of skeletal deformity can significantly negatively affect their growth rate and commercial value at market size (Boglione et al. 2001; FernánDeZ et al. 2008).
Relying on different diagnostic tools, most of the opercular anomalies in gilthead sea bream have been described as an inward folding of the opercular bones: external observation, whole mount staining, histology or histochemistry (KoumounDouros et al. 1997b; BeralDo et al. 2003; KoumounDouros 2010; ortiZ-DelgaDo et al. 2014). Still, the level of bone tissue morphogenesis at which the alteration occurs, remains to be resolved. Understanding the morphogenetic level of its aetiology could prove crucial to identifying possible causative factors behind these anomalies. A problem with mineralization of the bone matrix is one aspect of bone morphogenesis that has been linked to opercular anomalies. galeotti et al. (2000) described an abnormal mineralization in deformed opercular bones of larvae from 30 DPH, using transmission electron microscopy. Increased levels of bone mineral density (BMD) have also been visualized at the early onset of the phenotypic deformity by using X-ray micro-computed tomography (micro-CT) (morel et al. 2010). As such, these observations are indicative that an understanding of mineralization patterns associated with opercular deformities, especially the topographical (3D) distribution pattern of increased BMD, could provide insights into the mechanism behind these abnormalities.
We wanted to investigate the following: whether opercular deformations are linked to an increased BMD, the topographical (3D) distribution of the increased BMD zones, and the degree to which these patterns are somehow associated with deformed phenotypes. Also, we wanted to evaluate whether altered BMD levels in deformed opercles are accompanied by a similar change in BMD levels in other bony structures (indicating an overall problem with the ossification process), or even in other mineralized structures, such as otoliths (indicating a general problem with mineralization, independent of ossification).
Material and methods
Animals
Specimens of gilthead sea bream (Sparus aurata) were provided from a commercial marine hatchery (Maricoltura di Rosignano Solvay). All sampled specimens were killed using an overdose of MS-222
THUONG N.P. et al., A 3D quantitative method for analyzing bone mineral densities in Sparus aurata
152
Belg. J. Zool. 148 (2): 149–166 (2018)
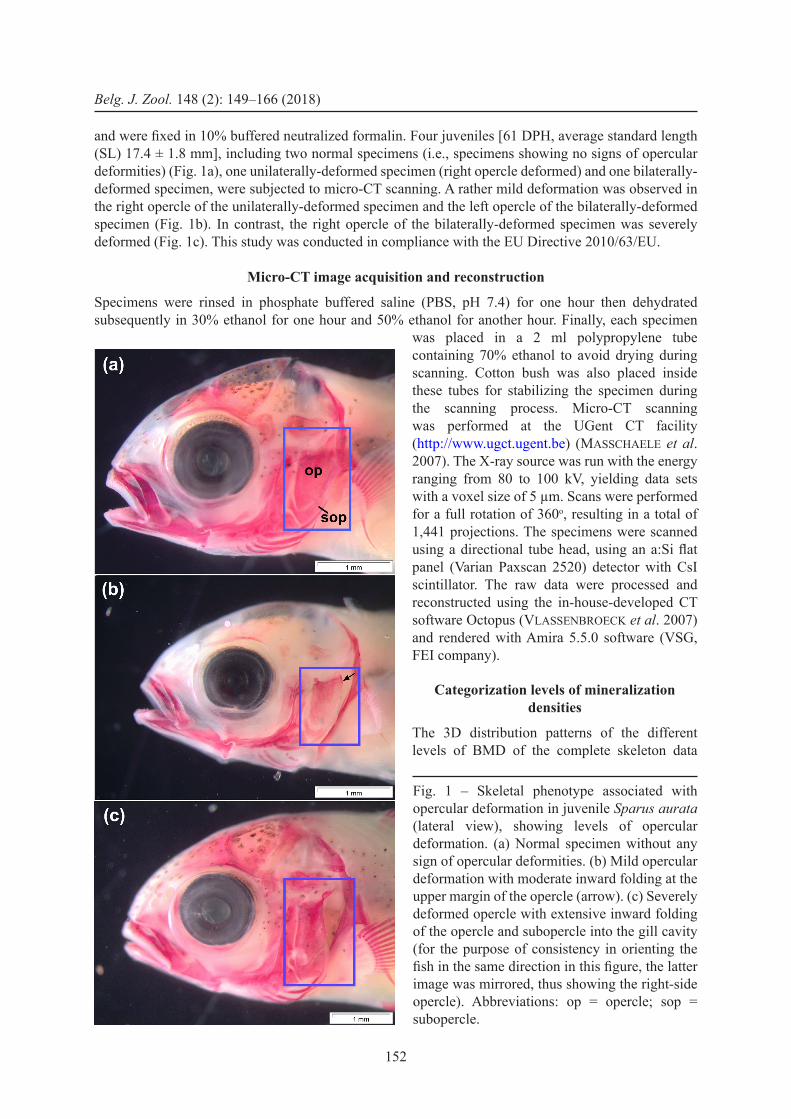
and were fixed in 10% buffered neutralized formalin. Four juveniles [61 DPH, average standard length (SL) 17.4 ± 1.8 mm], including two normal specimens (i.e., specimens showing no signs of opercular deformities) (Fig. 1a), one unilaterally-deformed specimen (right opercle deformed) and one bilaterally-deformed specimen, were subjected to micro-CT scanning. A rather mild deformation was observed in the right opercle of the unilaterally-deformed specimen and the left opercle of the bilaterally-deformed specimen (Fig. 1b). In contrast, the right opercle of the bilaterally-deformed specimen was severely deformed (Fig. 1c). This study was conducted in compliance with the EU Directive 2010/63/EU.
Micro-CT image acquisition and reconstruction
Specimens were rinsed in phosphate buffered saline (PBS, pH 7.4) for one hour then dehydrated subsequently in 30% ethanol for one hour and 50% ethanol for another hour. Finally, each specimen
was placed in a 2 ml polypropylene tube containing 70% ethanol to avoid drying during scanning. Cotton bush was also placed inside these tubes for stabilizing the specimen during the scanning process. Micro-CT scanning was performed at the UGent CT facility (http://www.ugct.ugent.be) (masschaele et al. 2007). The X-ray source was run with the energy ranging from 80 to 100 kV, yielding data sets with a voxel size of 5 µm. Scans were performed for a full rotation of 360o, resulting in a total of 1,441 projections. The specimens were scanned using a directional tube head, using an a:Si flat panel (Varian Paxscan 2520) detector with CsI scintillator. The raw data were processed and reconstructed using the in-house-developed CT software Octopus (vlassenBroecK et al. 2007) and rendered with Amira 5.5.0 software (VSG, FEI company).
Categorization levels of mineralization densities
The 3D distribution patterns of the different levels of BMD of the complete skeleton data
Fig. 1 – Skeletal phenotype associated with opercular deformation in juvenile Sparus aurata (lateral view), showing levels of opercular deformation. (a) Normal specimen without any sign of opercular deformities. (b) Mild opercular deformation with moderate inward folding at the upper margin of the opercle (arrow). (c) Severely deformed opercle with extensive inward folding of the opercle and subopercle into the gill cavity (for the purpose of consistency in orienting the fish in the same direction in this figure, the latter image was mirrored, thus showing the right-side opercle). Abbreviations: op = opercle; sop = subopercle.
153
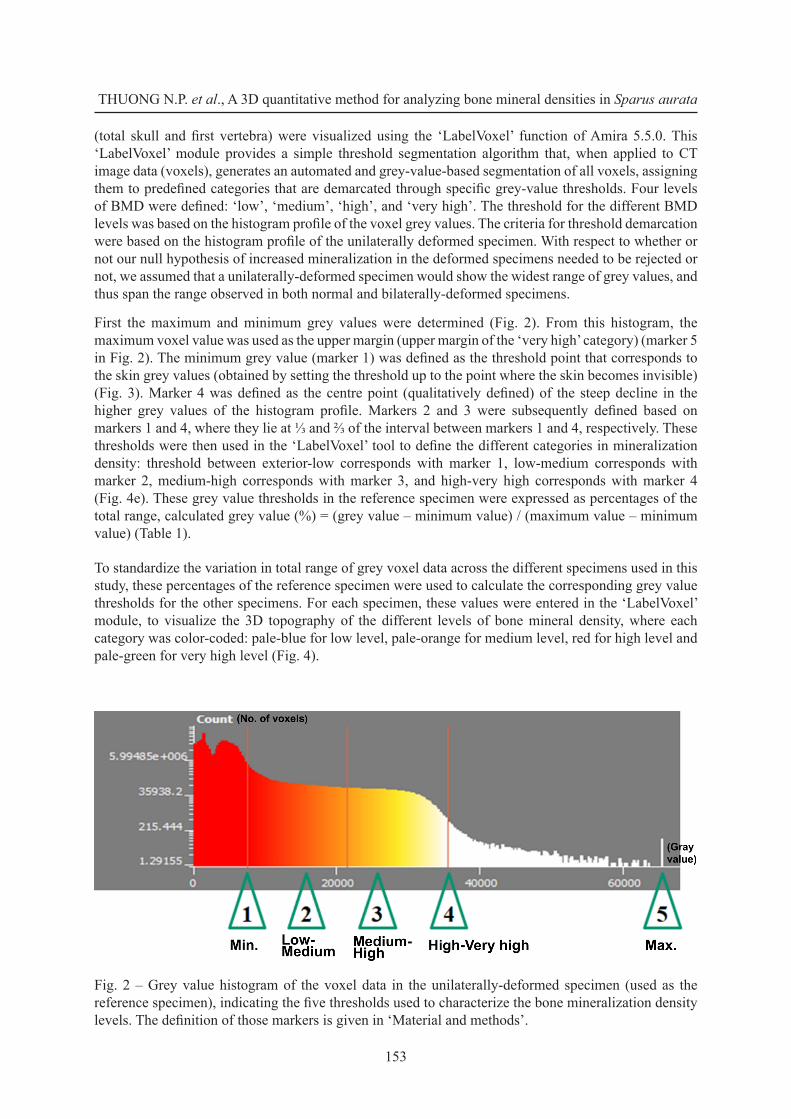
(total skull and first vertebra) were visualized using the ‘LabelVoxel’ function of Amira 5.5.0. This ‘LabelVoxel’ module provides a simple threshold segmentation algorithm that, when applied to CT image data (voxels), generates an automated and grey-value-based segmentation of all voxels, assigning them to predefined categories that are demarcated through specific grey-value thresholds. Four levels of BMD were defined: ‘low’, ‘medium’, ‘high’, and ‘very high’. The threshold for the different BMD levels was based on the histogram profile of the voxel grey values. The criteria for threshold demarcation were based on the histogram profile of the unilaterally deformed specimen. With respect to whether or not our null hypothesis of increased mineralization in the deformed specimens needed to be rejected or not, we assumed that a unilaterally-deformed specimen would show the widest range of grey values, and thus span the range observed in both normal and bilaterally-deformed specimens.
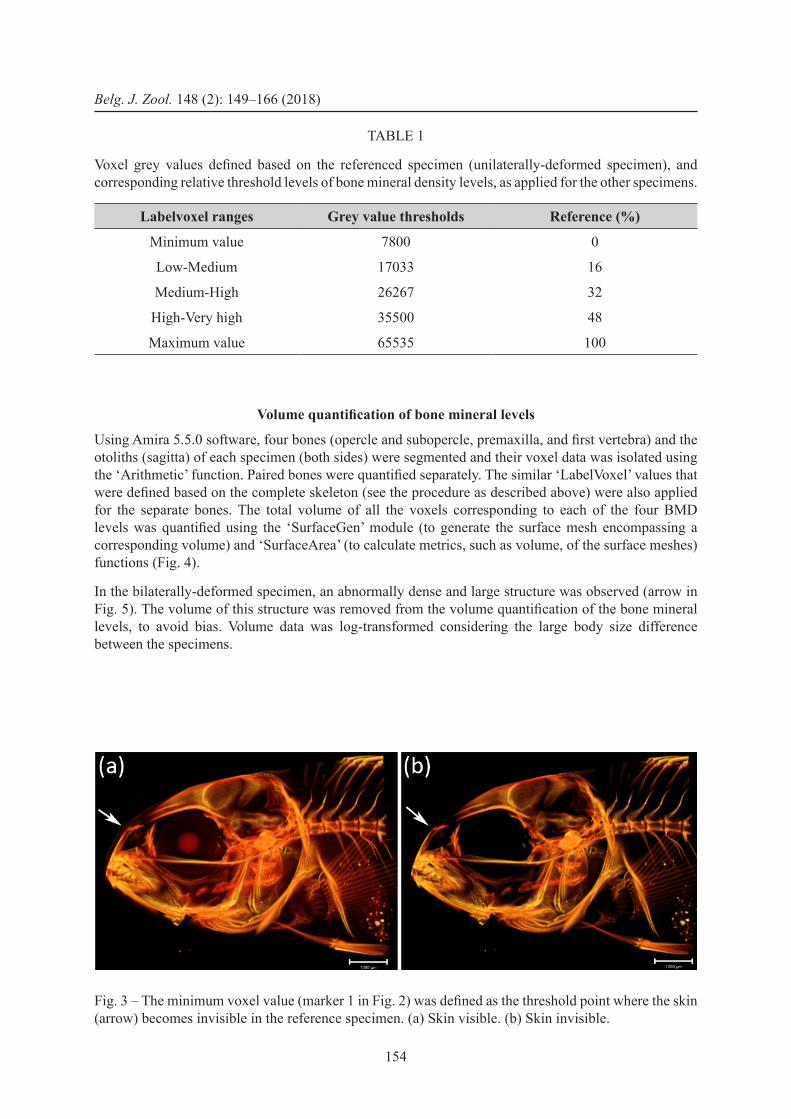
First the maximum and minimum grey values were determined (Fig. 2). From this histogram, the maximum voxel value was used as the upper margin (upper margin of the ‘very high’ category) (marker 5 in Fig. 2). The minimum grey value (marker 1) was defined as the threshold point that corresponds to the skin grey values (obtained by setting the threshold up to the point where the skin becomes invisible) (Fig. 3). Marker 4 was defined as the centre point (qualitatively defined) of the steep decline in the higher grey values of the histogram profile. Markers 2 and 3 were subsequently defined based on markers 1 and 4, where they lie at ⅓ and ⅔ of the interval between markers 1 and 4, respectively. These thresholds were then used in the ‘LabelVoxel’ tool to define the different categories in mineralization density: threshold between exterior-low corresponds with marker 1, low-medium corresponds with marker 2, medium-high corresponds with marker 3, and high-very high corresponds with marker 4 (Fig. 4e). These grey value thresholds in the reference specimen were expressed as percentages of the total range, calculated grey value (%) = (grey value – minimum value) / (maximum value – minimum value) (Table 1).
To standardize the variation in total range of grey voxel data across the different specimens used in this study, these percentages of the reference specimen were used to calculate the corresponding grey value thresholds for the other specimens. For each specimen, these values were entered in the ‘LabelVoxel’ module, to visualize the 3D topography of the different levels of bone mineral density, where each category was color-coded: pale-blue for low level, pale-orange for medium level, red for high level and pale-green for very high level (Fig. 4).
Fig. 2 – Grey value histogram of the voxel data in the unilaterally-deformed specimen (used as the reference specimen), indicating the five thresholds used to characterize the bone mineralization density levels. The definition of those markers is given in ‘Material and methods’.
THUONG N.P. et al., A 3D quantitative method for analyzing bone mineral densities in Sparus aurata
154
Belg. J. Zool. 148 (2): 149–166 (2018)
Volume quantification of bone mineral levels
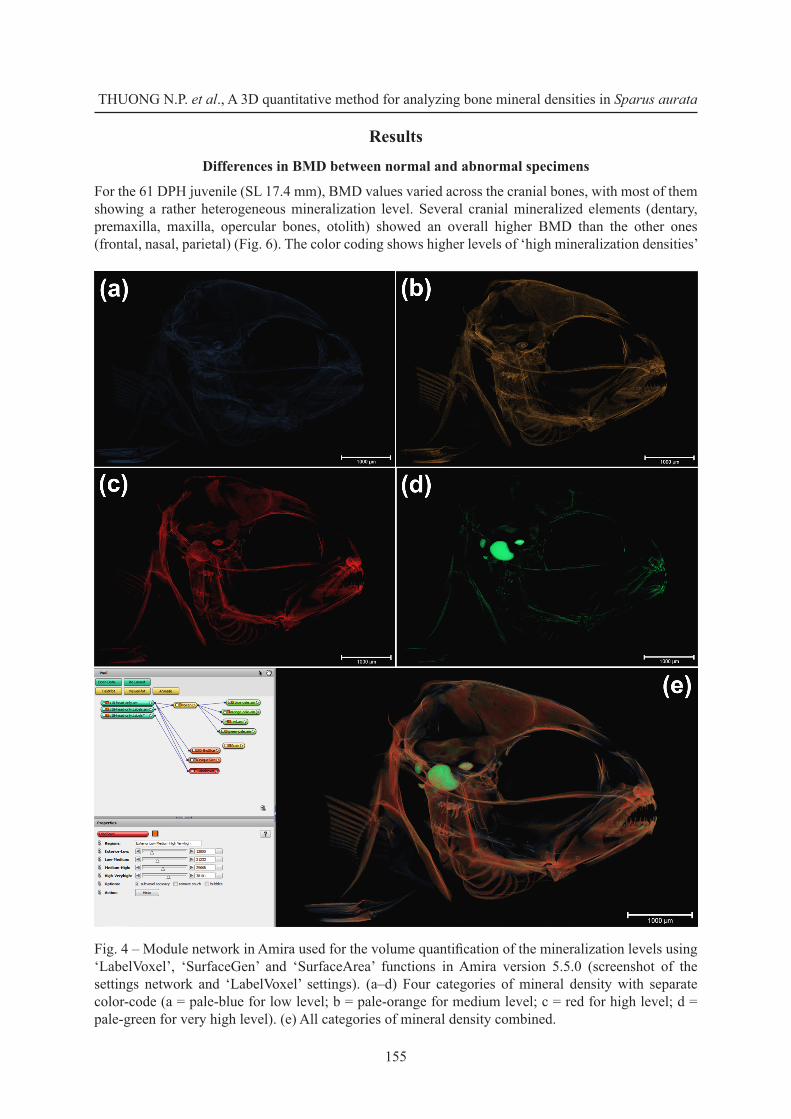
Using Amira 5.5.0 software, four bones (opercle and subopercle, premaxilla, and first vertebra) and the otoliths (sagitta) of each specimen (both sides) were segmented and their voxel data was isolated using the ‘Arithmetic’ function. Paired bones were quantified separately. The similar ‘LabelVoxel’ values that were defined based on the complete skeleton (see the procedure as described above) were also applied for the separate bones. The total volume of all the voxels corresponding to each of the four BMD levels was quantified using the ‘SurfaceGen’ module (to generate the surface mesh encompassing a corresponding volume) and ‘SurfaceArea’ (to calculate metrics, such as volume, of the surface meshes) functions (Fig. 4).
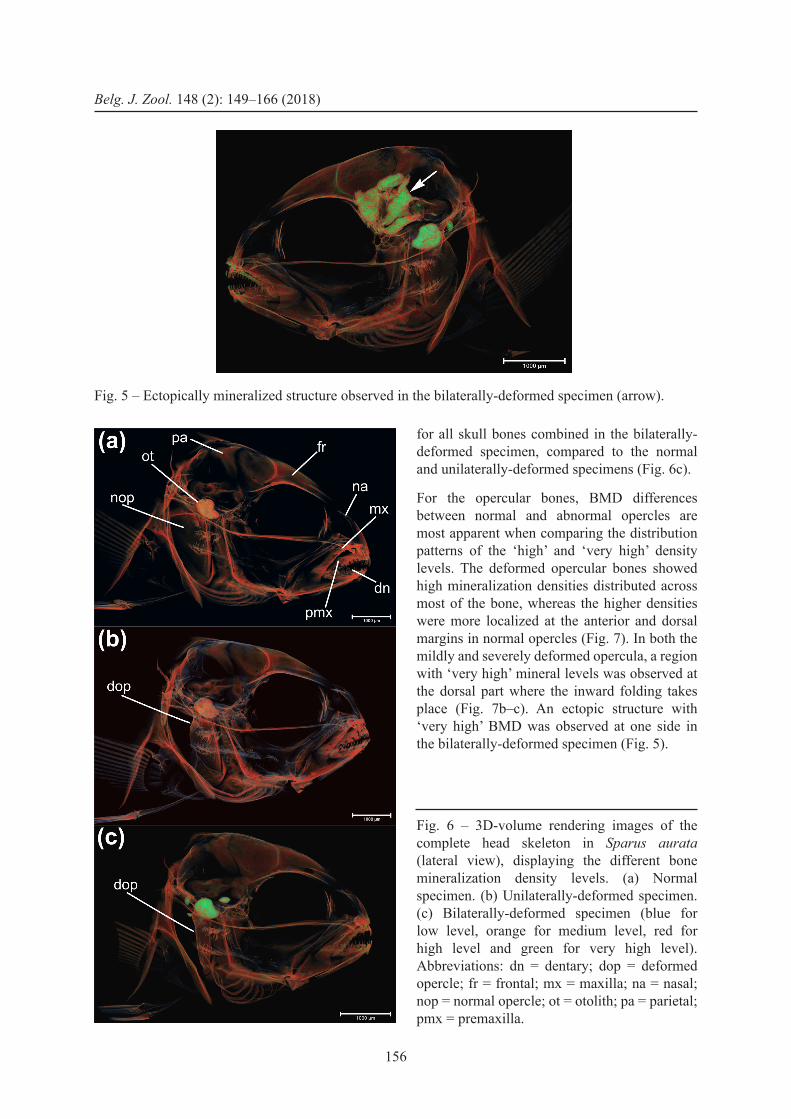
In the bilaterally-deformed specimen, an abnormally dense and large structure was observed (arrow in Fig. 5). The volume of this structure was removed from the volume quantification of the bone mineral levels, to avoid bias. Volume data was log-transformed considering the large body size difference between the specimens.
Fig. 3 – The minimum voxel value (marker 1 in Fig. 2) was defined as the threshold point where the skin (arrow) becomes invisible in the reference specimen. (a) Skin visible. (b) Skin invisible.
TABLE 1
Voxel grey values defined based on the referenced specimen (unilaterally-deformed specimen), and corresponding relative threshold levels of bone mineral density levels, as applied for the other specimens.
Labelvoxel ranges Grey value thresholds Reference (%)
Minimum value 7800 0
Low-Medium 17033 16
Medium-High 26267 32
High-Very high 35500 48
Maximum value 65535 100
155
Results
Differences in BMD between normal and abnormal specimens
For the 61 DPH juvenile (SL 17.4 mm), BMD values varied across the cranial bones, with most of them showing a rather heterogeneous mineralization level. Several cranial mineralized elements (dentary, premaxilla, maxilla, opercular bones, otolith) showed an overall higher BMD than the other ones (frontal, nasal, parietal) (Fig. 6). The color coding shows higher levels of ‘high mineralization densities’
Fig. 4 – Module network in Amira used for the volume quantification of the mineralization levels using ‘LabelVoxel’, ‘SurfaceGen’ and ‘SurfaceArea’ functions in Amira version 5.5.0 (screenshot of the settings network and ‘LabelVoxel’ settings). (a–d) Four categories of mineral density with separate color-code (a = pale-blue for low level; b = pale-orange for medium level; c = red for high level; d = pale-green for very high level). (e) All categories of mineral density combined.
THUONG N.P. et al., A 3D quantitative method for analyzing bone mineral densities in Sparus aurata
156
Belg. J. Zool. 148 (2): 149–166 (2018)
for all skull bones combined in the bilaterally-deformed specimen, compared to the normal and unilaterally-deformed specimens (Fig. 6c).
For the opercular bones, BMD differences between normal and abnormal opercles are most apparent when comparing the distribution patterns of the ‘high’ and ‘very high’ density levels. The deformed opercular bones showed high mineralization densities distributed across most of the bone, whereas the higher densities were more localized at the anterior and dorsal margins in normal opercles (Fig. 7). In both the mildly and severely deformed opercula, a region with ‘very high’ mineral levels was observed at the dorsal part where the inward folding takes place (Fig. 7b–c). An ectopic structure with ‘very high’ BMD was observed at one side in the bilaterally-deformed specimen (Fig. 5).
Fig. 5 – Ectopically mineralized structure observed in the bilaterally-deformed specimen (arrow).
Fig. 6 – 3D-volume rendering images of the complete head skeleton in Sparus aurata (lateral view), displaying the different bone mineralization density levels. (a) Normal specimen. (b) Unilaterally-deformed specimen. (c) Bilaterally-deformed specimen (blue for low level, orange for medium level, red for high level and green for very high level). Abbreviations: dn = dentary; dop = deformed opercle; fr = frontal; mx = maxilla; na = nasal; nop = normal opercle; ot = otolith; pa = parietal; pmx = premaxilla.
157
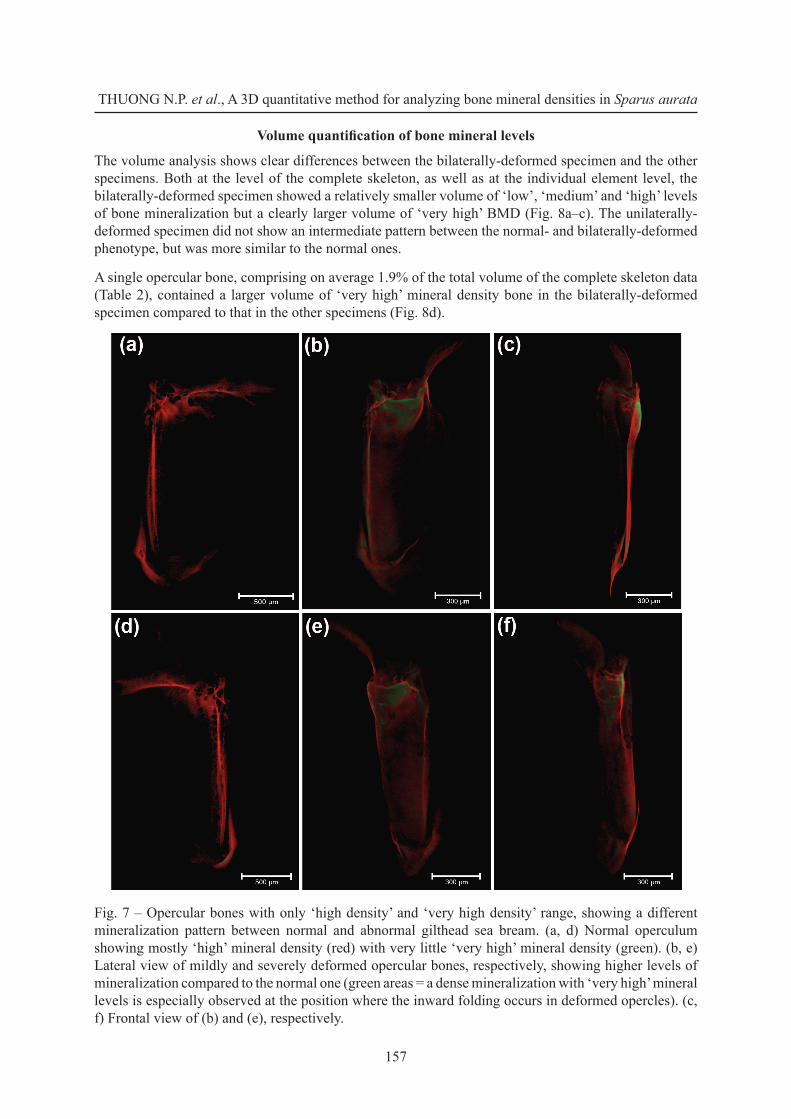
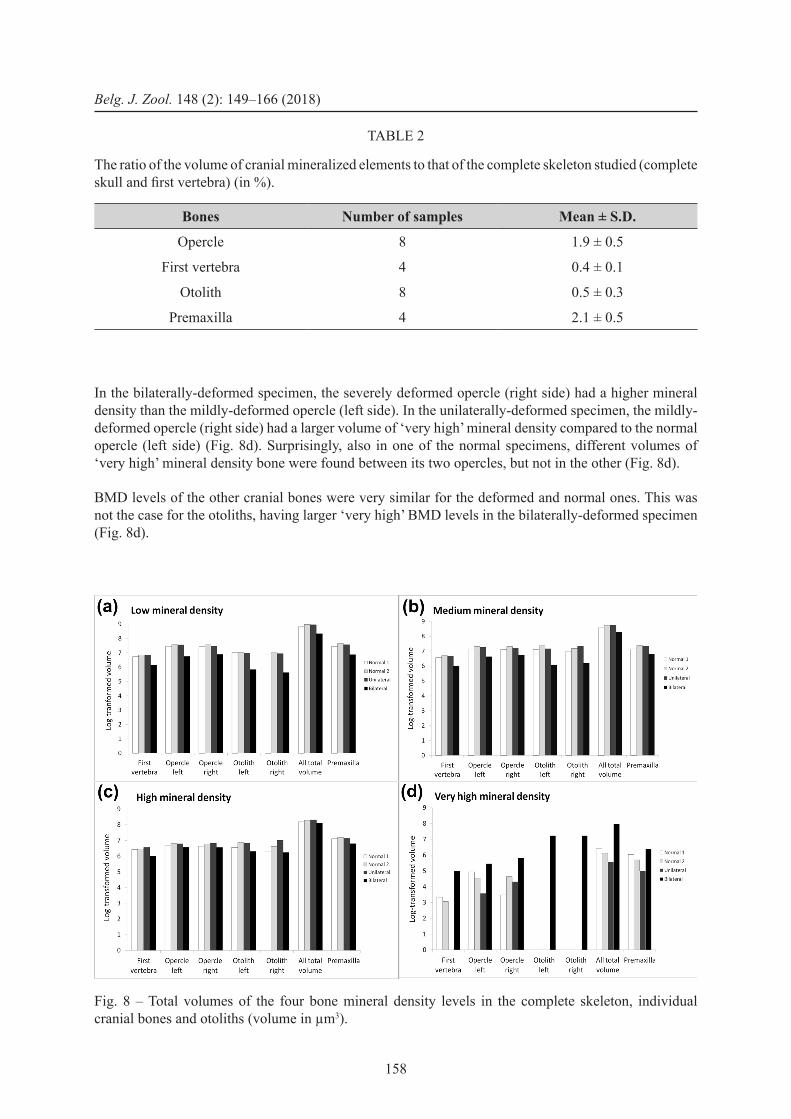
Volume quantification of bone mineral levels
The volume analysis shows clear differences between the bilaterally-deformed specimen and the other specimens. Both at the level of the complete skeleton, as well as at the individual element level, the bilaterally-deformed specimen showed a relatively smaller volume of ‘low’, ‘medium’ and ‘high’ levels of bone mineralization but a clearly larger volume of ‘very high’ BMD (Fig. 8a–c). The unilaterally-deformed specimen did not show an intermediate pattern between the normal- and bilaterally-deformed phenotype, but was more similar to the normal ones.
A single opercular bone, comprising on average 1.9% of the total volume of the complete skeleton data (Table 2), contained a larger volume of ‘very high’ mineral density bone in the bilaterally-deformed specimen compared to that in the other specimens (Fig. 8d).
Fig. 7 – Opercular bones with only ‘high density’ and ‘very high density’ range, showing a different mineralization pattern between normal and abnormal gilthead sea bream. (a, d) Normal operculum showing mostly ‘high’ mineral density (red) with very little ‘very high’ mineral density (green). (b, e) Lateral view of mildly and severely deformed opercular bones, respectively, showing higher levels of mineralization compared to the normal one (green areas = a dense mineralization with ‘very high’ mineral levels is especially observed at the position where the inward folding occurs in deformed opercles). (c, f) Frontal view of (b) and (e), respectively.
THUONG N.P. et al., A 3D quantitative method for analyzing bone mineral densities in Sparus aurata
158
Belg. J. Zool. 148 (2): 149–166 (2018)
In the bilaterally-deformed specimen, the severely deformed opercle (right side) had a higher mineral density than the mildly-deformed opercle (left side). In the unilaterally-deformed specimen, the mildly-deformed opercle (right side) had a larger volume of ‘very high’ mineral density compared to the normal opercle (left side) (Fig. 8d). Surprisingly, also in one of the normal specimens, different volumes of ‘very high’ mineral density bone were found between its two opercles, but not in the other (Fig. 8d).
BMD levels of the other cranial bones were very similar for the deformed and normal ones. This was not the case for the otoliths, having larger ‘very high’ BMD levels in the bilaterally-deformed specimen (Fig. 8d).
Fig. 8 – Total volumes of the four bone mineral density levels in the complete skeleton, individual cranial bones and otoliths (volume in µm3).
TABLE 2
The ratio of the volume of cranial mineralized elements to that of the complete skeleton studied (complete skull and first vertebra) (in %).
Bones Number of samples Mean ± S.D.
Opercle 8 1.9 ± 0.5
First vertebra 4 0.4 ± 0.1
Otolith 8 0.5 ± 0.3
Premaxilla 4 2.1 ± 0.5
159
Discussion
In the past, malformation of the opercular complex could affect up to 80% of the reared population in gilthead sea bream (PaPerna 1978; Francescon et al. 1988; anDraDes et al. 1996). Although this rate nowadays has become reduced to 5-20% of the production in commercial hatcheries (BeralDo & canavese 2011), opercular deformation is still one of the most frequent skeletal deformities observed in this species (verhaegen et al. 2007; castro et al. 2008; Prestinicola et al. 2013; Boglione et al. 2013a). A link between the opercular phenotype (normal vs deformed) and mineralization levels has already been observed during the juvenile period, before 61 DPH. galeotti et al. (2000) found an aberrant mineralization process with heterogeneous and irregular deposition of calcium salts in deformed opercles of 30 DPH gilthead sea bream. Our results corroborate the qualitative observations of morel et al. (2010), that higher BMD can be observed in deformed opercles, especially in the region that shows the inward folding of the bone. The larger volumes of ‘very high’ BMD levels in bilaterally-deformed opercles (and overall ossification in bilaterally-deformed specimens), as well as the higher BMD levels in the deformed opercle of the unilaterally-deformed specimens suggest some kind of link between the opercular phenotypes and mineralization levels. However, the observed discrepancy between left and right opercular BMD levels in one of the normal specimens does not fit into this pattern. This may suggest that mineralization follows a left-right independent pattern, with a bilateral decoupling already observed for the overall opercular phenotype (verhaegen et al. 2007). Still, this all indicates the need for further exploration, and that applying this technique on larger sample sizes is a promising approach to finding causal mechanisms related to bone mineralization in association with skeletal deformities.
Bone mineralization involves the incorporation of mineral elements (Ca, P, …) into the organic bone matrix (osteoid) by osteoblasts, and undergoes two stages (glimcher 1998; rauch & schoenau 2002): (1) osteoblasts synthesize bone matrix and deposit it on an already existing surface of mineralized bone and then (2) mineral is added to the newly deposited matrix, where initially amorphous calcium phosphate nanospheres deposited onto the collagen fibers in that matrix eventually become transformed into platelets of crystalline hydroxyapatite (mahamiD et al. 2010). Although both processes generally co-occur, a recent study shows that bone can form without becoming mineralized (resulting from P-deficient nutrition) (witten et al. 2016). As such, it can be hypothesized that bone can manifest a deviating phenotype at two independent levels: bone tissue formation (resulting in the overall bone phenotype) and mineralization (influencing bone strength and flexibility). A too high BMD can make bone harder and more brittle, whereas abnormal phenotypes will influence how the bone mechanically interacts with its environment (Burr 2002; turner 2006). It could thus be hypothesized that the observed link between deformed phenotypes and increased BMD is the result of a complex interplay between those two bone forming processes and the direct environment (being surrounding tissue, muscles pulling onto the bone, hydrodynamic pressure pushing against the opercle…).
Although at this point, the underlying causal mechanism to explain elevated BMD levels in opercular deformities remains unknown, one factor that has been linked to increased mineralization is mechanical loading. This represents a common phenomenon of how the vertebrate skeleton adapts to changing mechanical loads (reviewed by witten & huysseune 2009). totlanD et al. (2011) showed that the vertebral bone of post-smolt Atlantic salmon under increased mechanical load had a higher mineral content than the normal one. For the opercle, mechanical loading can be expected especially during respiration and suction feeding, as the opercle is being ventilated both passively (through the outflow of water from the buccal cavity) and actively (through contraction of opercular and hyoid muscles) (osse 1969; camP & BrainerD 2015; van wassenBergh 2015). It could be hypothesized that water quality could be influencing respiratory frequency and intensity, which would influence respiratory movements of the opercle and thus alter its mechanical loading regime.
This could explain why opercular deformities generally do not co-occur with other distinct skeletal deformities, but does not fit with the observation that unilateral deformities are not only common,
THUONG N.P. et al., A 3D quantitative method for analyzing bone mineral densities in Sparus aurata
160
Belg. J. Zool. 148 (2): 149–166 (2018)
but also that left-right opercular deformities are completely decoupled (verhaegen et al. 2007). Alternatively, the increased deformation as fish grow older may be a combined effect of environmental factors triggering early abnormal ossification and mechanically altered bone deposition, as already noted by KoumounDouros et al. (1997b). As a deviating opercular shape will result in the opercular cavity not being closed off properly, respiratory inflow (requiring the opercular slit to be sealed off) will be impaired (hunt von herBing et al. 1996). Because of the inward folding of the opercle, also the outward flow of the respiratory water during exhalation can be substantially impaired, as the water now pushes against this folded part (instead of flowing along the opercular medial face). Compensatory movements of the opercle and/or altered water flow may then mechanically induce continued abnormal bone formation. Some of these hypotheses could be further tested by simulating altered mechanical forces acting upon the opercle, and analysing to what degree regions of increased mechanical stress correspond to regions of increased BMD.
Faustino & Power (2001) mentioned that opercular ossification in gilthead sea bream starts at 3.7 mm notochord length (approximated SL 3.7 mm). Recently, thuong et al. (2017) showed that opercular ossification during early ontogeny is mainly localized at the periphery of the bone, including the distal margin enclosed in the opercular soft tissue flap (used to close off the gill cavity). One could argue that extended inward folding of this flap may be guiding osteoblast activity inward, leading to an inward folded distal opercular part. Whether the phenotypic deformity arises synchronously with the increased mineralization (vs mineralization only taking place later) remains, however, unknown.
The approach introduced in this study shows that it allows quantification of relative BMD levels within individual bones, in order to compare relationships between abnormal skeletal phenotypes and the internal distribution of BMD levels. The advantage is that this approach does not rely on the use of calibrated (and expensive) phantoms of various densities of calcium hydroxyapatite, and yet allows objective quantification of BMD levels in 3D. This is something that is impossible to achieve using in toto clearing and bone staining methods. Considering the inward folding of the opercle, a 2D quantification of a stained opercle would also only capture part of the mineralized bone (being the projected lateral view). Still, some caution has to be taken when applying the method introduced in this study. First, the level of detail in grey value variation that can be discriminated relies on the definition of the threshold levels for the different BMD levels. For that, a reference specimen has to be chosen for which it is assumed that it preferably covers the overall range of grey value ranges of the other specimens included in the comparison. The outcome of the analysis will thus depend on the selection of that reference specimen. For skeletal tissue, this will most likely not pose a problem, as mineralization levels can be considered to fall within a similar range. Only when comparing extremes of mineralized tissues, as for example non-mineralized bone resulting from a phosphorous deficient diet with a normal bone (witten et al. 2016), and using one of both as a reference, may the method be problematic. Despite this, the case study performed here indicates that performing quantitative analyses on BMD levels using micro-CT data has application potential for studying the effect of hatchery rearing conditions on skeletal development, albeit not really for high throughput screening of large sample sizes. Nutritional intake is one of the main factors that may impact bone cells, cartilage or bone matrix development and bone mineralization in reared fish larvae and juveniles (reviewed by Boglione et al. 2013b). Therefore, administering a diet supplemented with DHA or vitamins (e.g., vitamins A, C and D) would be an interesting way to test to what degree nutritional quality is a factor influencing bone mineralization in deformed opercles of farmed gilthead sea bream, relying on the here-applied methodology.
In conclusion, this study explores the potential of using micro-CT scanning for quantifying BMD levels in fish skeletal components, in order to detect abnormal patterns of mineralization during the early onset of opercular deformation in gilthead sea bream. This method allowed detection of increased BMD levels in abnormal bone phenotypes, even in juvenile fish of 61 DPH. Results show that the deformed opercle in both unilaterally- and bilaterally-deformed specimens had elevated BMD levels and that opercular deformations were not necessarily associated with similar mineralization patterns in other cranial bones,
161
but were increased in the otoliths. Finally, the limited sample size used in the current study prevented any statistical testing of the seemingly correlated traits, and thus did not allow us to expose the underlying causal mechanisms between opercular deformities and bone morphogenesis and mineralization.
Acknowledgements
We are especially grateful to the marine INVE hatchery (Maricoltura di Rosignano Solvay) for providing the specimens. We thanks also to the staff at UGCT, particularly Mr. Pieter Vanderniepen, for processing the micro-CT data. This work was financially supported by the scholarship program (no. 1081/QD-BGDDT) of Vietnam International Education Development (Ministry of Education and Training, Vietnam).
References
anDraDes J.a., Becerra J. & FernánDeZ-lleBreZ P. (1996). Skeletal deformities in larval, juvenile and adult stages of cultured gilthead sea bream (Sparus aurata L.). Aquaculture 141(1–2): 1–11. https://doi.org/10.1016/0044-8486(95)01226-5
anDreeva v., connolly m.h., stewart-swiFt c., Fraher D., Burt J., carDarelli J. & yelicK P.c. (2011). Identification of adult mineralized tissue zebrafish mutants. Genesis 49 (4): 360–366. https://doi.org/10.1002/dvg.20712
asharani P.v., KeuPP K., semler o., wang w.s., li y., thiele h., yigit g., Pohl e., BecKer J., Frommolt P., sonntag c., altmuller J., Zimmermann K., greensPan D.s., aKarsu n.a., netZer c., schonau e., wirth r., hammerschmiDt m., nurnBerg P., wollniK B. & carney t.J. (2012). Attenuated BMP1 function compromises osteogenesis, leading to bone fragility in humans and zebrafish. American Journal of Human Genetics 90 (4): 661–674.https://doi.org/10.1016/j.ajhg.2012.02.026
Bensimon-Brito a., carDeira J., Dionisio g., huysseune a., cancela m.l. & witten P.e. (2016). Revisiting in vivo staining with alizarin red S – a valuable approach to analyse zebrafish skeletal mineralization during development and regeneration. BMC Developmental Biology 16: 2. https://doi.org/10.1186/s12861-016-0102-4
BeralDo P. & canavese B. (2011). Recovery of opercular anomalies in gilthead sea bream, Sparus aurata L.: morphological and morphometric analysis. Journal of Fish Diseases 34 (1): 21–30. https://doi.org/10.1111/j.1365-2761.2010.01206.x
BeralDo P., Pinosa m., tiBalDi e. & canavese B. (2003). Abnormalities of the operculum in gilthead sea bream (Sparus aurata): morphological description. Aquaculture 220 (1–4): 89–99. https://doi.org/10.1016/S0044-8486(02)00416-7
Boglione c., gagliarDi F., scarDi m. & catauDella s. (2001). Skeletal descriptors and quality assessment in larvae and post-larvae of wild-caught and hatchery-reared gilthead sea bream (Sparus aurata L. 1758). Aquaculture 192 (1): 1–22. https://doi.org/10.1016/S0044-8486(00)00446-4
Boglione c., gisBert e., gavaia P., e. witten P., moren m., Fontagné s. & KoumounDouros g. (2013a). Skeletal anomalies in reared European fish larvae and juveniles. Part 2: main typologies, occurrences and causative factors. Reviews in Aquaculture 5: S121–S167.https://doi.org/10.1111/raq.12016
Boglione c., Paulo g., giorgos K., gisBert e., moren m., stePhanie F. & witten P.e. (2013b). Skeletal anomalies in reared European fish larvae and juveniles. Part 1: normal and anomalous skeletogenic processes. Reviews in Aquaculture 5: S99–S120. https://doi.org/10.1111/raq.12015
THUONG N.P. et al., A 3D quantitative method for analyzing bone mineral densities in Sparus aurata
162
Belg. J. Zool. 148 (2): 149–166 (2018)
Bruneel B. & witten P.e. (2015). Power and challenges of using zebrafish as a model for skeletal tissue imaging. Connective Tissue Research 56 (2): 161–173.https://doi.org/10.3109/03008207.2015.1013193
Burr D.B. (2002). Bone material properties and mineral matrix contributions to fracture risk or age in women and men. Journal of Musculoskeletal and Neuronal Interactions 2 (3): 201–204.
camP a.l. & BrainerD e.l. (2015). Reevaluating musculoskeletal linkages in suction-feeding fishes with X-Ray Reconstruction of Moving Morphology (XROMM). Integrative and Comparative Biology 55 (1): 36–47. https://doi.org/10.1093/icb/icv034
camPBell g.m. & soPhocleous a. (2014). Quantitative analysis of bone and soft tissue by micro-computed tomography: applications to ex vivo and in vivo studies. BoneKEy Reports 3: 564. https://doi.org/10.1038/bonekey.2014.59
castro J., Pino-QueriDo a., hermiDa m., chavarrías D., romero r., garcía-cortés l.a., toro m.a. & martíneZ P. (2008). Heritability of skeleton abnormalities (lordosis, lack of operculum) in gilthead seabream (Sparus aurata) supported by microsatellite family data. Aquaculture 279 (1–4): 18–22. https://doi.org/10.1016/j.aquaculture.2008.04.023
celenK c. & celenK P. (2012). Bone density measurement using computed tomography. In: Saba L. (eds) Computed Tomography-Clinical Applications: 123–136. IntechOpen, Rijeka, Croatia. https://doi.org/10.5772/22884
connolly m.h. & yelicK P.c. (2010). High-throughput methods for visualizing the teleost skeleton: capturing autofluorescence of alizarin red. Journal of Applied Ichthyology 26 (2): 274–277. https://doi.org/10.1111/j.1439-0426.2010.01419.x
Daoulas c., economou an & Bantavas i. (1991). Osteological abnormalities in laboratory reared sea-bass (Dicentrarchus labrax) fingerlings. Aquaculture 97 (2): 169–180.https://doi.org/10.1016/0044-8486(91)90263-7
Darias m.J., maZurais D., KoumounDouros g., le gall m.m., huelvan c., DesBruyeres e., QuaZuguel P., cahu c.l. & ZamBonino-inFante J.l. (2011). Imbalanced dietary ascorbic acid alters molecular pathways involved in skeletogenesis of developing European sea bass (Dicentrarchus labrax). Comparative Biochemistry and Physiology – Part A: Molecular & Integrative Physiology 159 (1): 46–55. https://doi.org/10.1016/j.cbpa.2011.01.013
DeBusschere e., hostens K., aDriaens D., amPe B., BottelDooren D., De BoecK g., De muyncK a., sinha a.K., vanDenDriessche s., van hooreBeKe l., vincx m. & Degraer s. (2016). Acoustic stress responses in juvenile sea bass Dicentrarchus labrax induced by offshore pile driving. Environmental Pollution 208 (B): 747–757. https://doi.org/10.1016/j.envpol.2015.10.055
Deuerling J.m., ruDy D.J., nieBur g.l. & roeDer r.K. (2010). Improved accuracy of cortical bone mineralization measured by polychromatic microcomputed tomography using a novel high mineral density composite calibration phantom. Medical Physics 37 (9): 5138–5145. https://doi.org/10.1118/1.3480507
Divanach P., Boglione c., menu B., KoumounDouros g., Kentouri m. & catauDella s. (1996). Abnormalities in finfish mariculture: an overview of the problem, causes and solutions. In: chatain B., saroglia m., sweetman J. & lavens L. (eds) Handbook of Contributions and Short Communications presented at the International Workshop on “Seabass and Seabream Culture: Problems and Prospects” Verona, Italy, October 16–18, 1996: 45–66. European Aquaculture Society, Oostende, Belgium.
eFimova o.i., KhleBniKov a.s., senin r.a., voronin P.a. & anoKhin K.v. (2013). Contrasting of biological samples for X-Ray synchrotron microtomography. Bulletin of Experimental Biology and Medicine 155 (4): 413–416.
163
Faustino m. & Power D.m. (2001). Osteologic development of the viscerocranial skeleton in sea bream: alternative ossification strategies in teleost fish. Journal of Fish Biology 58: 537–572. https://doi.org/10.1111/j.1095-8649.2001.tb02272.xFernánDeZ i., hontoria F., ortiZ-DelgaDo J.B., KotZamanis y., estéveZ a., ZamBonino-inFante J.l. & gisBert e. (2008). Larval performance and skeletal deformities in farmed gilthead sea bream (Sparus aurata) fed with graded levels of Vitamin A enriched rotifers (Brachionus plicatilis). Aquaculture 283 (1–4): 102–115. https://doi.org/10.1016/j.aquaculture.2008.06.037Fisher s., JagaDeeswaran P. & halPern m.e. (2003). Radiographic analysis of zebrafish skeletal defects. Developmental Biology 264 (1): 64–76.Fontagne s., silva n., BaZin D., ramos a., aguirre P., surget a., aBrantes a., KaushiK s.J. & Power D.m. (2009). Effects of dietary phosphorus and calcium level on growth and skeletal development in rainbow trout (Oncorhynchus mykiss) fry. Aquaculture 297 (1–4): 141–150. https://doi.org/10.1016/j.aquaculture.2009.09.022Francescon a., FreDDi a., BarBaro a. & giavenni r. (1988). Daurade Sparus aurata L. reproduite artificiellement et daurade sauvage. Expériences paralleles en diverses conditions d’élevage. Aquaculture 72 (3–4): 273–285. https://doi.org/10.1016/0044-8486(88)90216-5Fraser m.r. & De nys r. (2005). The morphology and occurrence of jaw and operculum deformities in cultured barramundi (Lates calcarifer) larvae. Aquaculture 250: 496–503.https://doi.org/10.1016/j.aquaculture.2005.04.067galeotti m., BeralDo P., De Dominis s., D’angelo l., BallestraZZi r., musetti r., PiZZolito s. & Pinosa m. (2000). A preliminary histological and ultrastructural study of opercular ano-malies in gilthead sea bream larvae (Sparus aurata). Fish Physiology and Biochemistry 22 (2): 151–157. https://doi.org/10.1023/A:1007883008076gignac P.m., Kley n.J., clarKe J.a., colBert m.w., morharDt a.c., cerio D., cost i.n., cox P.g., DaZa J.D., early c.m., echols m.s., henKelman r.m., herDina a.n., holliDay c.m., li Z., mahlow K., merchant s., muller J., orsBon c.P., Paluh D.J., thies m.l., tsai h.P. & witmer l.m. (2016). Diffusible iodine-based contrast-enhanced computed tomography (diceCT): an emerging tool for rapid, high-resolution, 3-D imaging of metazoan soft tissues. Journal of Anatomy 228 (6): 889–909. https://doi.org/10.1111/joa.12449glimcher m.J. (1998). Chapter 2 – The Nature of the Mineral Phase in Bone: Biological and Clinical Implications A2 – Avioli, Louis V. In: Krane S.M. (ed.) Metabolic Bone Disease and Clinically Related Disorders (3rd edition): 23–52e. Academic Press, San Diego.haga y., suZuKi t., KagechiKa h. & taKeuchi t. (2003). A retinoic acid receptor-selective agonist causes jaw deformity in the Japanese flounder, Paralichthys olivaceus. Aquaculture 221 (1–4): 381–392. https://doi.org/10.1016/S0044-8486(03)00076-0holmes g. (2012). The role of vertebrate models in understanding craniosynostosis. Child’s Nervous System 28 (9): 1471–1481. https://doi.org/10.1007/s00381-012-1844-3hosen m.J., vanaKKer o., willaert a., huysseune a., coucKe P. & De PaePe a. (2013). Zebrafish models for ectopic mineralization disorders: practical issues from morpholino design to post-injection observations. Frontiers in Genetics 4 (74): 1–17. https://doi.org/10.3389/fgene.2013.00074hunt von herBing i., miyaKe t., hall B.K. & Boutilier r.g. (1996). Ontogeny of feeding and respiration in larval Atlantic cod Gadus morhua (Teleostei, Gadiformes): I. Morphology. Journal of Morphology 227: 15–35.https://doi.org/10.1002/(SICI)1097-4687(199601)227:1<15::AID-JMOR2>3.0.CO;2-OKoumounDouros g. (2010). Morpho-anatomical abnormalities in Mediterranean marine aquaculture. In: KoumounDouros G. (ed.) Recent Advances in Aquaculture Research: 125–148. Transworld Research Network, Kerala, India.
THUONG N.P. et al., A 3D quantitative method for analyzing bone mineral densities in Sparus aurata
164
Belg. J. Zool. 148 (2): 149–166 (2018)
KoumounDouros g., gagliarDi F., Divanach P., Boglione c., catauDella s. & Kentouri m. (1997a). Normal and abnormal osteological development of caudal fin in Sparus aurata L. fry. Aquaculture 149 (3–4): 215–226. https://doi.org/10.1016/S0044-8486(96)01443-3KoumounDouros g., oran g., Divanach P., steFanaKis s. & Kentouri m. (1997b). The opercular complex deformity in intensive gilthead sea bream (Sparus aurata L.) larviculture. Moment of apparition and description. Aquaculture 156 (1–2): 165–177. https://doi.org/10.1016/S0044-8486(97)89294-0lall s.P. & lewis-mccrea l.m. (2007). Role of nutrients in skeletal metabolism and pathology in fish — An overview. Aquaculture 267 (1–4): 3–19. https://doi.org/10.1016/j.aquaculture.2007.02.053mahamiD J., aichmayer B., shimoni e., ZiBlat r., li c.h., siegel s., Paris o., FratZl P., weiner s. & aDDaDi l. (2010). Mapping amorphous calcium phosphate transformation into crystalline mineral from the cell to the bone in zebrafish fin rays. Proceedings of the National Academy of Sciences of the United States of America 107 (14): 6316–6321. https://doi.org/10.1073/pnas.0914218107masschaele B.c., cnuDDe v., DiericK m., JacoBs P., van hooreBeKe l. & vlassenBroecK J. (2007). UGCT: New X-ray radiography and tomography facility. Nuclear Instruments and Methods in Physics Research Section A: Accelerators, Spectrometers, Detectors and Associated Equipment 580 (1): 266–269. https://doi.org/10.1016/j.nima.2007.05.099morel c., aDriaens D., Boone m., De wolF t., van hooreBeKe l. & sorgeloos P. (2010). Visualizing mineralization in deformed opercular bones of larval gilthead sea bream (Sparus aurata). Journal of Applied Ichthyology 26 (2): 278–279. https://doi.org/10.1111/j.1439-0426.2010.01420.xneues F. & ePPle m. (2008). X-ray microcomputer tomography for the study of biomineralized endo- and exoskeletons of animals. Chemical Reviews 108 (11): 4734–4741.https://doi.org/10.1021/cr078250mnorDviK K., Kryvi h., totlanD g.K. & grotmol s. (2005). The salmon vertebral body develops through mineralization of two preformed tissues that are encompassed by two layers of bone. Journal of Anatomy 206 (2): 103–114. https://doi.org/10.1111/j.1469-7580.2005.00372.xortiZ-DelgaDo J.B., FernánDeZ i., sarasQuete c. & gisBert e. (2014). Normal and histopathological organization of the opercular bone and vertebrae in gilthead sea bream Sparus aurata. Aquatic Biology 21 (1): 67–84. https://doi.org/10.3354/ab00568osse J.w.m. (1969). Functional morphology of the head of the perch (Perca fluviatilis L.): an electromyographical study. Netherlands Journal of Zoology 19 (3): 289–392.PaPerna i. (1978). Swimbladder and skeletal deformations in hatchery bred Sparus aurata. Journal of Fish Biology 12 (2): 109–114. https://doi.org/10.1111/j.1095-8649.1978.tb04157.xParKinson i.h., BaDiei a. & FaZZalari n.l. (2008). Variation in segmentation of bone from micro-CT imaging: implications for quantitative morphometric analysis. Australasian Physical & Engineering Sciences in Medicine 31 (2): 160–164. https://doi.org/10.1007/BF03178592Prestinicola l., Boglione c., maKriDis P., sPanò a., rimatori v., Palamara e., scarDi m. & catauDella s. (2013). Environmental conditioning of skeletal anomalies typology and frequency in gilthead seabream (Sparus aurata L., 1758) juveniles. PLoS ONE 8 (2): e55736.https://doi.org/10.1371/journal.pone.0055736 Prestinicola l., Boglione c. & catauDella s. (2014). Relationship between uninflated swim bladder and skeletal anomalies in reared gilthead seabream (Sparus aurata). Aquaculture 432: 462–469. https://doi.org/10.1016/j.aquaculture.2014.06.020Puchtler h., meloan s.n. & terry m.s. (1969). On the history and mechanism of alizarin and alizarin red S stains for calcium. Journal of Histochemistry and Cytochemistry 17 (2): 110–124. https://doi.org/10.1177/17.2.110
165
rauch F. & schoenau e. (2002). Skeletal development in premature infants: a review of bone physiology beyond nutritional aspects. Archives of Disease in Childhood - Fetal and Neonatal Edition 86 (2): F82–F85.shKil F.n., stolero B., sutton g.a., aBDissa B.B., Dmitriev s.g. & shahar r. (2014). Effects of thyroid hormone treatment on the mineral density and mechanical properties of the African barb (Labeobarbus intermedius) skeleton. Journal of Applied Ichthyology 30 (4): 814–820. https://doi.org/10.1111/jai.12537thuong n.P., verstraeten B., Kegel B.D., christiaens J., wolF t.D., sorgeloos P., Bonte D. & aDriaens D. (2017). Ontogenesis of opercular deformities in gilthead sea bream Sparus aurata: a histological description. Journal of Fish Biology 91 (5): 1419–1434. https://doi.org/10.1111/jfb.13460totlanD g.K., FJellDal P.g., Kryvi h., løKKa g., wargelius a., sagstaD a., hansen t. & grotmol s. (2011). Sustained swimming increases the mineral content and osteocyte density of salmon vertebral bone. Journal of Anatomy 219 (4): 490–501. https://doi.org/10.1111/j.1469-7580.2011.01399.xturner c.h. (2006). Bone strength: current concepts. Annals of the New York Academy of Sciences 1068 (1): 429–446.van wassenBergh s. (2015). A solution strategy to include the opening of the opercular slits in moving-mesh CFD models of suction feeding. Integrative and Comparative Biology 55 (1): 62–73. https://doi.org/10.1093/icb/icv031verhaegen y., aDriaens D., wolF t.D., Dhert P. & sorgeloos P. (2007). Deformities in larval gilthead sea bream (Sparus aurata): A qualitative and quantitative analysis using geometric morphometrics. Aquaculture 268 (1–4): 156–168. https://doi.org/10.1016/j.aquaculture.2007.04.037villeneuve l., gisBert e., Delliou h.l., cahu c.l. & ZamBonino-inFante J.l. (2005). Dietary levels of all-trans retinol affect retinoid nuclear receptor expression and skeletal development in European sea bass larvae. British Journal of Nutrition 93 (6): 791–801.vlassenBroecK J., DiericK m., masschaele B., cnuDDe v., van hooreBeKe l. & JacoBs P. (2007). Software tools for quantification of X-ray microtomography at the UGCT. Nuclear Instruments and Methods in Physics Research Section A: Accelerators, Spectrometers, Detectors and Associated Equipment 580 (1): 442–445. https://doi.org/10.1016/j.nima.2007.05.073wagner r., van loo D., hossler F., cZymmeK K., Pauwels e. & van hooreBeKe l. (2011). High-resolution imaging of kidney vascular corrosion casts with nano-CT. Microscopy and Microanalysis 17 (2): 215–219. https://doi.org/10.1017/S1431927610094201walKer m.B. & Kimmel c.B. (2007). A two-color acid-free cartilage and bone stain for zebrafish larvae. Biotechnic & Histochemistry 82 (1): 23–28. https://doi.org/10.1080/10520290701333558witten P.e. & huysseune a. (2009). A comparative view on mechanisms and functions of skeletal remodelling in teleost fish, with special emphasis on osteoclasts and their function. Biological Reviews 84 (2): 315–346. https://doi.org/10.1111/j.1469-185X.2009.00077.xwitten P.e., owen m.a., Fontanillas r., soenens m., mcgurK c. & oBach a. (2016). A primary phosphorus-deficient skeletal phenotype in juvenile Atlantic salmon Salmo salar: the uncoupling of bone formation and mineralization. Journal of Fish Biology 88 (2): 690–708.https://doi.org/10.1111/jfb.12870yelicK P.c. & connolly m.h. (2010). A forward genetic screen for genes regulating mineralized tooth and bone formation in zebrafish (Danio rerio). Journal of Applied Ichthyology 26 (2): 192–195. https://doi.org/10.1111/j.1439-0426.2010.01403.xZanette i., DaghFous g., weitKamP t., gillet B., aDriaens D., langer m., cloetens P., helFen l., Bravin a., Peyrin F., BaumBach t., Dischler J.-m., van loo D., Praet t., Poirier-Quinot m. & Boistel r. (2014). Looking inside marine organisms with MRI and
THUONG N.P. et al., A 3D quantitative method for analyzing bone mineral densities in Sparus aurata
166
Belg. J. Zool. 148 (2): 149–166 (2018)
X-ray tomography. In: reynauD E.G. (ed.) Imaging Marine Life: 123–186. Wiley & Sons. https://doi.org/10.1002/9783527675418.ch7
Manuscript received: 10 April 2018Manuscript accepted: 29 October 2018Published on: 10 December 2018Branch editor: Isa Schön