Embed Size (px)
DESCRIPTION
Hilton Managerial Accounting solutions manual
Citation preview
McGraw-Hill/Irwin 2011 The McGraw-Hill Companies, Inc.
Managerial Accounting, 9/e Global Edition 7-1
CHAPTER 7 Cost-Volume-Profit Analysis
ANSWERS TO REVIEW QUESTIONS
7-1 a. In the contribution-margin approach, the break-even point in units is calculated using the following formula:
margin oncontributiunit
expenses fixed point even-Break
b. In the equation approach, the following profit equation is used:
units in
volumesales
expense
bleunit varia
units in
volumesales
price sales
unit
fixed expenses 0
This equation is solved for the sales volume in units.
c. In the graphical approach, sales revenue and total expenses are graphed. The break-even point occurs at the intersection of the total revenue and total expense lines.
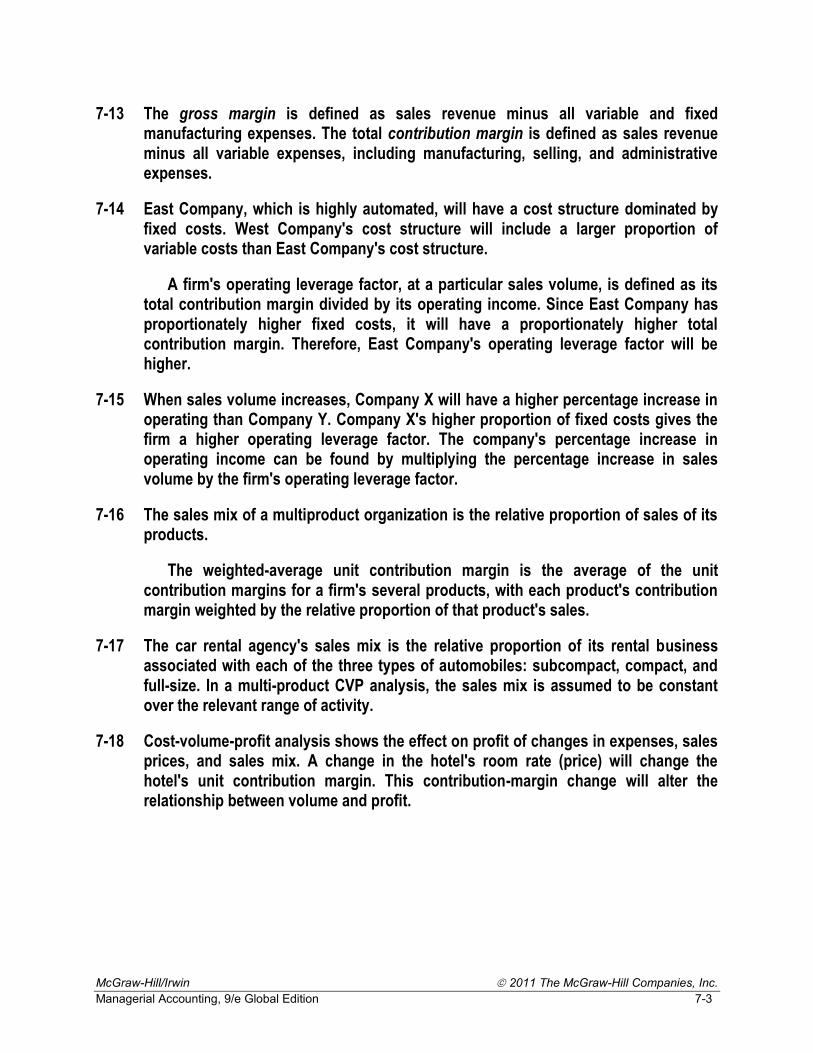
7-2 The term unit contribution margin refers to the contribution that each unit of sales makes toward covering fixed expenses and earning a profit. The unit contribution margin is defined as the sales price minus the unit variable expense.
7-3 In addition to the break-even point, a CVP graph shows the impact on total expenses, total revenue, and profit when sales volume changes. The graph shows the sales volume required to earn a particular target net profit. The firm's profit and loss areas are also indicated on a CVP graph.
7-4 The safety margin is the amount by which budgeted sales revenue exceeds break-even sales revenue.
7-5 An increase in the fixed expenses of any enterprise will increase its break-even point. In a travel agency, more clients must be served before the fixed expenses are covered by the agency's service fees.
7-6 A decrease in the variable expense per pound of oysters results in an increase in the contribution margin per pound. This will reduce the company's break-even sales volume.
McGraw-Hill/Irwin 2011 The McGraw-Hill Companies, Inc.
7-2 Solutions Manual
7-7 The president is correct. A price increase results in a higher unit contribution margin. An increase in the unit contribution margin causes the break-even point to decline.
The financial vice president's reasoning is flawed. Even though the break-even point will be lower, the price increase will not necessarily reduce the likelihood of a loss. Customers will probably be less likely to buy the product at a higher price. Thus, the firm may be less likely to meet the lower break-even point (at a high price) than the higher break-even point (at a low price).
7-8 When the sales price and unit variable cost increase by the same amount, the unit contribution margin remains unchanged. Therefore, the firm's break-even point remains the same.
7-9 The fixed annual donation will offset some of the museum's fixed expenses. The reduction in net fixed expenses will reduce the museum's break-even point.
7-10 A profit-volume graph shows the profit to be earned at each level of sales volume.
7-11 The most important assumptions of a cost-volume-profit analysis are as follows:
(a) The behavior of total revenue is linear (straight line) over the relevant range. This behavior implies that the price of the product or service will not change as sales volume varies within the relevant range.
(b) The behavior of total expenses is linear (straight line) over the relevant range. This behavior implies the following more specific assumptions:
(1) Expenses can be categorized as fixed, variable, or semivariable.
(2) Efficiency and productivity are constant.
(c) In multiproduct organizations, the sales mix remains constant over the relevant range.
(d) In manufacturing firms, the inventory levels at the beginning and end of the period are the same.
7-12 Operating managers frequently prefer the contribution income statement because it separates fixed and variable costs. This format makes cost-volume-profit relationships more readily discernible.
McGraw-Hill/Irwin 2011 The McGraw-Hill Companies, Inc.
Managerial Accounting, 9/e Global Edition 7-3
7-13 The gross margin is defined as sales revenue minus all variable and fixed manufacturing expenses. The total contribution margin is defined as sales revenue minus all variable expenses, including manufacturing, selling, and administrative expenses.
7-14 East Company, which is highly automated, will have a cost structure dominated by fixed costs. West Company's cost structure will include a larger proportion of variable costs than East Company's cost structure.
A firm's operating leverage factor, at a particular sales volume, is defined as its total contribution margin divided by its operating income. Since East Company has proportionately higher fixed costs, it will have a proportionately higher total contribution margin. Therefore, East Company's operating leverage factor will be higher.
7-15 When sales volume increases, Company X will have a higher percentage increase in operating than Company Y. Company X's higher proportion of fixed costs gives the firm a higher operating leverage factor. The company's percentage increase in operating income can be found by multiplying the percentage increase in sales volume by the firm's operating leverage factor.
7-16 The sales mix of a multiproduct organization is the relative proportion of sales of its products.
The weighted-average unit contribution margin is the average of the unit contribution margins for a firm's several products, with each product's contribution margin weighted by the relative proportion of that product's sales.
7-17 The car rental agency's sales mix is the relative proportion of its rental business associated with each of the three types of automobiles: subcompact, compact, and full-size. In a multi-product CVP analysis, the sales mix is assumed to be constant over the relevant range of activity.
7-18 Cost-volume-profit analysis shows the effect on profit of changes in expenses, sales prices, and sales mix. A change in the hotel's room rate (price) will change the hotel's unit contribution margin. This contribution-margin change will alter the relationship between volume and profit.
McGraw-Hill/Irwin 2011 The McGraw-Hill Companies, Inc.
7-4 Solutions Manual
7-19 Budgeting begins with a sales forecast. Cost-volume-profit analysis can be used to determine the profit that will be achieved at the budgeted sales volume. A CVP analysis also shows how profit will change if the sales volume deviates from budgeted sales.
Cost-volume-profit analysis can be used to show the effect on profit when variable or fixed expenses change. The effect on profit of changes in variable or fixed advertising expenses is one factor that management would consider in making a decision about advertising.
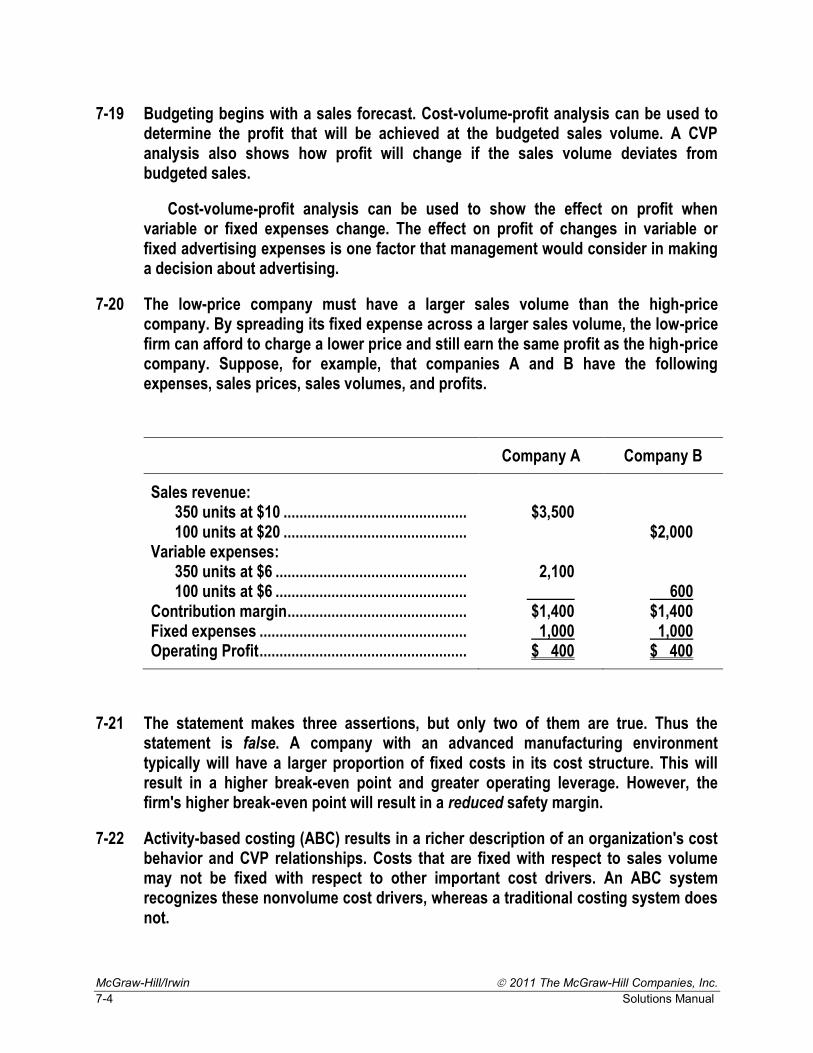
7-20 The low-price company must have a larger sales volume than the high-price company. By spreading its fixed expense across a larger sales volume, the low-price firm can afford to charge a lower price and still earn the same profit as the high-price company. Suppose, for example, that companies A and B have the following expenses, sales prices, sales volumes, and profits.
Company A Company B
Sales revenue: 350 units at $10 .............................................. 100 units at $20 .............................................. Variable expenses: 350 units at $6 ................................................ 100 units at $6 ................................................ Contribution margin ............................................. Fixed expenses .................................................... Operating Profit ....................................................
$3,500 2,100 $1,400 1,000 $ 400
$2,000 600 $1,400 1,000 $ 400
7-21 The statement makes three assertions, but only two of them are true. Thus the statement is false. A company with an advanced manufacturing environment typically will have a larger proportion of fixed costs in its cost structure. This will result in a higher break-even point and greater operating leverage. However, the firm's higher break-even point will result in a reduced safety margin.
7-22 Activity-based costing (ABC) results in a richer description of an organization's cost behavior and CVP relationships. Costs that are fixed with respect to sales volume may not be fixed with respect to other important cost drivers. An ABC system recognizes these nonvolume cost drivers, whereas a traditional costing system does not.
McGraw-Hill/Irwin 2011 The McGraw-Hill Companies, Inc.
Managerial Accounting, 9/e Global Edition 7-5
SOLUTIONS TO EXERCISES
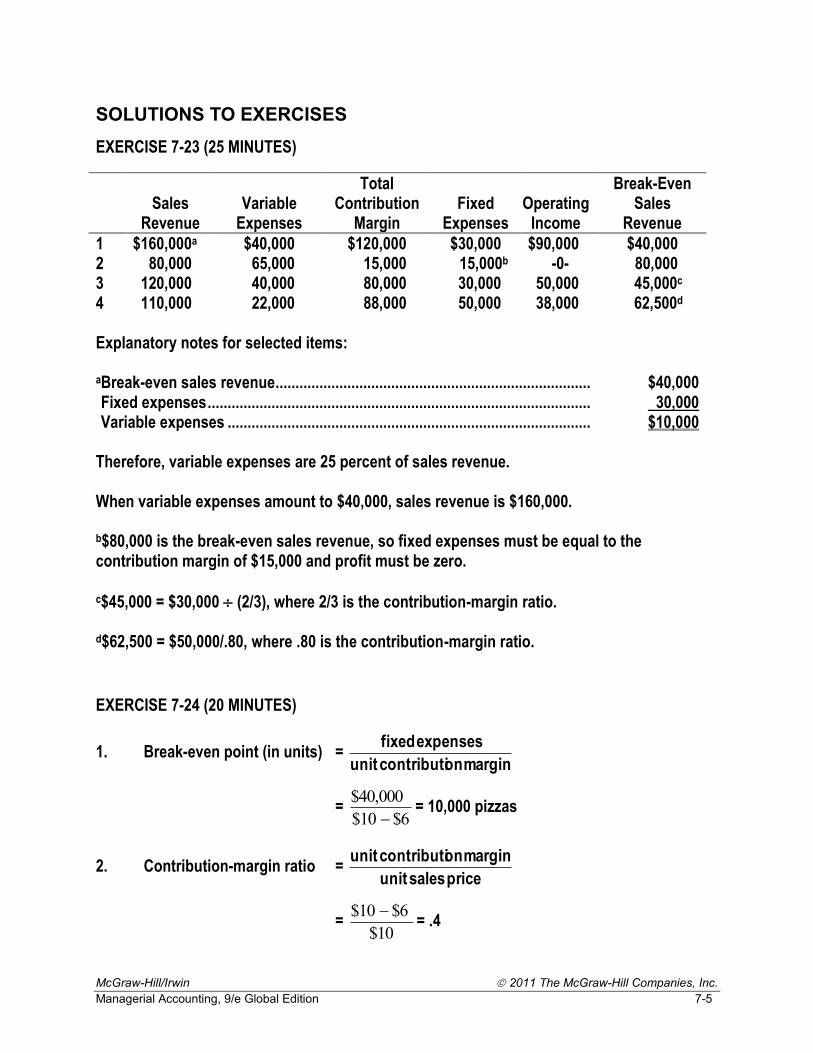
EXERCISE 7-23 (25 MINUTES)
Sales
Revenue
Variable
Expenses
Total Contribution
Margin
Fixed
Expenses
Operating
Income
Break-Even Sales
Revenue
1 $160,000a $40,000 $120,000 $30,000 $90,000 $40,000 2 80,000 65,000 15,000 15,000b -0- 80,000 3 120,000 40,000 80,000 30,000 50,000 45,000c 4 110,000 22,000 88,000 50,000 38,000 62,500d Explanatory notes for selected items: aBreak-even sales revenue ............................................................................... $40,000 Fixed expenses ................................................................................................ 30,000 Variable expenses ........................................................................................... $10,000 Therefore, variable expenses are 25 percent of sales revenue. When variable expenses amount to $40,000, sales revenue is $160,000. b$80,000 is the break-even sales revenue, so fixed expenses must be equal to the contribution margin of $15,000 and profit must be zero. c$45,000 = $30,000 (2/3), where 2/3 is the contribution-margin ratio.
d$62,500 = $50,000/.80, where .80 is the contribution-margin ratio.
EXERCISE 7-24 (20 MINUTES)
1. Break-even point (in units) = margin oncontributiunit
expenses fixed
= $6$10
$40,000
= 10,000 pizzas
2. Contribution-margin ratio = price salesunit
margin oncontributiunit
= $10
$6$10 = .4
McGraw-Hill/Irwin 2011 The McGraw-Hill Companies, Inc.
7-6 Solutions Manual
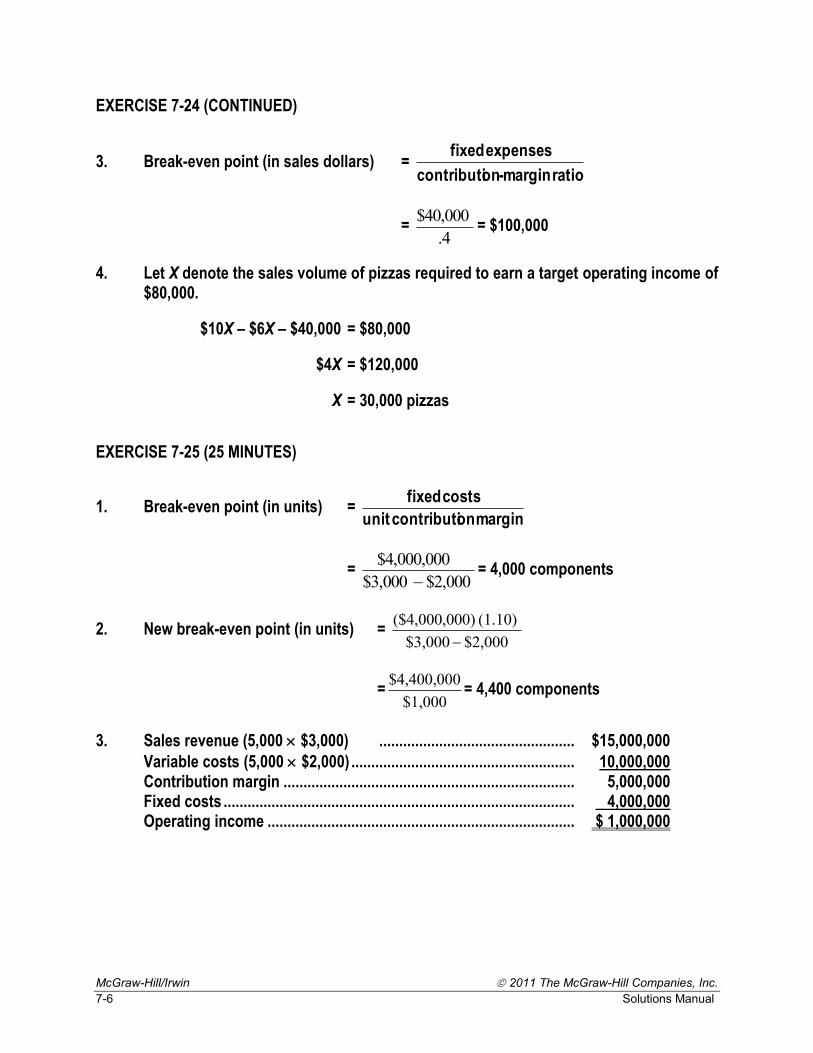
EXERCISE 7-24 (CONTINUED)
3. Break-even point (in sales dollars) = ratio margin-oncontributi
expenses fixed
= .4
$40,000= $100,000
4. Let X denote the sales volume of pizzas required to earn a target operating income of $80,000.
$10X – $6X – $40,000 = $80,000
$4X = $120,000
X = 30,000 pizzas
EXERCISE 7-25 (25 MINUTES)
1. Break-even point (in units) = margin oncontributiunit
costs fixed
= $2,000 $3,000
$4,000,000
= 4,000 components
2. New break-even point (in units) = $2,000 $3,000
(1.10) 0)($4,000,00
=$1,000
$4,400,000= 4,400 components
3. Sales revenue (5,000 $3,000) ................................................. $15,000,000
Variable costs (5,000 $2,000) ........................................................ 10,000,000 Contribution margin ......................................................................... 5,000,000 Fixed costs ........................................................................................ 4,000,000 Operating income ............................................................................. $ 1,000,000
McGraw-Hill/Irwin 2011 The McGraw-Hill Companies, Inc.
Managerial Accounting, 9/e Global Edition 7-7
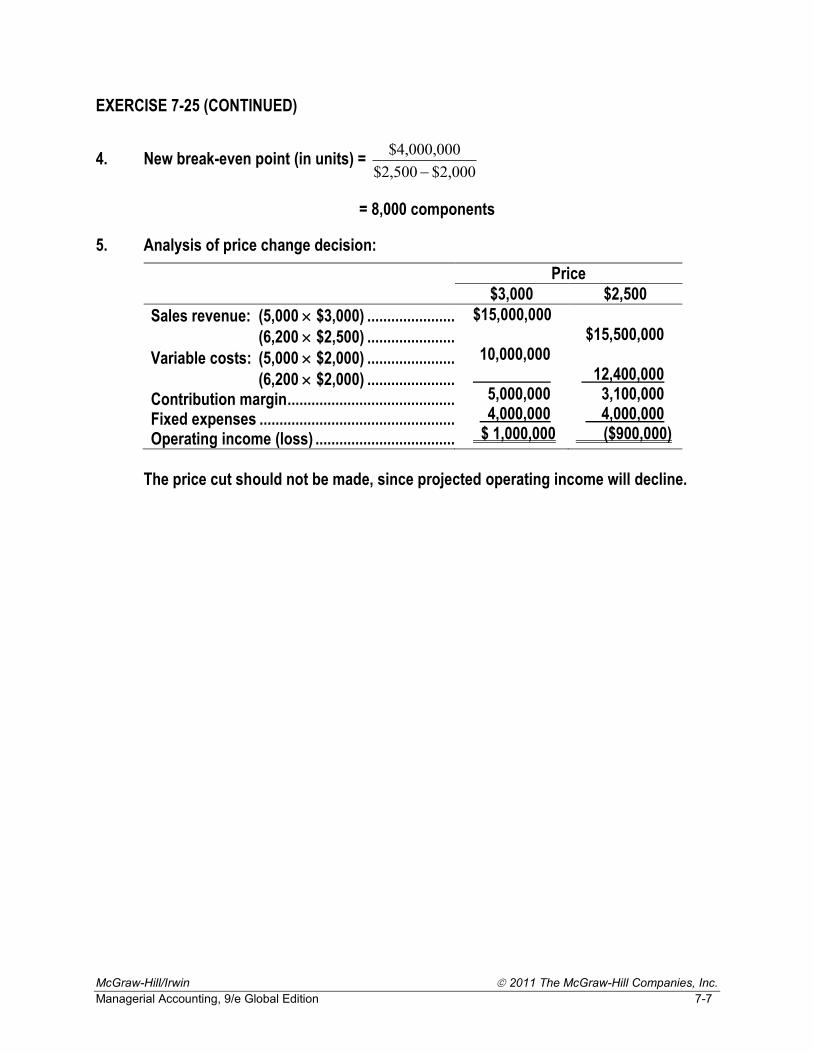
EXERCISE 7-25 (CONTINUED)
4. New break-even point (in units) = $2,000 $2,500
$4,000,000
= 8,000 components
5. Analysis of price change decision:
Price
$3,000 $2,500
Sales revenue: (5,000 $3,000) ................................
(6,200 $2,500) ................................
Variable costs: (5,000 $2,000) ................................
(6,200 $2,000) ................................ Contribution margin .................................................... Fixed expenses ........................................................... Operating income (loss) .............................................
$15,000,000 10,000,000 5,000,000 4,000,000 $ 1,000,000
$15,500,000
12,400,000 3,100,000 4,000,000
($900,000)
The price cut should not be made, since projected operating income will decline.
McGraw-Hill/Irwin 2011 The McGraw-Hill Companies, Inc.
7-8 Solutions Manual
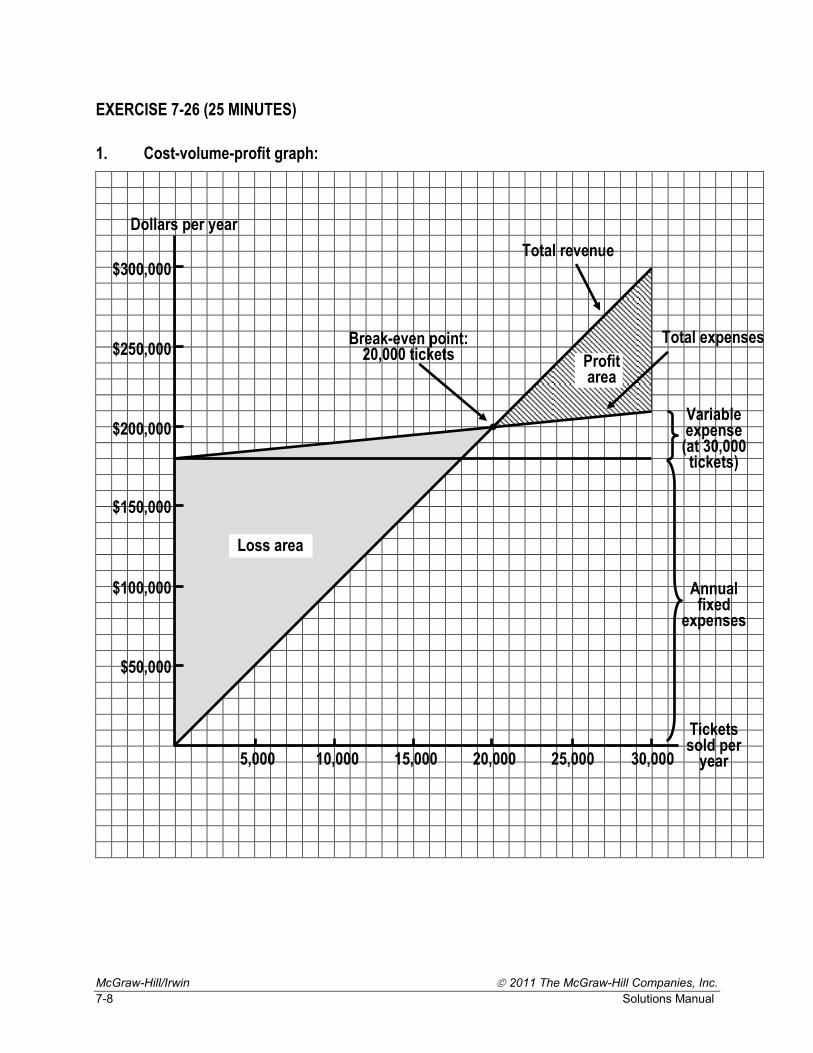
EXERCISE 7-26 (25 MINUTES)
1. Cost-volume-profit graph:
Break-even point: 20,000 tickets
Total revenue
Total expenses
Variable expense (at 30,000 tickets)
Annual fixed
expenses
Tickets sold per
year 5,000 10,000 15,000 20,000 25,000 30,000
Dollars per year
$300,000
$250,000
$200,000
$150,000
$100,000
$50,000
Profit area
Loss area
McGraw-Hill/Irwin 2011 The McGraw-Hill Companies, Inc.
Managerial Accounting, 9/e Global Edition 7-9
EXERCISE 7-26 (CONTINUED)
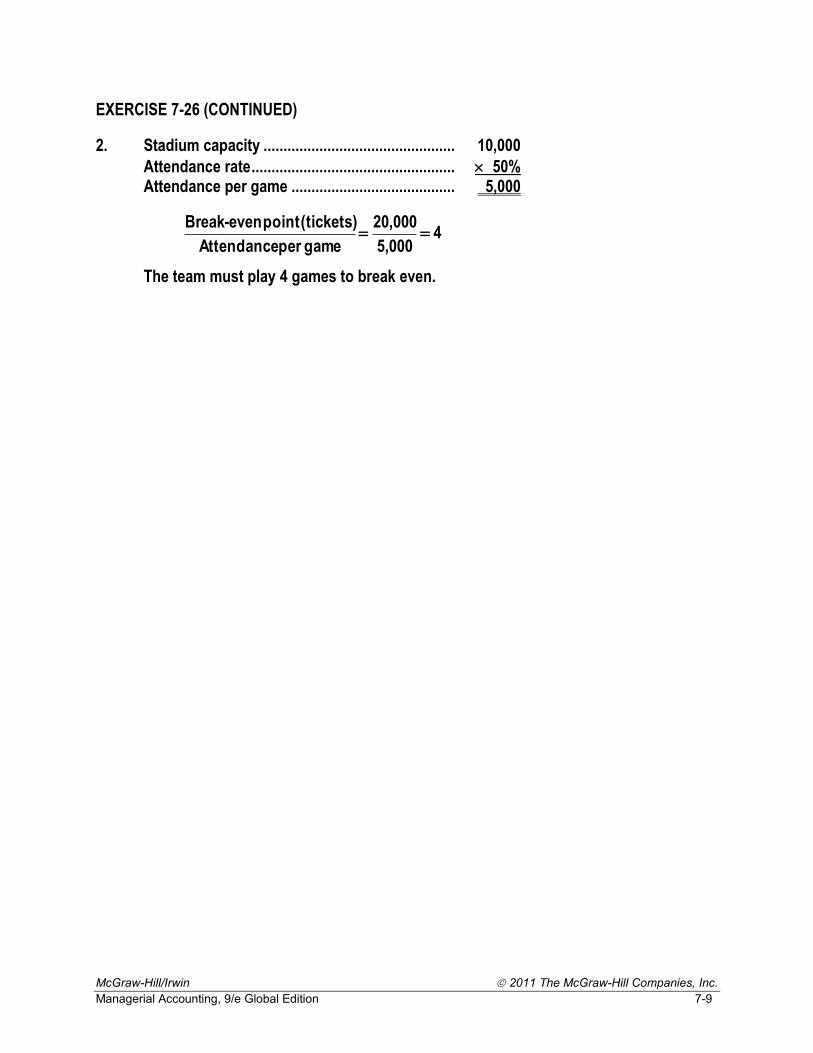
2. Stadium capacity ................................................ 10,000
Attendance rate ................................................... 50% Attendance per game ......................................... 5,000
The team must play 4 games to break even.
4 5,000
20,000
game per Attendance
(tickets)point even-Break
McGraw-Hill/Irwin 2011 The McGraw-Hill Companies, Inc.
7-10 Solutions Manual
EXERCISE 7-27 (25 MINUTES)
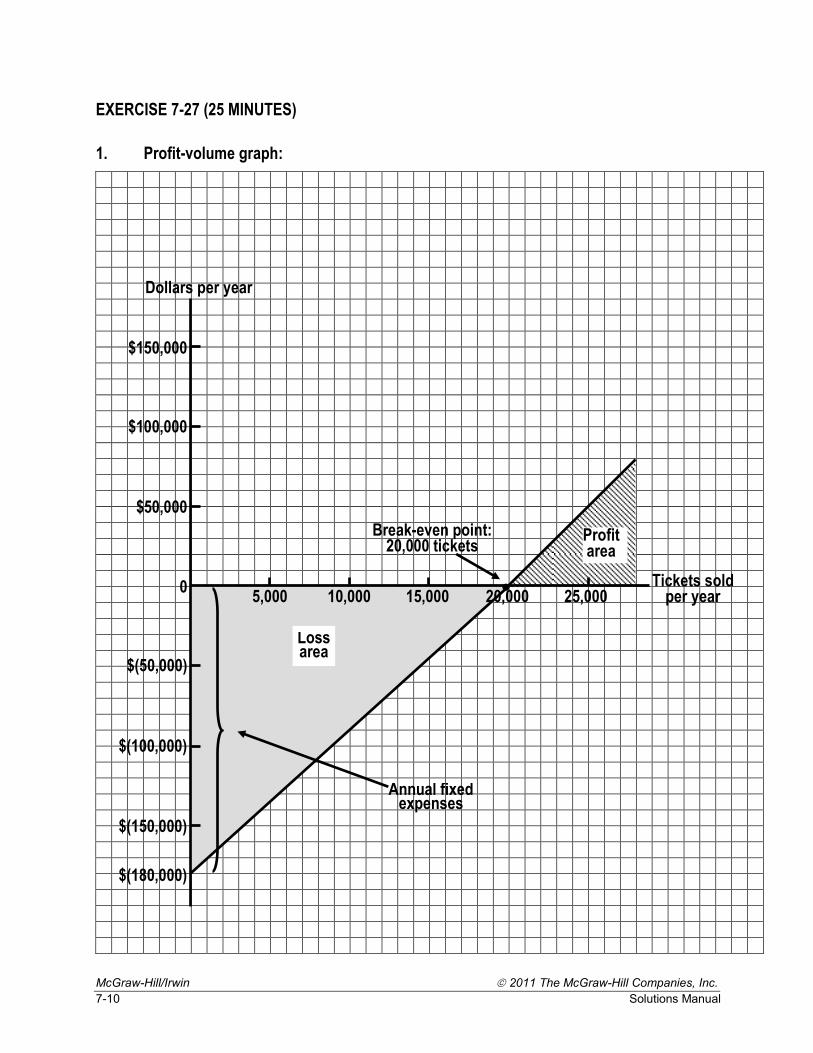
1. Profit-volume graph:
Dollars per year
$150,000
$100,000
$50,000
0
$(50,000)
$(100,000)
$(150,000)
$(180,000)
Annual fixed expenses
Tickets sold per year
Break-even point: 20,000 tickets
Profit area
Loss area
5,000 10,000 15,000 20,000 25,000
McGraw-Hill/Irwin 2011 The McGraw-Hill Companies, Inc.
Managerial Accounting, 9/e Global Edition 7-11
EXERCISE 7-27 (CONTINUED)
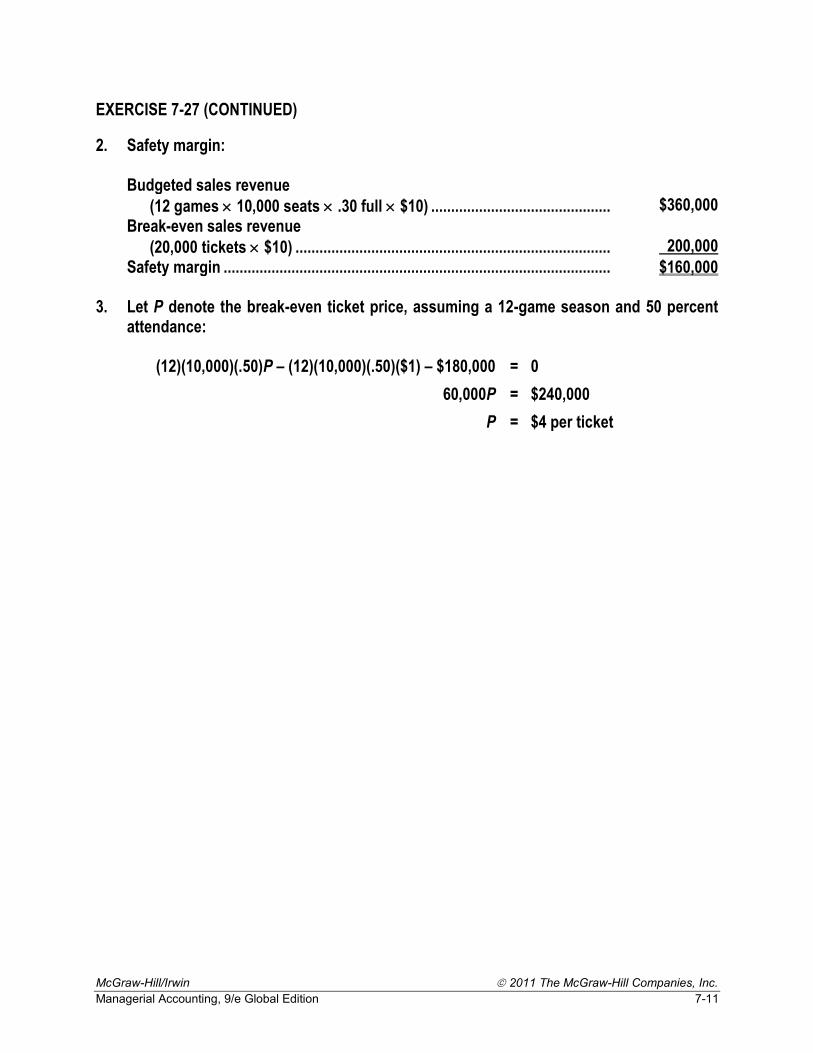
2. Safety margin:
Budgeted sales revenue (12 games 10,000 seats .30 full $10) ............................................. $360,000
Break-even sales revenue (20,000 tickets $10) ............................................................................... 200,000
Safety margin ................................................................................................. $160,000 3. Let P denote the break-even ticket price, assuming a 12-game season and 50 percent
attendance: (12)(10,000)(.50)P – (12)(10,000)(.50)($1) – $180,000 = 0
60,000P = $240,000
P = $4 per ticket
McGraw-Hill/Irwin 2011 The McGraw-Hill Companies, Inc.
7-12 Solutions Manual
EXERCISE 7-28 (25 MINUTES)
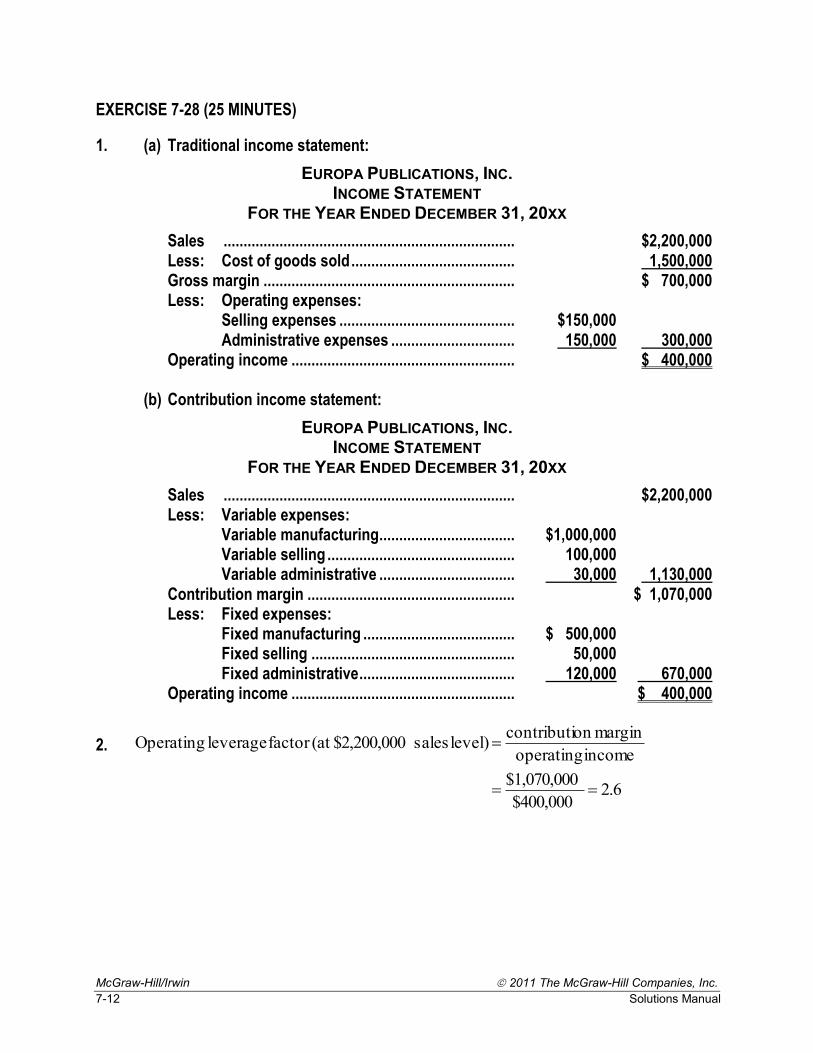
1. (a) Traditional income statement:
EUROPA PUBLICATIONS, INC. INCOME STATEMENT
FOR THE YEAR ENDED DECEMBER 31, 20XX
Sales ......................................................................... $2,200,000 Less: Cost of goods sold ......................................... 1,500,000 Gross margin ............................................................... $ 700,000 Less: Operating expenses: Selling expenses ............................................ $150,000 Administrative expenses ............................... 150,000 300,000 Operating income ........................................................ $ 400,000
(b) Contribution income statement:
EUROPA PUBLICATIONS, INC. INCOME STATEMENT
FOR THE YEAR ENDED DECEMBER 31, 20XX
Sales ......................................................................... $2,200,000 Less: Variable expenses: Variable manufacturing.................................. $1,000,000 Variable selling ............................................... 100,000 Variable administrative .................................. 30,000 1,130,000 Contribution margin .................................................... $ 1,070,000 Less: Fixed expenses: Fixed manufacturing ...................................... $ 500,000 Fixed selling ................................................... 50,000 Fixed administrative ....................................... 120,000 670,000 Operating income ........................................................ $ 400,000
2.
2.6 $400,000
$1,070,000
income operating
marginon contributi level) sales $2,200,000(at factor leverage Operating
McGraw-Hill/Irwin 2011 The McGraw-Hill Companies, Inc.
Managerial Accounting, 9/e Global Edition 7-13
EXERCISE 7-28 (CONTINUED)
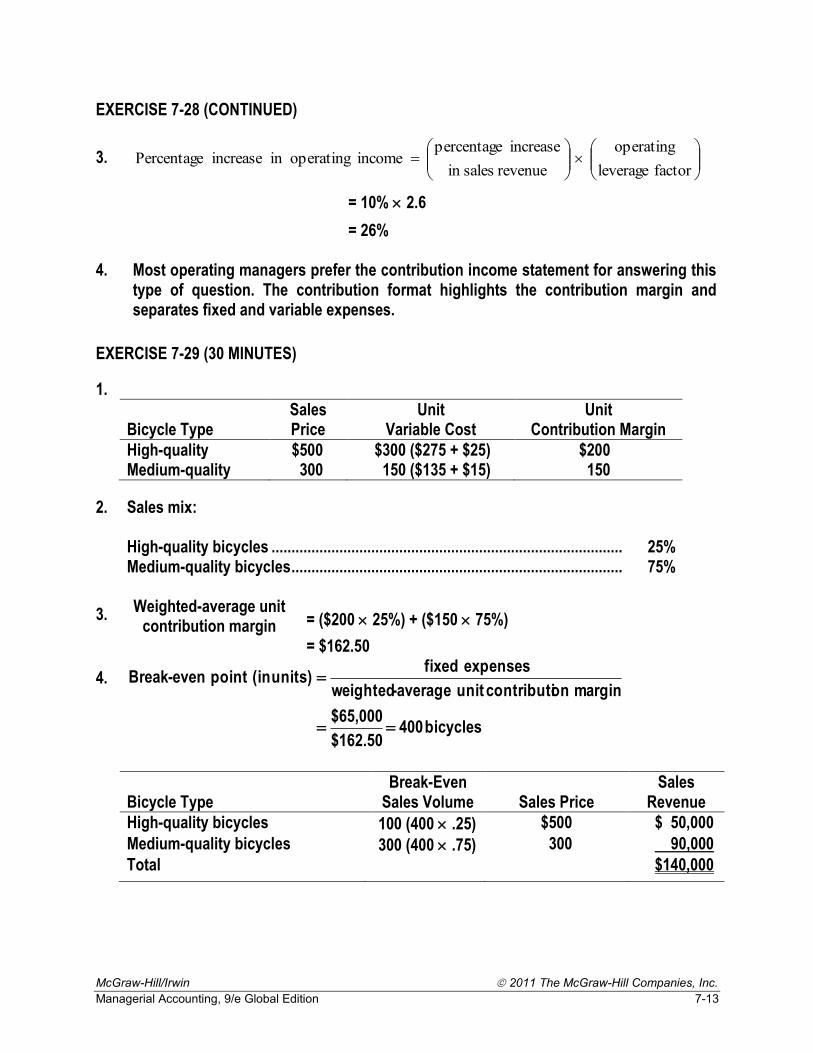
3.
factor leverage
operating
revenue salesin
increase percentage income operatingin increase Percentage
= 10% 2.6
= 26% 4. Most operating managers prefer the contribution income statement for answering this
type of question. The contribution format highlights the contribution margin and separates fixed and variable expenses.
EXERCISE 7-29 (30 MINUTES)
1.
Bicycle Type
Sales Price
Unit Variable Cost
Unit Contribution Margin
High-quality $500 $300 ($275 + $25) $200 Medium-quality 300 150 ($135 + $15) 150
2. Sales mix: High-quality bicycles ........................................................................................ 25% Medium-quality bicycles ................................................................................... 75%
3. Weighted-average unit contribution margin = ($200 25%) + ($150 75%)
= $162.50
4.
bicycles 400 $162.50
$65,000
margin oncontributiunit average-weighted
expenses fixed units) (inpoint even-Break
Bicycle Type
Break-Even Sales Volume
Sales Price
Sales Revenue
High-quality bicycles 100 (400 .25) $500 $ 50,000
Medium-quality bicycles 300 (400 .75) 300 90,000
Total $140,000
McGraw-Hill/Irwin 2011 The McGraw-Hill Companies, Inc.
7-14 Solutions Manual
EXERCISE 7-29 (CONTINUED)
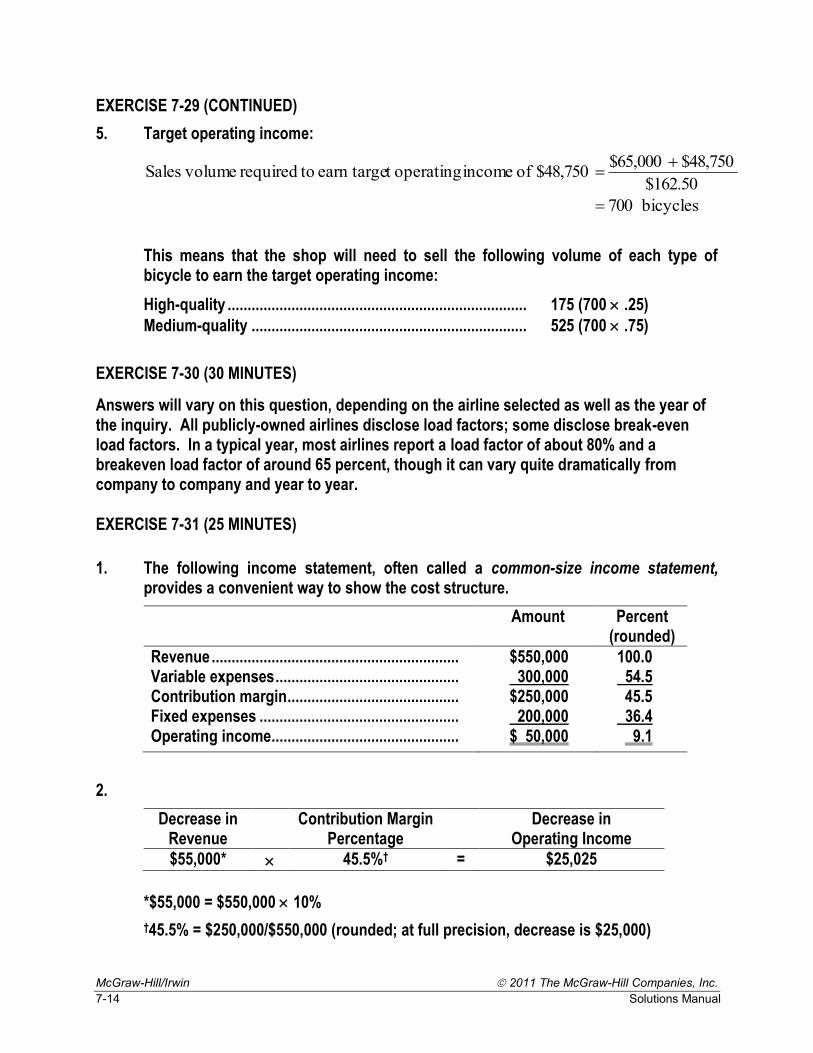
5. Target operating income:
bicycles 700
$162.50
$48,750 $65,000 $48,750 of income operatingt earn targe torequired volumeSales
This means that the shop will need to sell the following volume of each type of bicycle to earn the target operating income:
High-quality ........................................................................... 175 (700 .25)
Medium-quality ..................................................................... 525 (700 .75)
EXERCISE 7-30 (30 MINUTES)
Answers will vary on this question, depending on the airline selected as well as the year of the inquiry. All publicly-owned airlines disclose load factors; some disclose break-even load factors. In a typical year, most airlines report a load factor of about 80% and a breakeven load factor of around 65 percent, though it can vary quite dramatically from company to company and year to year.
EXERCISE 7-31 (25 MINUTES)
1. The following income statement, often called a common-size income statement, provides a convenient way to show the cost structure.
Amount Percent (rounded)
Revenue .............................................................. $550,000 100.0 Variable expenses .............................................. 300,000 54.5 Contribution margin ........................................... $250,000 45.5 Fixed expenses .................................................. 200,000 36.4 Operating income............................................... $ 50,000 9.1
2.
Decrease in Revenue
Contribution Margin Percentage
Decrease in Operating Income
$55,000* 45.5%† = $25,025
*$55,000 = $550,000 10%
†45.5% = $250,000/$550,000 (rounded; at full precision, decrease is $25,000)
McGraw-Hill/Irwin 2011 The McGraw-Hill Companies, Inc.
Managerial Accounting, 9/e Global Edition 7-15
EXERCISE 7-31 (CONTINUED)
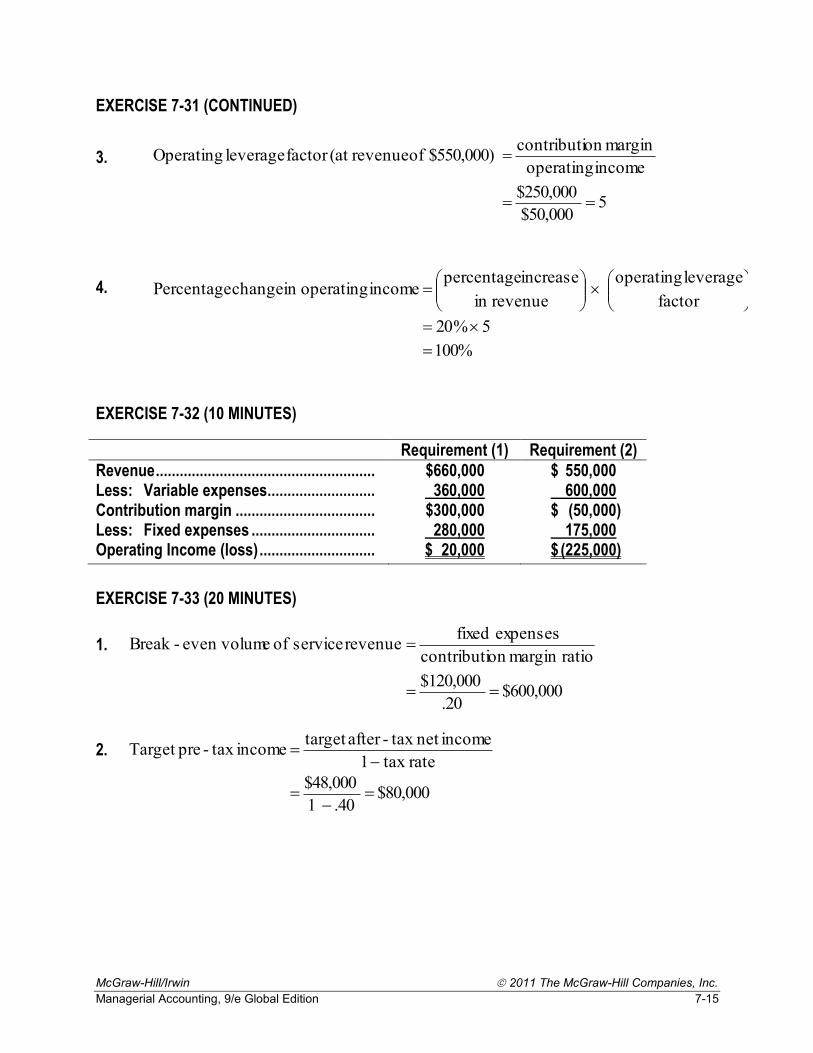
3.
5 $50,000
$250,000
income operating
marginon contributi $550,000) of revenue(at factor leverage Operating
4.
100%
5 %20
factor
leverage operating
revenuein
increase percentage income operatingin change Percentage
EXERCISE 7-32 (10 MINUTES)
Requirement (1) Requirement (2)
Revenue ....................................................... $660,000 $ 550,000 Less: Variable expenses........................... 360,000 600,000 Contribution margin ................................... $300,000 $ (50,000) Less: Fixed expenses ............................... 280,000 175,000 Operating Income (loss) ............................. $ 20,000 $ (225,000)
EXERCISE 7-33 (20 MINUTES)
1.
$600,000 .20
$120,000
ratiomargin on contributi
expenses fixed revenue service of eeven volum-Break
2.
$80,000 .40 1
$48,000
rate tax 1
incomenet tax -aftertarget incometax -preTarget
McGraw-Hill/Irwin 2011 The McGraw-Hill Companies, Inc.
7-16 Solutions Manual
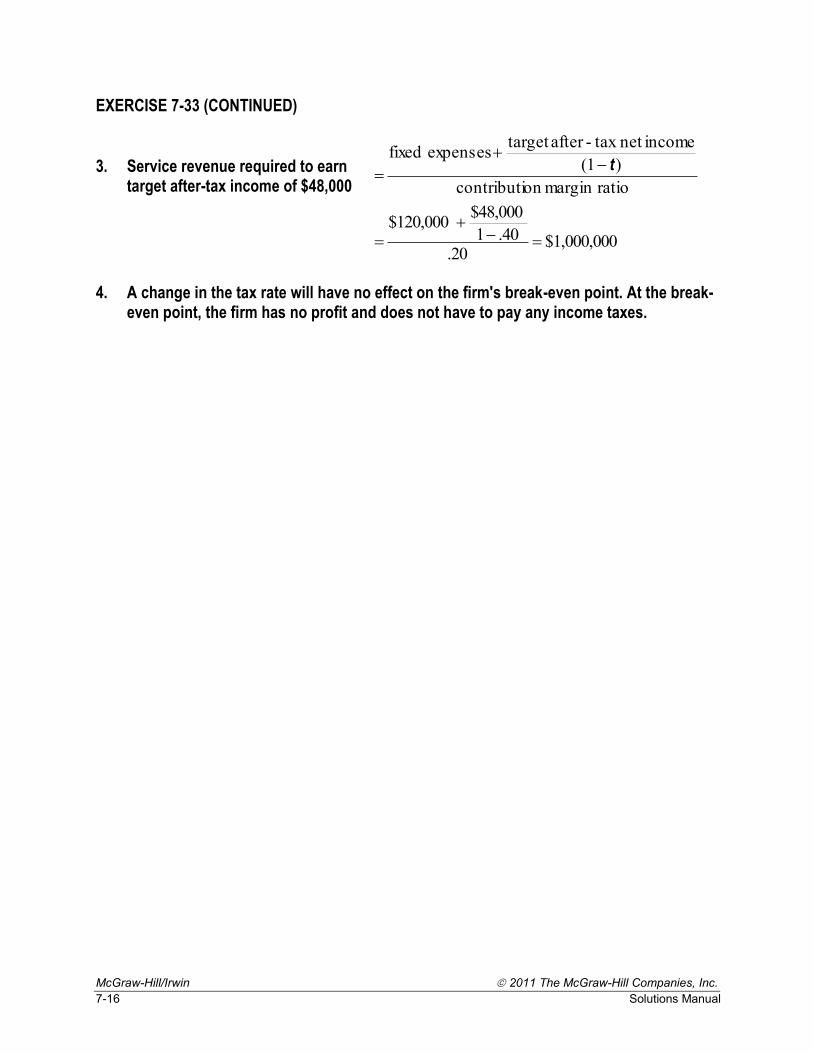
EXERCISE 7-33 (CONTINUED)
3. Service revenue required to earn target after-tax income of $48,000
$1,000,000 .20
.40 1
$48,000 $120,000
ratiomargin on contributi
) (1
incomenet tax -aftertarget expenses fixed
t
4. A change in the tax rate will have no effect on the firm's break-even point. At the break-
even point, the firm has no profit and does not have to pay any income taxes.
McGraw-Hill/Irwin 2011 The McGraw-Hill Companies, Inc.
Managerial Accounting, 9/e Global Edition 7-17
SOLUTIONS TO PROBLEMS
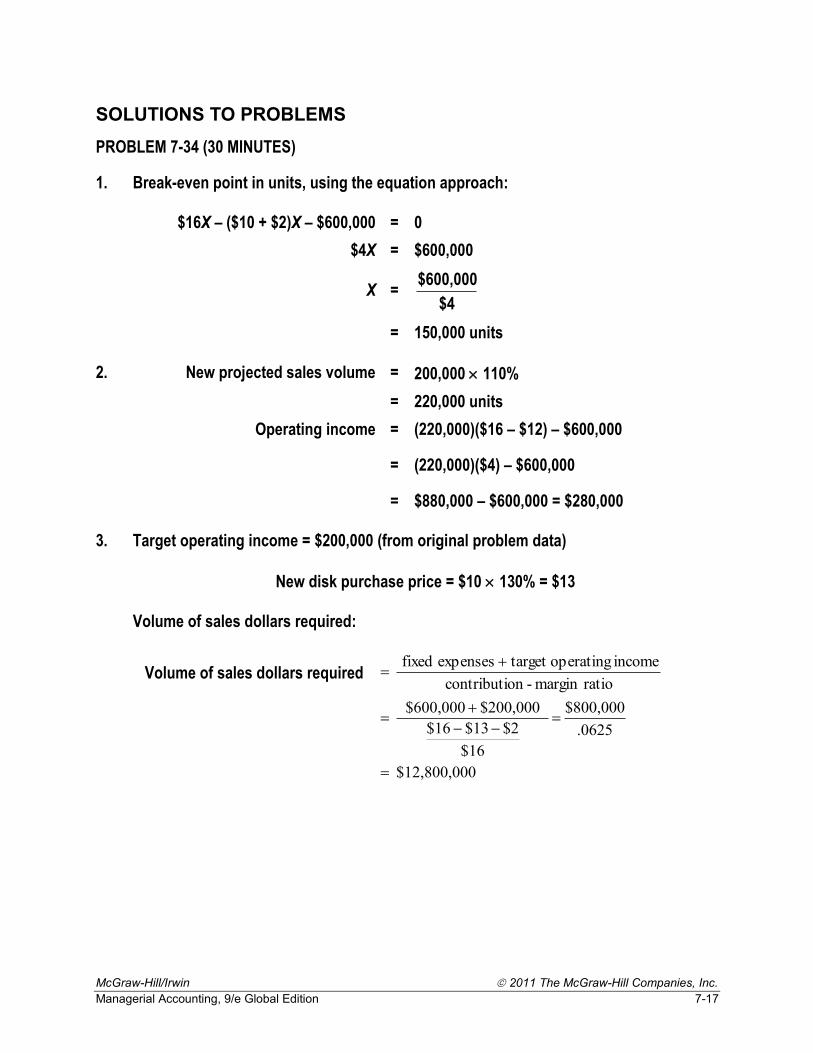
PROBLEM 7-34 (30 MINUTES)
1. Break-even point in units, using the equation approach: $16X – ($10 + $2)X – $600,000 = 0
$4X = $600,000
X =
$4
$600,000
= 150,000 units 2. New projected sales volume = 200,000 110%
= 220,000 units
Operating income = (220,000)($16 – $12) – $600,000
= (220,000)($4) – $600,000
= $880,000 – $600,000 = $280,000 3. Target operating income = $200,000 (from original problem data) New disk purchase price = $10 130% = $13 Volume of sales dollars required:
Volume of sales dollars required
0$12,800,00
.0625
$800,000
$16
$2 $13 $16
$200,000 $600,000
ratiomargin -oncontributi
income operating target expenses fixed
McGraw-Hill/Irwin 2011 The McGraw-Hill Companies, Inc.
7-18 Solutions Manual
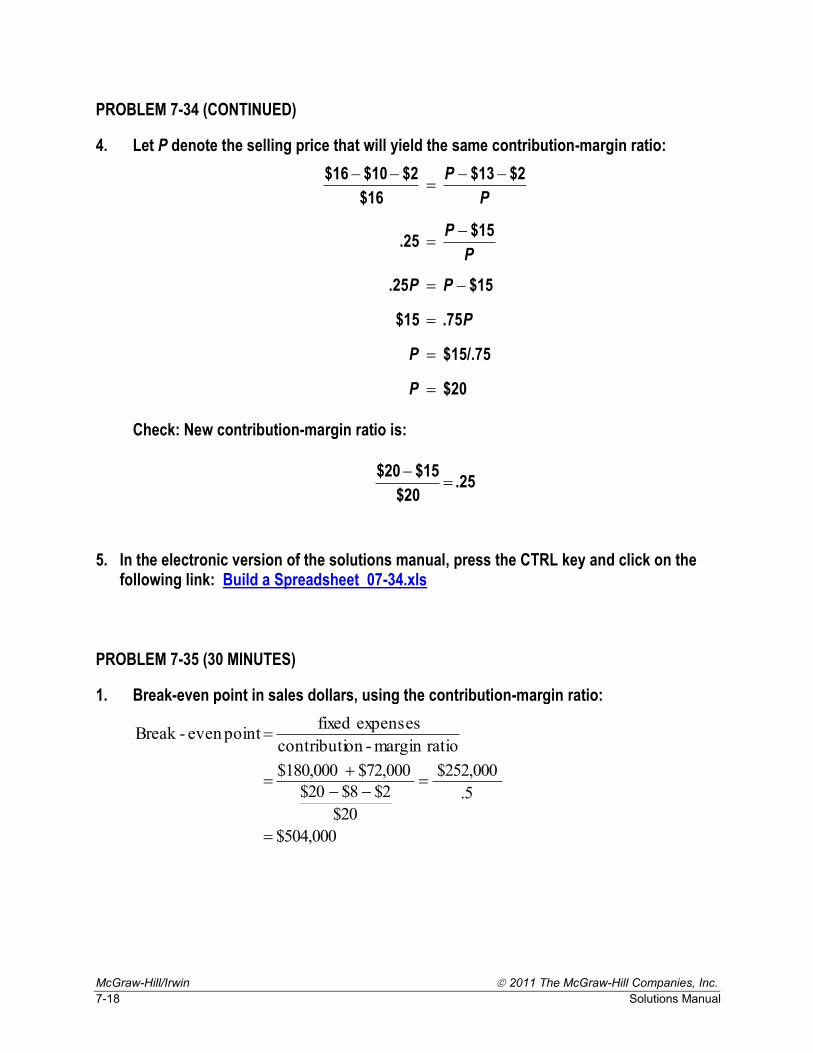
PROBLEM 7-34 (CONTINUED)
4. Let P denote the selling price that will yield the same contribution-margin ratio:
$20
$15/.75
.75 $15
$15 .25
$15 .25
$2 $13
$16
$2 $10 $16
P
P
P
P P
P
P
P
P
Check: New contribution-margin ratio is:
.25 $20
$15$20
5. In the electronic version of the solutions manual, press the CTRL key and click on the following link: Build a Spreadsheet 07-34.xls
PROBLEM 7-35 (30 MINUTES)
1. Break-even point in sales dollars, using the contribution-margin ratio:
$504,000
.5
$252,000
$20
$2 $8 $20
$72,000 $180,000
ratiomargin -oncontributi
expenses fixed point even -Break
McGraw-Hill/Irwin 2011 The McGraw-Hill Companies, Inc.
Managerial Accounting, 9/e Global Edition 7-19
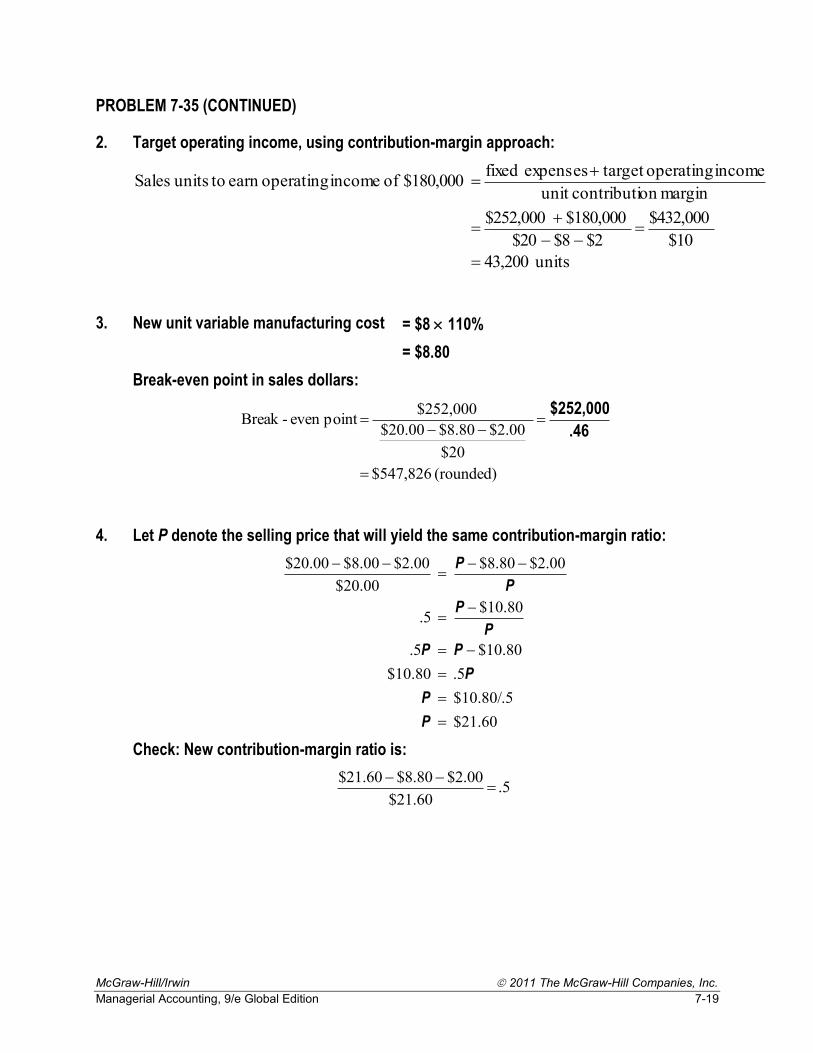
PROBLEM 7-35 (CONTINUED)
2. Target operating income, using contribution-margin approach:
units 43,200
$10
$432,000
$2 $8 $20
$180,000 $252,000
marginon contributiunit
income operating target expenses fixed $180,000 of income operatingearn tounits Sales
3. New unit variable manufacturing cost = $8 110%
= $8.80
Break-even point in sales dollars:
(rounded) $547,826
$20
$2.00 $8.80 $20.00
$252,000 point even -Break
.46
$252,000
4. Let P denote the selling price that will yield the same contribution-margin ratio:
$21.60
$10.80/.5
.5 $10.80
$10.80 .5
$10.80 .5
$2.00 $8.80
$20.00
$2.00 $8.00 $20.00
P
P
P
PP
P
P
P
P
Check: New contribution-margin ratio is:
.5
$21.60
$2.00$8.80$21.60
McGraw-Hill/Irwin 2011 The McGraw-Hill Companies, Inc.
7-20 Solutions Manual
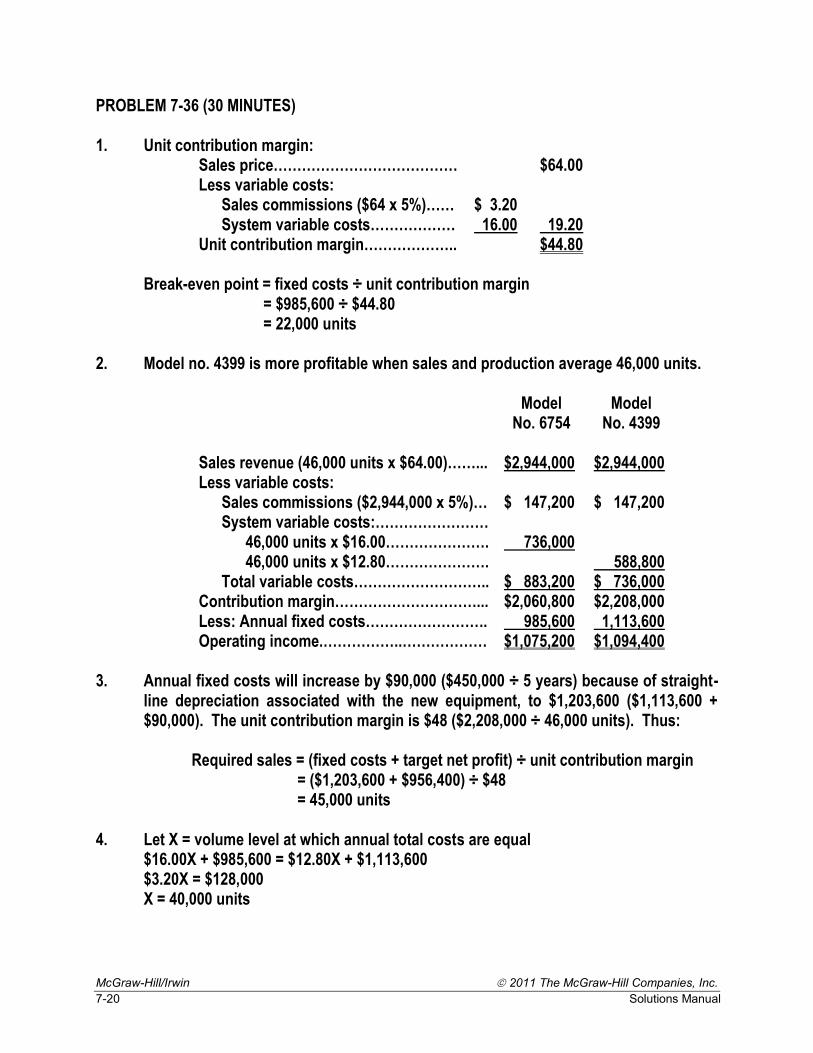
PROBLEM 7-36 (30 MINUTES) 1. Unit contribution margin:
Sales price………………………………… $64.00 Less variable costs:
Sales commissions ($64 x 5%)…… $ 3.20 System variable costs……………… 16.00 19.20
Unit contribution margin……………….. $44.80
Break-even point = fixed costs ÷ unit contribution margin = $985,600 ÷ $44.80 = 22,000 units
2. Model no. 4399 is more profitable when sales and production average 46,000 units.
Model Model No. 6754 No. 4399 Sales revenue (46,000 units x $64.00)……... $2,944,000 $2,944,000 Less variable costs:
Sales commissions ($2,944,000 x 5%)… $ 147,200 $ 147,200 System variable costs:……………………
46,000 units x $16.00…………………. 736,000 46,000 units x $12.80…………………. 588,800
Total variable costs……………………….. $ 883,200 $ 736,000 Contribution margin…………………………... $2,060,800 $2,208,000 Less: Annual fixed costs…………………….. 985,600 1,113,600 Operating income.……………..……………… $1,075,200 $1,094,400
3. Annual fixed costs will increase by $90,000 ($450,000 ÷ 5 years) because of straight-
line depreciation associated with the new equipment, to $1,203,600 ($1,113,600 + $90,000). The unit contribution margin is $48 ($2,208,000 ÷ 46,000 units). Thus:
Required sales = (fixed costs + target net profit) ÷ unit contribution margin = ($1,203,600 + $956,400) ÷ $48 = 45,000 units
4. Let X = volume level at which annual total costs are equal $16.00X + $985,600 = $12.80X + $1,113,600 $3.20X = $128,000 X = 40,000 units
McGraw-Hill/Irwin 2011 The McGraw-Hill Companies, Inc.
Managerial Accounting, 9/e Global Edition 7-21
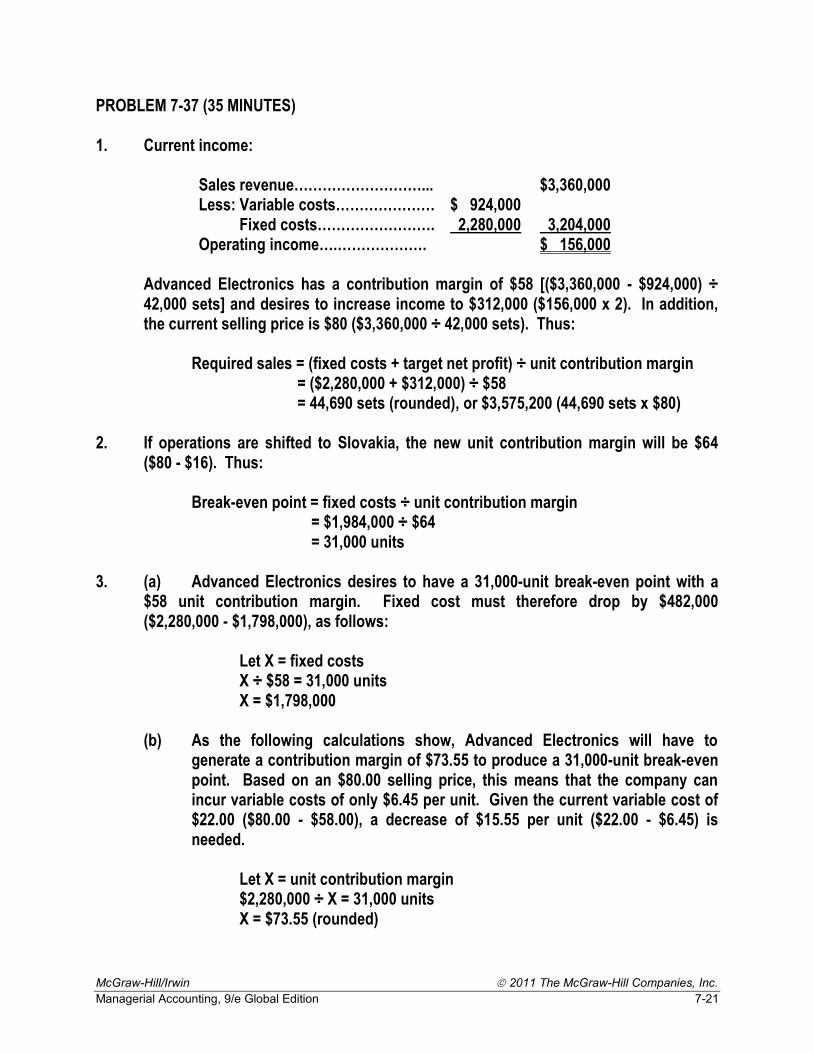
PROBLEM 7-37 (35 MINUTES) 1. Current income:
Sales revenue………………………... $3,360,000 Less: Variable costs………………… $ 924,000
Fixed costs……………………. 2,280,000 3,204,000 Operating income….………………. $ 156,000
Advanced Electronics has a contribution margin of $58 [($3,360,000 - $924,000) ÷
42,000 sets] and desires to increase income to $312,000 ($156,000 x 2). In addition, the current selling price is $80 ($3,360,000 ÷ 42,000 sets). Thus:
Required sales = (fixed costs + target net profit) ÷ unit contribution margin
= ($2,280,000 + $312,000) ÷ $58 = 44,690 sets (rounded), or $3,575,200 (44,690 sets x $80) 2. If operations are shifted to Slovakia, the new unit contribution margin will be $64
($80 - $16). Thus:
Break-even point = fixed costs ÷ unit contribution margin = $1,984,000 ÷ $64
= 31,000 units
3. (a) Advanced Electronics desires to have a 31,000-unit break-even point with a $58 unit contribution margin. Fixed cost must therefore drop by $482,000 ($2,280,000 - $1,798,000), as follows:
Let X = fixed costs X ÷ $58 = 31,000 units X = $1,798,000
(b) As the following calculations show, Advanced Electronics will have to generate a contribution margin of $73.55 to produce a 31,000-unit break-even point. Based on an $80.00 selling price, this means that the company can incur variable costs of only $6.45 per unit. Given the current variable cost of $22.00 ($80.00 - $58.00), a decrease of $15.55 per unit ($22.00 - $6.45) is needed.
Let X = unit contribution margin $2,280,000 ÷ X = 31,000 units X = $73.55 (rounded)
McGraw-Hill/Irwin 2011 The McGraw-Hill Companies, Inc.
7-22 Solutions Manual
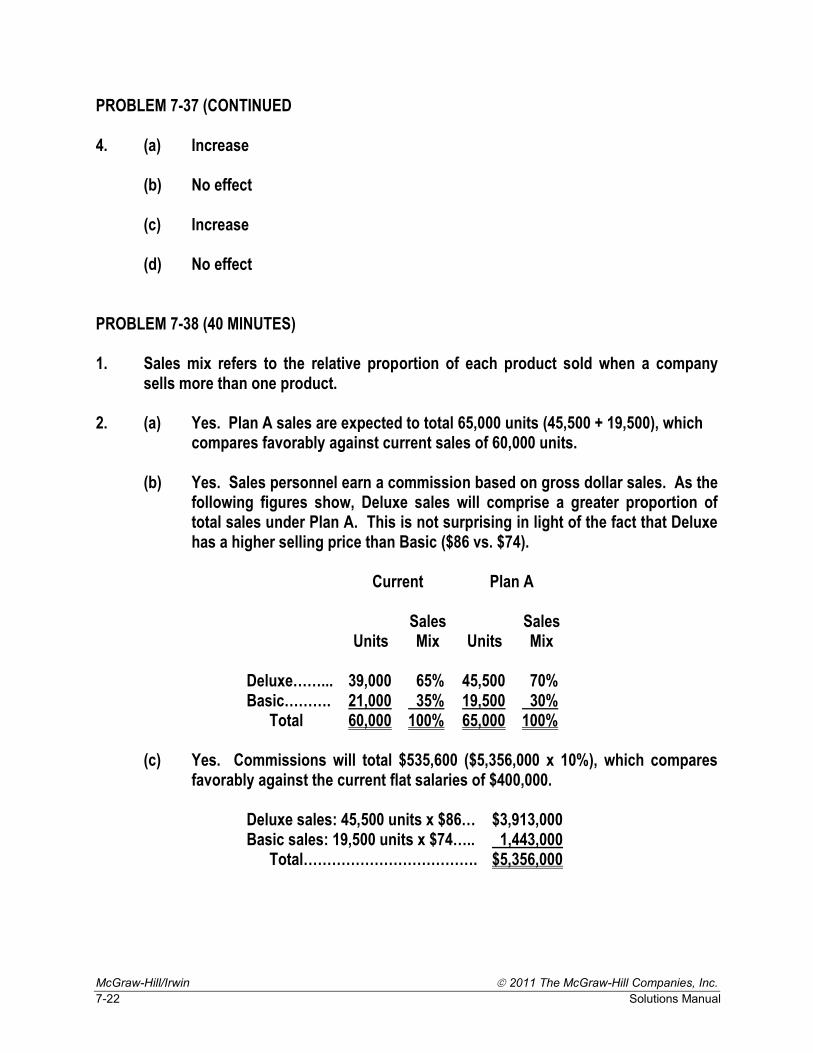
PROBLEM 7-37 (CONTINUED 4. (a) Increase
(b) No effect
(c) Increase
(d) No effect PROBLEM 7-38 (40 MINUTES) 1. Sales mix refers to the relative proportion of each product sold when a company
sells more than one product. 2. (a) Yes. Plan A sales are expected to total 65,000 units (45,500 + 19,500), which
compares favorably against current sales of 60,000 units.
(b) Yes. Sales personnel earn a commission based on gross dollar sales. As the following figures show, Deluxe sales will comprise a greater proportion of total sales under Plan A. This is not surprising in light of the fact that Deluxe has a higher selling price than Basic ($86 vs. $74).
Current Plan A
Units Sales Mix
Units
Sales Mix
Deluxe……... 39,000 65% 45,500 70% Basic………. 21,000 35% 19,500 30%
Total 60,000 100% 65,000 100%
(c) Yes. Commissions will total $535,600 ($5,356,000 x 10%), which compares favorably against the current flat salaries of $400,000.
Deluxe sales: 45,500 units x $86… $3,913,000 Basic sales: 19,500 units x $74….. 1,443,000
Total………………………………. $5,356,000
McGraw-Hill/Irwin 2011 The McGraw-Hill Companies, Inc.
Managerial Accounting, 9/e Global Edition 7-23
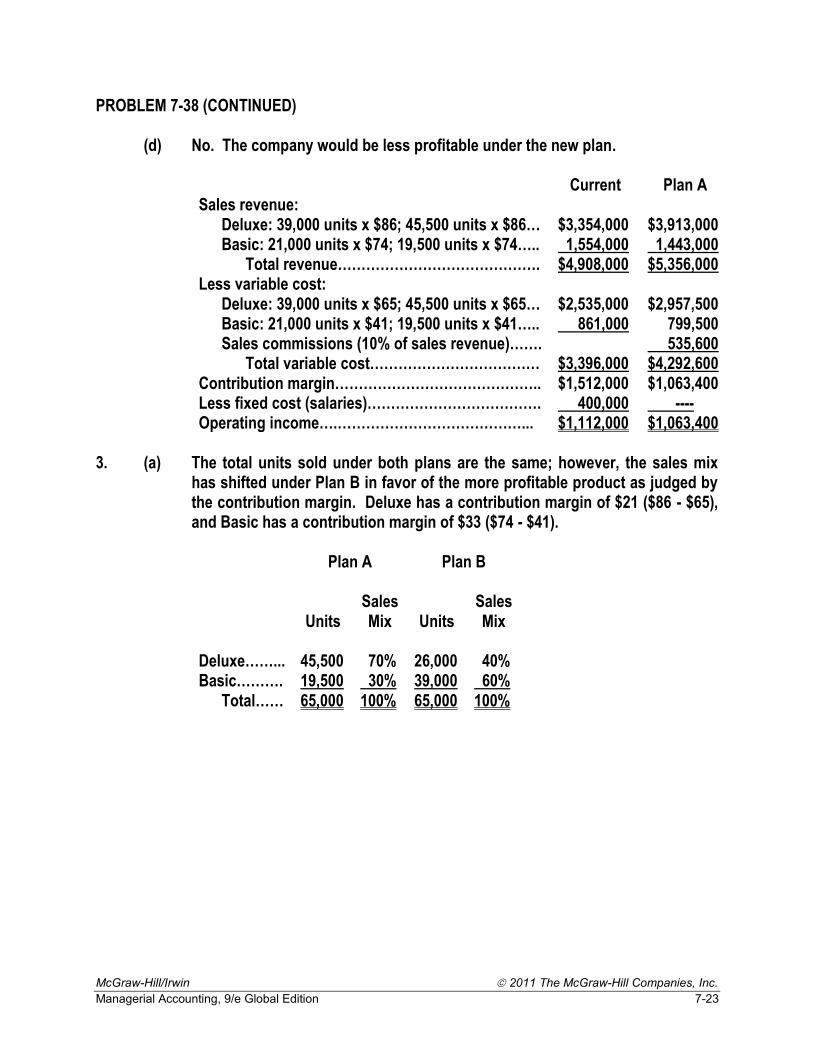
PROBLEM 7-38 (CONTINUED) (d) No. The company would be less profitable under the new plan.
Current Plan A Sales revenue:
Deluxe: 39,000 units x $86; 45,500 units x $86… $3,354,000 $3,913,000 Basic: 21,000 units x $74; 19,500 units x $74….. 1,554,000 1,443,000
Total revenue……………………………………. $4,908,000 $5,356,000 Less variable cost:
Deluxe: 39,000 units x $65; 45,500 units x $65… $2,535,000 $2,957,500 Basic: 21,000 units x $41; 19,500 units x $41….. 861,000 799,500 Sales commissions (10% of sales revenue)……. 535,600
Total variable cost……………………………… $3,396,000 $4,292,600 Contribution margin…………………………………….. $1,512,000 $1,063,400 Less fixed cost (salaries)………………………………. 400,000 ---- Operating income….…………………………………... $1,112,000 $1,063,400
3. (a) The total units sold under both plans are the same; however, the sales mix
has shifted under Plan B in favor of the more profitable product as judged by the contribution margin. Deluxe has a contribution margin of $21 ($86 - $65), and Basic has a contribution margin of $33 ($74 - $41).
Plan A Plan B
Units Sales Mix
Units
Sales Mix
Deluxe……... 45,500 70% 26,000 40% Basic………. 19,500 30% 39,000 60%
Total…… 65,000 100% 65,000 100%
McGraw-Hill/Irwin 2011 The McGraw-Hill Companies, Inc.
7-24 Solutions Manual
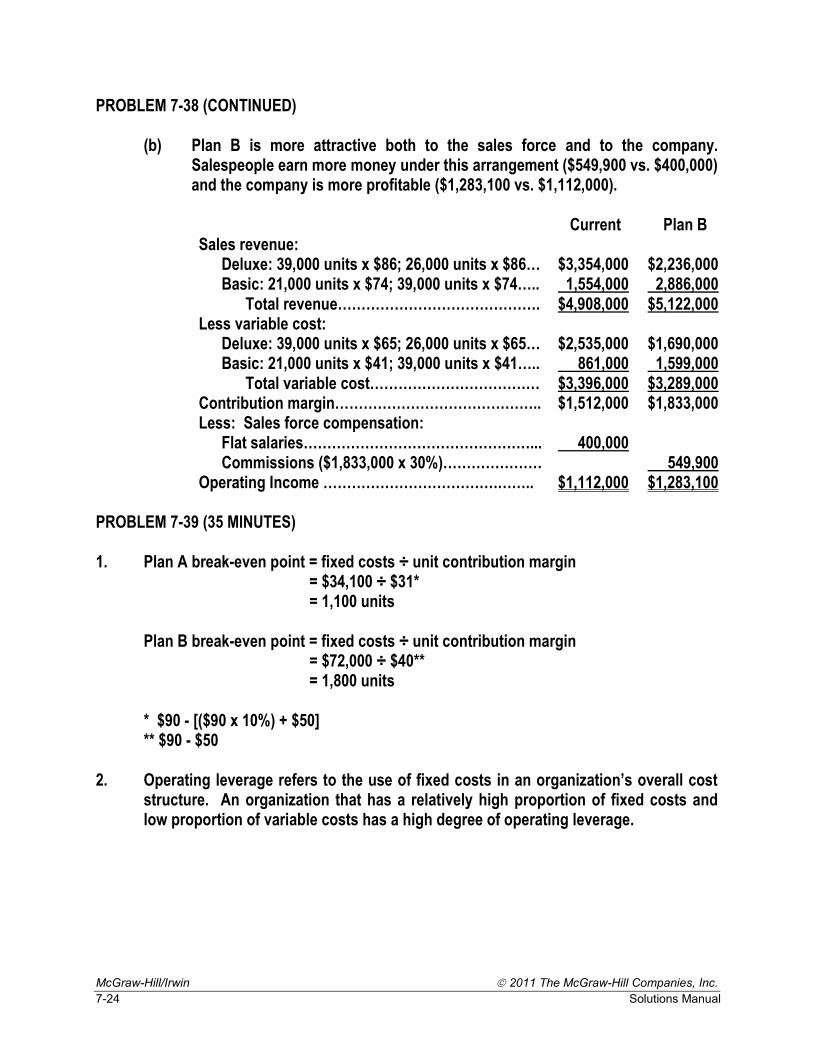
PROBLEM 7-38 (CONTINUED)
(b) Plan B is more attractive both to the sales force and to the company. Salespeople earn more money under this arrangement ($549,900 vs. $400,000) and the company is more profitable ($1,283,100 vs. $1,112,000).
Current Plan B Sales revenue:
Deluxe: 39,000 units x $86; 26,000 units x $86… $3,354,000 $2,236,000 Basic: 21,000 units x $74; 39,000 units x $74….. 1,554,000 2,886,000
Total revenue……………………………………. $4,908,000 $5,122,000 Less variable cost:
Deluxe: 39,000 units x $65; 26,000 units x $65… $2,535,000 $1,690,000 Basic: 21,000 units x $41; 39,000 units x $41….. 861,000 1,599,000
Total variable cost……………………………… $3,396,000 $3,289,000 Contribution margin…………………………………….. $1,512,000 $1,833,000 Less: Sales force compensation:
Flat salaries…………………………………………... 400,000 Commissions ($1,833,000 x 30%)………………… 549,900
Operating Income ……………………………….…….. $1,112,000 $1,283,100 PROBLEM 7-39 (35 MINUTES) 1. Plan A break-even point = fixed costs ÷ unit contribution margin
= $34,100 ÷ $31* = 1,100 units
Plan B break-even point = fixed costs ÷ unit contribution margin = $72,000 ÷ $40**
= 1,800 units
* $90 - [($90 x 10%) + $50] ** $90 - $50
2. Operating leverage refers to the use of fixed costs in an organization’s overall cost structure. An organization that has a relatively high proportion of fixed costs and low proportion of variable costs has a high degree of operating leverage.
McGraw-Hill/Irwin 2011 The McGraw-Hill Companies, Inc.
Managerial Accounting, 9/e Global Edition 7-25
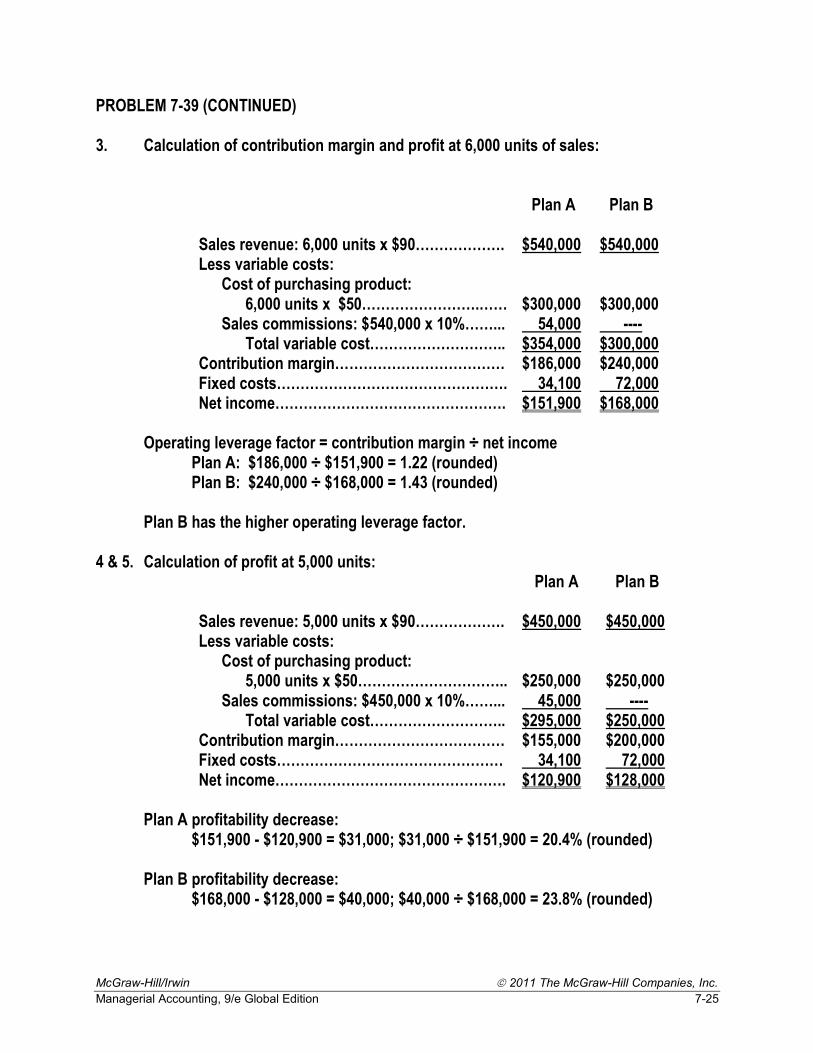
PROBLEM 7-39 (CONTINUED) 3. Calculation of contribution margin and profit at 6,000 units of sales:
Plan A Plan B Sales revenue: 6,000 units x $90………………. $540,000 $540,000 Less variable costs:
Cost of purchasing product: 6,000 units x $50…………………….……
$300,000
$300,000
Sales commissions: $540,000 x 10%……... 54,000 ---- Total variable cost……………………….. $354,000 $300,000
Contribution margin……………………………… $186,000 $240,000 Fixed costs…………………………………………. 34,100 72,000 Net income…………………………………………. $151,900 $168,000
Operating leverage factor = contribution margin ÷ net income Plan A: $186,000 ÷ $151,900 = 1.22 (rounded) Plan B: $240,000 ÷ $168,000 = 1.43 (rounded) Plan B has the higher operating leverage factor. 4 & 5. Calculation of profit at 5,000 units:
Plan A Plan B Sales revenue: 5,000 units x $90………………. $450,000 $450,000 Less variable costs:
Cost of purchasing product: 5,000 units x $50…………………………..
$250,000
$250,000
Sales commissions: $450,000 x 10%……... 45,000 ---- Total variable cost……………………….. $295,000 $250,000
Contribution margin……………………………… $155,000 $200,000 Fixed costs………………………………………… 34,100 72,000 Net income…………………………………………. $120,900 $128,000
Plan A profitability decrease: $151,900 - $120,900 = $31,000; $31,000 ÷ $151,900 = 20.4% (rounded) Plan B profitability decrease: $168,000 - $128,000 = $40,000; $40,000 ÷ $168,000 = 23.8% (rounded)
McGraw-Hill/Irwin 2011 The McGraw-Hill Companies, Inc.
7-26 Solutions Manual
PROBLEM 7-39 (CONTINUED)
Consolidated would experience a larger percentage decrease in income if it adopts Plan B. This situation arises because Plan B has a higher degree of operating leverage. Stated differently, Plan B’s cost structure produces a greater percentage decline in profitability from the drop-off in sales revenue.
Note: The percentage decreases in profitability can be computed by multiplying the percentage decrease in sales revenue by the operating leverage factor. Sales dropped from 6,000 units to 5,000 units, or 16.67%. Thus: Plan A: 16.67% x 1.22 = 20.3% (difference due to rounding) Plan B: 16.67% x 1.43 = 23.8% (rounded)
6. Heavily automated manufacturers have sizable investments in plant and equipment, along with a high percentage of fixed costs in their cost structures. As a result, there is a high degree of operating leverage.
In a severe economic downturn, these firms typically suffer a significant
decrease in profitability. Such firms would be a more risky investment when compared with firms that have a low degree of operating leverage. Of course, when times are good, increases in sales would tend to have a very favorable effect on earnings in a company with high operating leverage.
McGraw-Hill/Irwin 2011 The McGraw-Hill Companies, Inc.
Managerial Accounting, 9/e Global Edition 7-27
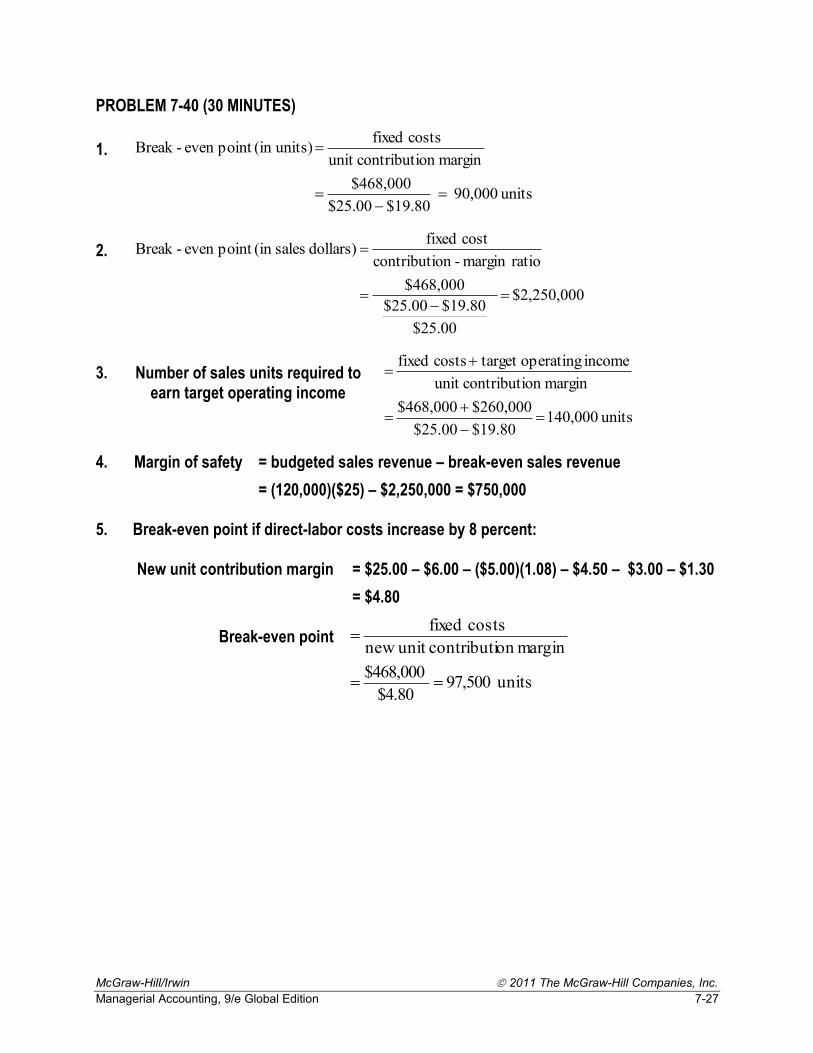
PROBLEM 7-40 (30 MINUTES)
1.
units 90,000 $19.80 $25.00
$468,000
marginon contributiunit
costs fixed units)(in point even -Break
2.
$2,250,000
$25.00
$19.80 $25.00
$468,000
ratiomargin -oncontributi
cost fixed dollars) sales(in point even -Break
3. Number of sales units required to earn target operating income
units 140,000 $19.80 $25.00
$260,000 $468,000
margin on contributiunit
income operating target costs fixed
4. Margin of safety = budgeted sales revenue – break-even sales revenue
= (120,000)($25) – $2,250,000 = $750,000 5. Break-even point if direct-labor costs increase by 8 percent: New unit contribution margin = $25.00 – $6.00 – ($5.00)(1.08) – $4.50 – $3.00 – $1.30
= $4.80
Break-even point
units 97,500 $4.80
$468,000
marginon contributiunit new
costs fixed
McGraw-Hill/Irwin 2011 The McGraw-Hill Companies, Inc.
7-28 Solutions Manual
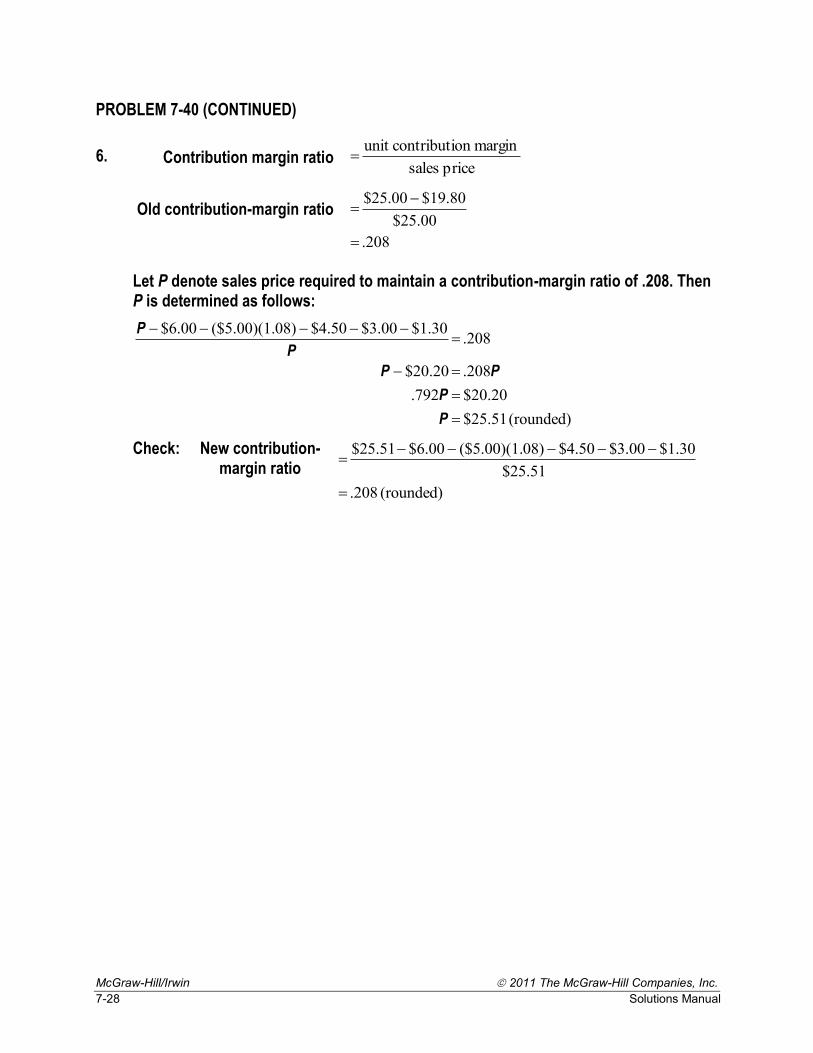
PROBLEM 7-40 (CONTINUED)
6. Contribution margin ratio price sales
marginon contributiunit
Old contribution-margin ratio
.208
$25.00
$19.80$25.00
Let P denote sales price required to maintain a contribution-margin ratio of .208. Then
P is determined as follows:
(rounded) $25.51
$20.20 .792
.208 $20.20
.208 $1.30$3.0050.4$08)($5.00)(1.$6.00
P
P
PP
P
P
Check: New contribution- margin ratio
(rounded) .208
$25.51
$1.30$3.0050.4$08)($5.00)(1.$6.00$25.51
McGraw-Hill/Irwin 2011 The McGraw-Hill Companies, Inc.
Managerial Accounting, 9/e Global Edition 7-29
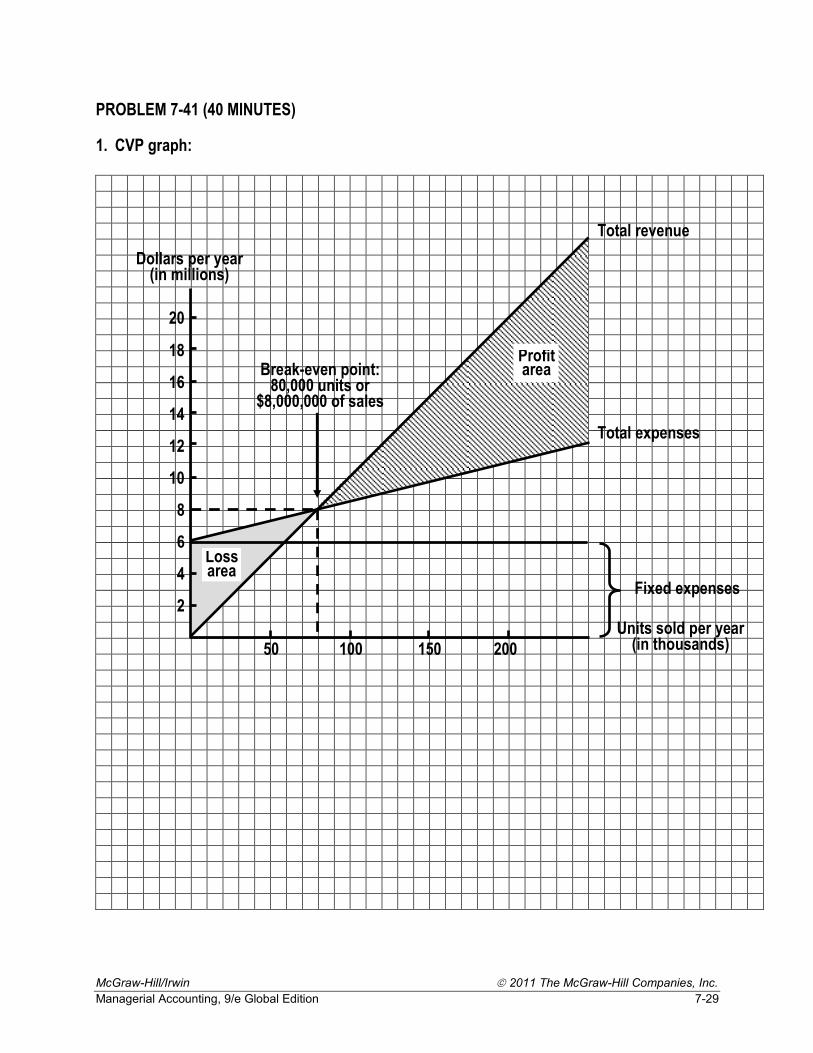
PROBLEM 7-41 (40 MINUTES)
1. CVP graph:
Total expenses
Break-even point: 80,000 units or
$8,000,000 of sales
Total revenue
Fixed expenses
Units sold per year (in thousands) 50 100 150 200
Dollars per year (in millions)
20
18
16
14
12
10
8
6
4
2
Profit area
Loss area
McGraw-Hill/Irwin 2011 The McGraw-Hill Companies, Inc.
7-30 Solutions Manual
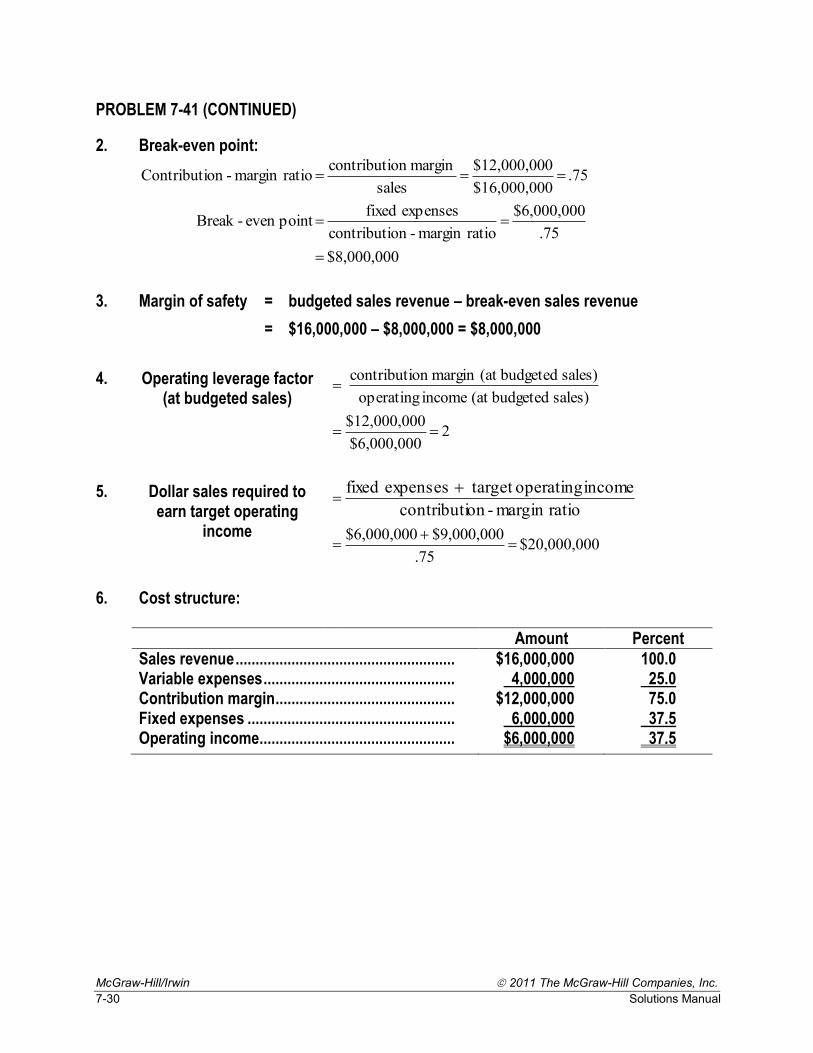
PROBLEM 7-41 (CONTINUED)
2. Break-even point:
$8,000,000
.75
$6,000,000
ratiomargin -oncontributi
expenses fixed point even -Break
.75 0$16,000,00
0$12,000,00
sales
marginon contributi ratiomargin -onContributi
3. Margin of safety = budgeted sales revenue – break-even sales revenue
= $16,000,000 – $8,000,000 = $8,000,000
4. Operating leverage factor (at budgeted sales)
2 $6,000,000
0$12,000,00
sales) budgeted(at income operating
sales) budgeted(at margin on contributi
5. Dollar sales required to earn target operating
income 0$20,000,00
.75
$9,000,000 $6,000,000
ratiomargin -oncontributi
income operating target expenses fixed
6. Cost structure:
Amount Percent
Sales revenue ....................................................... $16,000,000 100.0 Variable expenses ................................................ 4,000,000 25.0 Contribution margin ............................................. $12,000,000 75.0 Fixed expenses .................................................... 6,000,000 37.5 Operating income................................................. $6,000,000 37.5
McGraw-Hill/Irwin 2011 The McGraw-Hill Companies, Inc.
Managerial Accounting, 9/e Global Edition 7-31
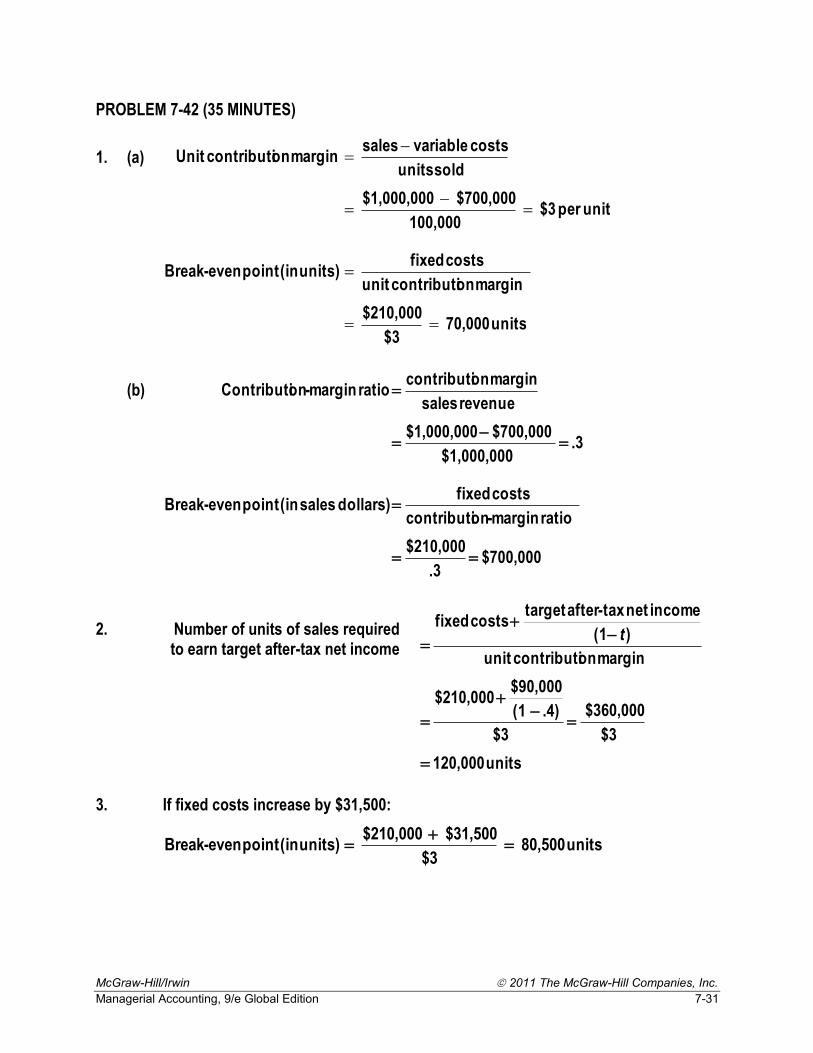
PROBLEM 7-42 (35 MINUTES)
1. (a)
units 70,000 $3
$210,000
margin oncontributiunit
costs fixed units) (inpoint even-Break
unit per $3 100,000
$700,000 $1,000,000
sold units
costs variable sales margin oncontributiUnit
(b)
$700,000 .3
$210,000
ratio margin-oncontributi
costs fixed dollars) sales (inpoint even-Break
.3 $1,000,000
$700,000 $1,000,000
revenue sales
margin oncontributi ratio margin-onContributi
2.
Number of units of sales required to earn target after-tax net income
units 120,000
$3
$360,000
$3
.4) (1
$90,000 $210,000
margin oncontributiunit
) (1
incomenet tax-aftertarget costs fixed
t
3. If fixed costs increase by $31,500:
units 80,500
$3
$31,500 $210,000 units) (inpoint even-Break
McGraw-Hill/Irwin 2011 The McGraw-Hill Companies, Inc.
7-32 Solutions Manual
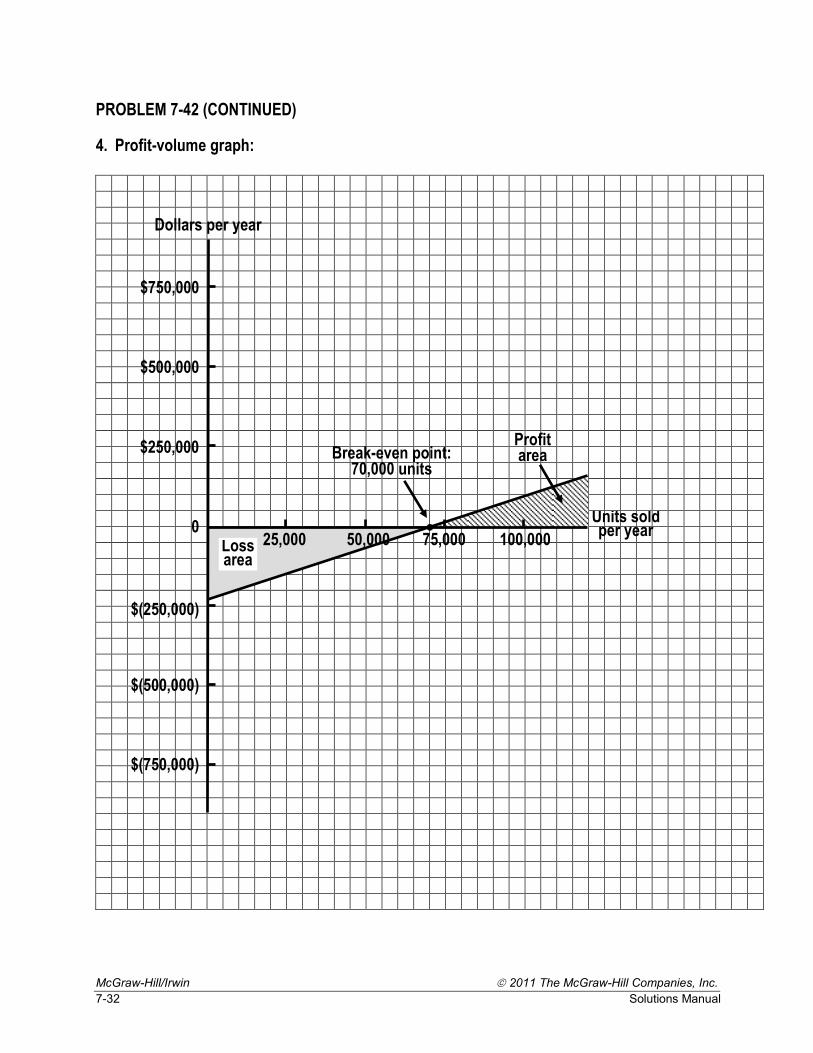
PROBLEM 7-42 (CONTINUED)
4. Profit-volume graph:
Dollars per year
$750,000
$500,000
$250,000
0
$(250,000)
$(500,000)
$(750,000)
Loss area
25,000 50,000 75,000 100,000
Units sold per year
Break-even point: 70,000 units
Profit area
McGraw-Hill/Irwin 2011 The McGraw-Hill Companies, Inc.
Managerial Accounting, 9/e Global Edition 7-33
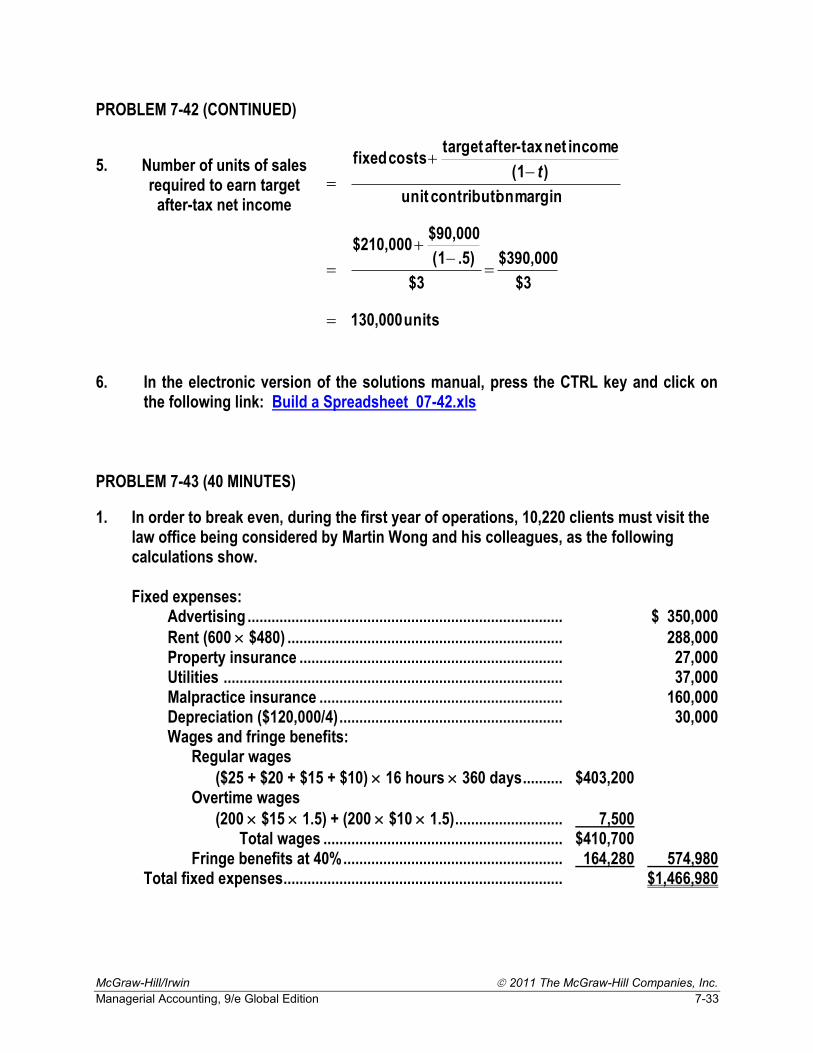
PROBLEM 7-42 (CONTINUED)
5.
Number of units of sales required to earn target
after-tax net income
units 130,000
$3
$390,000
$3
.5) (1
$90,000 $210,000
margin oncontributiunit
) (1
incomenet tax-aftertarget costs fixed
t
6. In the electronic version of the solutions manual, press the CTRL key and click on the following link: Build a Spreadsheet 07-42.xls
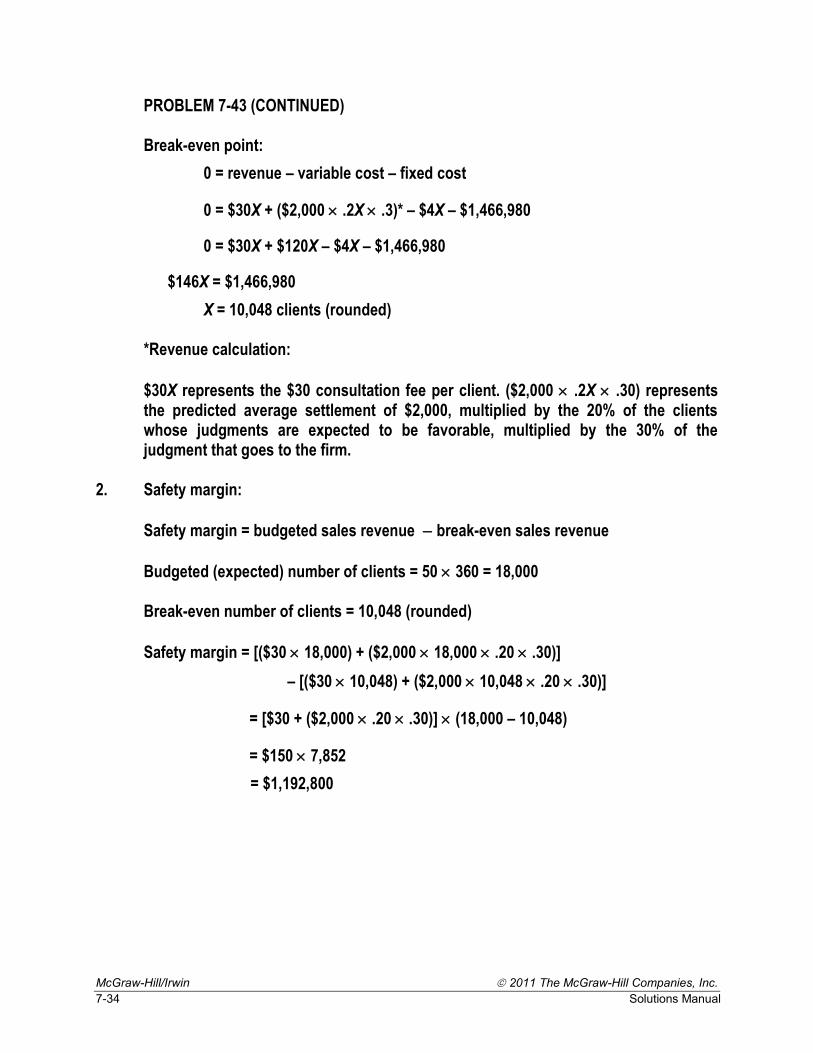
PROBLEM 7-43 (40 MINUTES)
1. In order to break even, during the first year of operations, 10,220 clients must visit the law office being considered by Martin Wong and his colleagues, as the following calculations show.
Fixed expenses:
Advertising ............................................................................... $ 350,000
Rent (600 $480) ..................................................................... 288,000 Property insurance .................................................................. 27,000 Utilities ..................................................................................... 37,000 Malpractice insurance ............................................................. 160,000 Depreciation ($120,000/4) ........................................................ 30,000 Wages and fringe benefits: Regular wages
($25 + $20 + $15 + $10) 16 hours 360 days .......... $403,200 Overtime wages
(200 $15 1.5) + (200 $10 1.5) ........................... 7,500 Total wages ............................................................ $410,700 Fringe benefits at 40% ....................................................... 164,280 574,980 Total fixed expenses ...................................................................... $1,466,980
McGraw-Hill/Irwin 2011 The McGraw-Hill Companies, Inc.
7-34 Solutions Manual
PROBLEM 7-43 (CONTINUED) Break-even point:
0 = revenue – variable cost – fixed cost
0 = $30X + ($2,000 .2X .3)* – $4X – $1,466,980
0 = $30X + $120X – $4X – $1,466,980
$146X = $1,466,980
X = 10,048 clients (rounded) *Revenue calculation:
$30X represents the $30 consultation fee per client. ($2,000 .2X .30) represents the predicted average settlement of $2,000, multiplied by the 20% of the clients whose judgments are expected to be favorable, multiplied by the 30% of the judgment that goes to the firm.
2. Safety margin:
Safety margin = budgeted sales revenue break-even sales revenue
Budgeted (expected) number of clients = 50 360 = 18,000 Break-even number of clients = 10,048 (rounded)
Safety margin = [($30 18,000) + ($2,000 18,000 .20 .30)]
– [($30 10,048) + ($2,000 10,048 .20 .30)]
= [$30 + ($2,000 .20 .30)] (18,000 – 10,048)
= $150 7,852
= $1,192,800
McGraw-Hill/Irwin 2011 The McGraw-Hill Companies, Inc.
Managerial Accounting, 9/e Global Edition 7-35
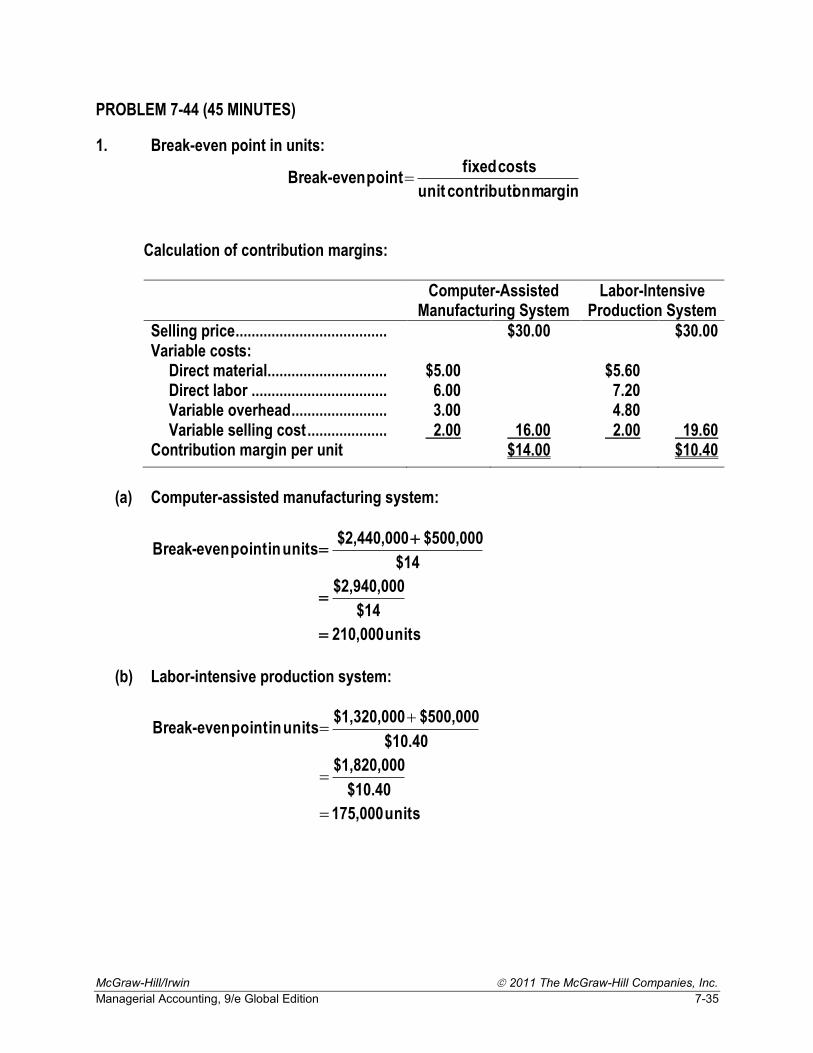
PROBLEM 7-44 (45 MINUTES)
1. Break-even point in units:
margin oncontributiunit
costs fixed point even-Break
Calculation of contribution margins:
Computer-Assisted Manufacturing System
Labor-Intensive Production System
Selling price ...................................... $30.00 $30.00 Variable costs: Direct material.............................. $5.00 $5.60 Direct labor .................................. 6.00 7.20 Variable overhead ........................ 3.00 4.80 Variable selling cost .................... 2.00 16.00 2.00 19.60 Contribution margin per unit $14.00 $10.40
(a) Computer-assisted manufacturing system:
units 210,000
$14
$2,940,000
$14
$500,000 $2,440,000 units inpoint even-Break
(b) Labor-intensive production system:
units 175,000
$10.40
$1,820,000
$10.40
$500,000 $1,320,000 units inpoint even-Break
McGraw-Hill/Irwin 2011 The McGraw-Hill Companies, Inc.
7-36 Solutions Manual
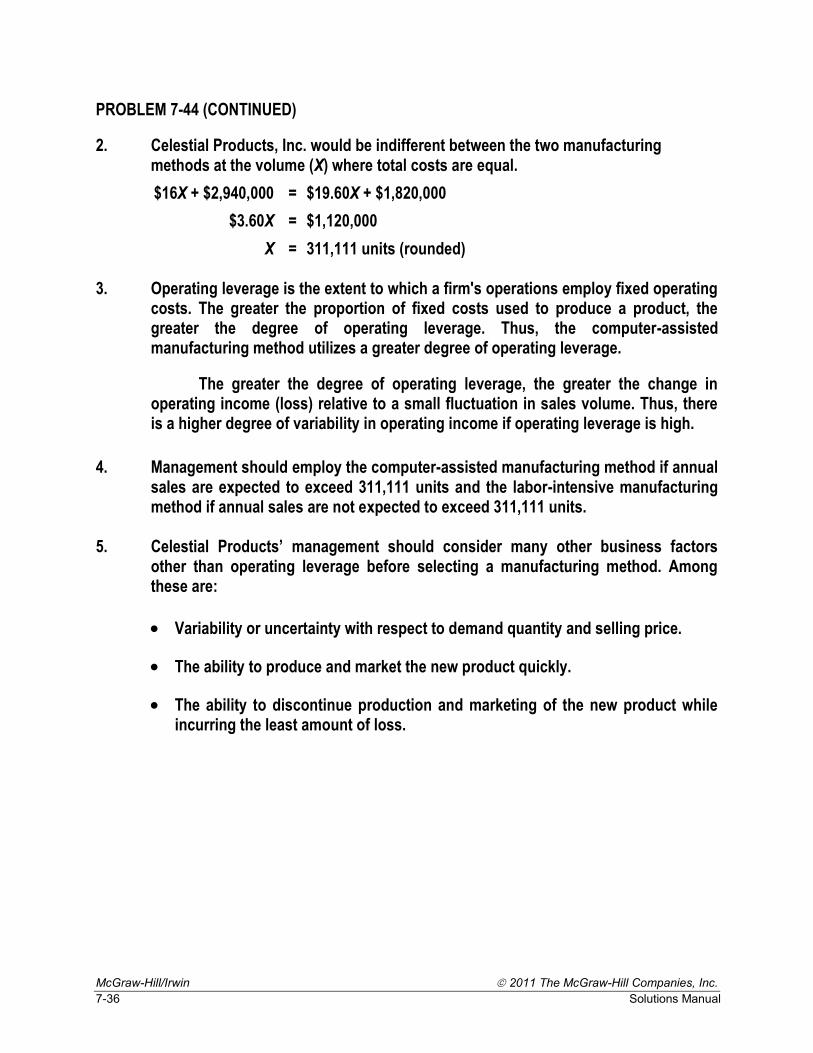
PROBLEM 7-44 (CONTINUED)
2. Celestial Products, Inc. would be indifferent between the two manufacturing methods at the volume (X) where total costs are equal.
$16X + $2,940,000 = $19.60X + $1,820,000 $3.60X = $1,120,000 X = 311,111 units (rounded) 3. Operating leverage is the extent to which a firm's operations employ fixed operating
costs. The greater the proportion of fixed costs used to produce a product, the greater the degree of operating leverage. Thus, the computer-assisted manufacturing method utilizes a greater degree of operating leverage.
The greater the degree of operating leverage, the greater the change in operating income (loss) relative to a small fluctuation in sales volume. Thus, there is a higher degree of variability in operating income if operating leverage is high.
4. Management should employ the computer-assisted manufacturing method if annual sales are expected to exceed 311,111 units and the labor-intensive manufacturing method if annual sales are not expected to exceed 311,111 units.
5. Celestial Products’ management should consider many other business factors
other than operating leverage before selecting a manufacturing method. Among these are:
Variability or uncertainty with respect to demand quantity and selling price.
The ability to produce and market the new product quickly.
The ability to discontinue production and marketing of the new product while incurring the least amount of loss.
McGraw-Hill/Irwin 2011 The McGraw-Hill Companies, Inc.
Managerial Accounting, 9/e Global Edition 7-37
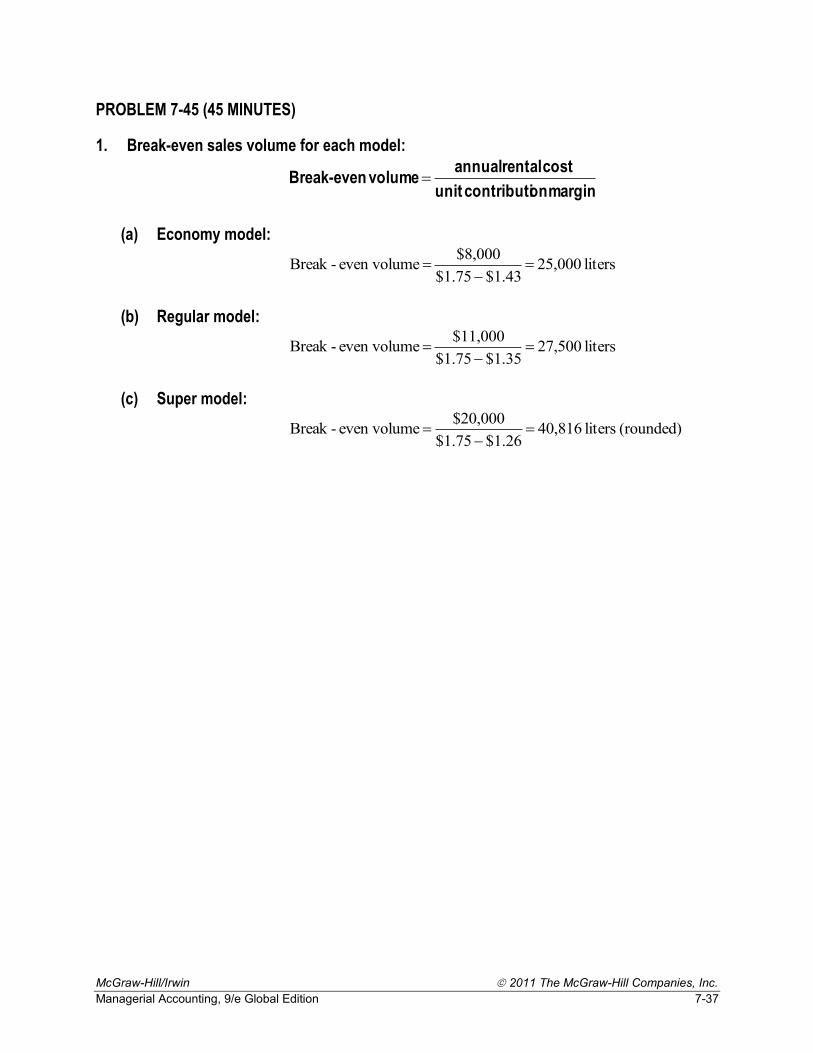
PROBLEM 7-45 (45 MINUTES)
1. Break-even sales volume for each model:
margin oncontributiunit
cost rental annual volumeeven-Break
(a) Economy model:
liters 25,000 $1.43 $1.75
$8,000 eeven volum-Break
(b) Regular model:
liters 27,500 $1.35 $1.75
$11,000 eeven volum-Break
(c) Super model:
(rounded) liters 40,816 $1.26 $1.75
$20,000 eeven volum-Break
McGraw-Hill/Irwin 2011 The McGraw-Hill Companies, Inc.
7-38 Solutions Manual
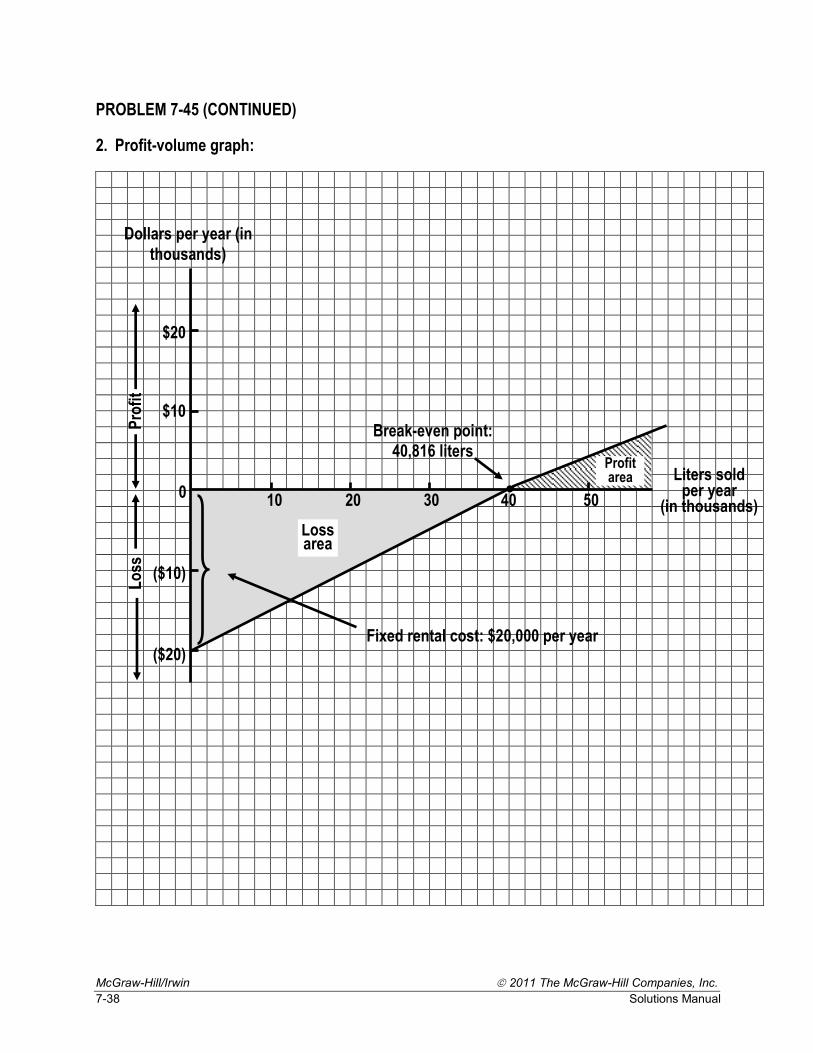
PROBLEM 7-45 (CONTINUED)
2. Profit-volume graph:
Dollars per year (in
thousands)
$20
$10
0
($10)
($20)
10 20 30 40 50
Liters sold per year
(in thousands)
Break-even point:
40,816 liters
Fixed rental cost: $20,000 per year
Pro
fit
Lo
ss
Loss area
Profit area
McGraw-Hill/Irwin 2011 The McGraw-Hill Companies, Inc.
Managerial Accounting, 9/e Global Edition 7-39
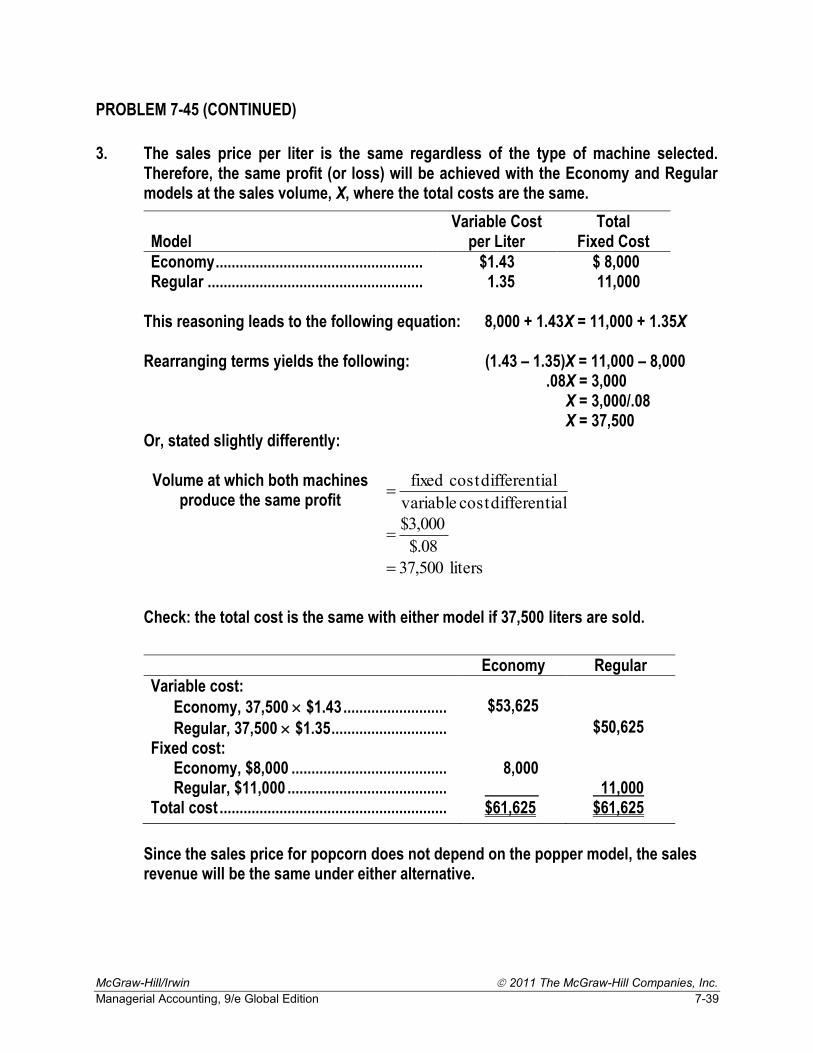
PROBLEM 7-45 (CONTINUED)
3. The sales price per liter is the same regardless of the type of machine selected. Therefore, the same profit (or loss) will be achieved with the Economy and Regular models at the sales volume, X, where the total costs are the same.
Model
Variable Cost per Liter
Total Fixed Cost
Economy .................................................... $1.43 $ 8,000 Regular ...................................................... 1.35 11,000
This reasoning leads to the following equation: 8,000 + 1.43X = 11,000 + 1.35X
Rearranging terms yields the following: (1.43 – 1.35)X = 11,000 – 8,000 .08X = 3,000 X = 3,000/.08 X = 37,500
Or, stated slightly differently:
Volume at which both machines produce the same profit
liters 37,500
$.08
$3,000
aldifferenticost variable
aldifferenticost fixed
Check: the total cost is the same with either model if 37,500 liters are sold.
Economy Regular
Variable cost:
Economy, 37,500 $1.43 .......................... $53,625
Regular, 37,500 $1.35 ............................. $50,625
Fixed cost: Economy, $8,000 ....................................... 8,000 Regular, $11,000 ........................................ 11,000 Total cost ......................................................... $61,625 $61,625
Since the sales price for popcorn does not depend on the popper model, the sales revenue will be the same under either alternative.
McGraw-Hill/Irwin 2011 The McGraw-Hill Companies, Inc.
7-40 Solutions Manual
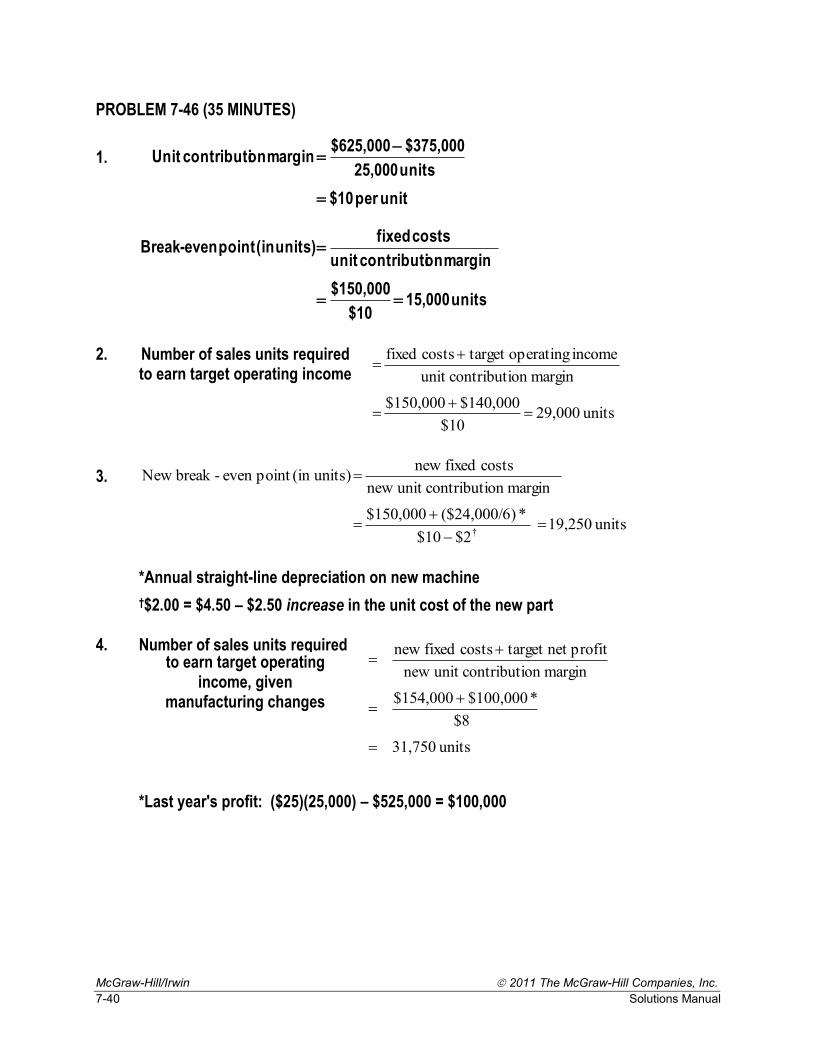
PROBLEM 7-46 (35 MINUTES)
1.
units 15,000 $10
$150,000
margin oncontributiunit
costs fixed units) (inpoint even-Break
unit per $10
units 25,000
$375,000 $625,000 margin oncontributiUnit
2. Number of sales units required
to earn target operating income
units 29,000 $10
$140,000 $150,000
marginon contributiunit
income operating target costs fixed
3.
units 19,250 $2 $10
*)($24,000/6 $150,000
marginon contributiunit new
costs fixed new units)(in point even -break New
†
*Annual straight-line depreciation on new machine
†$2.00 = $4.50 – $2.50 increase in the unit cost of the new part 4. Number of sales units required
units 31,750
$8
*$100,000 $154,000
marginon contributiunit new
profitnet target costs fixed new
to earn target operating income, given
manufacturing changes
*Last year's profit: ($25)(25,000) – $525,000 = $100,000
McGraw-Hill/Irwin 2011 The McGraw-Hill Companies, Inc.
Managerial Accounting, 9/e Global Edition 7-41
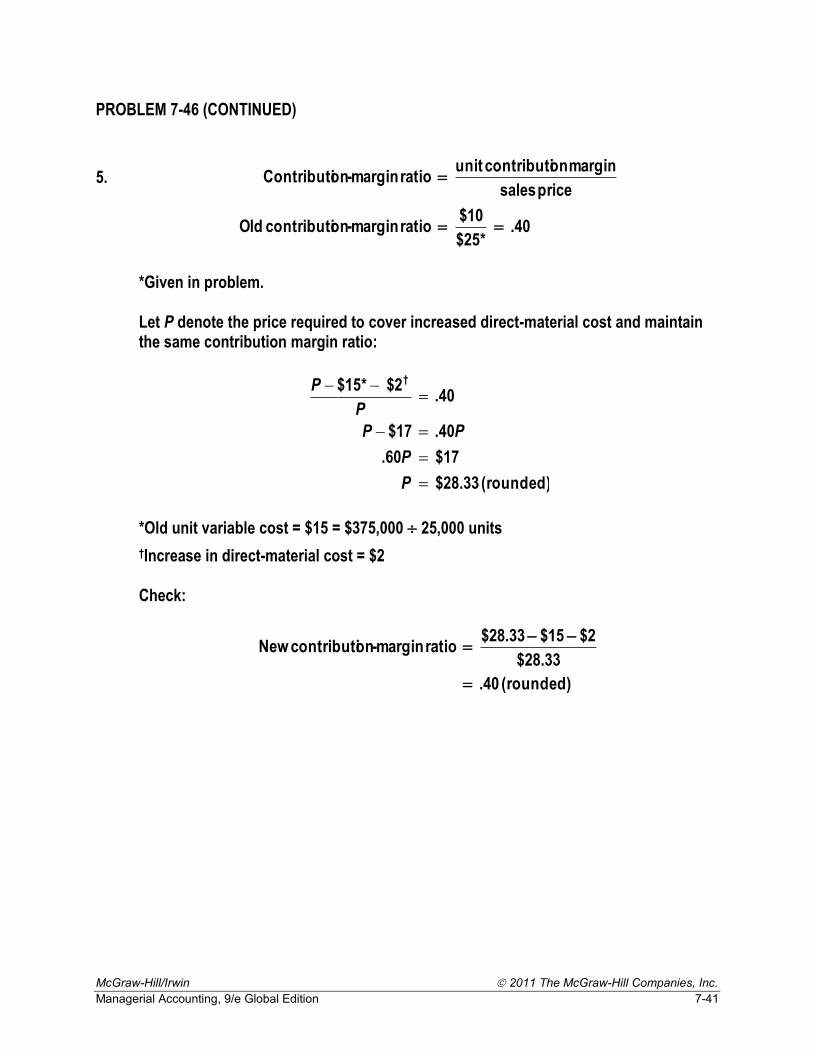
PROBLEM 7-46 (CONTINUED)
5.
.40 *$25
$10 ratio margin-oncontributi Old
price sales
margin oncontributiunit ratio margin-onContributi
*Given in problem. Let P denote the price required to cover increased direct-material cost and maintain
the same contribution margin ratio:
(rounded) $28.33
$17 .60
.40 $17
.40 $2 *$15 †
P
P
PP
P
P
*Old unit variable cost = $15 = $375,000 25,000 units
†Increase in direct-material cost = $2 Check:
(rounded) .40
$28.33
$2 $15 $28.33 ratio margin-oncontributi New
McGraw-Hill/Irwin 2011 The McGraw-Hill Companies, Inc.
7-42 Solutions Manual
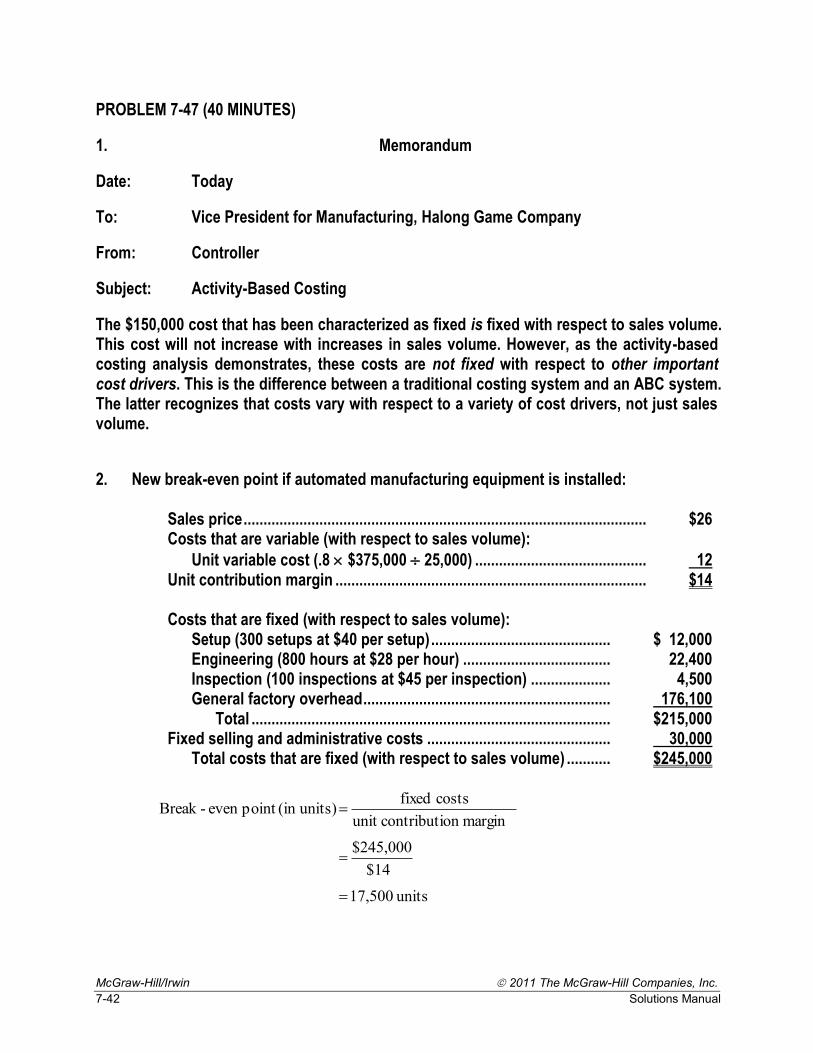
PROBLEM 7-47 (40 MINUTES)
1. Memorandum
Date: Today
To: Vice President for Manufacturing, Halong Game Company
From: Controller
Subject: Activity-Based Costing
The $150,000 cost that has been characterized as fixed is fixed with respect to sales volume. This cost will not increase with increases in sales volume. However, as the activity-based costing analysis demonstrates, these costs are not fixed with respect to other important cost drivers. This is the difference between a traditional costing system and an ABC system. The latter recognizes that costs vary with respect to a variety of cost drivers, not just sales volume.
2. New break-even point if automated manufacturing equipment is installed:
Sales price ..................................................................................................... $26 Costs that are variable (with respect to sales volume):
Unit variable cost (.8 $375,000 25,000) ........................................... 12 Unit contribution margin .............................................................................. $14 Costs that are fixed (with respect to sales volume): Setup (300 setups at $40 per setup) ............................................. $ 12,000 Engineering (800 hours at $28 per hour) ..................................... 22,400 Inspection (100 inspections at $45 per inspection) .................... 4,500 General factory overhead .............................................................. 176,100 Total .......................................................................................... $215,000 Fixed selling and administrative costs .............................................. 30,000 Total costs that are fixed (with respect to sales volume) ........... $245,000
units 17,500
$14
$245,000
marginon contributiunit
costs fixed units)(in point even -Break
McGraw-Hill/Irwin 2011 The McGraw-Hill Companies, Inc.
Managerial Accounting, 9/e Global Edition 7-43
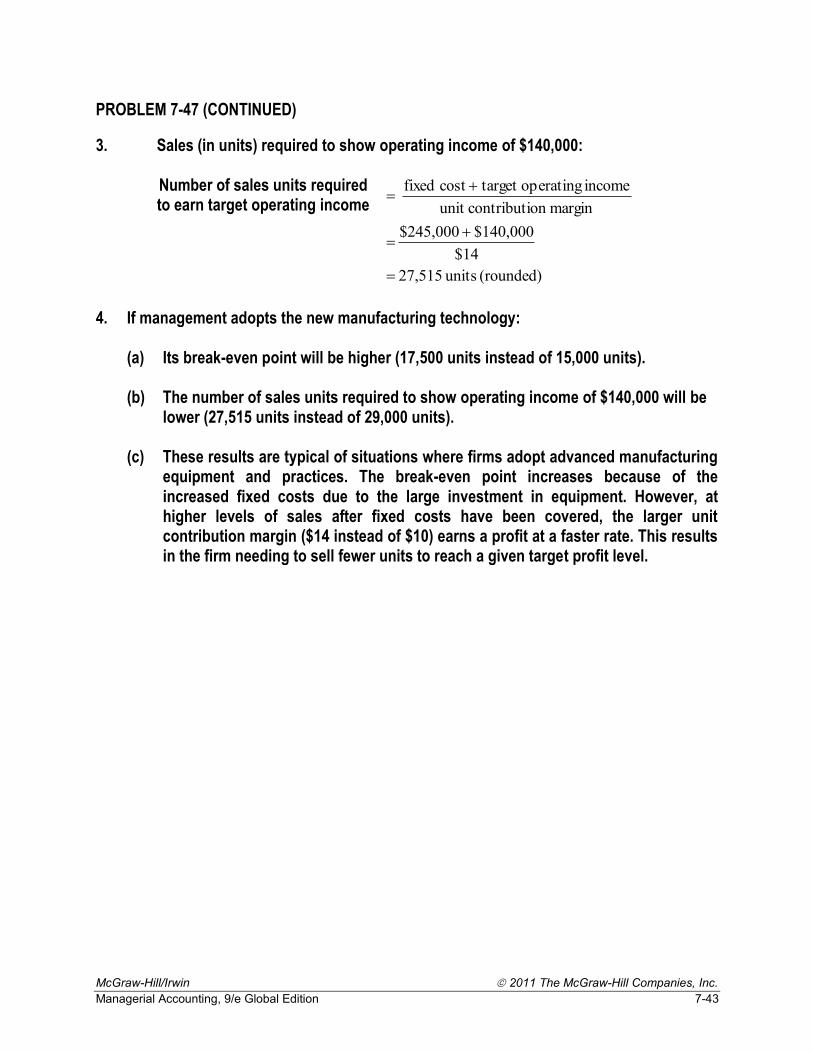
PROBLEM 7-47 (CONTINUED)
3. Sales (in units) required to show operating income of $140,000: Number of sales units required
to earn target operating income
(rounded) units 27,515
$14
$140,000 $245,000
marginon contributiunit
income operating target cost fixed
4. If management adopts the new manufacturing technology: (a) Its break-even point will be higher (17,500 units instead of 15,000 units). (b) The number of sales units required to show operating income of $140,000 will be
lower (27,515 units instead of 29,000 units). (c) These results are typical of situations where firms adopt advanced manufacturing
equipment and practices. The break-even point increases because of the increased fixed costs due to the large investment in equipment. However, at higher levels of sales after fixed costs have been covered, the larger unit contribution margin ($14 instead of $10) earns a profit at a faster rate. This results in the firm needing to sell fewer units to reach a given target profit level.
McGraw-Hill/Irwin 2011 The McGraw-Hill Companies, Inc.
7-44 Solutions Manual
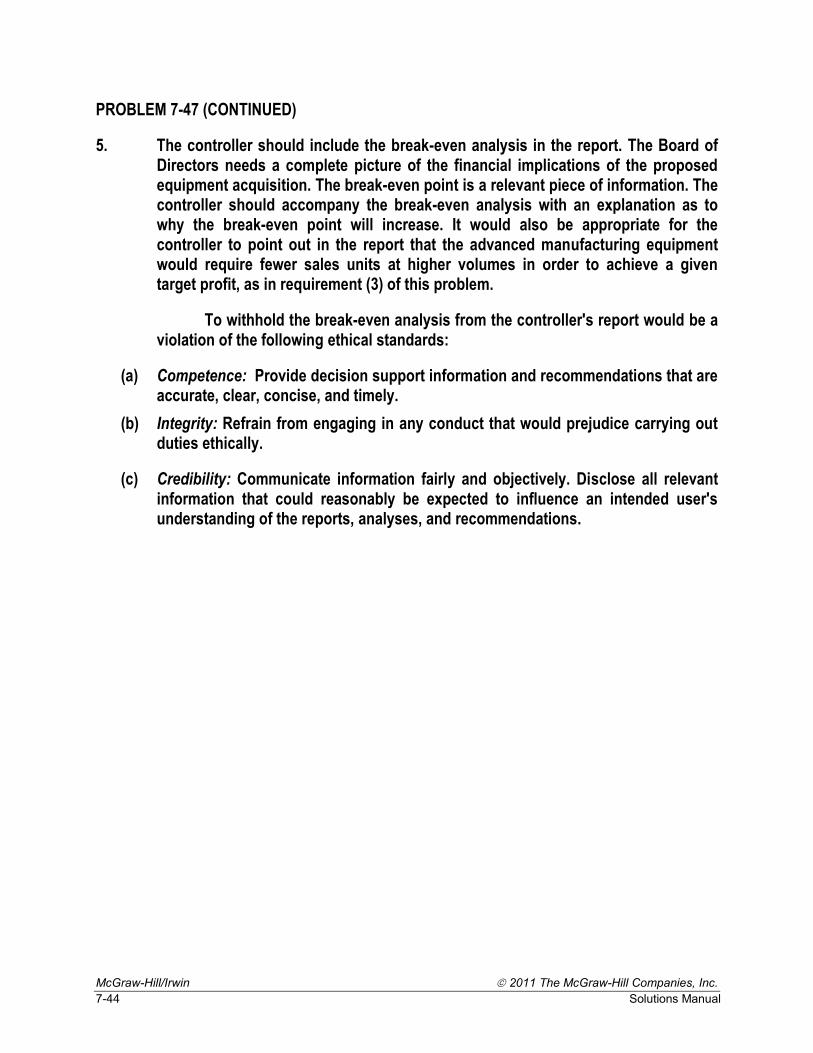
PROBLEM 7-47 (CONTINUED)
5. The controller should include the break-even analysis in the report. The Board of Directors needs a complete picture of the financial implications of the proposed equipment acquisition. The break-even point is a relevant piece of information. The controller should accompany the break-even analysis with an explanation as to why the break-even point will increase. It would also be appropriate for the controller to point out in the report that the advanced manufacturing equipment would require fewer sales units at higher volumes in order to achieve a given target profit, as in requirement (3) of this problem.
To withhold the break-even analysis from the controller's report would be a violation of the following ethical standards:
(a) Competence: Provide decision support information and recommendations that are accurate, clear, concise, and timely.
(b) Integrity: Refrain from engaging in any conduct that would prejudice carrying out duties ethically.
(c) Credibility: Communicate information fairly and objectively. Disclose all relevant information that could reasonably be expected to influence an intended user's understanding of the reports, analyses, and recommendations.
McGraw-Hill/Irwin 2011 The McGraw-Hill Companies, Inc.
Managerial Accounting, 9/e Global Edition 7-45
PROBLEM 7-48 (25 MINUTES)
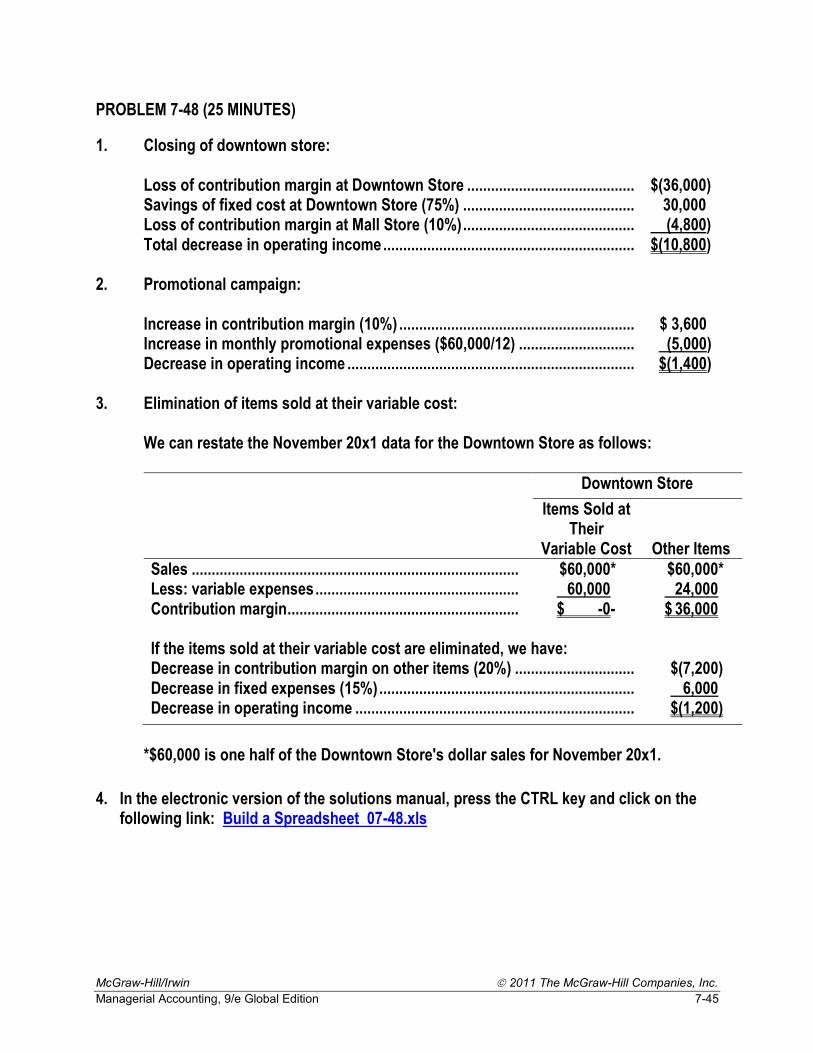
1. Closing of downtown store:
Loss of contribution margin at Downtown Store .......................................... $(36,000) Savings of fixed cost at Downtown Store (75%) ........................................... 30,000 Loss of contribution margin at Mall Store (10%) ........................................... (4,800) Total decrease in operating income ............................................................... $(10,800)
2. Promotional campaign:
Increase in contribution margin (10%) ........................................................... $ 3,600 Increase in monthly promotional expenses ($60,000/12) ............................. (5,000) Decrease in operating income ........................................................................ $(1,400)
3. Elimination of items sold at their variable cost:
We can restate the November 20x1 data for the Downtown Store as follows:
Downtown Store
Items Sold at Their
Variable Cost
Other Items
Sales .................................................................................. $60,000* $60,000* Less: variable expenses ................................................... 60,000 24,000 Contribution margin .......................................................... $ -0- $ 36,000 If the items sold at their variable cost are eliminated, we have: Decrease in contribution margin on other items (20%) .............................. $(7,200) Decrease in fixed expenses (15%) ................................................................ 6,000 Decrease in operating income ...................................................................... $(1,200)
*$60,000 is one half of the Downtown Store's dollar sales for November 20x1.
4. In the electronic version of the solutions manual, press the CTRL key and click on the following link: Build a Spreadsheet 07-48.xls
McGraw-Hill/Irwin 2011 The McGraw-Hill Companies, Inc.
7-46 Solutions Manual
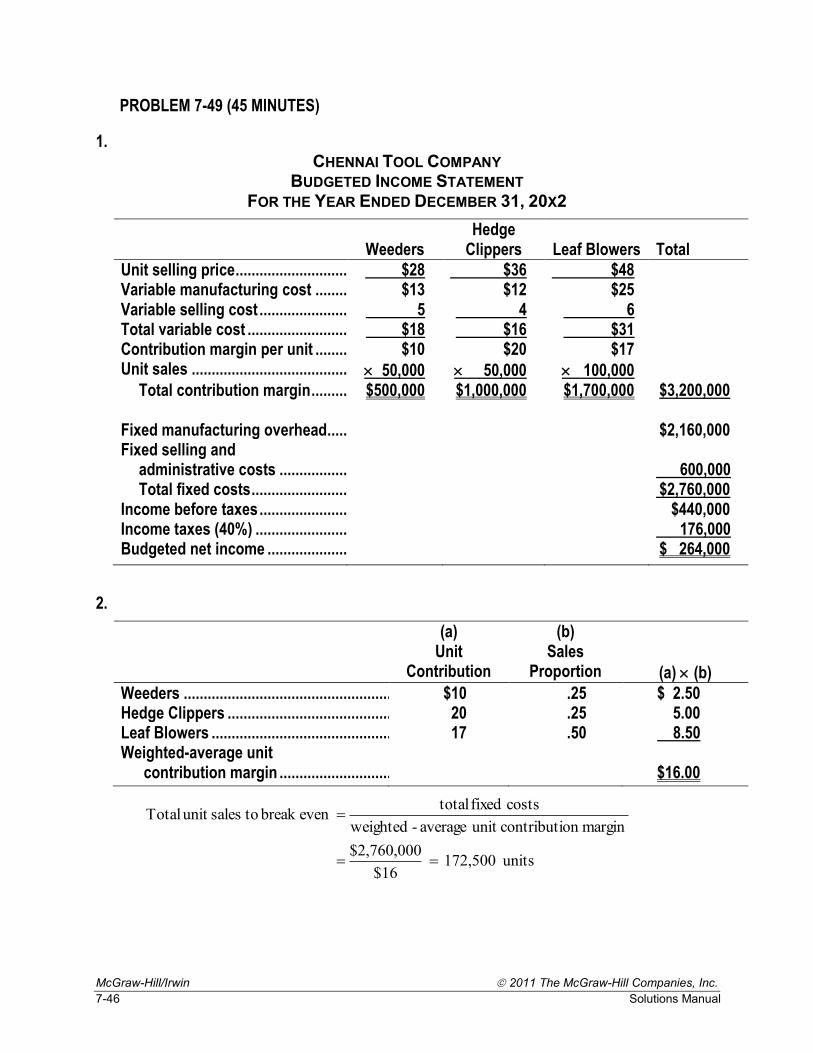
PROBLEM 7-49 (45 MINUTES)
1. CHENNAI TOOL COMPANY
BUDGETED INCOME STATEMENT FOR THE YEAR ENDED DECEMBER 31, 20X2
Weeders
Hedge Clippers
Leaf Blowers
Total
Unit selling price ............................... $28 $36 $48 Variable manufacturing cost ........... $13 $12 $25 Variable selling cost ......................... 5 4 6 Total variable cost ............................ $18 $16 $31 Contribution margin per unit ........... $10 $20 $17 Unit sales .......................................... 50,000 50,000 100,000
Total contribution margin ............ $500,000 $1,000,000 $1,700,000 $3,200,000 Fixed manufacturing overhead........ $2,160,000 Fixed selling and
administrative costs ....................
600,000 Total fixed costs ........................... $2,760,000 Income before taxes ......................... $440,000 Income taxes (40%) .......................... 176,000 Budgeted net income ....................... $ 264,000
2.
(a) Unit
Contribution
(b) Sales
Proportion
(a) (b)
Weeders ...................................................... $10 .25 $ 2.50 Hedge Clippers ........................................... 20 .25 5.00 Leaf Blowers ............................................... 17 .50 8.50 Weighted-average unit contribution margin ..............................
$16.00
units 172,500 $16
$2,760,000
marginon contributiunit average-weighted
costs fixed total even break tosalesunit Total
McGraw-Hill/Irwin 2011 The McGraw-Hill Companies, Inc.
Managerial Accounting, 9/e Global Edition 7-47
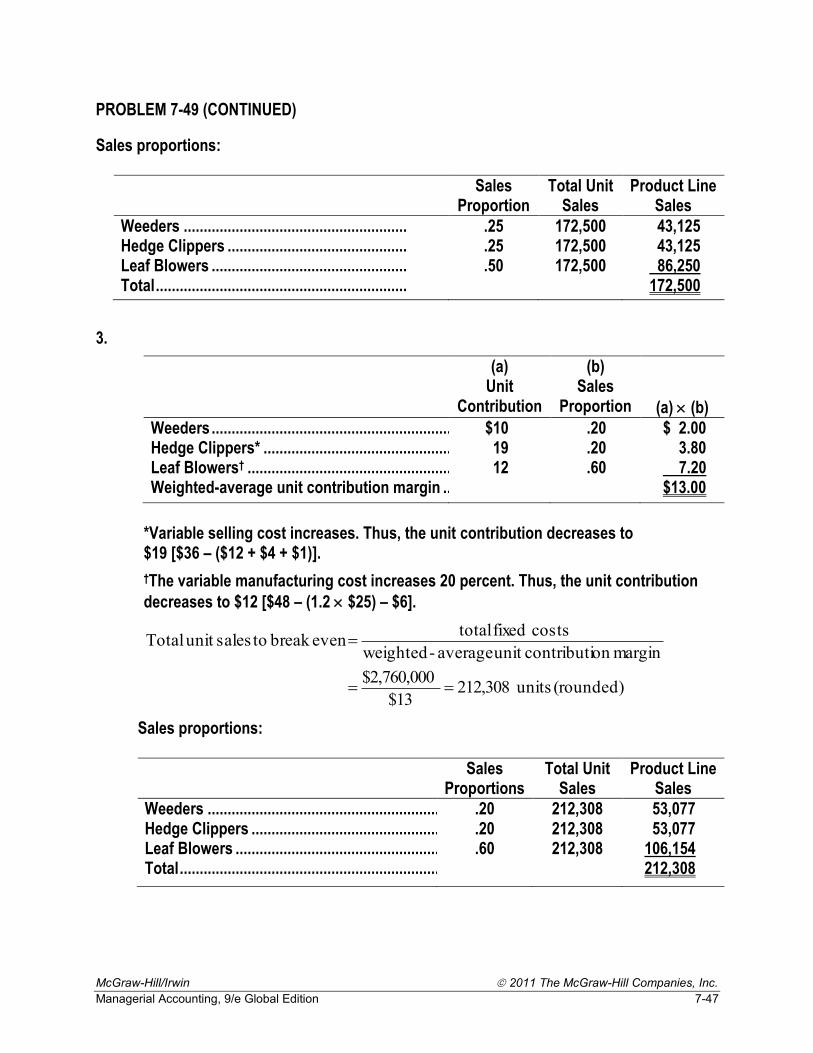
PROBLEM 7-49 (CONTINUED)
Sales proportions:
Sales Proportion
Total Unit Sales
Product Line Sales
Weeders ........................................................ .25 172,500 43,125 Hedge Clippers ............................................. .25 172,500 43,125 Leaf Blowers ................................................. .50 172,500 86,250 Total ............................................................... 172,500
3.
(a) Unit
Contribution
(b) Sales
Proportion
(a) (b)
Weeders ................................................................... $10 .20 $ 2.00 Hedge Clippers* ...................................................... 19 .20 3.80 Leaf Blowers† .......................................................... 12 .60 7.20 Weighted-average unit contribution margin ......... $13.00
*Variable selling cost increases. Thus, the unit contribution decreases to $19 [$36 – ($12 + $4 + $1)].
†The variable manufacturing cost increases 20 percent. Thus, the unit contribution
decreases to $12 [$48 – (1.2 $25) – $6].
(rounded) units 212,308 $13
$2,760,000
marginon contributiunit average-weighted
costs fixed total even break tosalesunit Total
Sales proportions:
Sales Proportions
Total Unit Sales
Product Line Sales
Weeders .............................................................. .20 212,308 53,077 Hedge Clippers ................................................... .20 212,308 53,077 Leaf Blowers ....................................................... .60 212,308 106,154 Total ..................................................................... 212,308
McGraw-Hill/Irwin 2011 The McGraw-Hill Companies, Inc.
7-48 Solutions Manual
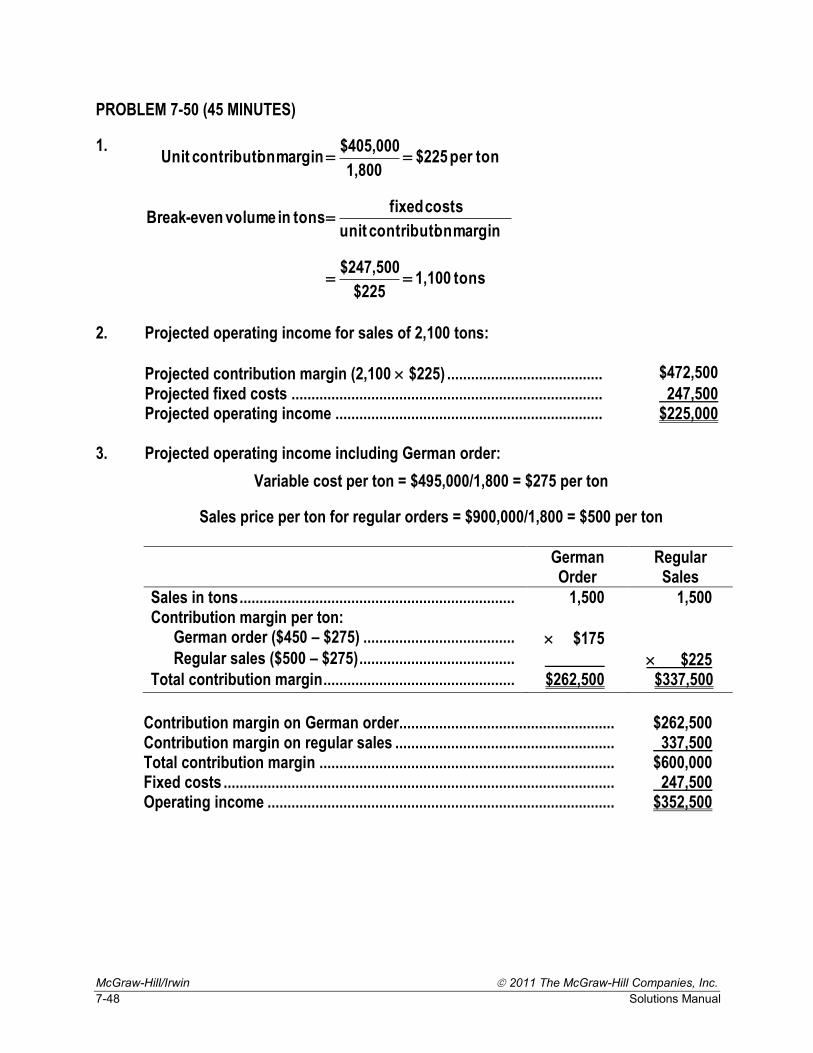
PROBLEM 7-50 (45 MINUTES)
1.
tons1,100 $225
$247,500
margin oncontributiunit
costs fixed tonsin volumeeven-Break
tonper $225 1,800
$405,000 margin oncontributiUnit
2. Projected operating income for sales of 2,100 tons:
Projected contribution margin (2,100 $225) ....................................... $472,500
Projected fixed costs .............................................................................. 247,500 Projected operating income ................................................................... $225,000 3. Projected operating income including German order:
Variable cost per ton = $495,000/1,800 = $275 per ton
Sales price per ton for regular orders = $900,000/1,800 = $500 per ton
German Order
Regular Sales
Sales in tons ..................................................................... 1,500 1,500 Contribution margin per ton: German order ($450 – $275) ...................................... $175
Regular sales ($500 – $275) ....................................... $225 Total contribution margin ................................................ $262,500 $337,500
Contribution margin on German order...................................................... $262,500 Contribution margin on regular sales ....................................................... 337,500 Total contribution margin .......................................................................... $600,000 Fixed costs .................................................................................................. 247,500 Operating income ....................................................................................... $352,500
McGraw-Hill/Irwin 2011 The McGraw-Hill Companies, Inc.
Managerial Accounting, 9/e Global Edition 7-49
PROBLEM 7-50 (CONTINUED)
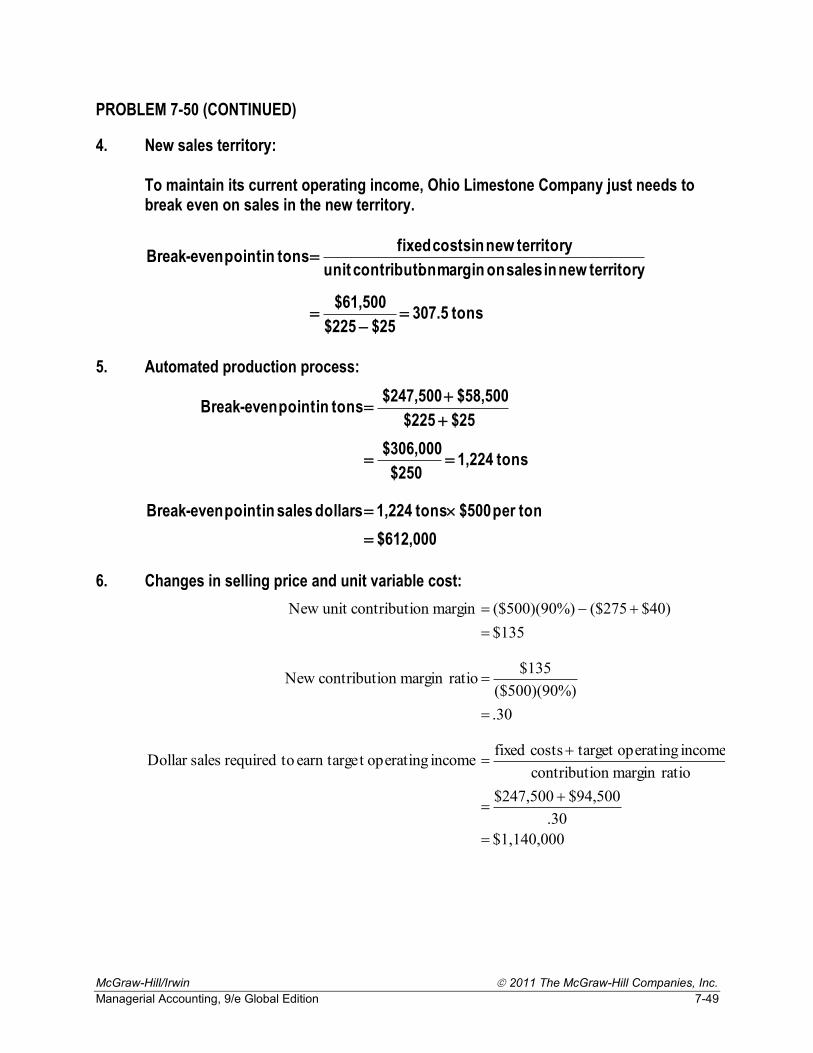
4. New sales territory:
To maintain its current operating income, Ohio Limestone Company just needs to break even on sales in the new territory.
tons307.5 $25 $225
$61,500
territorynew in sales on margin oncontributiunit
territorynew in costs fixed tonsinpoint even-Break
5. Automated production process:
$612,000
tonper $500 tons1,224 dollars sales inpoint even-Break
tons1,224 $250
$306,000
$25 $225
$58,500 $247,500 tonsinpoint even-Break
6. Changes in selling price and unit variable cost:
$1,140,000
.30
$94,500 $247,500
ratiomargin on contributi
income operating target costs fixed income operatingt earn targe torequired salesDollar
.30
)($500)(90%
$135 ratiomargin on contributi New
$135
$40) ($275 )($500)(90% margin on contributiunit New
McGraw-Hill/Irwin 2011 The McGraw-Hill Companies, Inc.
7-50 Solutions Manual
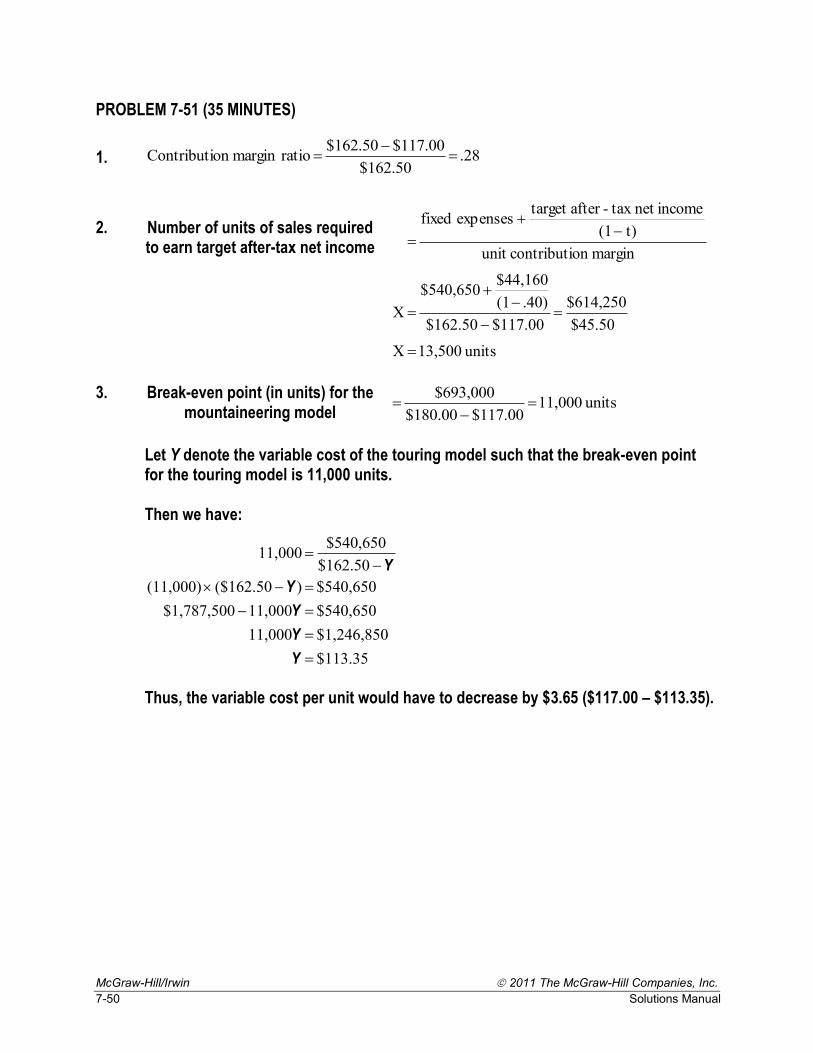
PROBLEM 7-51 (35 MINUTES)
1. .28 $162.50
$117.00 $162.50 ratiomargin on Contributi
2.
Number of units of sales required to earn target after-tax net income
units 13,500 X
$45.50
$614,250
$117.00 $162.50
.40) (1
$44,160 $540,650
X
marginon contributiunit
t) (1
incomenet tax -aftertarget expenses fixed
3. Break-even point (in units) for the
mountaineering model units 11,000
$117.00$180.00
$693,000
Let Y denote the variable cost of the touring model such that the break-even point
for the touring model is 11,000 units. Then we have:
$113.35
$1,246,850 11,000
$540,650 11,000$1,787,500
$540,650 )($162.50(11,000)
$162.50
$540,650 11,000
Y
Y
Y
Y
Y
Thus, the variable cost per unit would have to decrease by $3.65 ($117.00 – $113.35).
McGraw-Hill/Irwin 2011 The McGraw-Hill Companies, Inc.
Managerial Accounting, 9/e Global Edition 7-51
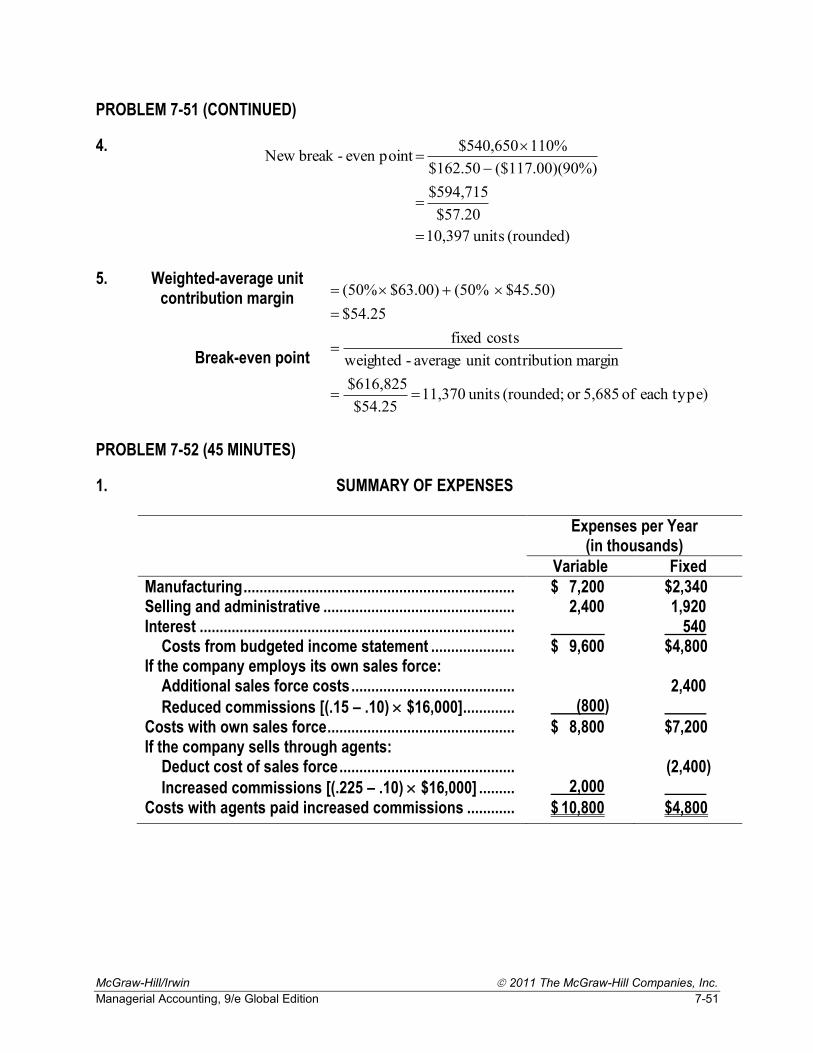
PROBLEM 7-51 (CONTINUED)
4.
(rounded) units 10,397
$57.20
$594,715
90%)($117.00)( $162.50
110% $540,650 point even -break New
5. Weighted-average unit
contribution margin
Break-even point
each type) of 5,685or (rounded; units 11,370 $54.25
$616,825
marginon contributiunit average-weighted
costs fixed
$54.25
$45.50) (50% $63.00) (50%
PROBLEM 7-52 (45 MINUTES)
1. SUMMARY OF EXPENSES
Expenses per Year (in thousands)
Variable Fixed
Manufacturing .................................................................... $ 7,200 $2,340 Selling and administrative ................................................ 2,400 1,920 Interest ............................................................................... 540 Costs from budgeted income statement ..................... $ 9,600 $4,800 If the company employs its own sales force: Additional sales force costs ......................................... 2,400
Reduced commissions [(.15 – .10) $16,000] ............. (800)
Costs with own sales force ............................................... $ 8,800 $7,200 If the company sells through agents: Deduct cost of sales force ............................................ (2,400)
Increased commissions [(.225 – .10) $16,000] ......... 2,000
Costs with agents paid increased commissions ............ $ 10,800 $4,800
McGraw-Hill/Irwin 2011 The McGraw-Hill Companies, Inc.
7-52 Solutions Manual
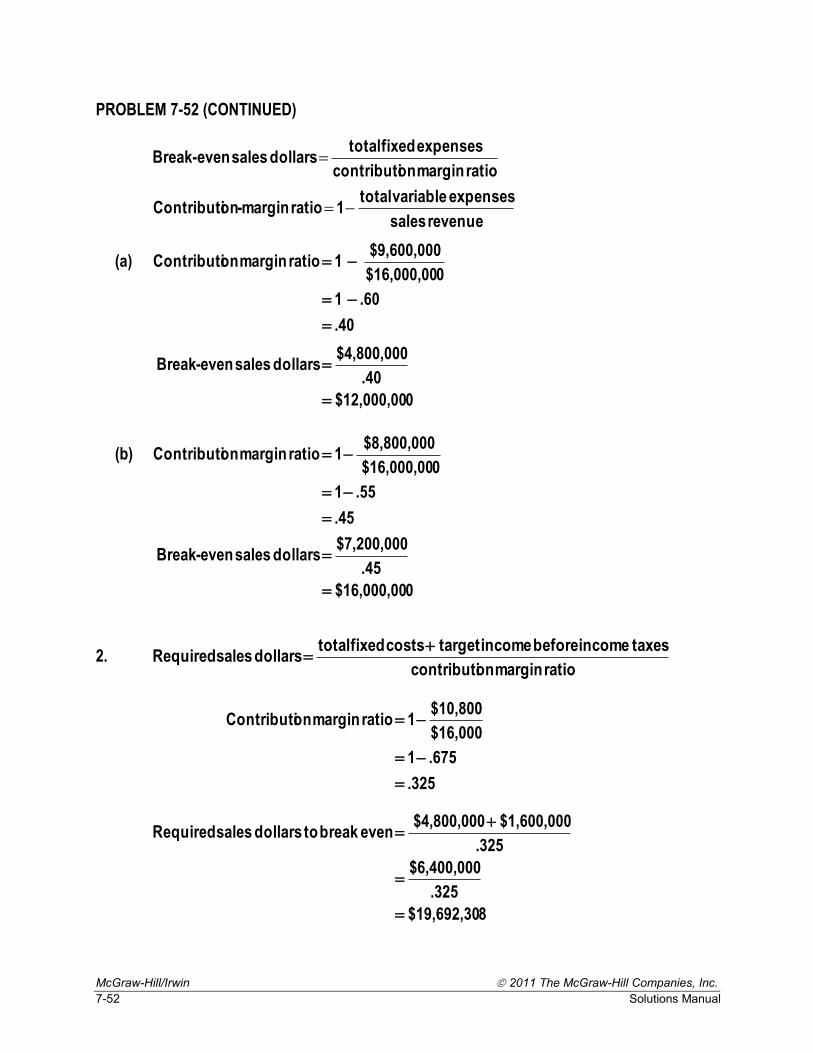
PROBLEM 7-52 (CONTINUED)
revenue sales
expenses variabletotal 1 ratio margin-onContributi
ratio margin oncontributi
expenses fixed total dollars sales even-Break
(a)
0$12,000,00
.40
$4,800,000 dollars sales even-Break
.40
.60 1
0$16,000,00
$9,600,000 1 ratio margin onContributi
(b)
0$16,000,00
.45
$7,200,000 dollars sales even-Break
.45
.55 1
0$16,000,00
$8,800,000 1 ratio margin onContributi
2.
ratio margin oncontributi
taxesincome before income target costs fixed total dollars sales Required
8$19,692,30
.325
$6,400,000
.325
$1,600,000 $4,800,000 evenbreak todollars sales Required
.325
.675 1
$16,000
$10,800 1 ratio margin onContributi
McGraw-Hill/Irwin 2011 The McGraw-Hill Companies, Inc.
Managerial Accounting, 9/e Global Edition 7-53
PROBLEM 7-52 (CONTINUED)
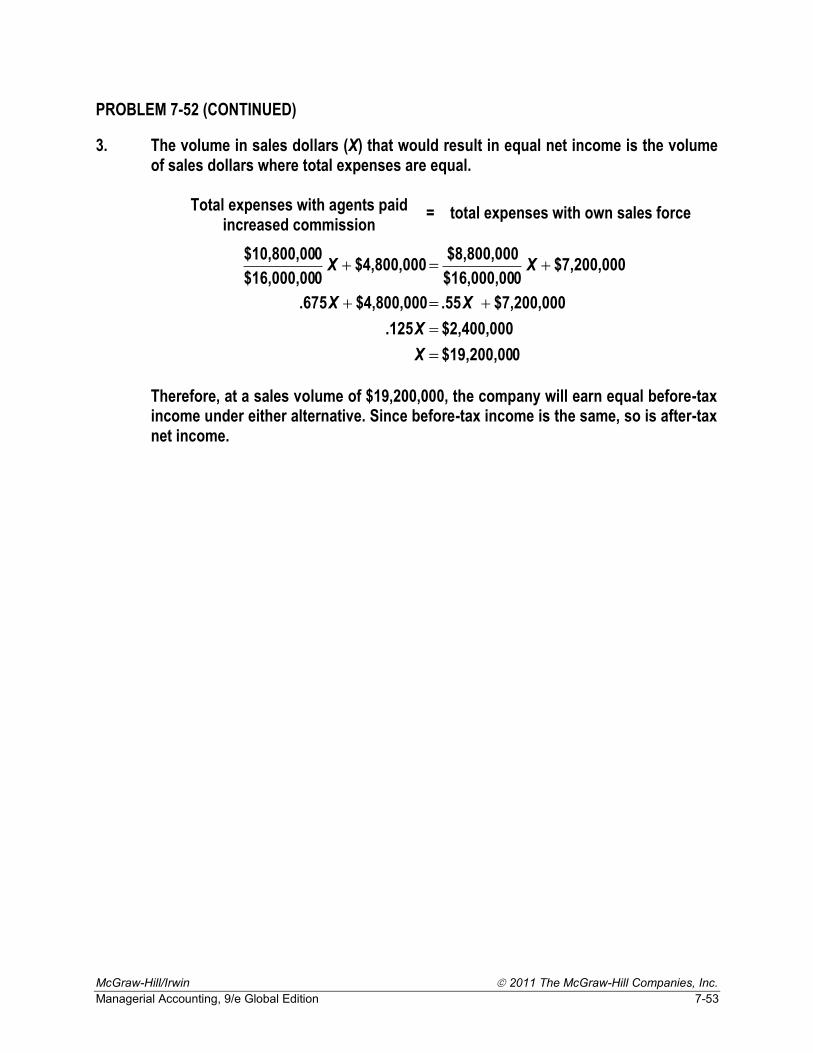
3. The volume in sales dollars (X) that would result in equal net income is the volume of sales dollars where total expenses are equal.
Total expenses with agents paid
increased commission = total expenses with own sales force
0$19,200,00
$2,400,000 .125
$7,200,000 .55 $4,800,000 .675
$7,200,000 0$16,000,00
$8,800,000 $4,800,000
0$16,000,00
0$10,800,00
X
X
X X
XX
Therefore, at a sales volume of $19,200,000, the company will earn equal before-tax
income under either alternative. Since before-tax income is the same, so is after-tax net income.