Embed Size (px)
Citation preview


Chapter 12
Cohort Studies

Overview
Cohort: a group of similar people followed through time together
A cohort study follows participants through time to calculate the rate at which new (incident) disease occurs and to identify risk factors for the disease

Overview
All cohort studies have at least two measurement times: •An initial survey that determines the baseline exposure and disease status of all participants•One or more follow-up assessments that determine how many participants have developed a new (incident) disease since the initial examination

FIGURE 12-2 Framework for a
Cohort Study
(The letters a, b, c, and d correspond to the equation shown in Figure 12-8.)

Types of Cohort Studies
Cohort studies take many forms. For simplicity, consider three main categories: •Retrospective cohort•Prospective cohort•Longitudinal cohort

Retrospective & Prospective
Both retrospective cohort studies and prospective cohort studies recruit participants based on their exposure status•One group of participants is recruited because they are known to have had a particular exposure •A second group is recruited because they are known not to have been exposed

Retrospective & Prospective
• Retrospective cohort studies use baseline information collected at some point in the past and follow the cohort to another point in the past or to the present
• Prospective cohort studies collect baseline data about exposures and outcomes in the present and follow the cohort to some point in the future

FIGURE 12-3 Times of Baseline and Follow-Up Data Collection for Cohort
Studies

Retrospective & Prospective
Recruiting based on exposure status makes retrospective and prospective cohort studies the optimal study approaches for uncommon exposures.
Because the goal of cohort studies is to examine incident disease, retrospective and prospective cohort studies must be able to demonstrate that the outcome of interest was not present in any members of the cohort at baseline.

Retrospective & Prospective
The members of the two comparison groups for both prospective and retrospective of studies should be similar except for their exposure status.

Retrospective & Prospective
Examples:•Recruit industrial workers exposed to a certain chemical and similar workers in a plant that does not use the chemical•Recruit children with high blood lead levels (indicating environmental exposure to lead) and low blood lead levels who attend the same elementary school

Longitudinal Studies
Longitudinal cohort studies recruit participants based on their membership in a well-defined source population, then follow them forward in time
•Individual participants are assessed at baseline for several exposures and diseases. •Then they are followed forward in time to determine the incidence rate for one or more outcomes of interest.

Longitudinal Studies
Examples of populations for a longitudinal study:•All the residents of one town•A representative sample of members of one professional organization•A representative group of students recruited from the same university

Longitudinal Studies
• In a longitudinal study with a fixed population, all participants start the study at the same time and no one is allowed to join later
• In a study with a dynamic population, participants are recruited using rolling admission and replacement of dropouts– For dynamic populations, the time to follow up is
usually based on individual participants’ dates of enrollment rather than on a fixed calendar date

FIGURE 12-4 Longitudinal Studies

Retention
For prospective and longitudinal studies, loss of participants to follow-up before the end of the study period is a major concern.
Researchers must develop strategies that minimize the burden of participation and that maximize interest in continuing to participate.

Information Bias
All participants must complete the same assessments of exposure and disease at baseline and follow-up to prevent the information bias that might result when exposed participants are more thoroughly examined for disease than unexposed participants.

Analysis: Incidence
Incidence rate = the number of new cases of disease in a population during a specified period of time divided by the total number of persons in the population who were at risk during that period
Individuals who already have the disease of interest at the start of the study period are not at risk of getting new disease, so they are removed from the denominator

FIGURE 12-5 Incidence

Analysis: Person-Years
• Some cohort studies use person-time as a denominator rather than simply counting persons
• Person-time is a way of accounting for different individuals in the study population being observed for different lengths of time
• Example: Over 4 years in a dynamic study, 10 participants may contribute 33 person-years of observation

FIGURE 12-6 Person-Year Analysis

Analysis: Attributable Risk
Excess risk = attributable risk (AR) = the absolute difference in the incidence rate between the exposed population and the unexposed population•Example: If 10% of the unexposed and 15% of the exposed became ill during the study period, then the excess risk in the exposed was 15% – 10% = 5%
This number represents the additional risk of disease in the exposed that can be attributed to the exposure

Analysis: AR%
Attributable risk percent (AR%) = the proportion of incident cases among the exposed that are due to the exposure•Example: If 10% of the unexposed and 15% of the exposed became ill during the study period, then the AR% is 5% ÷ 15% = 33%•One-third of the cases of disease in the exposed could have been prevented if the exposure was removed

FIGURE 12-7
Attributable (Excess)
Risk

Analysis: RRs
Rate ratio (RR) = relative rate = risk ratio = relative risk = ratio of the incidence rate among the exposed to the incidence rate in the unexposed

FIGURE 12-8 Rate Ratio (Point Estimate)

Analysis: RRs
• RR = 1: the incidence rate was the same in the exposed and in the unexposed, so the exposure is not associated with the disease
• RR > 1: then the incidence rate was higher in the exposed than in the unexposed, so the exposure was risky
• RR < 1: the incidence rate was lower in the exposed than in the unexposed, so the exposure was protective
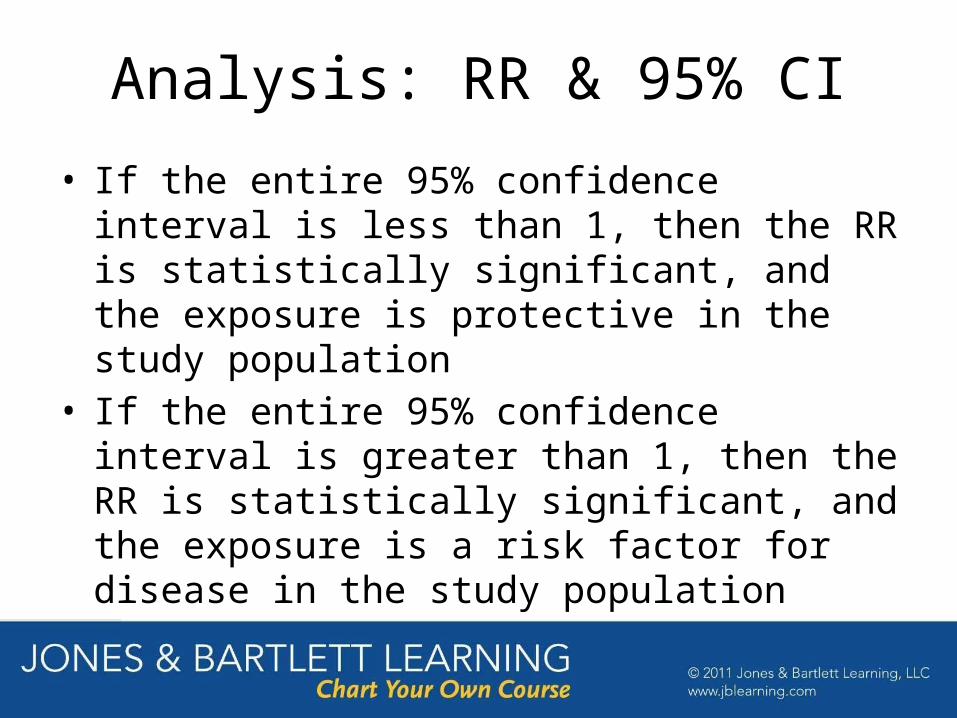
Analysis: RR & 95% CI
• If the entire 95% confidence interval is less than 1, then the RR is statistically significant, and the exposure is protective in the study population
• If the entire 95% confidence interval is greater than 1, then the RR is statistically significant, and the exposure is a risk factor for disease in the study population

Analysis: RR & 95% CI
• 95% confidence interval (95% CI) overlaps RR = 1– The lower end of the confidence interval is less
than 1, suggesting protection– The higher end of the confidence interval is greater
than 1, suggesting risk– Conclusion: The RR is not statistically significant,
and the exposure and disease are deemed to have no association

FIGURE 12-9 Interpretation of the Rate Ratio Based on Its 95% Confidence Interval
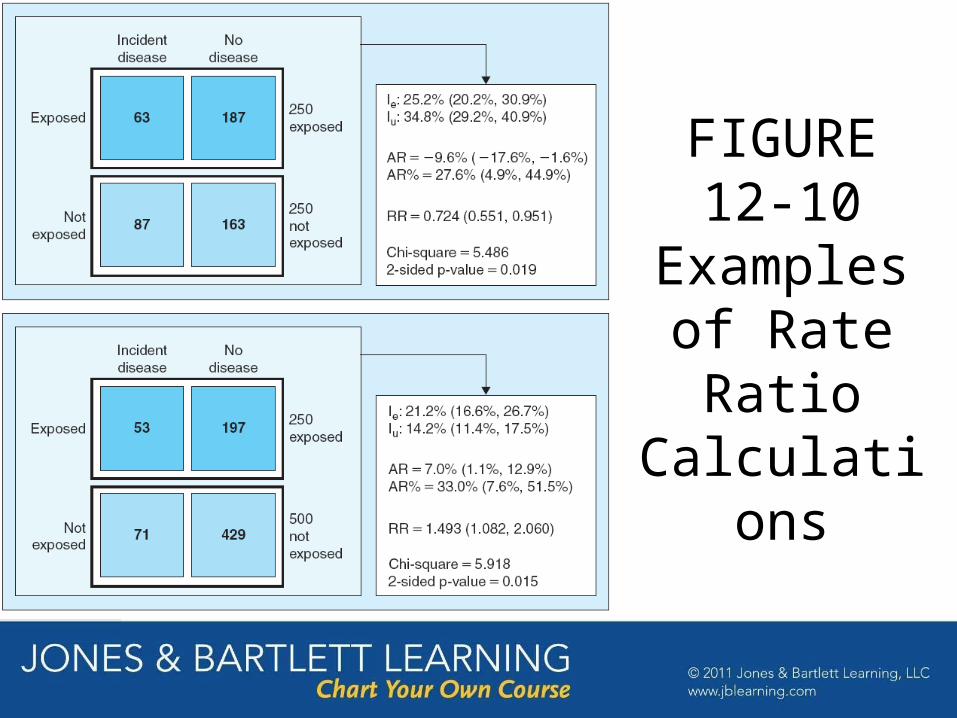
FIGURE 12-10 Examples of Rate Ratio Calculations

FIGURE 12-1 Key Characteristics of Cohort Studies

FIGURE 12-1 Key Characteristics of Cohort Studies