Embed Size (px)
Citation preview

Session 66, Predictive Analytics Tools for Life Insurance
Moderator:
Dorothy L. Andrews, ASA, MAAA
Presenter: Dorothy L. Andrews, ASA, MAAA Missy A. Gordon, FSA, MAAA Timothy S. Paris, FSA, MAAA

2016 Valuation ActuarySymposium
Predictive Modeling Tools for Life InsuranceSession 066
August 30, 2016
Dorothy L. Andrews, ASA, MAAAConsulting ActuaryMerlinos & Associates
2
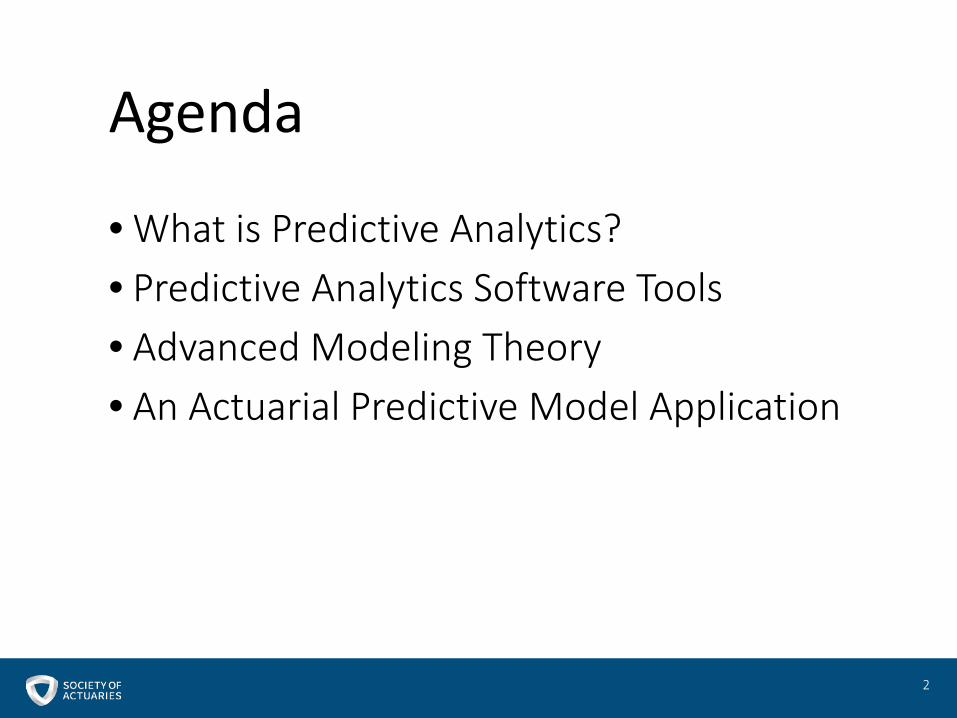
Agenda
• What is Predictive Analytics?• Predictive Analytics Software Tools• Advanced Modeling Theory• An Actuarial Predictive Model Application

3
Predictive Analytics – Science or Art?
“The practice of extracting information from existing
data sets in order to determine patterns and
predict future outcomes and trends.”
-Webopedia
“The use of data, statistical algorithms and
machine-learning techniques to identify the likelihood of future
outcomes based on historical data.”
- SAS
“It’s the process of using modeling and data
analysis techniques on large data sets to
discover predictive patterns and
relationships for business use.”
- SOA

4
Common Themes
• Identification of Historical Big Data • Application of Advanced Mathematical Theory• Determination of Predictive Data Patterns• Forecasting of Likely Future Data Patterns• Application of Model to Improve Business Results

5
Current Technologies for Modeling
Technology Programming GLM Method Machine Learning Documentation
R Yes Yes Yes Yes
Python Yes Yes Yes Yes
SAS & SPSS Yes Yes Yes Yes
DataRobot No Yes Yes Only on Screen
Skytree No No Yes Only on Screen
Talon No Yes Yes Yes – Excel Files
Emblem No Yes No Yes

6
Big Data AnalyticsData Reduction Techniques
Descriptive
Descriptive statistics used to condense big data into easily
digestible nuggets of information.
Prescriptive
A predictive model that uses feedback
data to improve information used in
decision making.
Predictive
Probability based forecasts allowing
for extrapolations to future time periods
where data does not exist.
Dr. Michael Wu, Chief Scientist, Lithium Technologies
7
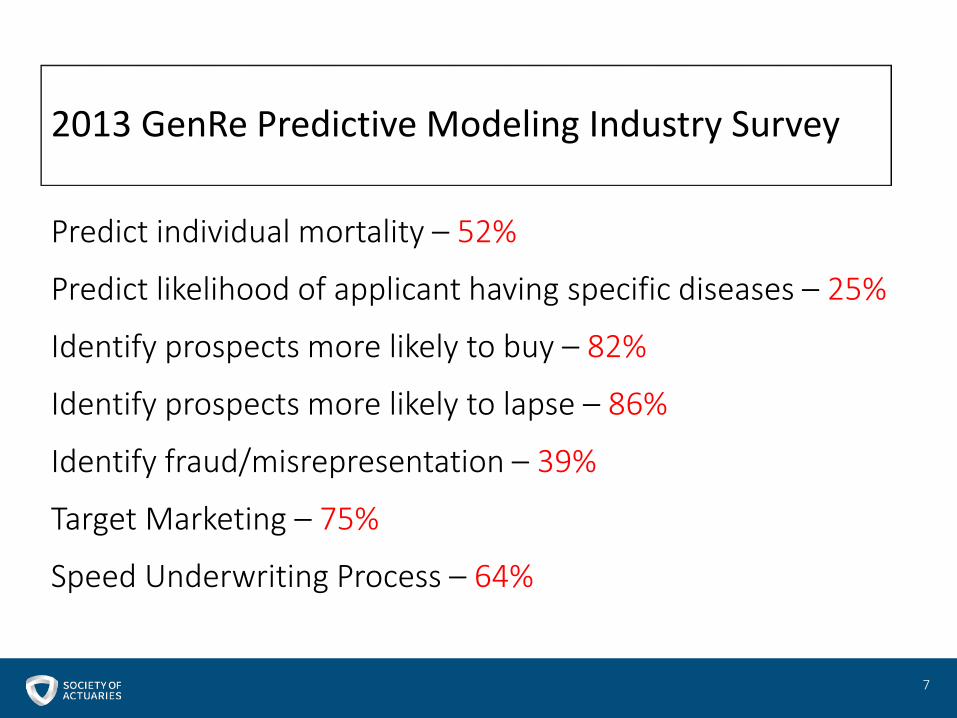
Predict individual mortality – 52%
Predict likelihood of applicant having specific diseases – 25%
Identify prospects more likely to buy – 82%
Identify prospects more likely to lapse – 86%
Identify fraud/misrepresentation – 39%
Target Marketing – 75%
Speed Underwriting Process – 64%
2013 GenRe Predictive Modeling Industry Survey

2016 Valuation ActuarySymposium
Predictive Modeling Tools for Life InsuranceSession 066
August 30, 2016
Timothy Paris, FSA, MAAAChief Executive Officer Ruark Consulting LLC

Behavioral Analytics
9

Frequency
10

Severity
11

Modeling Techniques
12

13
y|xSimple Linear Modeling
E(y|x)Classical Linear Modeling
g[E(y|x)]Generalized Linear Modeling
(GLM)Flexible framework
Non-normal
Non-constant variance

Generalized Linear Modeling
14

15
Poisson Regression Model
ln 𝜇𝜇 = 𝛽𝛽0 + �𝛽𝛽𝑖𝑖𝑥𝑥𝑖𝑖
Counts, such as number of claims

16
Exponential Regression Model
1𝜇𝜇
= 𝛽𝛽0 + �𝛽𝛽𝑖𝑖𝑥𝑥𝑖𝑖
Positive values, such as claim amounts

17
Logistic Regression Model
ln𝜇𝜇
1 − 𝜇𝜇= 𝛽𝛽0 + �𝛽𝛽𝑖𝑖𝑥𝑥𝑖𝑖
Binary values, such as surrenders or deaths

Cluster Analysis
18

Torture the datauntil the cohorts
are identified!
19

Decision Tree Analysis
20

Effectivetop-down
classification
21

Greedyalgorithms
22

Random Forests
23

24

Machine Learning
25

Can a computer programinfer distribution functions
as well as you can?
26

Data Considerations
27

Internal Data
28
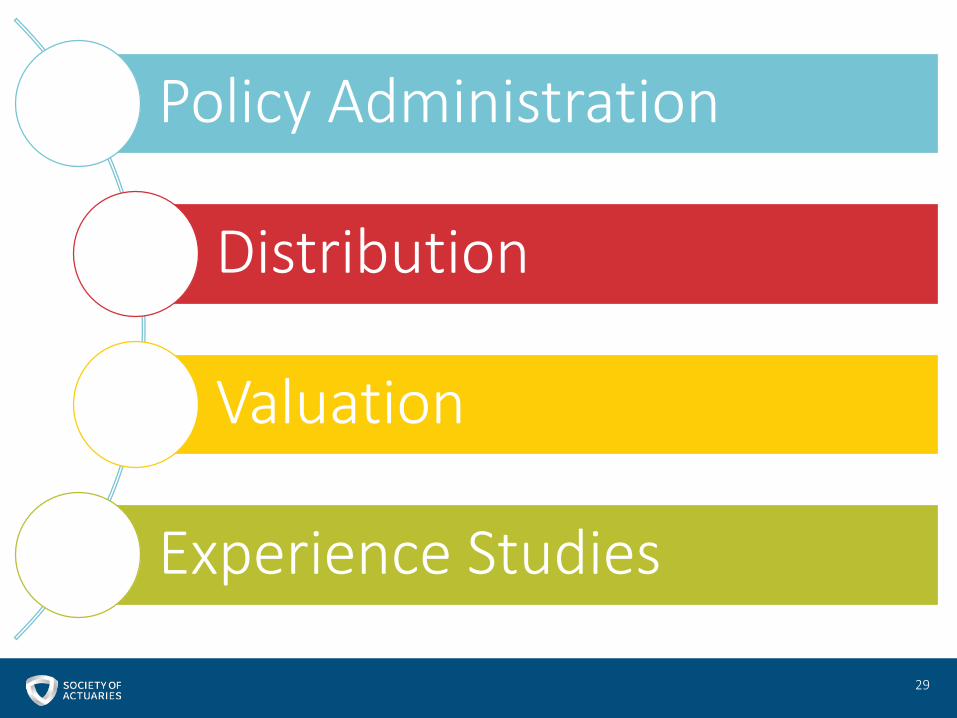
29
Policy Administration
Distribution
Valuation
Experience Studies

External Data
30

31
Direct vs Third Party
Public vs Private
Exact vs Proxy
Validity vs Propriety

Data Scrubbing
32

33
Who Cared
Which Fields
Control Totals
Reasonable Visuals

The Art ofData Preparation
34

35
Ideals Usability

An Actuarial Predictive Model Application2016 Valuation Actuary SymposiumPredictive Modeling Tools for LTC InsuranceSession 066August 30, 2016
Missy Gordon, FSA, MAAAPrincipal and Consulting ActuaryMilliman, Inc.

Model development process
37
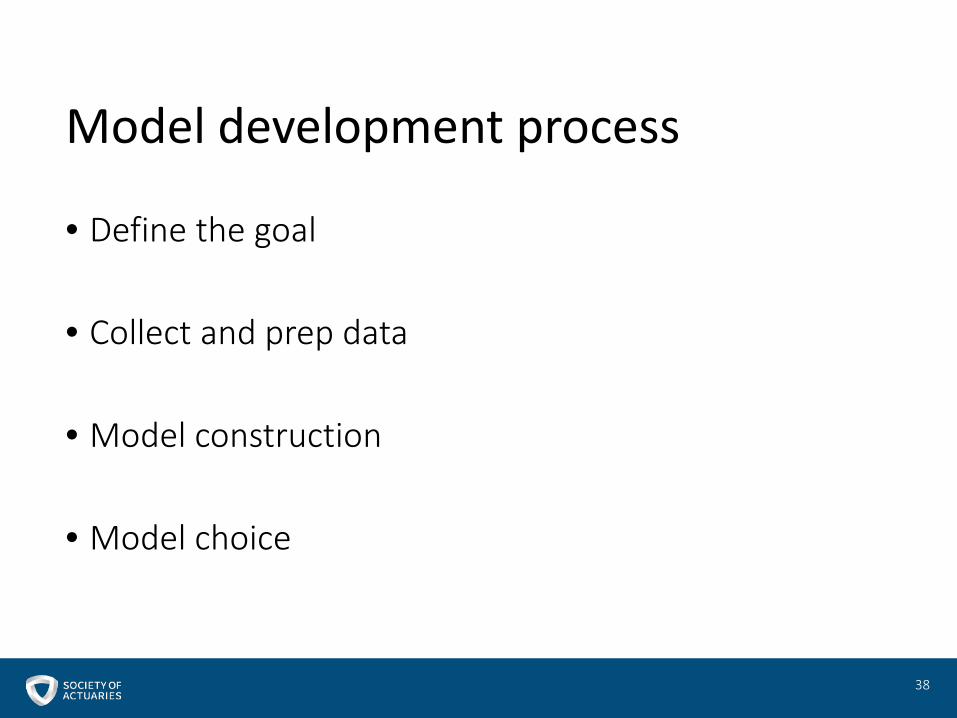
• Define the goal
• Collect and prep data
• Model construction
• Model choice
38
Model development process

Define the goal
39

• What problem are we trying to solve?
• LTC claimant’s length of stay
• Predict for existing and future claimants
• What do we want to get out of model?
• Inference, prediction, or maybe little of both
• New or update to existing assumption
40
Define the
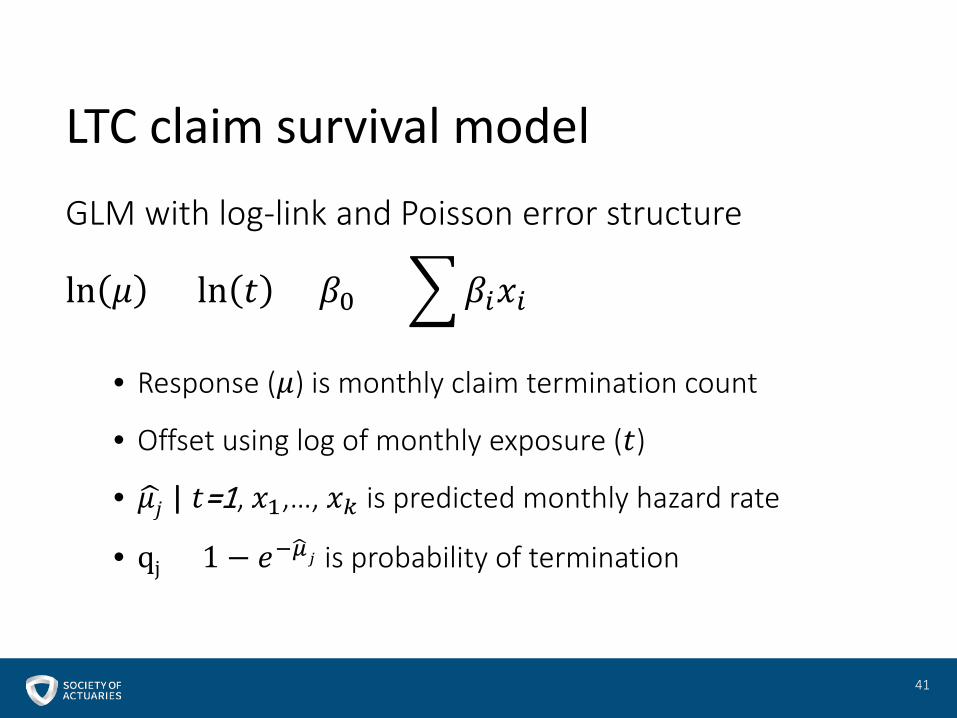
GLM with log-link and Poisson error structure
ln 𝜇𝜇 = ln 𝑡𝑡 + 𝛽𝛽0 + �𝛽𝛽𝑖𝑖𝑥𝑥𝑖𝑖
• Response (𝜇𝜇) is monthly claim termination count
• Offset using log of monthly exposure (𝑡𝑡)
• �𝜇𝜇𝑗𝑗 | 𝑡𝑡=1, 𝑥𝑥1,…, 𝑥𝑥𝑘𝑘 is predicted monthly hazard rate
• qj = 1 − 𝑒𝑒−�𝜇𝜇𝑗𝑗 is probability of termination
41
LTC claim survival model

• Use offset to update for• New experience
• Additional variables
• What is an offset?• Existing assumption as base rate
• Model adjusts only if experience deviates
ln 𝜇𝜇 = ln 𝑡𝑡 ∗ 𝑏𝑏𝑏𝑏𝑏𝑏𝑒𝑒 𝑟𝑟𝑏𝑏𝑡𝑡𝑒𝑒 + �𝛽𝛽𝑖𝑖𝑥𝑥𝑖𝑖
42
Update existing assumptions

Collect and prep data
43

• 15 years of seriatim LTC claim data
• Observation: monthly termination flag (1 or 0)
• Exposure: proportion of time on claim in a month
• Aggregate data to speed up computations
44
The data

• Training, validation, and optional final testing
• In-time sample vs. Out-of-time sample
45
Separating the data
Training ~ 60% Validation ~ 20% Test ~ 20%
2000 2001 2002 2003 2004 2005 2006 2007 2008 2009 2010 2011 2012 2013 2014

46
Training ~ 60% Validation ~ 20% Test ~ 20%
2000 2001 2002 2003 2004 2005 2006 2007 2008 2009 2010 2011 2012 2013 2014
Training ~ 80% Test ~ 20%
2000 2001 2002 2003 2004 2005 2006 2007 2008 2009 2010 2011 2012 2013 2014
Training ~ 100%
2000 2001 2002 2003 2004 2005 2006 2007 2008 2009 2010 2011 2012 2013 2014

47
K-fold cross-validation

Model construction
48

= Domain knowledge
+Exploratory data analysis
49
Feature Engineering

• Visualize data to aid in feature engineering
• Decision trees may help gain relationship insight
• GAMs can explore non-linear relationships
• Use training data only to avoid knowledge leak
50
Exploratory data analysis

51

52

53

• Pros
• Automated and easy to use
• Useful way to analyze key drivers
• Cons
• Variables are selected based off of training data only
• Prone to overfitting
• Issues handling multicollinearity
• Takes longer than forward or backward selection
54
Bi-directional stepwise selection

• Lasso, Ridge, and Elastic Net
• Pros
• Control overfitting by minimizing prediction error
• Provide variable selection (shrinking coefficients)
• Cons
• Tuning hyper-parameters (e.g., shrinkage)
• Biased standard error estimates
55
Regularization methods

ln 𝜇𝜇 = ln 𝑡𝑡 + 𝛽𝛽0 + �𝛽𝛽𝑖𝑖𝑥𝑥𝑖𝑖
�𝜇𝜇𝑗𝑗 | 𝑡𝑡=1, 𝑥𝑥1,…, 𝑥𝑥𝑘𝑘 is predicted monthly hazard rate for observation j
�𝜇𝜇𝑗𝑗 = 𝑒𝑒�𝛽𝛽0 × 𝑒𝑒�𝛽𝛽1𝑥𝑥1 × ⋯× 𝑒𝑒�𝛽𝛽𝑘𝑘𝑥𝑥𝑘𝑘𝑒𝑒�𝛽𝛽0 = baseline monthly hazard rate
𝑒𝑒�𝛽𝛽𝑖𝑖𝑥𝑥𝑖𝑖 = multiplicative factor to adjust baseline for variable 𝑥𝑥𝑖𝑖
qj = 1 − 𝑒𝑒−�𝜇𝜇𝑗𝑗 is probability of termination in a given month
𝑆𝑆𝑗𝑗 = 𝑆𝑆𝑗𝑗−1 × (1 − 𝑞𝑞𝑗𝑗) is survival to end of month j
56
How to interpret the model
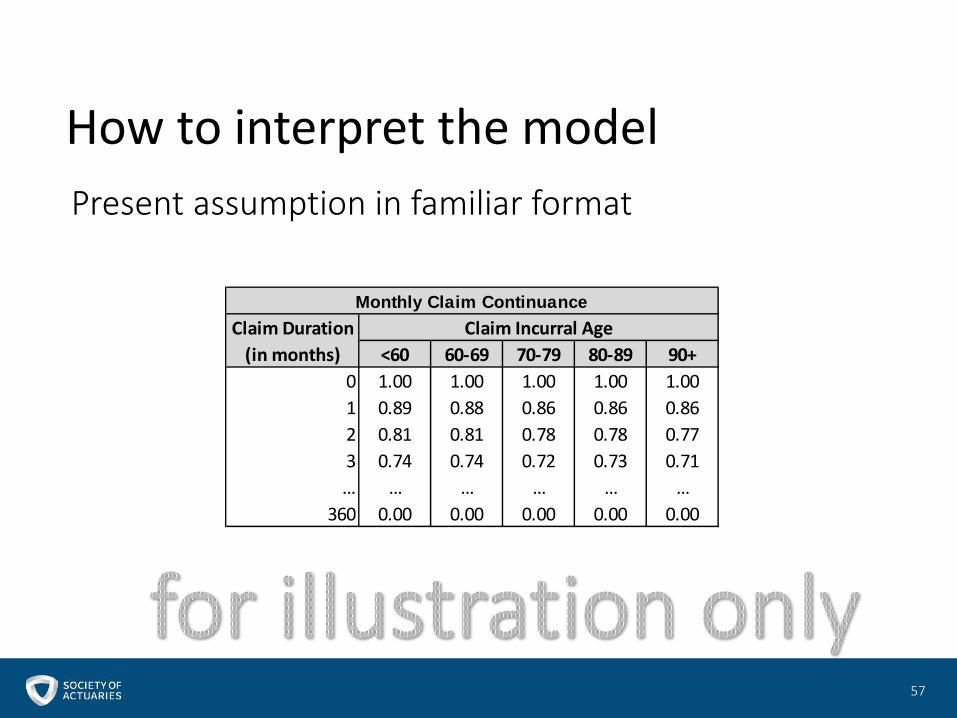
Present assumption in familiar format
How to interpret the model
57
Monthly Claim ContinuanceClaim Duration Claim Incurral Age
(in months) <60 60-69 70-79 80-89 90+0 1.00 1.00 1.00 1.00 1.001 0.89 0.88 0.86 0.86 0.862 0.81 0.81 0.78 0.78 0.773 0.74 0.74 0.72 0.73 0.71… … … … … …
360 0.00 0.00 0.00 0.00 0.00

Model choice
58

• Metrics on training data • In-sample prediction metrics - AIC, BIC, etc.• Includes adjustments to penalize model complexity
• Metrics on unseen data (i.e., validation set)• Standard error metrics - MAE, MSE, AUC, deviance, etc.• No need to adjust for model complexity
• K-fold cross-validation • Use training data to produce out-of-fold error metrics • Computationally intensive
59
Metrics for choosing a model

• Validation data to choose between models
• Standard error metrics
• Actual-to-expected analysis
• Lift chart
• Quantiles of differences
• Choose benchmark to compare and test model
60
Choosing the final model

61
Choosing the final modelPoisson Deviance Summary on Validation Set
Summary Level Base Model New Model ImprovementOverall Overall 15,015 14,593 3%Gender F 8,577 8,326 3%Gender M 6,438 6,267 3%Care Setting ALF 3,696 3,799 -3%Care Setting HHC 5,020 4,863 3%Care Setting SNF 6,299 5,931 6%Duration 1 263 240 9%Duration 2 415 356 17%Duration 3 444 394 13%Duration 4 558 432 29%Duration 5 410 357 15%Duration 6 356 355 0%Duration 7 278 284 -2%Duration 8 353 352 0%Duration 9 297 305 -2%Duration 10 296 307 -4%Duration 11 224 236 -5%Duration 12 288 295 -3%
AtoE Analysis on Validation SetSummary Level Base Model New Model ImprovementOverall Overall 1.03 1.01 2%Gender F 1.01 1.00 1%Gender M 1.05 1.02 3%Care Setting SNF 1.07 1.05 2%Care Setting ALF 0.77 0.82 4%Care Setting SNF 1.07 1.05 2%Gender F SNF 1.05 1.04 2%Situs F ALF 0.77 0.82 5%
F HHC 1.08 1.04 4%M SNF 1.12 1.08 4%M ALF 0.78 0.81 3%M HHC 1.07 1.03 4%
Tax Status TQ 1.01 0.98 -2%NTQ 1.03 1.02 1%
Incurred Age LE_59 1.28 1.22 6%60_69 1.19 1.12 7%70_79 1.03 1.00 3%80_89 0.99 0.99 0%GE_90 1.06 1.04 2%

62
Choosing the final model

• Refit on combined calibration and validation data
• Re-run prior tests on the final testing data
• If predictive, then refit on all data and use it
• Otherwise, abandon and look for other methods
63
Testing the final model

64
Questions
Presenter Contact Info:
Timothy S Paris, FSA, MAAAChief Executive Officer Ruark Consulting LLC 530 Hopmeadow StreetSimsbury, CT 06070Tel: (860) 866-7786 Email: [email protected]
Missy Gordon FSA, MAAAPrincipal and Consulting ActuaryMilliman8500 Normandale Lake Boulevard, Suite 1850
Minneapolis, MN 55437-3830Tel: (952) – 820 – 2478 Email:[email protected]
Dorothy L. Andrews, ASA, MAAAConsulting ActuaryMerlinos & Associates3274 Medlock Bridge RoadPeachtree Corners, GA 30092Tel: (687) 684-4869 Email: [email protected]