Embed Size (px)
Citation preview

6.4 Graphs of 6.4 Graphs of Sine and CosineSine and Cosine
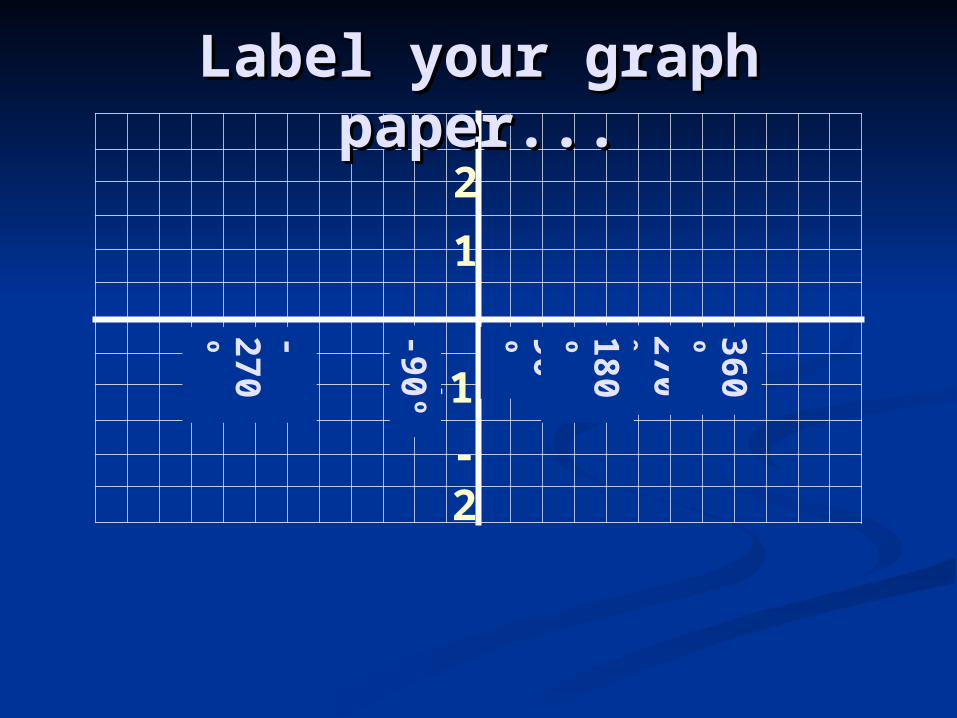
90º
270º
180º
1
2
-2
-1
360º
-270º
-90º
Label your graph paper...Label your graph paper...
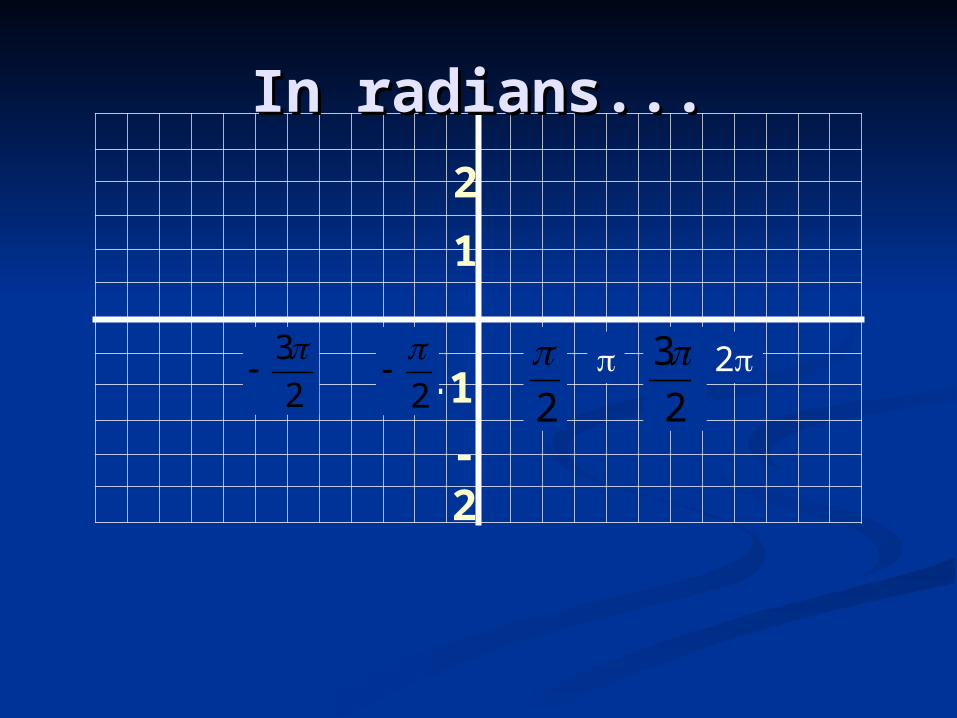
1
2
-2
-1
2
3
2
22
3
2
In radians...In radians...
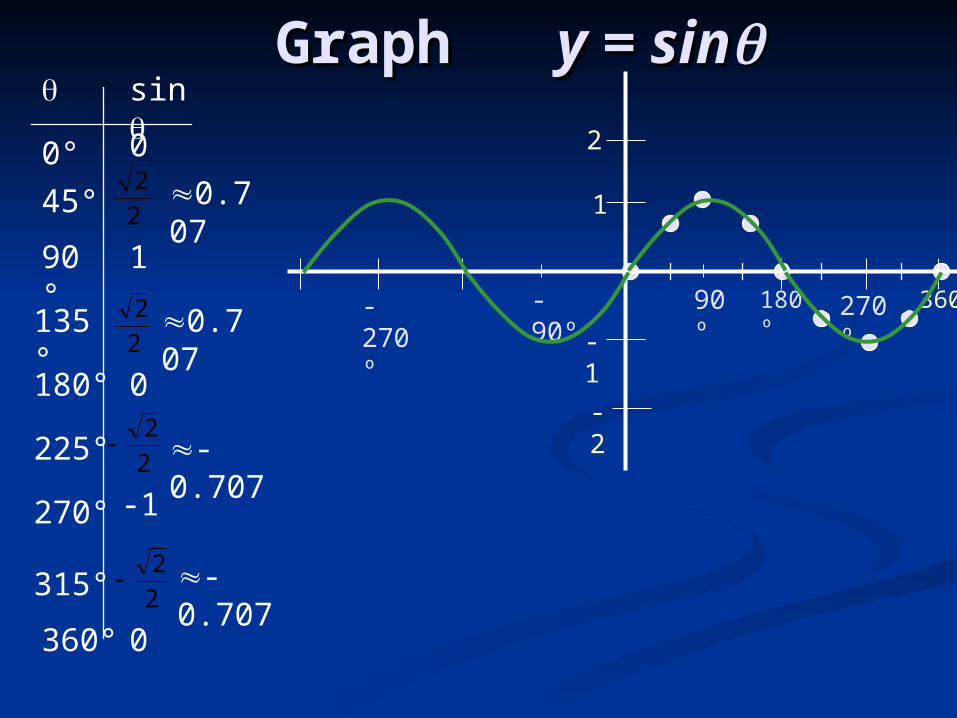
Graph Graph y = siny = sin
90º-90º 270º-270º-1
-2
sin
0°
45°
90°
135°
180°
225°
270°
315°
360°
0
0
0
1
-1
0.707
0.707
-0.707
-0.707
180º 360º
2
2
2
2
2
2
2
2
2
1
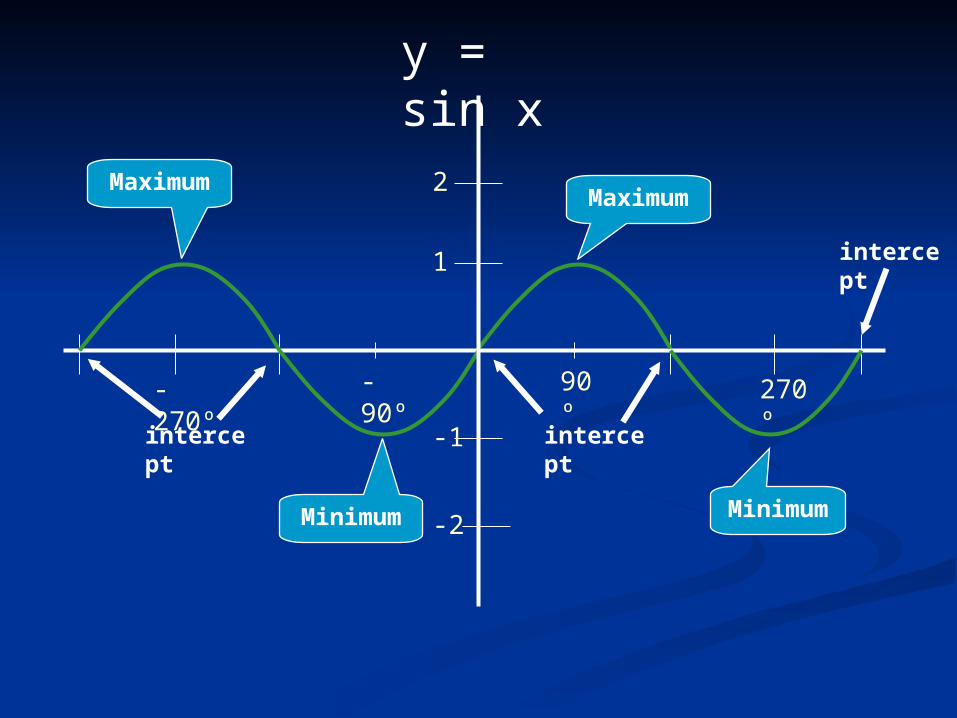
y = sin x
90º-90º 270º-270º
1
-1
2
-2
MaximumMaximum
MinimumMinimum
intercept intercept
intercept
y = sin x
90º-90º 270º-270º
1
-1
2
-2 Period: 360°
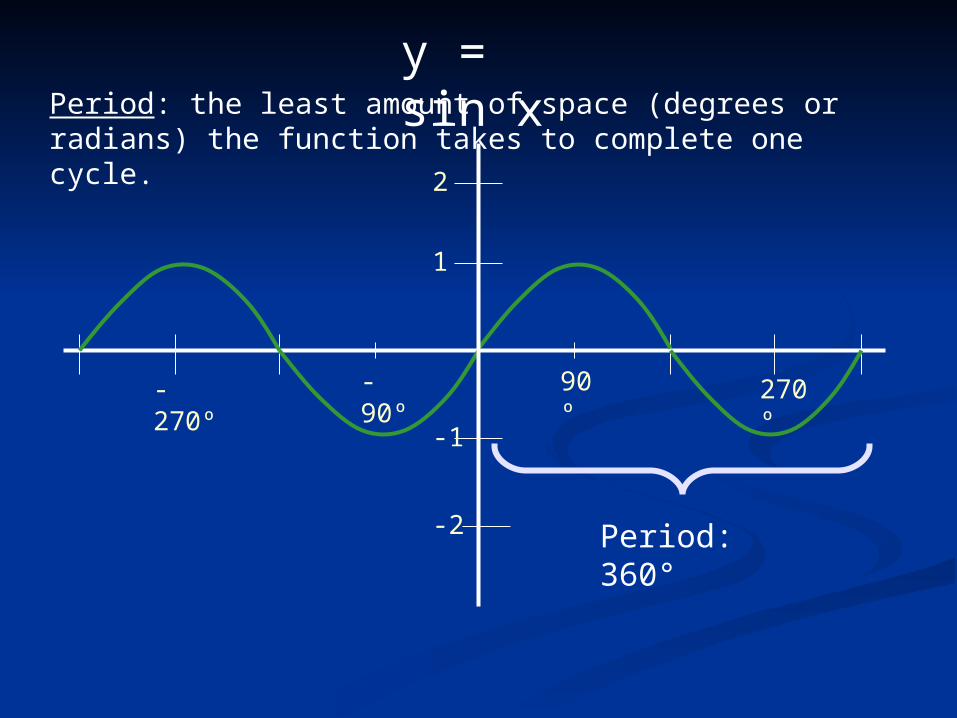
Period: the least amount of space (degrees or radians) the function takes to complete one cycle.
y = sin x
90º-90º 270º-270º
1
-1
2
-2
Amplitude = 1
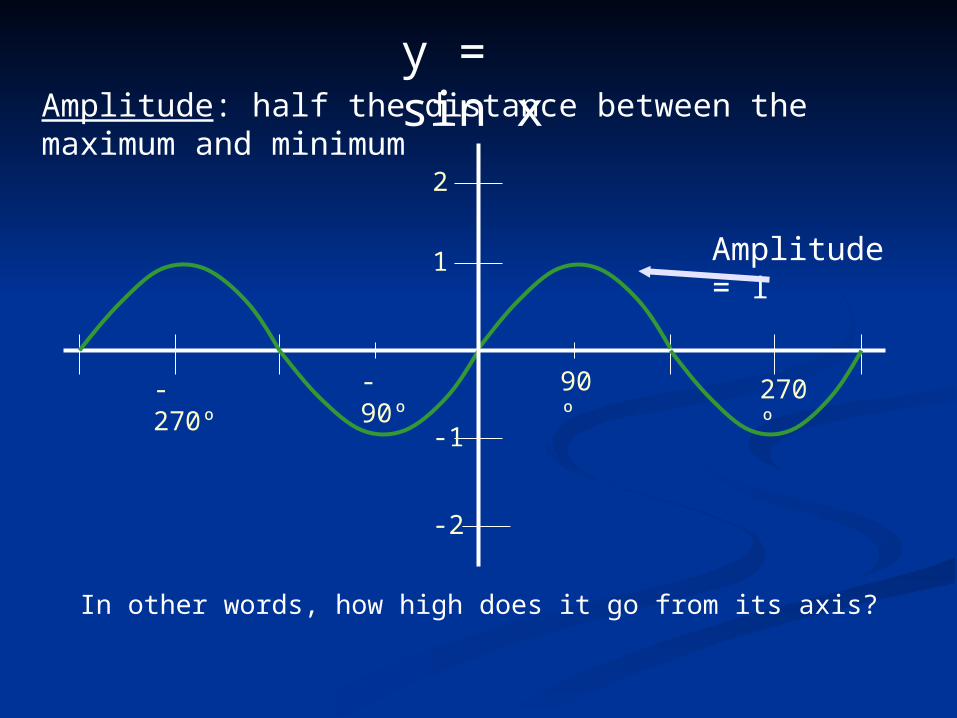
Amplitude: half the distance between the maximum and minimum
In other words, how high does it go from its axis?
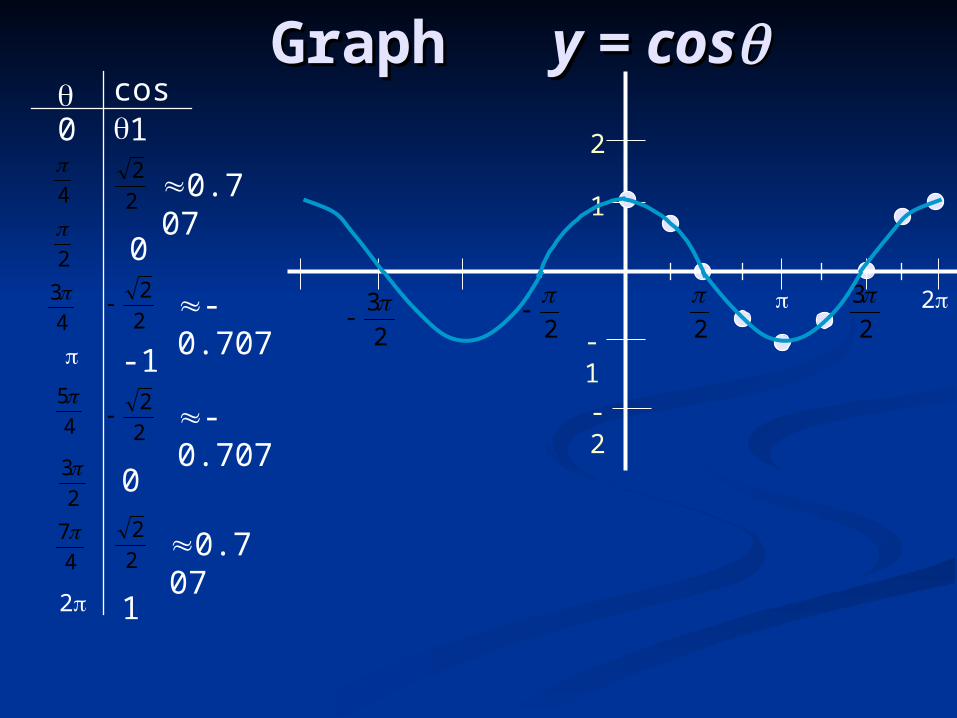
Graph Graph y = cosy = cos
1
-1
2
-2
cos 0 1
1
-1
0
0
0.707
-0.707
-0.707
0.707
2
2
2
2
2
2
2
2
2
3
2
22
3
2
4
3
4
5
4
7
4
2
2
3
2
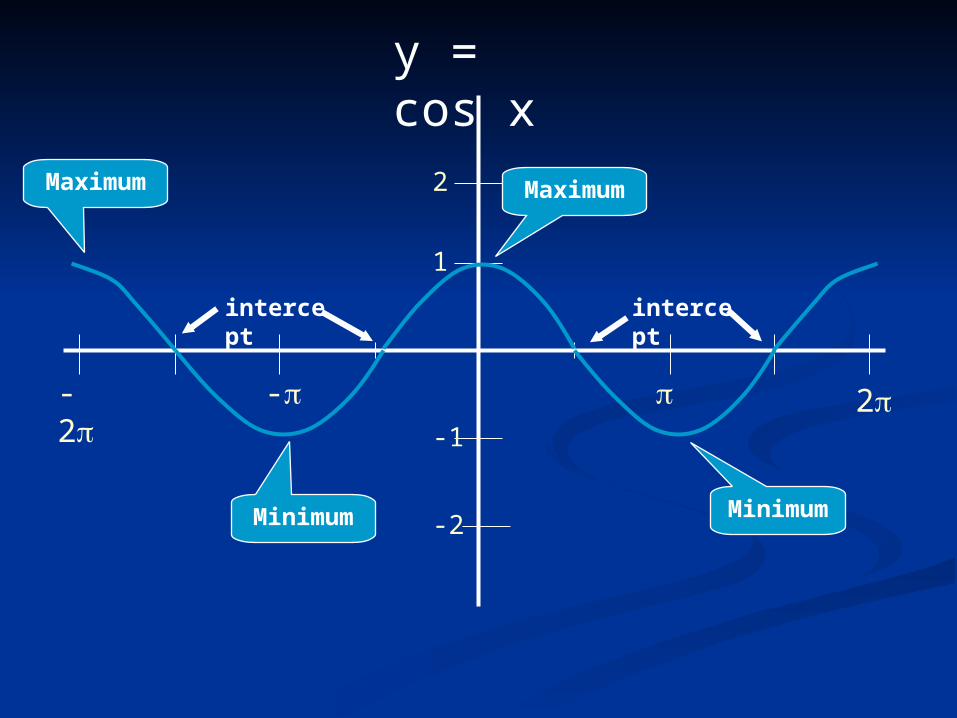
y = cos x
1
-1
2
-2
2--2
MaximumMaximum
MinimumMinimum
intercept intercept
y = cos x
1
-1
2
-2
2--2
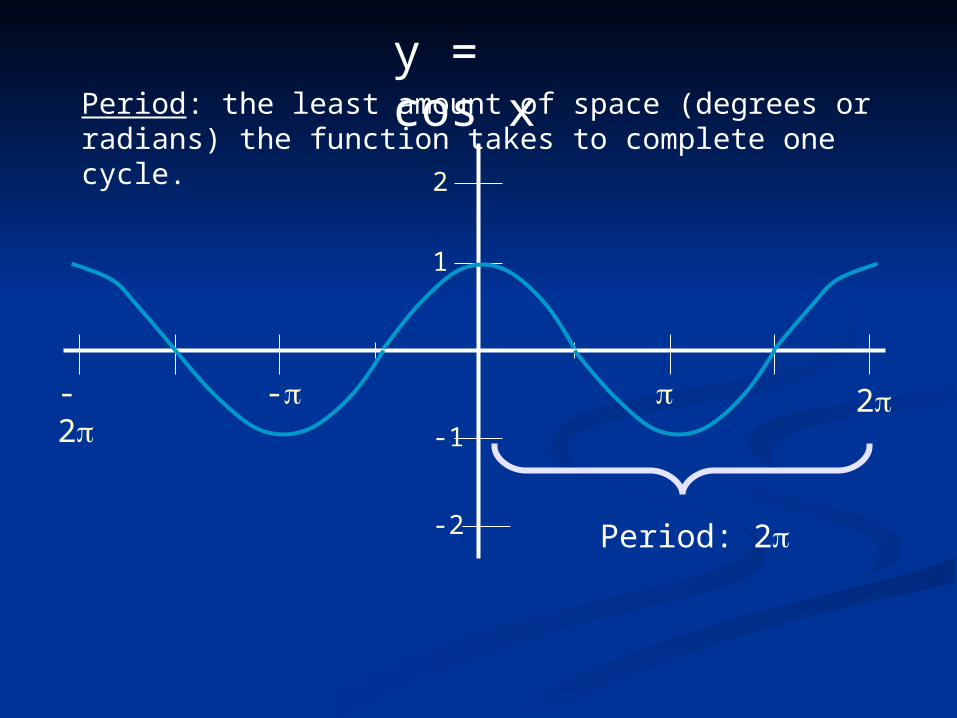
Period: 2
Period: the least amount of space (degrees or radians) the function takes to complete one cycle.
y = cos x
1
-1
2
-2
2--2
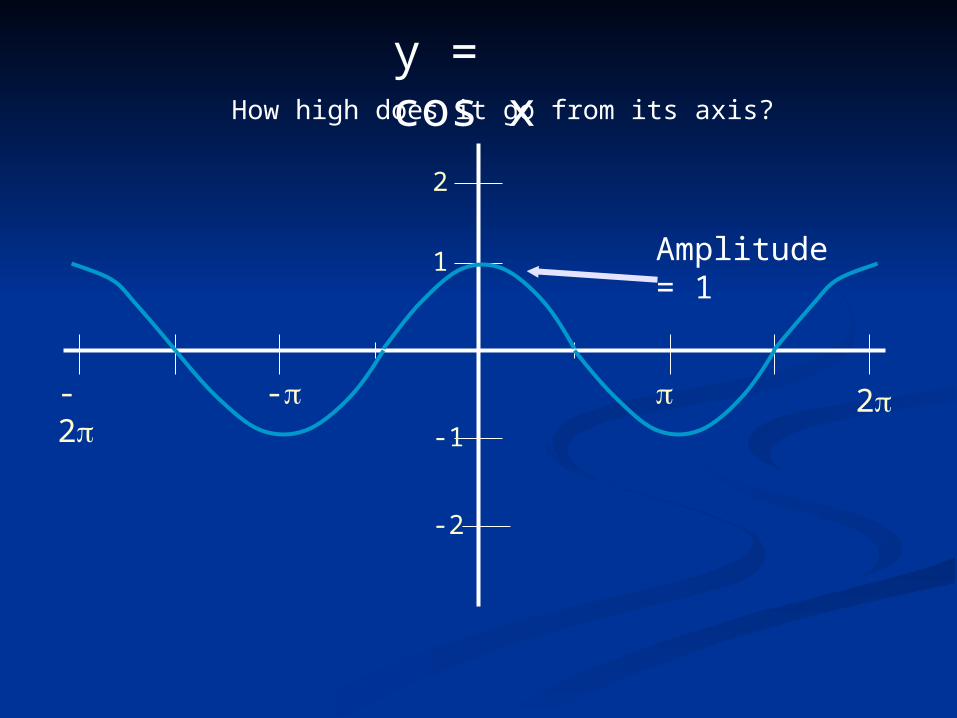
Amplitude = 1
How high does it go from its axis?
1
-1
2
-2
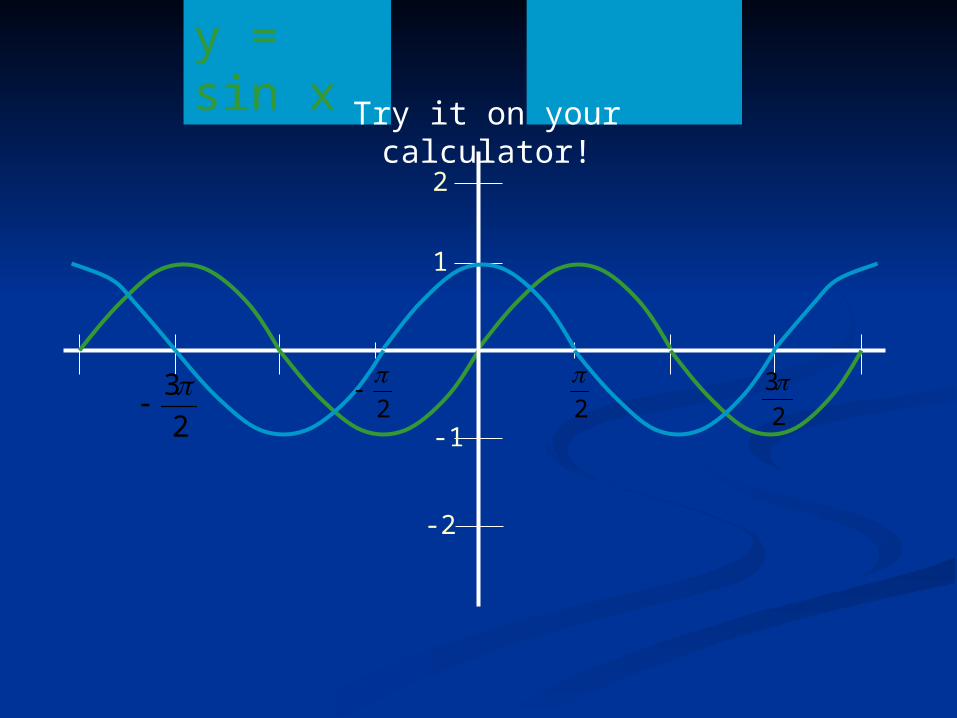
y = cos xy = sin x
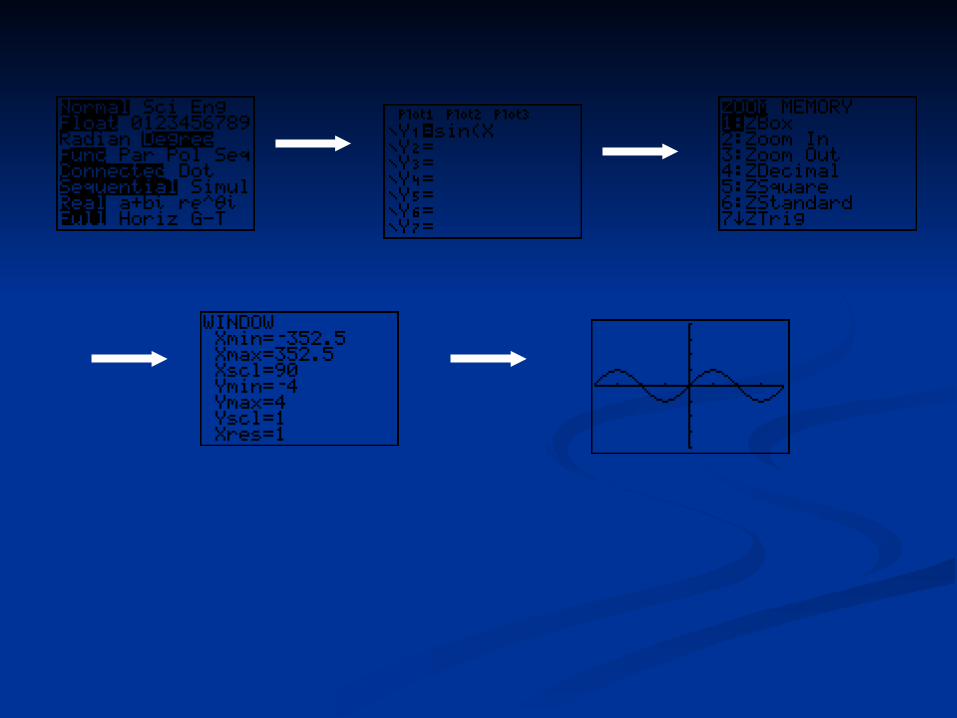
Try it on your calculator!
2
3
2
2
3
2
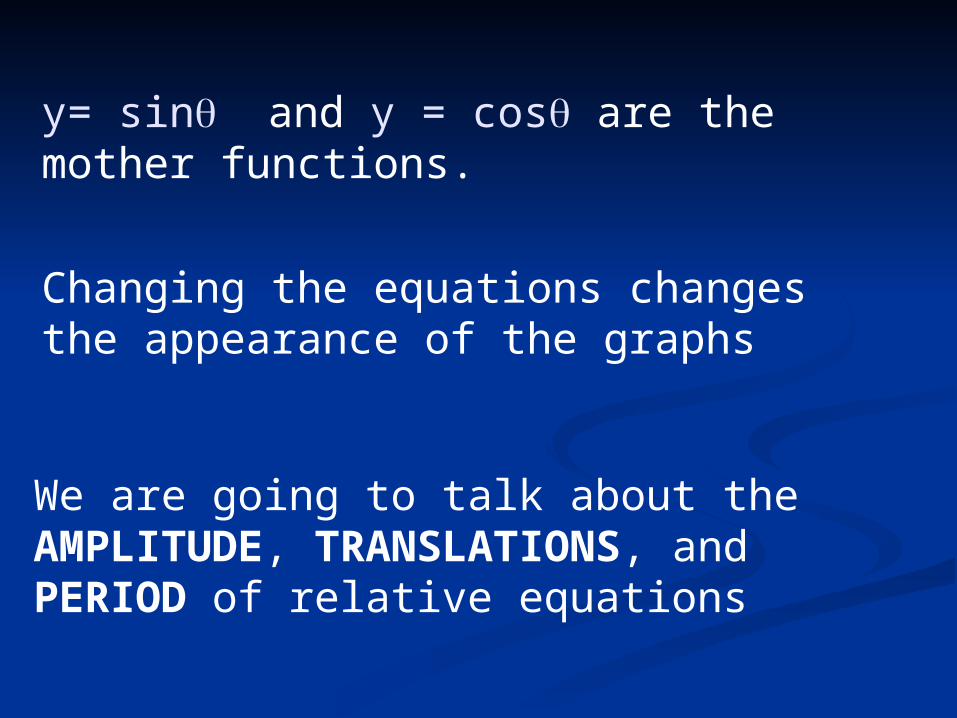
y= sin and y = cos are the mother functions.
Changing the equations changes the appearance of the graphs
We are going to talk about the AMPLITUDE, TRANSLATIONS, and PERIOD of relative equations
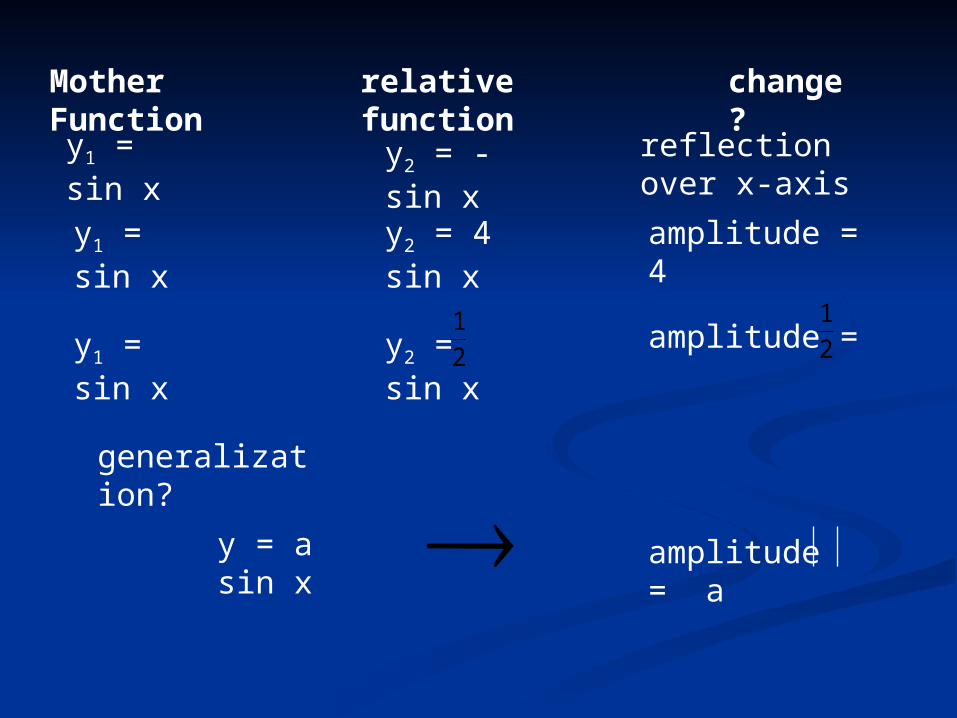
Mother Function relative function change?
y1 = sin x y2 = - sin x reflection over x-axis
y1 = sin x
y1 = sin x
y2 = 4 sin x
y2 = sin x1
2
amplitude = 4
amplitude = 1
2
generalization?
y = a sin x amplitude = a
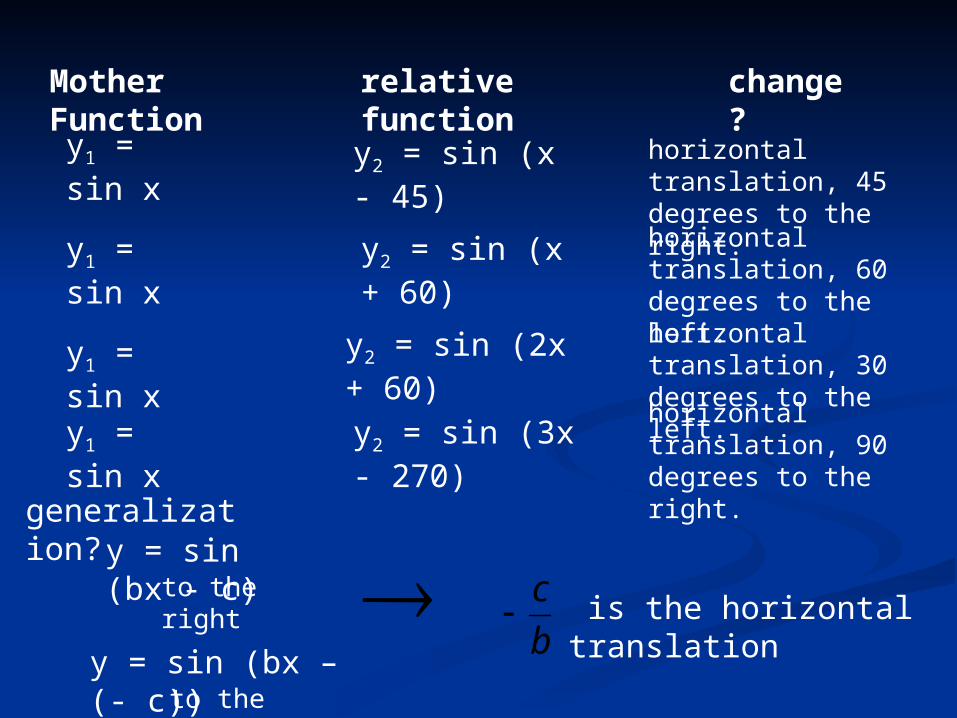
Mother Function relative function change?
y1 = sin x y2 = sin (x - 45)
y2 = sin (x + 60)
horizontal translation, 45 degrees to the right.
horizontal translation, 60 degrees to the left.
y1 = sin x
generalization?y = sin (bx - c)
y = sin (bx – (- c))
is the horizontal translationto the right
to the left
y2 = sin (2x + 60)y1 = sin xhorizontal translation, 30 degrees to the left.
y2 = sin (3x - 270)y1 = sin xhorizontal translation, 90 degrees to the right.
c
b
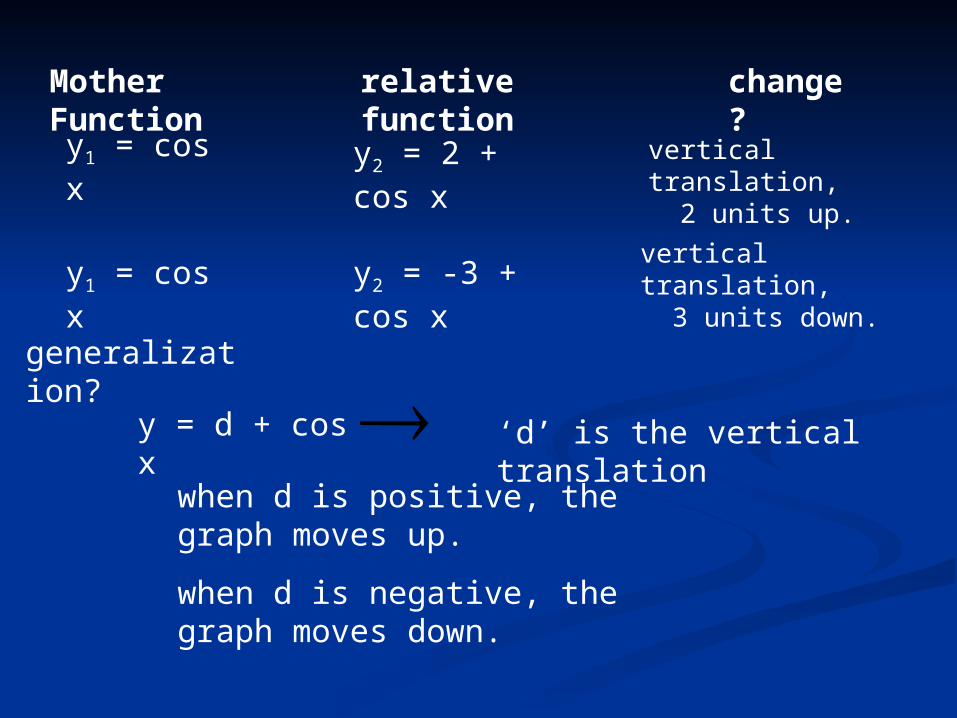
Mother Function relative function change?
y1 = cos x y2 = 2 + cos x vertical translation, 2 units up.
y1 = cos x y2 = -3 + cos xvertical translation, 3 units down.
generalization?
y = d + cos x ‘d’ is the vertical translation
when d is positive, the graph moves up.
when d is negative, the graph moves down.
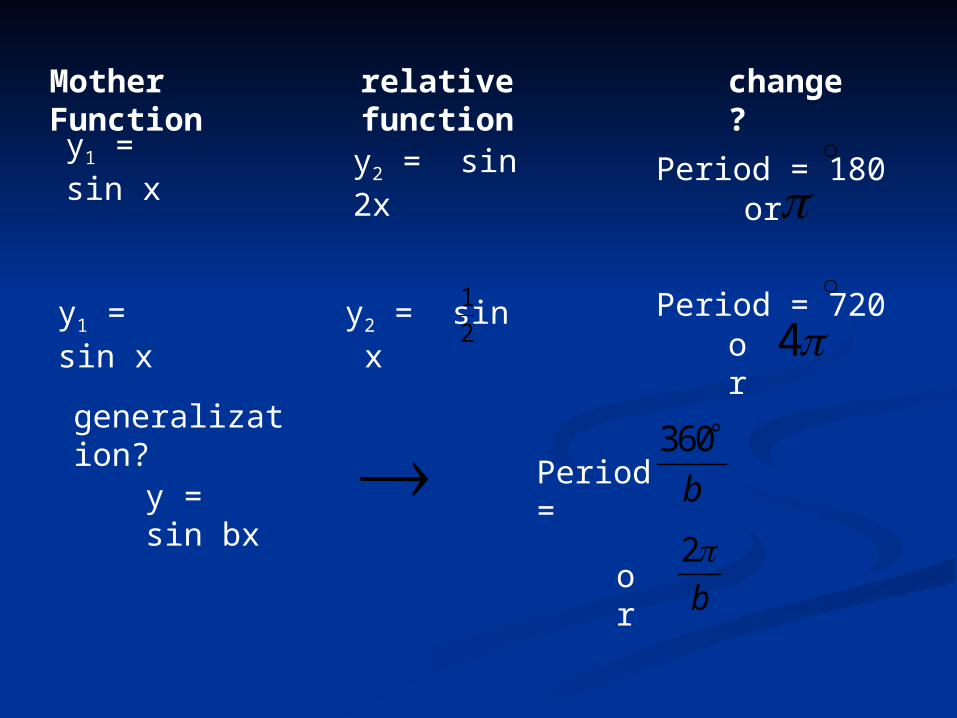
Mother Function relative function change?
y1 = sin x
y1 = sin x
y2 = sin 2x
y2 = sin x1
2
Period = 180or
Period = 7204or
generalization?
y = sin bx Period = 360b
or 2b
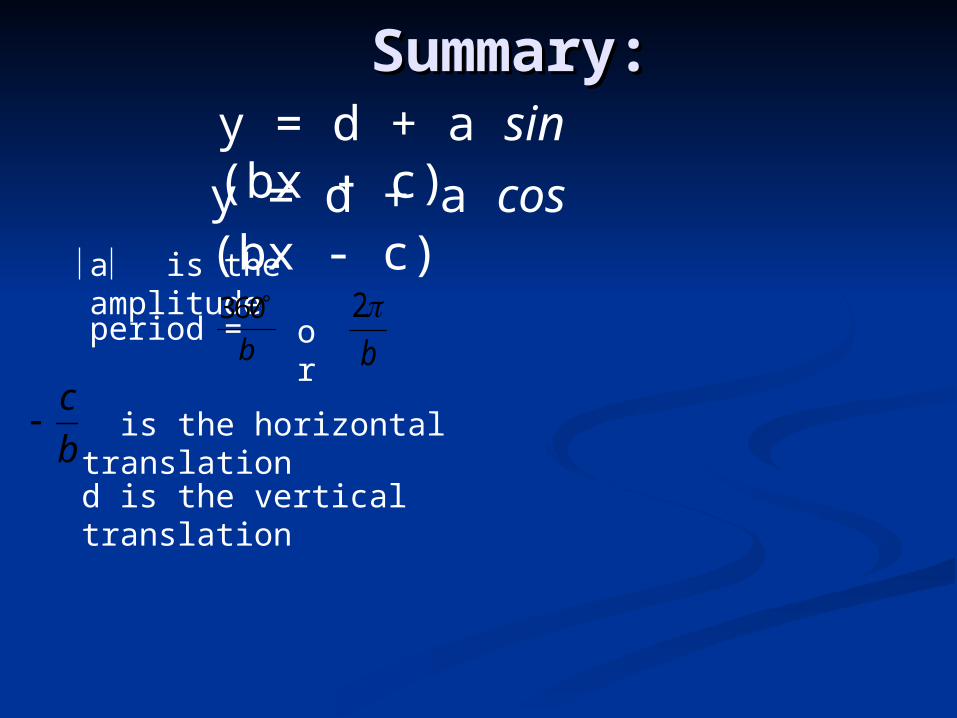
y = d + a sin (bx - c)
y = d + a cos (bx - c)a is the amplitude
is the horizontal translation
d is the vertical translation
period = 360b
Summary:Summary:
c
b
or 2b
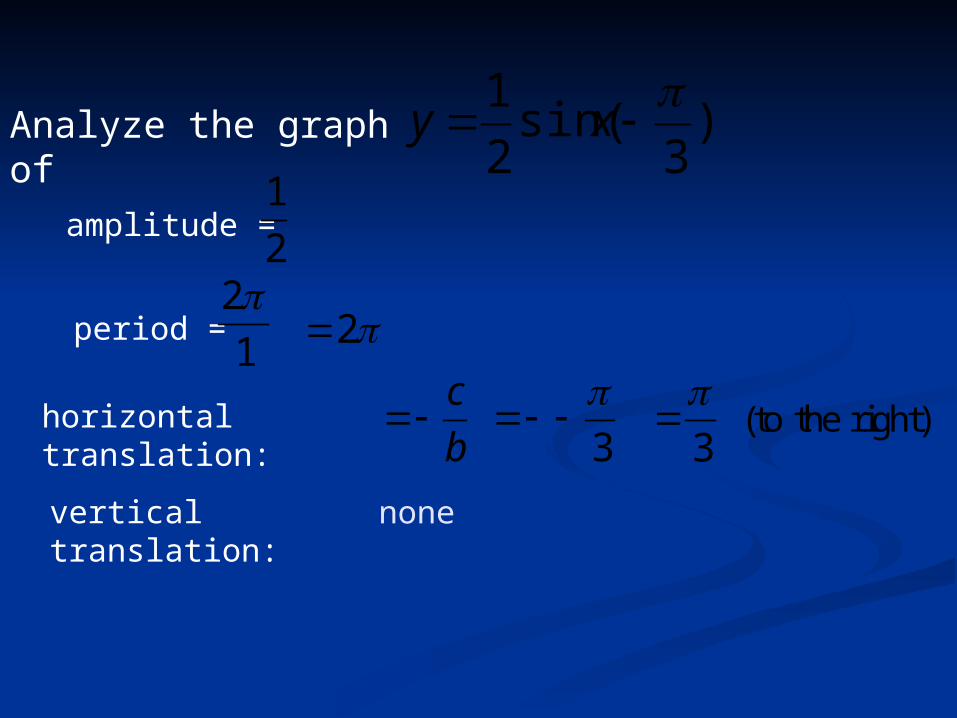
Analyze the graph of
amplitude =
vertical translation:
horizontal translation:
1
2
period = 2
1
2
3
none
c
b(to the right)
3
)3
sin(2
1 xy
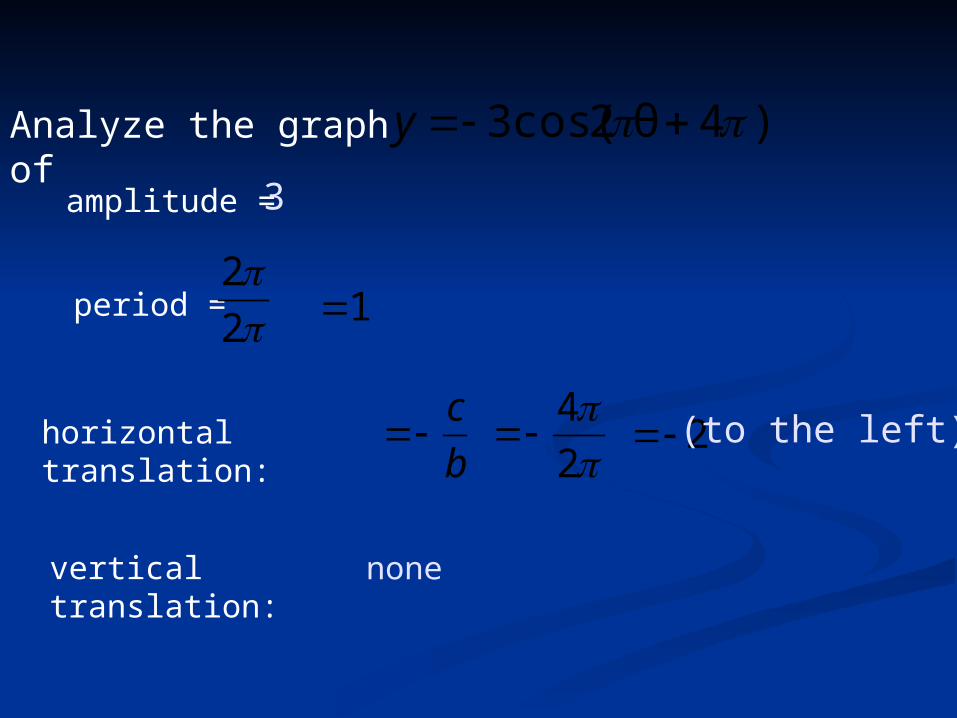
Analyze the graph of
amplitude =
vertical translation:
horizontal translation:
period = 2
2
1
c
b
none
3
4
2
2 (to the left)
)4 θ2cos(3 y
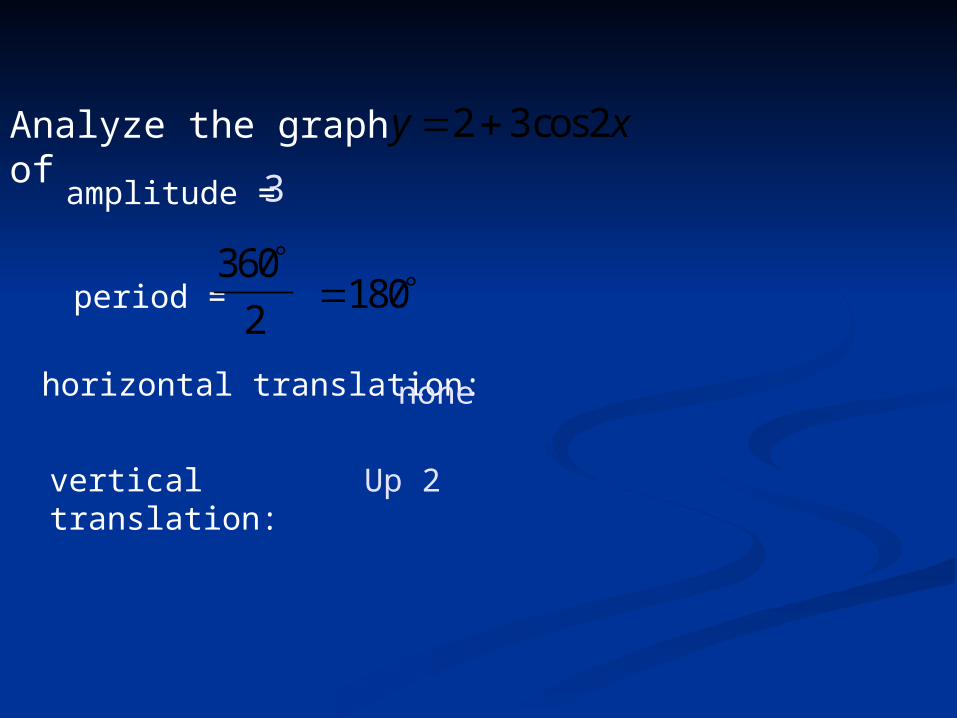
Analyze the graph of y x 2 3 2cos
amplitude =
vertical translation:
horizontal translation:
period = 360
2
180
Up 2
3
none
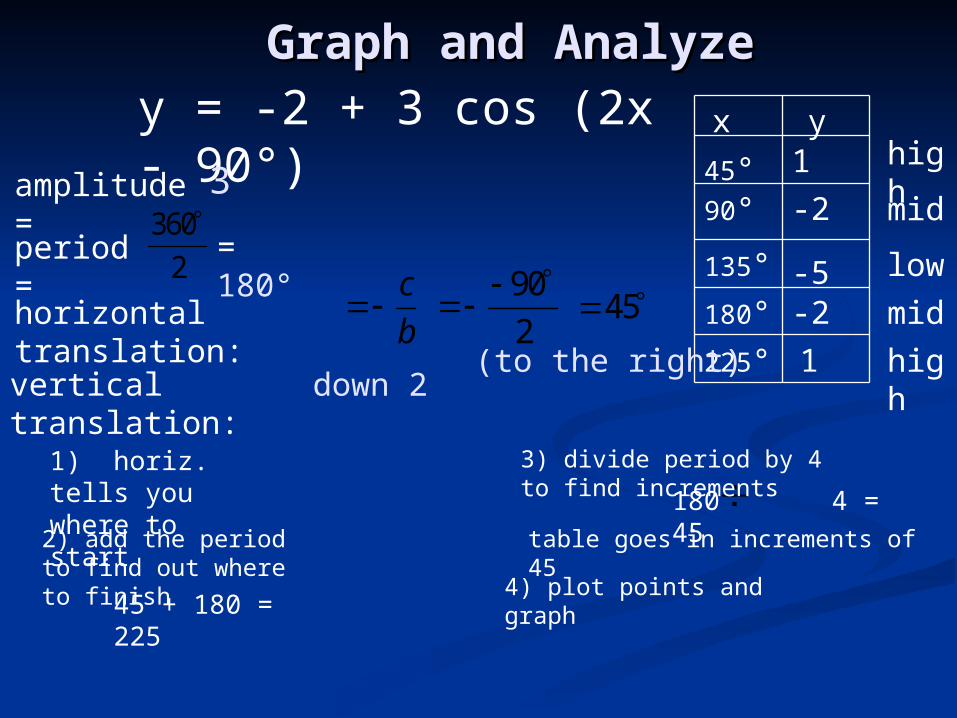
y = -2 + 3 cos (2x - 90°)
amplitude = 360
2
period =
vertical translation:
horizontal translation:
x y
45°
225°
90°
135°
180°
180 4 = 45table goes in increments of 45
1
-2
-5-2
1
1) horiz. tells you where to start
2) add the period to find out where to finish
3) divide period by 4 to find increments
4) plot points and graph45 + 180 = 225
Graph and AnalyzeGraph and Analyze
c
b
90
2 45
(to the right)
3
= 180°
down 2
high
low
high
mid
mid
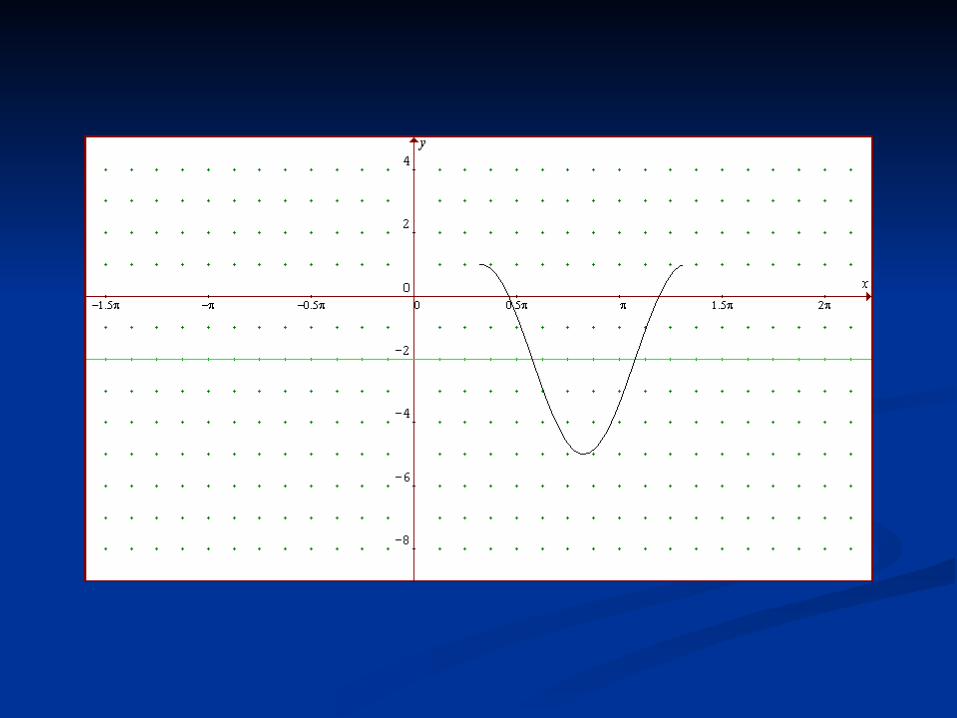
The most important thing to remember about graphing is determining the starting point and the stopping point on the t-table.
You must know how to analyze the equation before you can graph it.
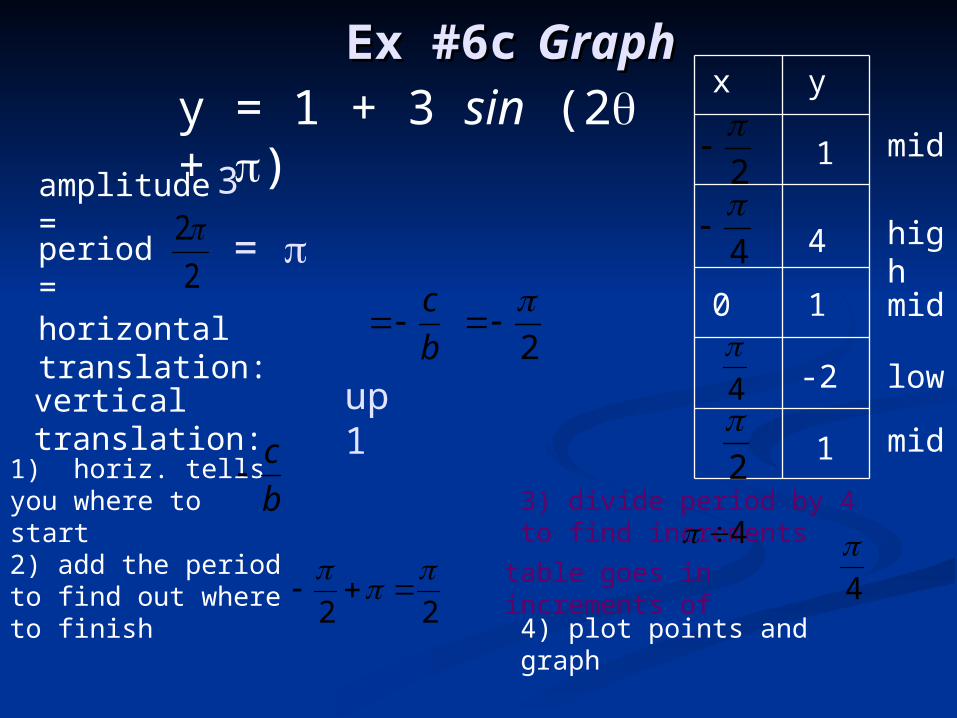
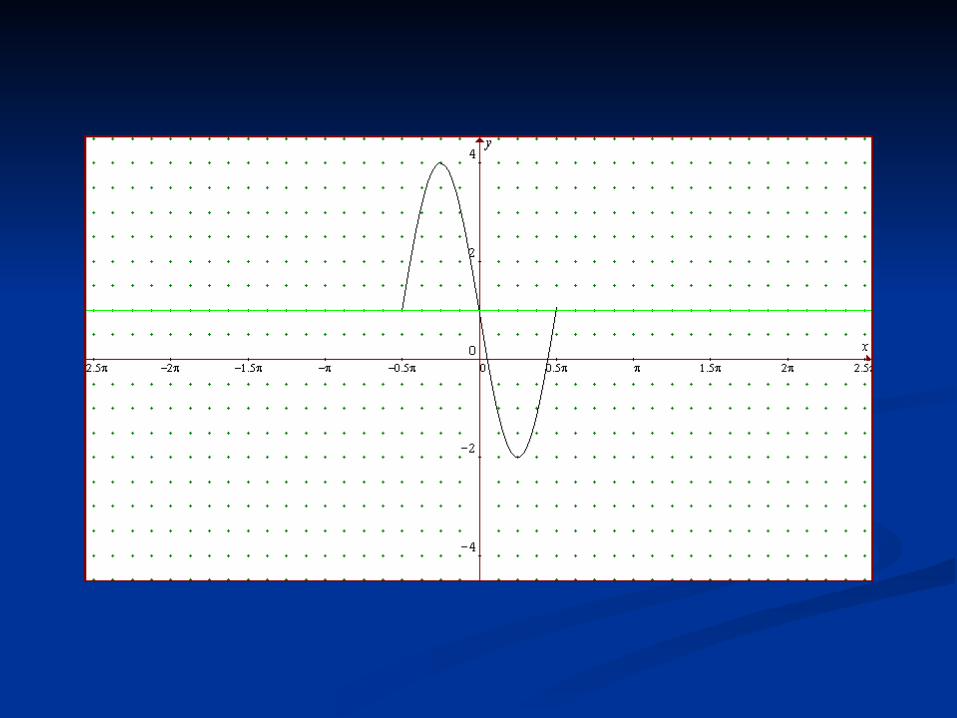
y = 1 + 3 sin (2 + )
amplitude =period =
vertical translation:
horizontal translation:
x y
0
1
4
1
-2
11) horiz. tells you where to start
2) add the period to find out where to finish
3) divide period by 4 to find increments
4) plot points and graph
Ex #6cEx #6c GraphGraph
c
b
2
c
b
2
2
=
2
2
4
4
3
up 1
2 2
4table goes in increments of
4
mid
mid
mid
high
low

![Luminaria Hermética Industrial LED - Boracéia [ESP].pdf · 3 Diseños técnicos Curvas Fotométricas 90º 0-180º 90-270º - 103% cd/klm 30º 15º 0º 15º 30º 45º 60º 75º](https://img.dokumen.tips/doc/110x75/5e98488dc8b746612e710b1d/luminaria-hermtica-industrial-boraceia-esppdf-3-diseos-tcnicos-curvas.jpg)