Embed Size (px)
Citation preview
Decreasing Parameters
Murad MithaniMay 2015
No Medication
Diabetes
Blood Sugar
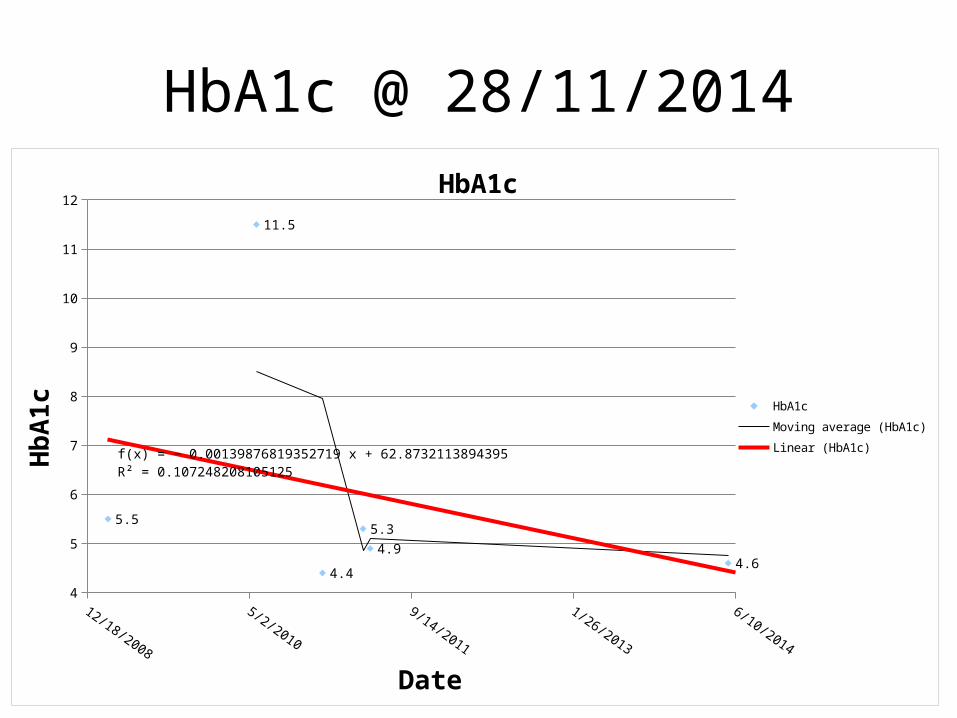
HbA1c @ 28/11/2014
12/18/2008
7/6/2009
1/22/2010
8/10/2010
2/26/2011
9/14/2011
4/1/2012
10/18/2012
5/6/2013
11/22/2013
6/10/2014
4
5
6
7
8
9
10
11
12
5.5
11.5
4.4
5.34.9
4.6
f(x) = − 0.00139876819352719 x + 62.8732113894395R² = 0.107248208105125
HbA1c
HbA1cMoving average (HbA1c)Linear (HbA1c)
Date
HbA
1c
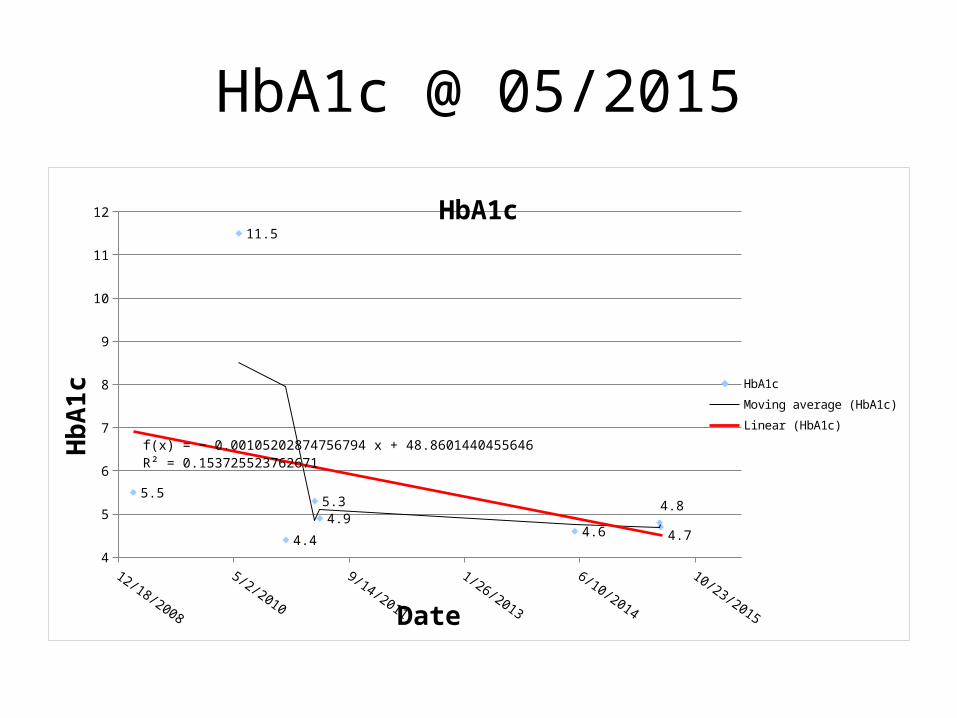
HbA1c @ 05/2015
12/18/2008
5/2/2010
9/14/2011
1/26/2013
6/10/2014
10/23/2015
4
5
6
7
8
9
10
11
12
5.5
11.5
4.4
5.34.9
4.6
4.8
4.7
f(x) = − 0.00105202874756794 x + 48.8601440455646R² = 0.153725523762671
HbA1c
HbA1cMoving average (HbA1c)Linear (HbA1c)
Date
HbA
1c
Kidney
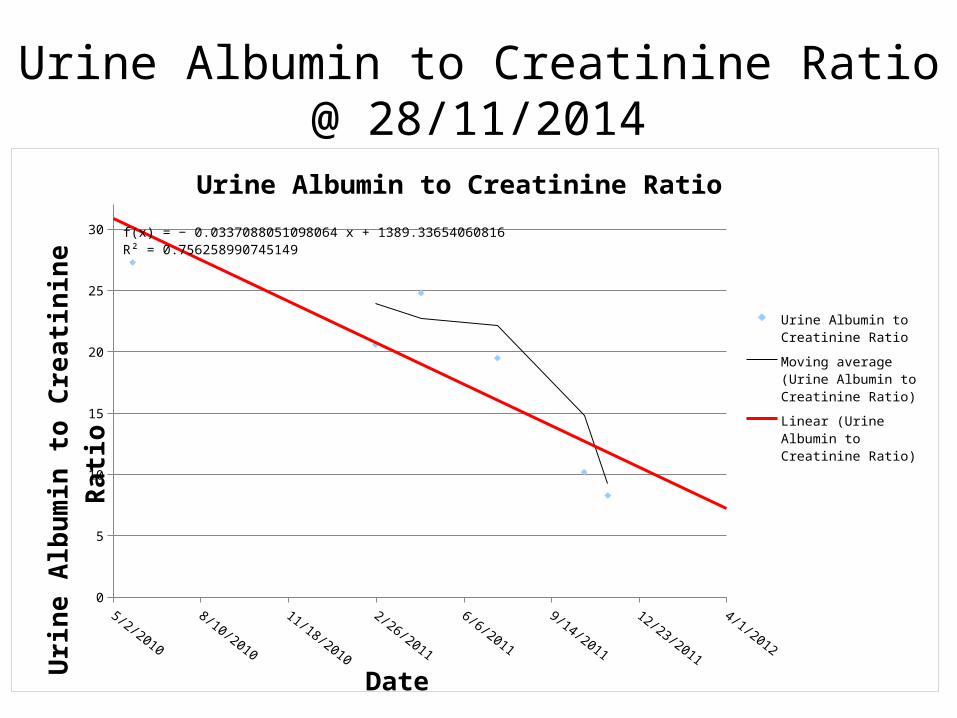
Urine Albumin to Creatinine Ratio @ 28/11/2014
0
5
10
15
20
25
30 f(x) = − 0.0337088051098064 x + 1389.33654060816R² = 0.756258990745149
Urine Albumin to Creatinine Ratio
Urine Albumin to Creatinine Ratio
Moving average (Urine Albumin to Creatinine Ra-tio)
Linear (Urine Albumin to Creatinine Ratio)
Date
Uri
ne A
lbum
in to
Cre
atini
ne R
atio

Urine Albumin to Creatinine Ratio
http://labtestsonline.org.uk/understanding/analytes/microalbumin/tab/test/
A moderately increased ACR indicates an early phase of developing kidney disease. Very high values show that kidney disease is present in a more severe form. Very low values generally indicate that kidney function is normal if other tests of kidney function, e.g. the glomerular filtration rate, also show no abnormality.
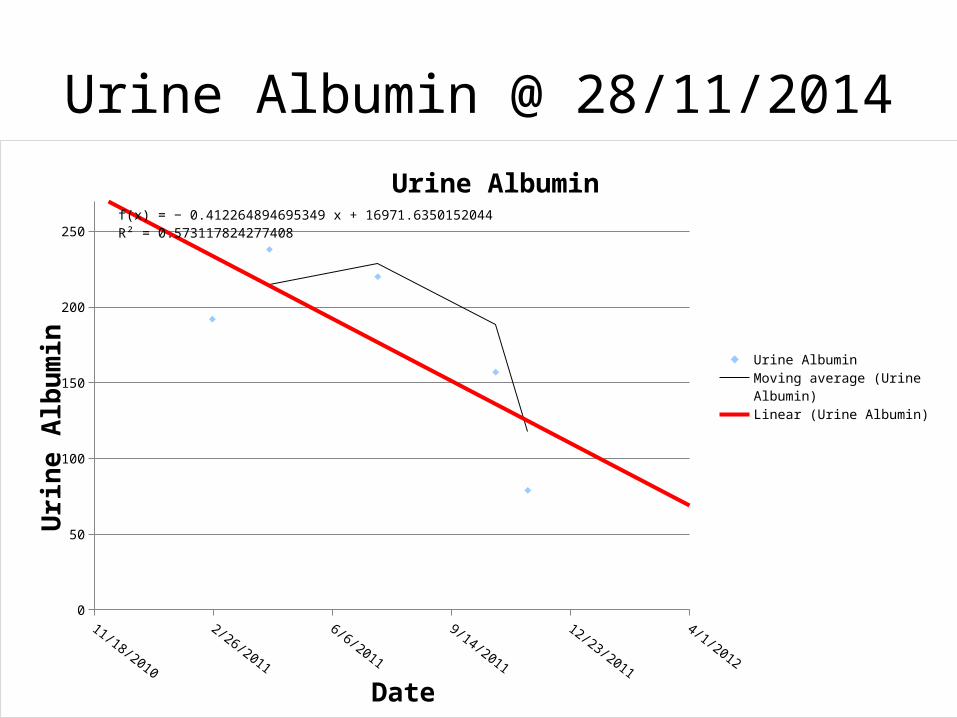
Urine Albumin @ 28/11/2014
11/18/2010
2/26/2011
6/6/2011
9/14/2011
12/23/2011
4/1/2012
0
50
100
150
200
250f(x) = − 0.412264894695349 x + 16971.6350152044R² = 0.573117824277408
Urine Albumin
Urine Albumin
Moving average (Urine Albumin)
Linear (Urine Albumin)
Date
Uri
ne A
lbum
in
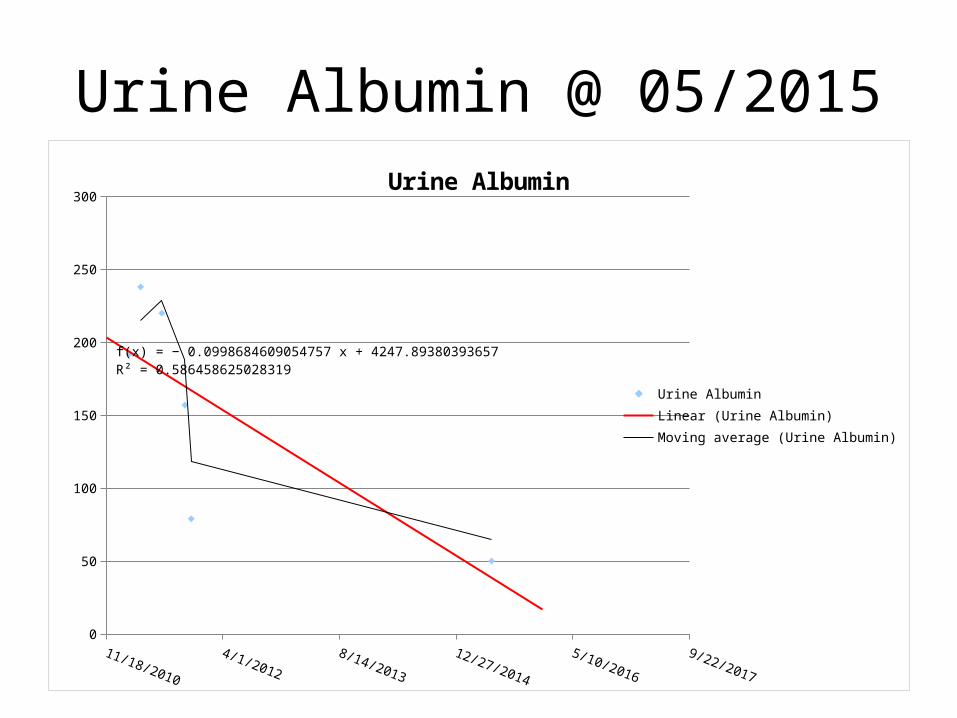
Urine Albumin @ 05/2015
11/18/2010
4/1/20128/14/2013
12/27/2014
5/10/20169/22/2017
0
50
100
150
200
250
300
f(x) = − 0.0998684609054757 x + 4247.89380393657R² = 0.586458625028319
Urine Albumin
Urine AlbuminLinear (Urine Albumin)Moving average (Urine Albumin)
Urine Albuminhttp://www.healthline.com/health/microalbuminuria-test#Risks6
Understanding Your Results
The results of the microalbuminuria test will vary, depending on the laboratory where the sample was analyzed. Normal values are typically less than 30 mcg/mg (micrograms per milligram).
A low level of albumin in the urine is an indication that your kidneys are functioning normally.
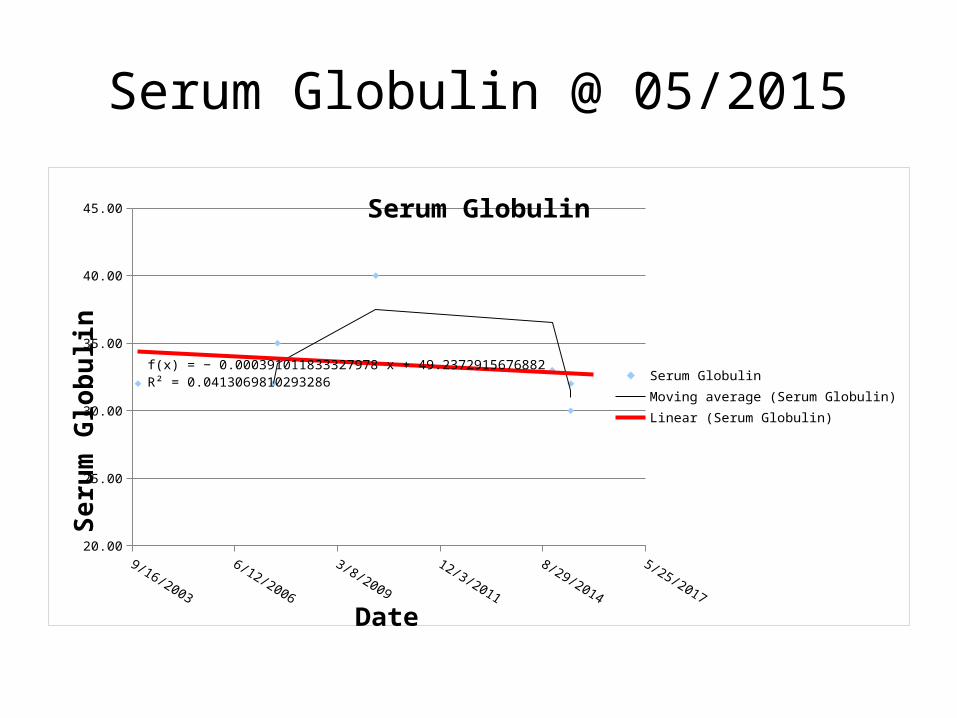
Serum Globulin @ 05/2015
20.00
25.00
30.00
35.00
40.00
45.00
f(x) = − 0.000391011833327978 x + 49.2372915676882R² = 0.0413069810293286
Serum Globulin
Serum GlobulinMoving average (Serum Globulin)Linear (Serum Globulin)
Date
Seru
m G
lobu
lin
Serum Globulinhttp://www.patient.co.uk/doctor/globulins
Increased total globulin level: Nephrotic syndrome.
The kidneys of people with nephrotic syndrome don't work properly causing large amounts of protein to leak into their urine.
Lipids
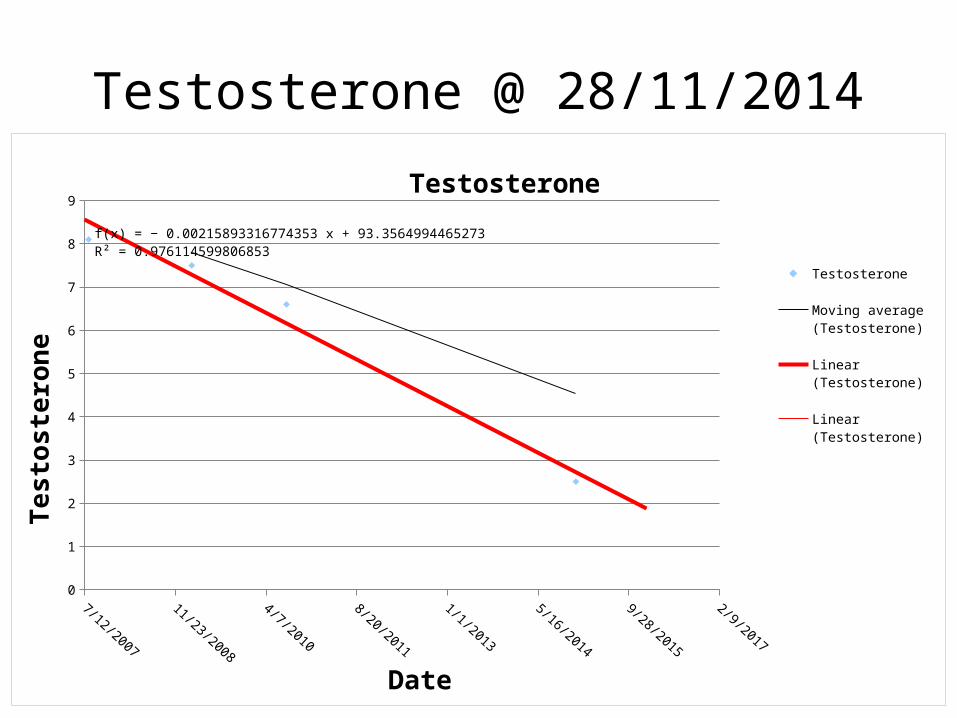
Testosterone @ 28/11/2014
7/12/2007
11/23/2008
4/7/2010
8/20/2011
1/1/2013
5/16/2014
9/28/2015
2/9/2017
0
1
2
3
4
5
6
7
8
9
f(x) = − 0.00215893316774353 x + 93.3564994465273R² = 0.976114599806852
Testosterone
Testosterone
Moving average (Testos-terone)
Linear (Testosterone)
Linear (Testosterone)
Date
Test
oste
rone
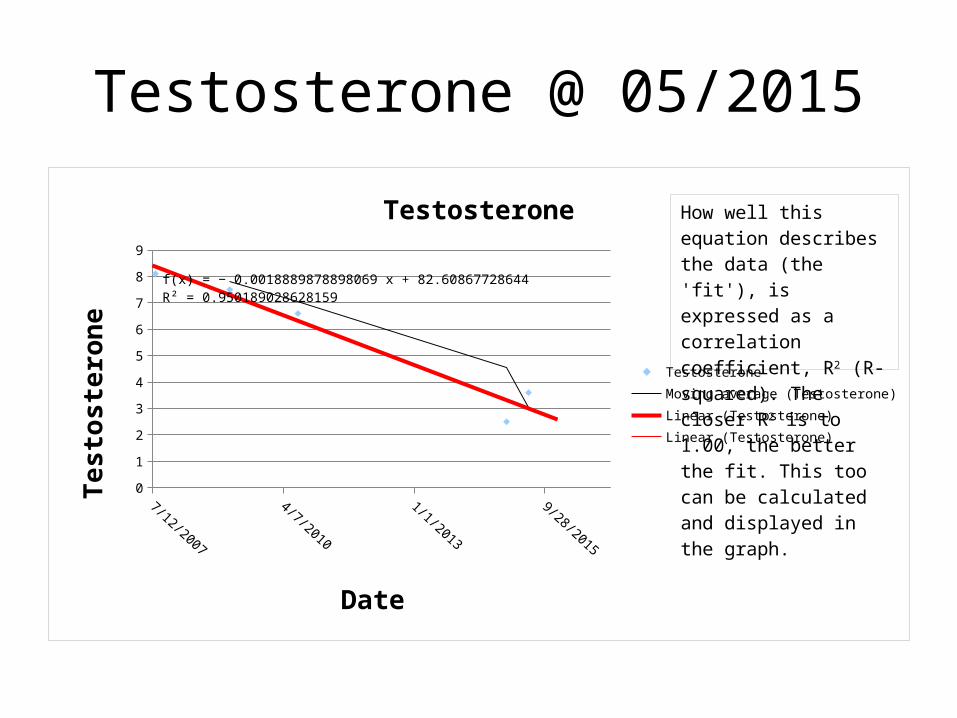
Testosterone @ 05/2015
7/12/2007
11/23/2008
4/7/2010
8/20/2011
1/1/2013
5/16/2014
9/28/2015
2/9/2017
0
1
2
3
4
5
6
7
8
9
f(x) = − 0.0018889878898069 x + 82.60867728644R² = 0.950189028628159
Testosterone
TestosteroneMoving average (Testosterone)Linear (Testosterone)Linear (Testosterone)
Date
Test
oste
rone
How well this equation de-scribes the data (the 'fit'), is expressed as a correlation coefficient, R2 (R-squared). The closer R2 is to 1.00, the better the fit. This too can be calculated and displayed in the graph.
Testosterone• Andropause or "male menopause" is a
recognized medical condition brought about by declining testosterone or male hormone levels with. The World Health Organization reports that testosterone levels progressively decline with age. By age 70 they are about 10 percent of what they were at age 25. It is estimated that 30 percent of men in their 50s will have testosterone levels low enough to be causing symptoms or putting them at risk.
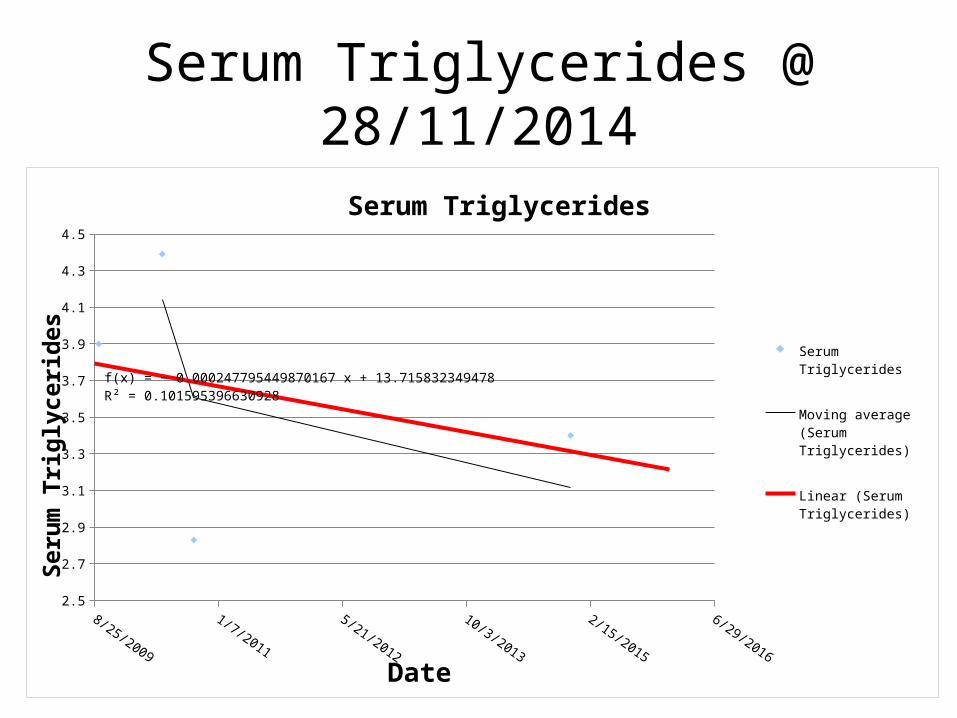
Serum Triglycerides @ 28/11/2014
8/25/2009
1/7/2011
5/21/2012
10/3/2013
2/15/2015
6/29/2016
2.5
2.7
2.9
3.1
3.3
3.5
3.7
3.9
4.1
4.3
4.5
f(x) = − 0.000247795449870167 x + 13.715832349478R² = 0.101595396630928
Serum Triglycerides
Serum Triglycerides
Moving average (Serum Triglycerides)
Linear (Serum Triglycerides)
Date
Seru
m T
rigl
ycer
ides

Serum Triglycerides @ 05/2015
8/25/2009
1/7/2011
5/21/2012
10/3/2013
2/15/2015
6/29/2016
2.5
2.7
2.9
3.1
3.3
3.5
3.7
3.9
4.1
4.3
4.5
R² = 0.174784759107358
Serum Triglycerides
Serum Triglycerides
Moving average (Serum Triglycerides)
Linear (Serum Triglycerides)
Date
Seru
m T
rigl
ycer
ides
Serum Triglycerides
http://www.mayoclinic.org/diseases-conditions/high-blood-cholesterol/in-depth/triglycerides/art-20048186
Having a high level of triglycerides, a type of fat (lipid) in your blood, can increase your risk of heart disease. However, the same lifestyle choices that promote overall health can help lower your triglycerides, too.
Serum Triglycerides
http://www.jhsph.edu/news/news-releases/2000/cholesterol-kidney.html
Link Found between Cholesterol and Kidney DiseaseResearchers at the Johns Hopkins School of Public Health have found that high levels of triglycerides and low levels of high-density (good) cholesterol in the blood predict the onset of chronic kidney disease.
Serum Triglycerides
https://www.kidney.org/atoz/content/cholesterol
People with good LDL cholesterol, high HDL cholesterol, and normal triglycerides are less likely to have heart disease.

Serum Cholesterol @ 28/11/2014
5/2/2010
9/14/2011
1/26/2013
6/10/2014
5
5.2
5.4
5.6
5.8
6
6.2
6.4
6.6
6.8
f(x) = − 0.000220700381196349 x + 14.9880598076182R² = 0.060792923184085
Serum Cholesterol
Serum Cholesterol
Moving average (Serum Cholesterol)
Linear (Serum Choles-terol)
Date
Seru
m C
hole
ster
ol
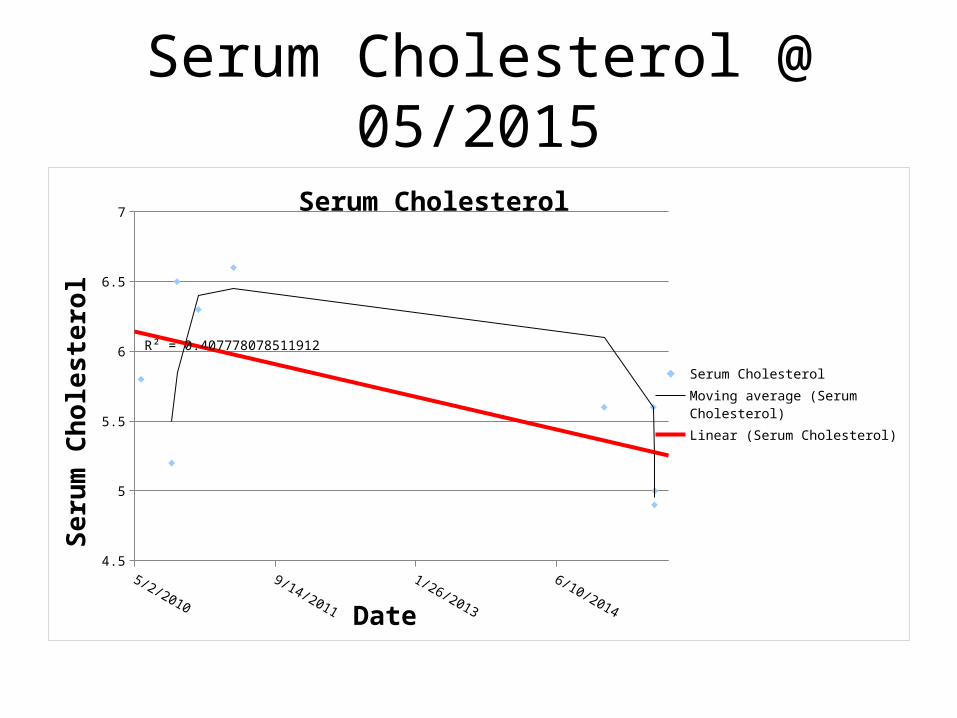
Serum Cholesterol @ 05/2015
5/2/2010
9/14/2011
1/26/2013
6/10/2014
4.5
5
5.5
6
6.5
7
R² = 0.407778078511912
Serum Cholesterol
Serum CholesterolMoving average (Serum Cholesterol)Linear (Serum Cholesterol)
Date
Seru
m C
hole
ster
ol
Serum Cholesterol
http://www.nhs.uk/Conditions/Cholesterol/Pages/Causes.aspx
People with high blood pressure (hypertension) and diabetes often have high cholesterol.
Some medical conditions can also cause raised levels of cholesterol. These include:
• kidney disease• liver disease• an underactive thyroid gland
Serum Cholesterol
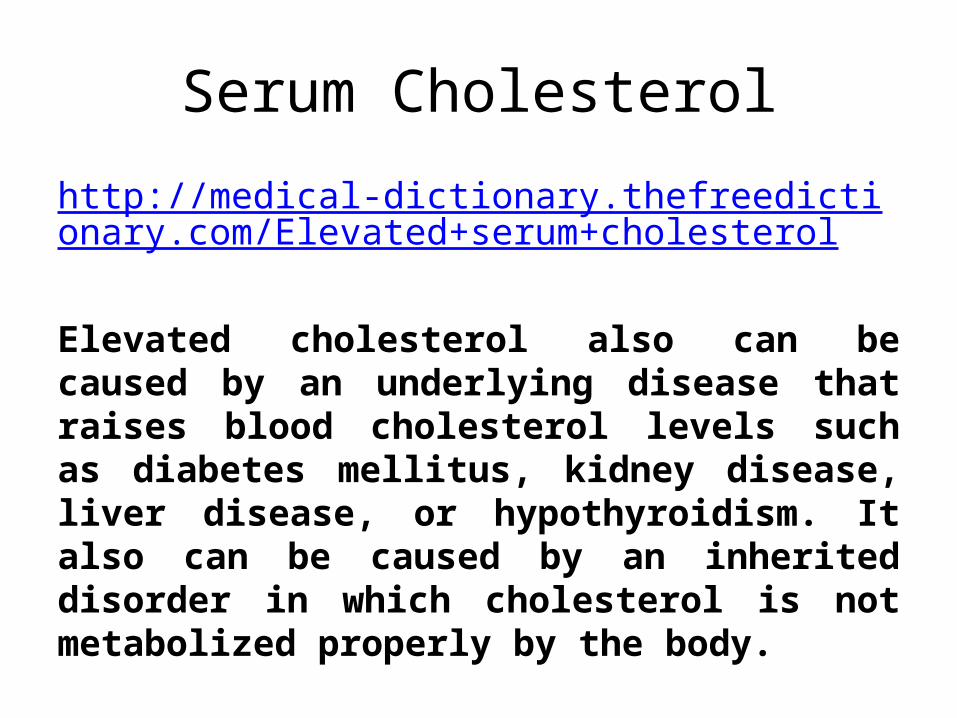
http://medical-dictionary.thefreedictionary.com/Elevated+serum+cholesterol
Elevated cholesterol also can be caused by an underlying disease that raises blood cholesterol levels such as diabetes mellitus, kidney disease, liver disease, or hypothyroidism. It also can be caused by an inherited disorder in which cholesterol is not metabolized properly by the body.
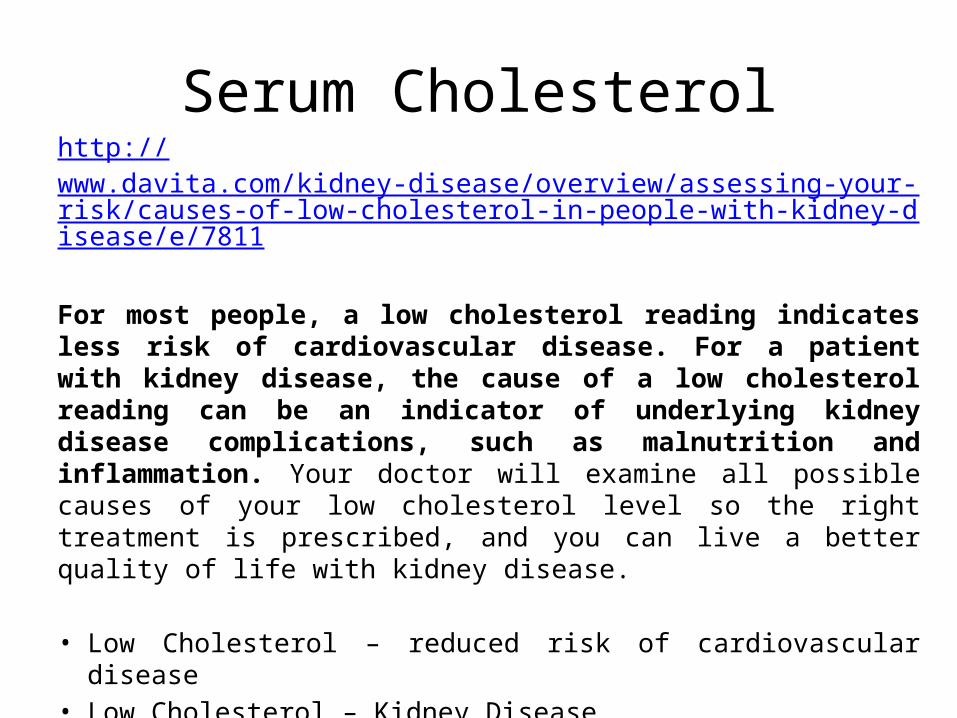
Serum Cholesterolhttp://www.davita.com/kidney-disease/overview/assessing-your-risk/causes-of-low-cholesterol-in-people-with-kidney-disease/e/7811
For most people, a low cholesterol reading indicates less risk of cardiovascular disease. For a patient with kidney disease, the cause of a low cholesterol reading can be an indicator of underlying kidney disease complications, such as malnutrition and inflammation. Your doctor will examine all possible causes of your low cholesterol level so the right treatment is prescribed, and you can live a better quality of life with kidney disease.
• Low Cholesterol – reduced risk of cardiovascular disease• Low Cholesterol – Kidney Disease
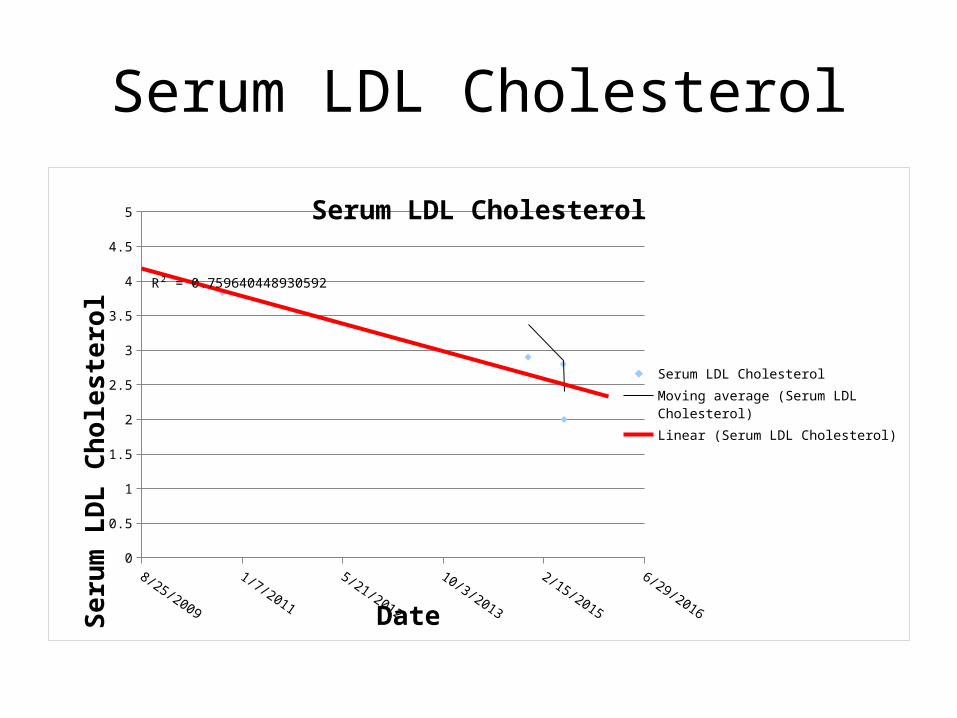
Serum LDL Cholesterol
8/25/2009
1/7/2011
5/21/2012
10/3/2013
2/15/2015
6/29/2016
0
0.5
1
1.5
2
2.5
3
3.5
4
4.5
5
R² = 0.759640448930592
Serum LDL Cholesterol
Serum LDL CholesterolMoving average (Serum LDL Cholesterol)Linear (Serum LDL Cholesterol)
Date
Seru
m L
DL
Chol
este
rol
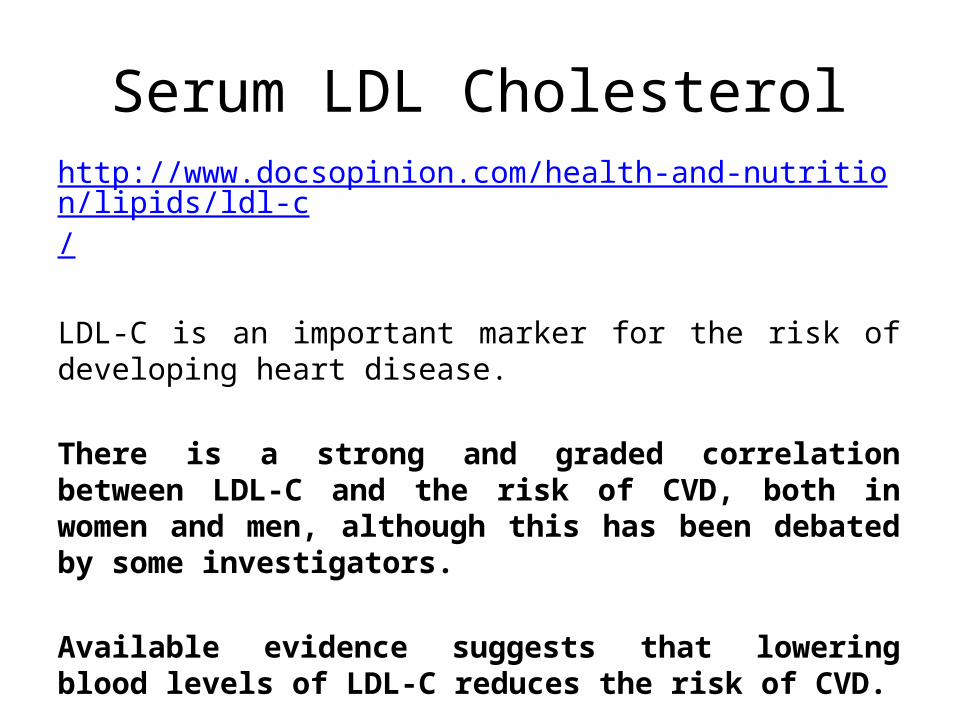
Serum LDL Cholesterolhttp://www.docsopinion.com/health-and-nutrition/lipids/ldl-c/
LDL-C is an important marker for the risk of developing heart disease.
There is a strong and graded correlation between LDL-C and the risk of CVD, both in women and men, although this has been debated by some investigators.
Available evidence suggests that lowering blood levels of LDL-C reduces the risk of CVD.
Serum LDL Cholesterol
https://www.kidney.org/atoz/content/cholesterol
People with good LDL cholesterol, high HDL cholesterol, and normal triglycerides are less likely to have heart disease.
Liver
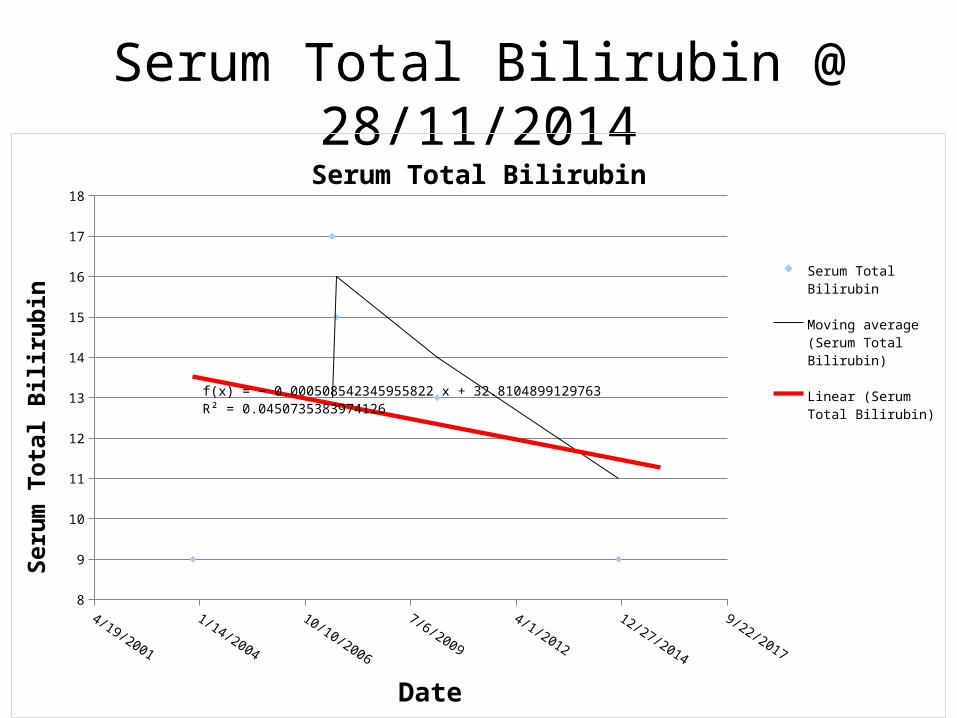
Serum Total Bilirubin @ 28/11/2014
4/19/2001
1/14/2004
10/10/2006
7/6/2009
4/1/2012
12/27/2014
9/22/2017
8
9
10
11
12
13
14
15
16
17
18
f(x) = − 0.000508542345955822 x + 32.8104899129763R² = 0.0450735383974126
Serum Total Bilirubin
Serum Total Bilirubin
Moving average (Serum To-tal Bilirubin)
Linear (Serum Total Bilirubin)
Date
Seru
m T
otal
Bili
rubi
n
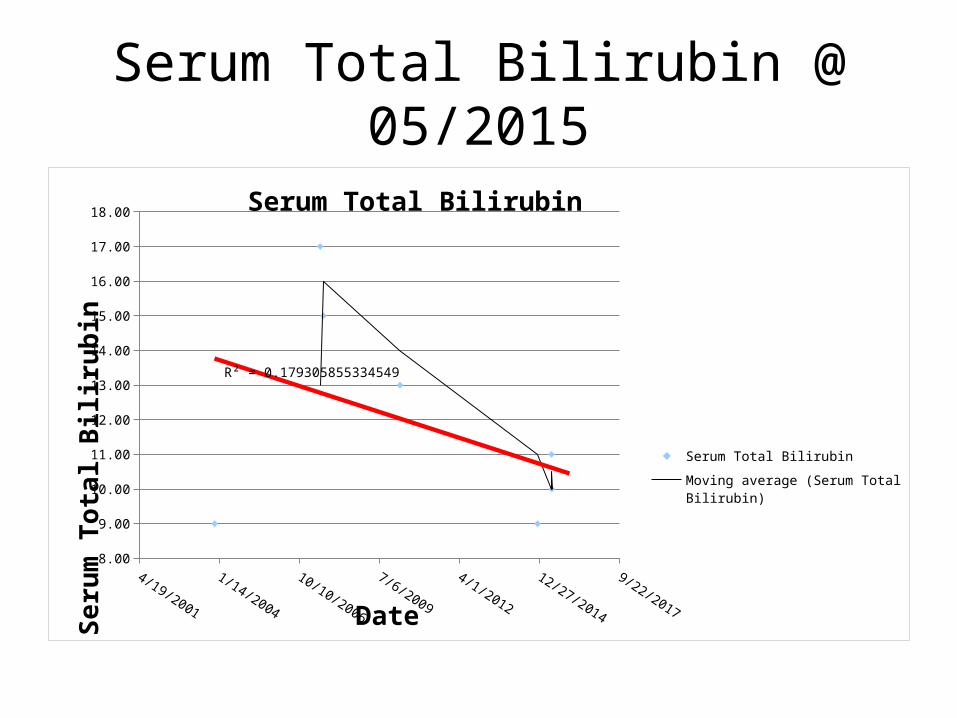
Serum Total Bilirubin @ 05/2015
4/19/2001
1/14/2004
10/10/2006
7/6/2009
4/1/2012
12/27/2014
9/22/2017
8.00
9.00
10.00
11.00
12.00
13.00
14.00
15.00
16.00
17.00
18.00
R² = 0.179305855334549
Serum Total Bilirubin
Serum Total Bilirubin
Moving average (Serum Total Bilirubin)
Linear (Serum Total Bilirubin)
Date
Seru
m T
otal
Bili
rubi
n
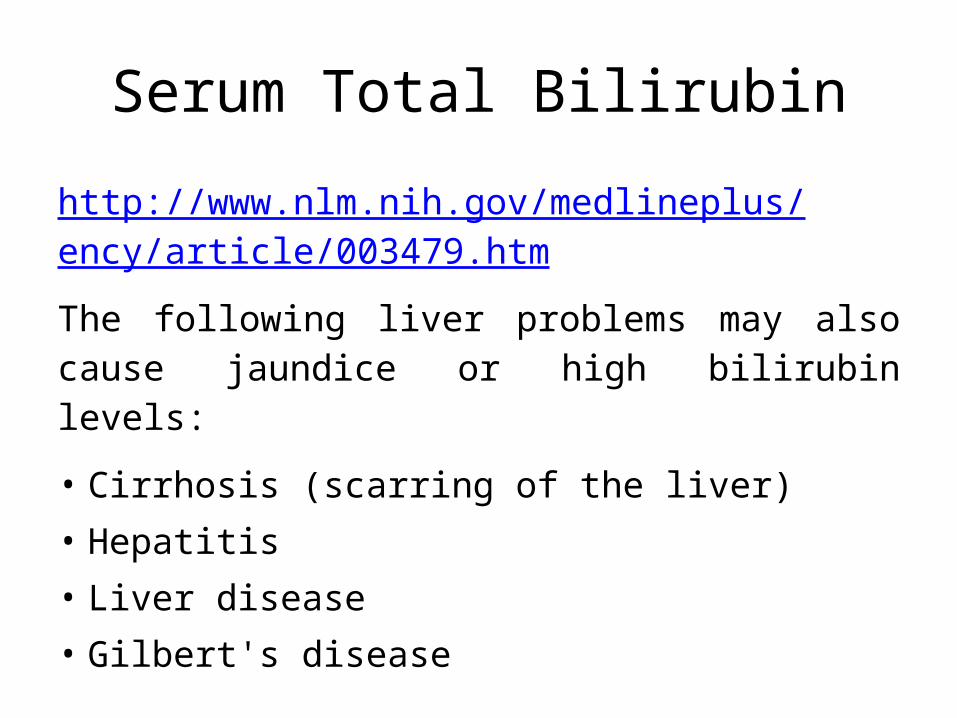
Serum Total Bilirubin
http://www.nlm.nih.gov/medlineplus/ency/article/003479.htm
The following liver problems may also cause jaundice or high bilirubin levels:
• Cirrhosis (scarring of the liver)• Hepatitis• Liver disease• Gilbert's disease
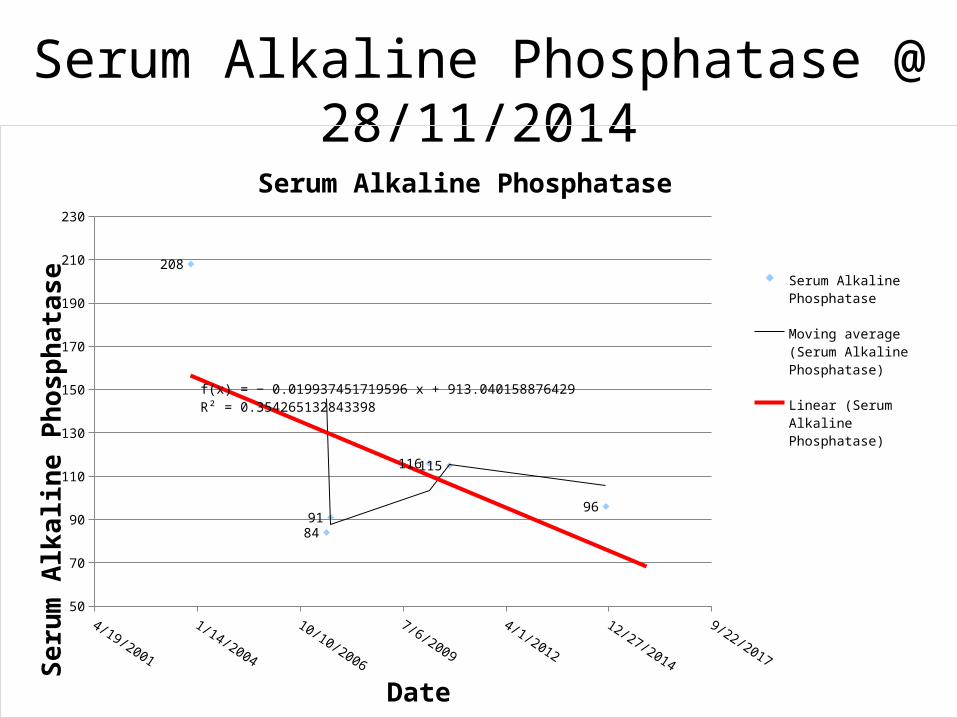
Serum Alkaline Phosphatase @ 28/11/2014
4/19/2001
1/14/2004
10/10/2006
7/6/2009
4/1/2012
12/27/2014
9/22/2017
50
70
90
110
130
150
170
190
210
230
208
8491
116115
96
f(x) = − 0.019937451719596 x + 913.040158876429R² = 0.354265132843398
Serum Alkaline Phosphatase
Serum Alkaline Phosphatase
Moving average (Serum Alka-line Phosphatase)
Linear (Serum Alkaline Phosphatase)
Date
Seru
m A
lkal
ine
Phos
phat
ase
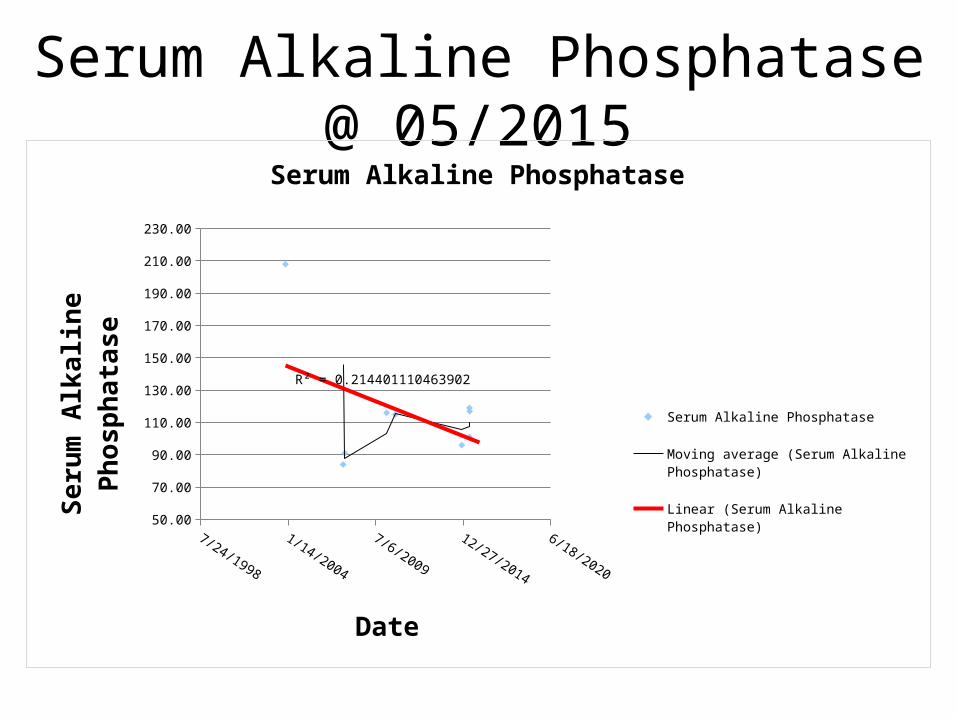
Serum Alkaline Phosphatase @ 05/2015
4/19/2001
1/14/2004
10/10/2006
7/6/2009
4/1/2012
12/27/2014
9/22/2017
50.00
70.00
90.00
110.00
130.00
150.00
170.00
190.00
210.00
230.00
R² = 0.214401110463902
Serum Alkaline Phosphatase
Serum Alkaline Phosphatase
Moving average (Serum Alkaline Phosphatase)
Linear (Serum Alkaline Phosphatase)
Date
Seru
m A
lkal
ine
Phos
phat
ase
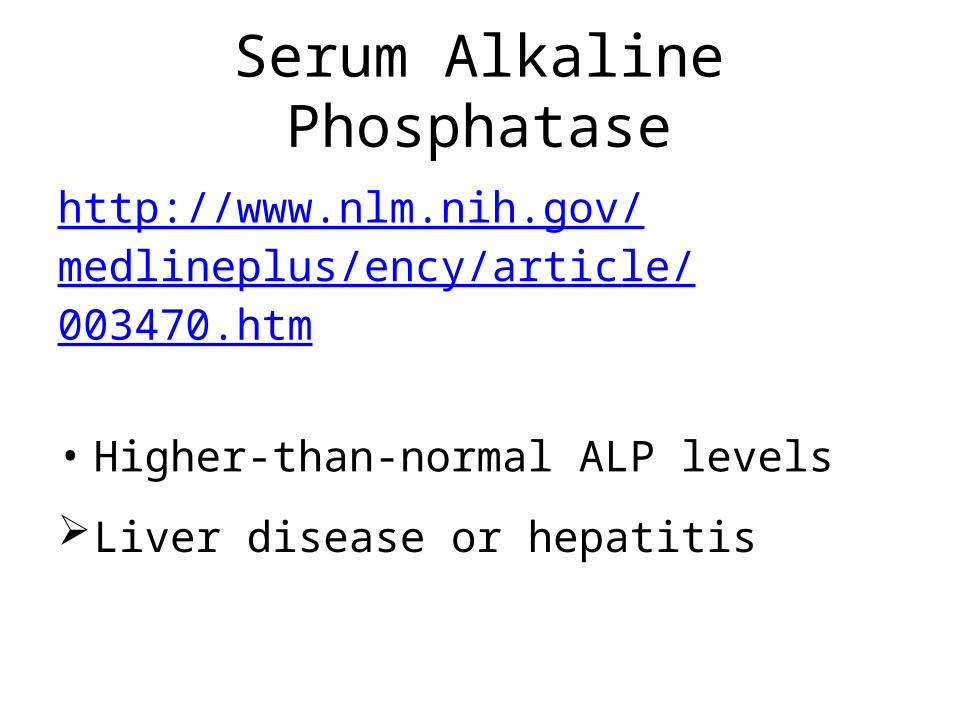
Serum Alkaline Phosphatase
http://www.nlm.nih.gov/medlineplus/ency/article/003470.htm
• Higher-than-normal ALP levels
Liver disease or hepatitis

Pituitary
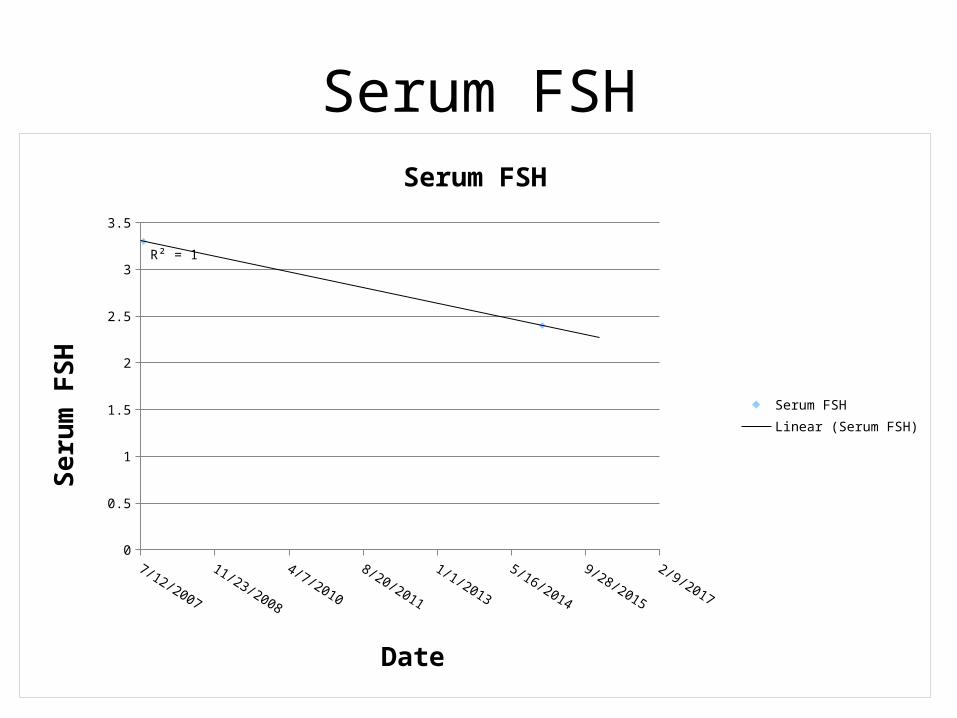
Serum FSH
7/12/2007
11/23/2008
4/7/2010
8/20/2011
1/1/2013
5/16/2014
9/28/2015
2/9/2017
0
0.5
1
1.5
2
2.5
3
3.5
R² = 1
Serum FSH
Serum FSHLinear (Serum FSH)
Date
Seru
m F
SH
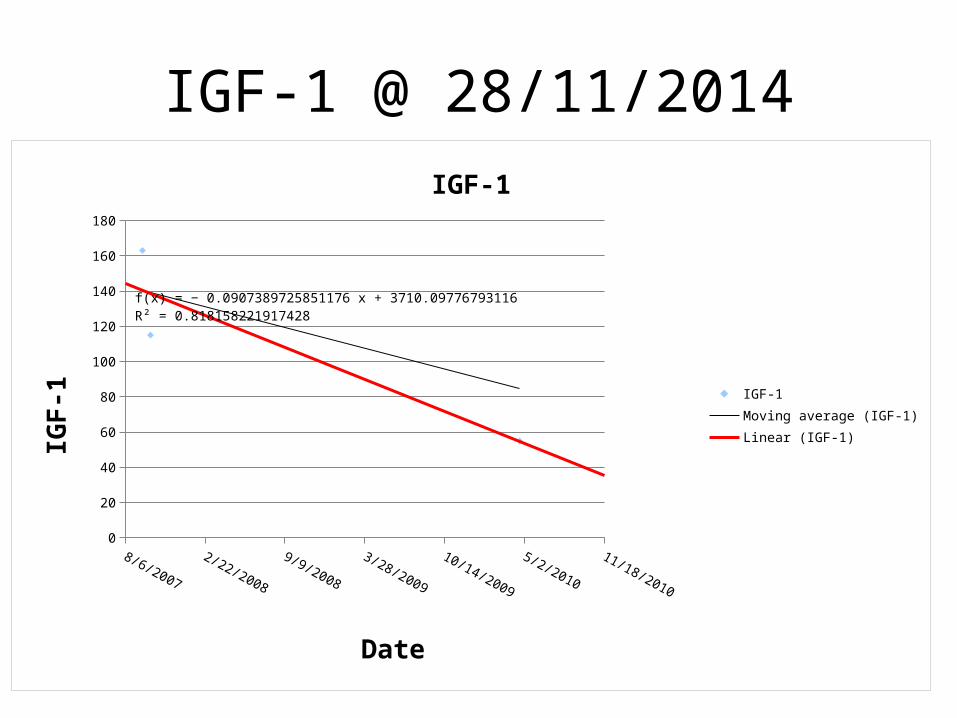
IGF-1 @ 28/11/2014
8/6/2007
2/22/2008
9/9/2008
3/28/2009
10/14/2009
5/2/2010
11/18/2010
0
20
40
60
80
100
120
140
160
180
f(x) = − 0.0907389725851176 x + 3710.09776793116R² = 0.818158221917428
IGF-1
IGF-1Moving average (IGF-1)Linear (IGF-1)
Date
IGF-
1
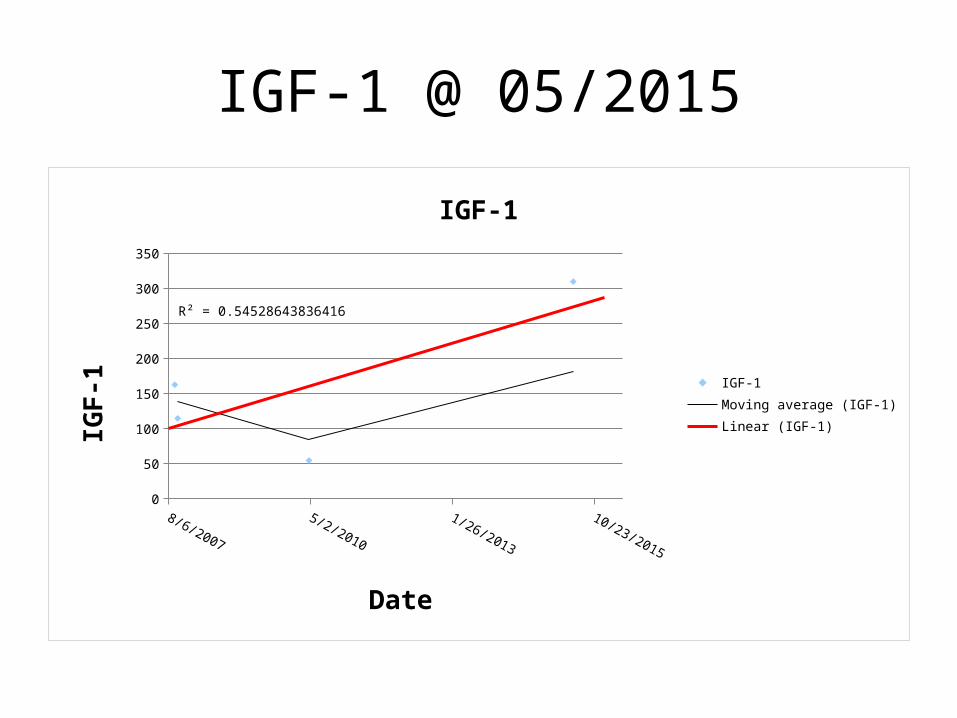
IGF-1 @ 05/2015
8/6/2007
12/18/2008
5/2/2010
9/14/2011
1/26/2013
6/10/2014
10/23/2015
0
50
100
150
200
250
300
350
R² = 0.54528643836416
IGF-1
IGF-1Moving average (IGF-1)Linear (IGF-1)
Date
IGF-
1
IGF-1http://labtestsonline.org/understanding/analytes/igf1/tab/test/Decreased IGF-1If the IGF-1 level is decreased, then it is likely that there is a GH deficiency or an insensitivity to GH. If this is in a child, the GH deficiency may have already caused short stature and delayed development and may be treated with GH supplementation. Adults will have an age-related decrease in production, but lower than expected levels may reflect a GH deficiency or insensitivity.
If a decrease in IGF-1 is suspected to be due to a more general decrease in pituitary function (hypopituitarism), then several other endocrine glands and their pituitary regulating hormones will need to be evaluated to decide on appropriate treatment. Reduced pituitary function may be due to inherited defects or can develop as a result of pituitary damage following conditions such as trauma, infections, and inflammation.
Decreased levels of IGF-1 also may be seen with nutritional deficiencies (including anorexia nervosa), chronic kidney or liver disease, inactive/ineffective forms of GH, and with high doses of estrogen.
Increased IGF-1Elevated levels of IGF-1 usually indicate an increased production of GH. Since GH levels vary throughout the day, IGF-1 levels are a reflection of average GH production, not of the actual amount of GH in the blood at the time that the sample for the IGF-1 measurement was taken. This is accurate up to the point at which the liver's capacity to produce IGF-1 is reached. With severely increased GH production, the IGF-1 level will stabilize at an elevated maximum level.
Increased levels of GH and IGF-1 are normal during puberty and pregnancy but otherwise are most frequently due to pituitary tumors (usually benign).
Rates of decrease
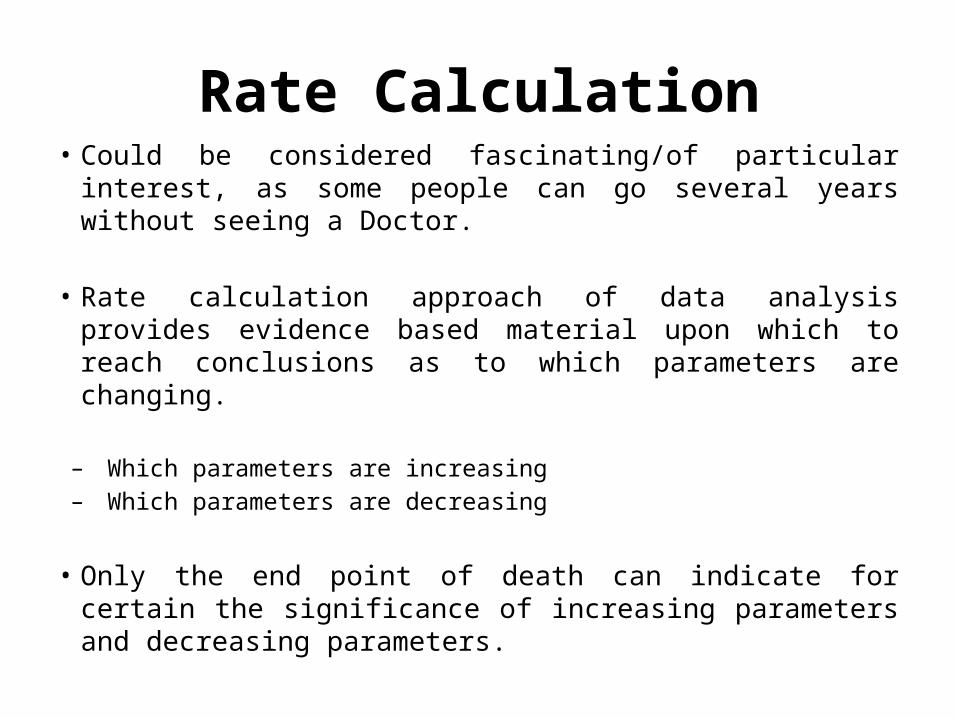
Rate Calculation• Could be considered fascinating/of particular interest, as some
people can go several years without seeing a Doctor.
• Rate calculation approach of data analysis provides evidence based material upon which to reach conclusions as to which parameters are changing.
– Which parameters are increasing– Which parameters are decreasing
• Only the end point of death can indicate for certain the significance of increasing parameters and decreasing parameters.

Rates of decrease
Rates of decrease 6 months 3 years
28/11/2014 28/05/2015 28/01/2018 Comments
Urine Albumin to Creatinine Ratio 0.0337Testosterone 0.0022 0.0019 13.6% DecreaseALT/SGPT Serum level 0.0030Serum FSH 0.0003IGF-1 0.0907Serum Alkaline Phosphatase 0.0199 0.0127HbA1c 0.0014 0.0011 21.4% Decrease Serum Triglycerides 0.0002 0.0002Serum Cholesterol 0.0002 0.0005 150% IncreaseSerum LDL Cholesterol 0.0009Serum Total Bilirubin 0.0005 0.0008Serum Globulin 0.0006Urine Albumin 0.4123 0.0999
As at May 2015, I believe that I have enough data to say with some confidence that the parameters below are decreasing
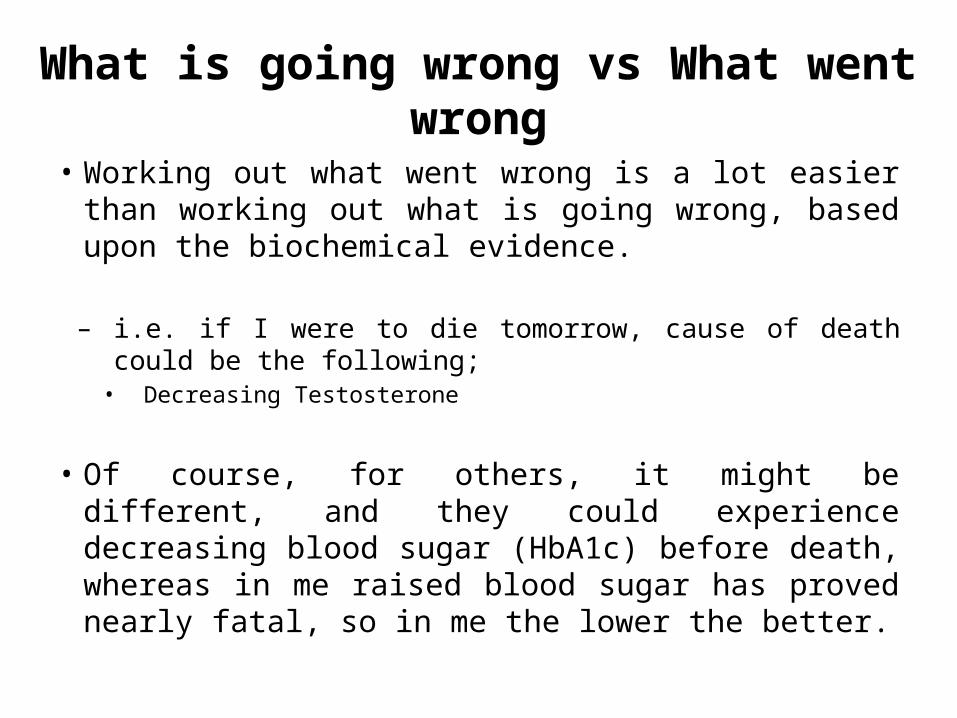
What is going wrong vs What went wrong
• Working out what went wrong is a lot easier than working out what is going wrong, based upon the biochemical evidence.
– i.e. if I were to die tomorrow, cause of death could be the following;• Decreasing Testosterone
• Of course, for others, it might be different, and they could experience decreasing blood sugar (HbA1c) before death, whereas in me raised blood sugar has proved nearly fatal, so in me the lower the better.

Sir David Frost's family talk of their devastation after his eldest son, Miles, 31, died suddenly while jogging and reveal how 'he was the leader of the pack
since Dad died'
http://www.dailymail.co.uk/news/article-3168786/Sir-David-Frost-s-eldest-son-dies-just-
31-Fitness-fanatic-collapsed-morning-run-family-s-Oxfordshire-holiday-home.html

Miles Frost, 31, was a keen athlete and had shown no signs of ill health
• 'I had breakfast with him last Thursday and he was in great form. There was no signs that anything was wrong.
• 'It just underscores the fragility of life. There will be a post mortem examination but all we know is that he collapsed while jogging.
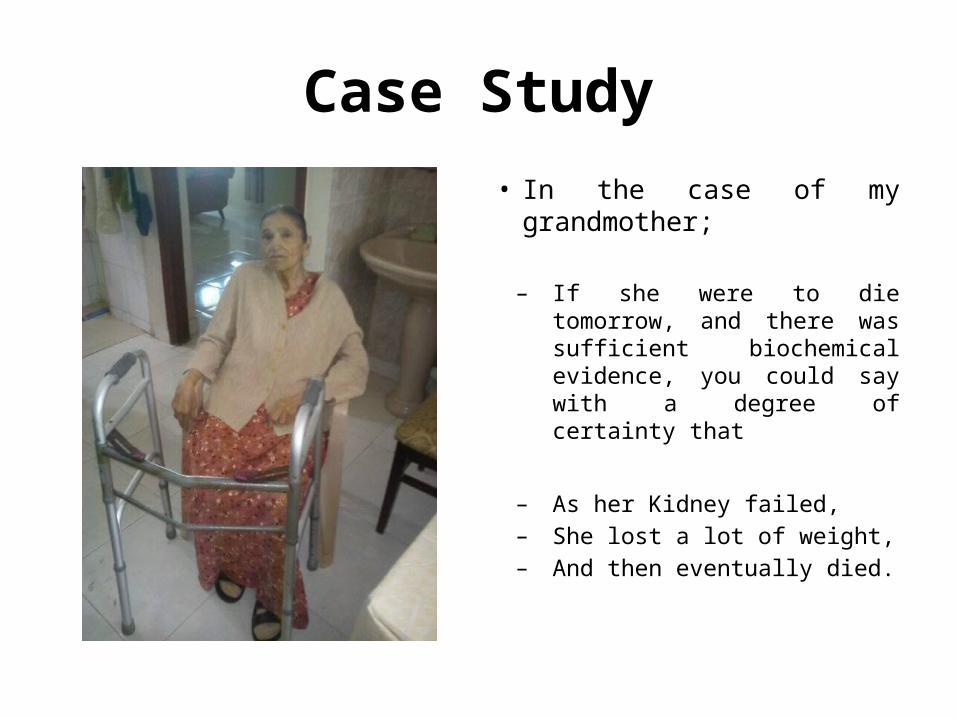
Case Study
• In the case of my grandmother;
– If she were to die tomorrow, and there was sufficient biochemical evidence, you could say with a degree of certainty that
– As her Kidney failed,– She lost a lot of weight,– And then eventually died.
Cause of death
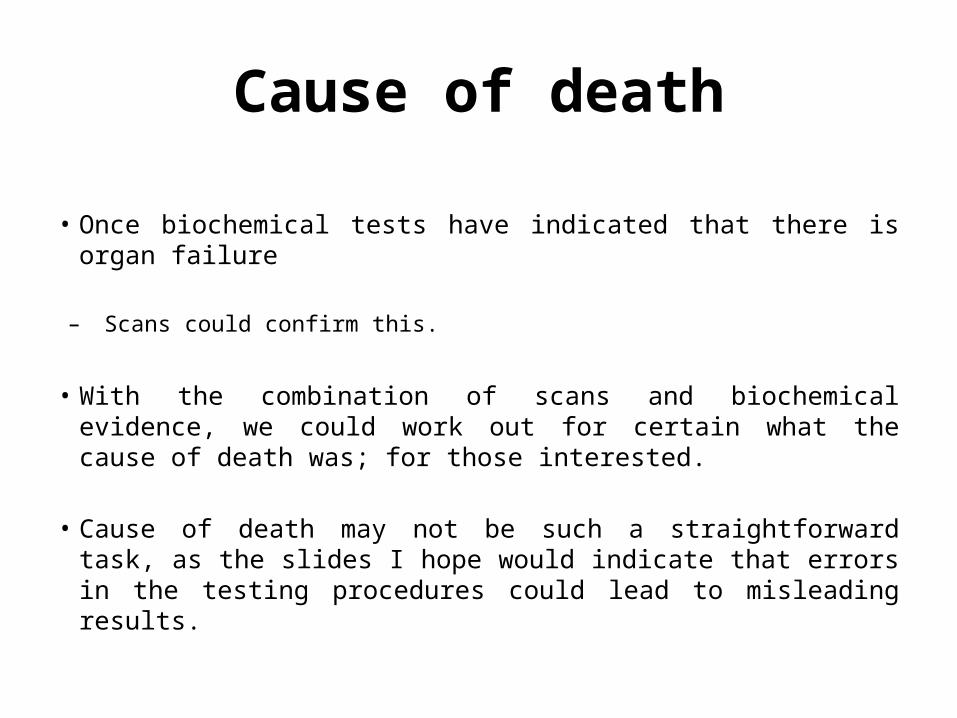
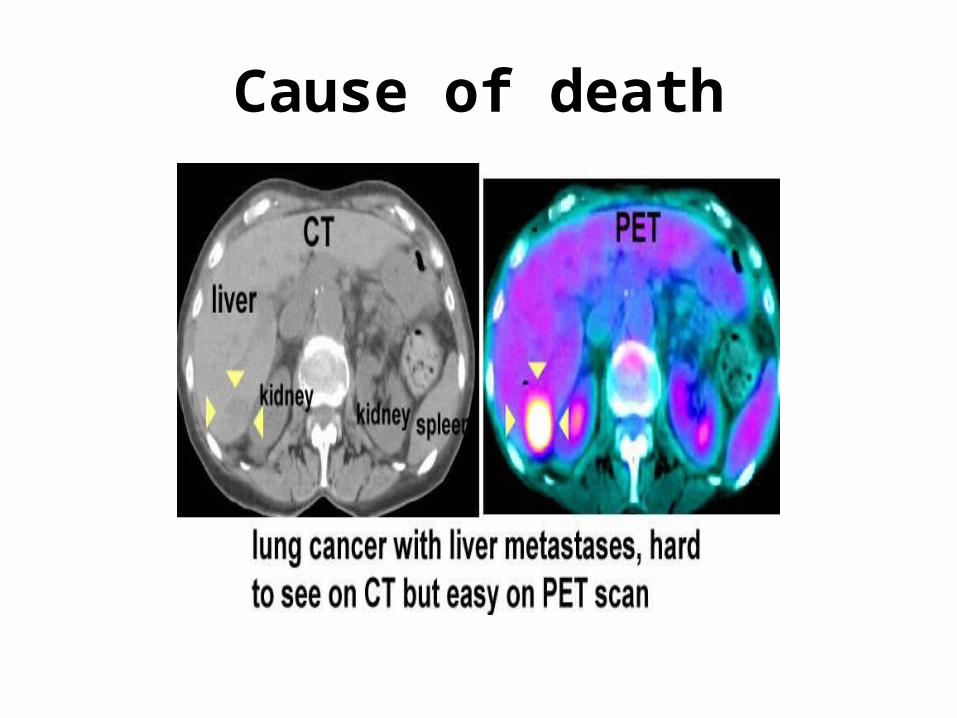
• Once biochemical tests have indicated that there is organ failure
– Scans could confirm this.
• With the combination of scans and biochemical evidence, we could work out for certain what the cause of death was; for those interested.
• Cause of death may not be such a straightforward task, as the slides I hope would indicate that errors in the testing procedures could lead to misleading results.
Cause of death


![2 [ SBED – 2019 ] · 2019-07-15 · [ SBED – 2019 ] SET-A 6 17. Step up transformer are used for : (A) increasing electrical power (B) decreasing electrical power (C) decreasing](https://img.dokumen.tips/doc/110x75/5ea4125a4687c8708c78749f/2-sbed-a-2019-2019-07-15-sbed-a-2019-set-a-6-17-step-up-transformer.jpg)