Embed Size (px)
Citation preview

5.2.4.2.2 Petroleum Hydrocarbons in Suspended Solids
Total petroleum hydrocarbon (TPH) pollution in the suspended solids was analyzed withGC/FID and the results are shown in Figure C2.4.2.-2.
FIGURE C2.4.2.-2: Longitudinal variation in the concentration of TPH in suspended solids collected from the Danube Riverand its tributaries during JDS.
The petroleum hydrocarbons in the suspended solids demonstrated higher contamination andvariations in the pollution input in the Middle Danube Reach. The first significant increasewas observed downstream of Budapest. Higher contaminations were measured further down-wards in the Yugoslavian section of the Danube, reaching extremely high concentration in theriver Velika Morava.
5.2.4.2.3 Petroleum Hydrocarbons in Bottom Sediment
The bottom sediment samples were analysed for petroleum hydrocarbon contamination usingboth spectrophotometric (UV absorption and fluorescence) and chromatographic (GC-FID)methods.
Comparison of the results obtained with these analytical methods is given in Figure C2.4.2.-3.
- 213 -

FIGURE C2.4.2.-3: Longitudinal variation in the concentration of TPH, measured with three different methods, in the bot-tom sediment samples collected from the Danube River and its tributaries during JDS.
The vertical distribution of TPH in the sediment core samples is shown in Figures C.2.4.2.-4through C2.4.2.-6.
- 214 -

FIGURE C2.4.2.-4: Vertical variations in the concentration of TPH in the Danube bottom sediment, collected in theGabcikovo Reservoir (JDS-19).
FIGURE C2.4.2.-5: Vertical variations in the concentration of TPH in the bottom sediment, collected in the Rackeve-SoroksarDanube Arm (JDS-36).
The two analysed layers in the core sample collected from the Gabcikovo Reservoir showedvery low contamination; however, the TPH contamination in the sediment core from theRackeve-Soroksar Danube-Arm (Figure C2.4.2.-5) demonstrated significantly higher contami-nation. The vertical variation was insignificant in both sediment cores.
Although TPH concentrations in the core samples collected in the upper part of the Iron GateReservoir, see Figure C.2.4.2.-6, were not very high but significant differences were observed inthe different layers particularly in the right bank of the Danube. The vertical variation in the coreindicates time to time pollution input as accumulating in the bottom sediment.
- 215 -

Left-bank Right-bank
FIGURE C2.4.2.-6: Vertical variations in the TPH in the Danube bottom sediment at 1077 river km (JDS-63).
Comparison between the TPH and TOC values in suspended solids and sediment samples isshown in Figure C2.4.2.-7. No significant correlation between the TPH and TOC can beobserved in general. It is interesting to note that the high TPH and low TOC values were inthe sediment samples collected from the oil-contaminated tributaries and in downstreamDanube samples, i.e. JDS-87, Arges and JDS-88, Danube downstream of the Arges. On the otherhand, high TOC and low TPH values were found in the suspended solid samples which con-tained high percentage of the algal biomass resulting in high TOC values.
FIGURE C2.4.2.-7: Correlation between THP and TOC on the basis of measurements in suspended solids (SS) and sediments.
- 216 -
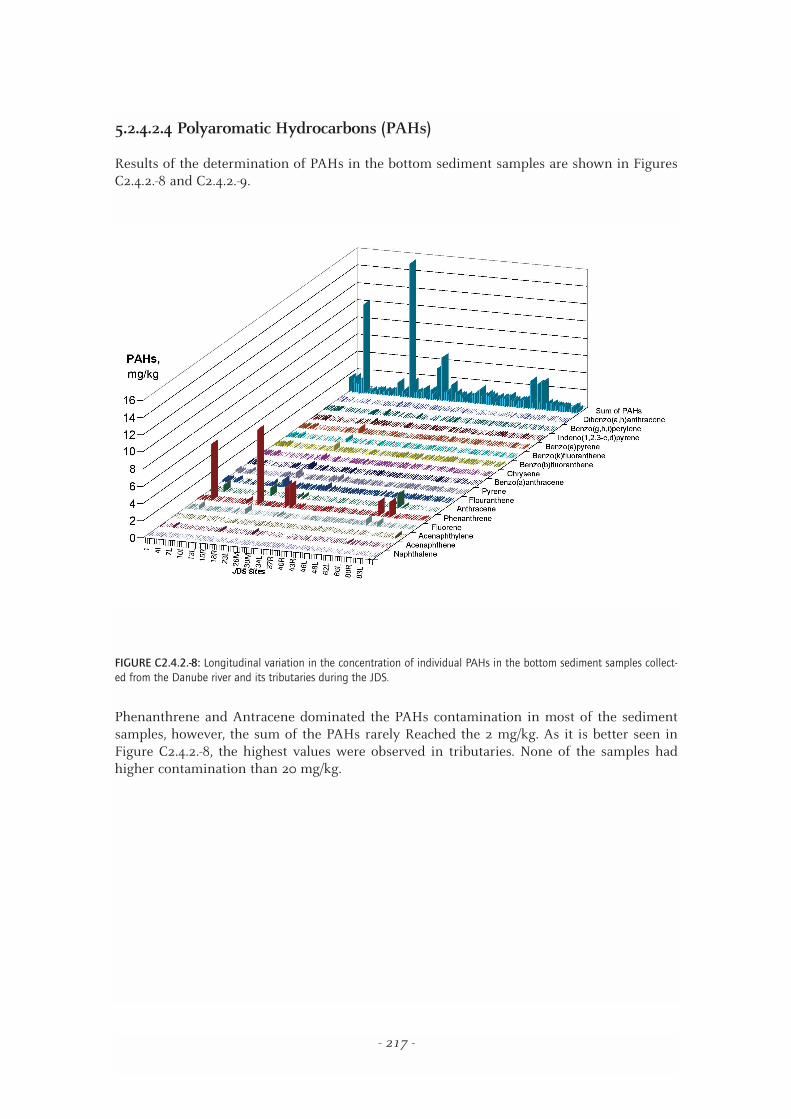
5.2.4.2.4 Polyaromatic Hydrocarbons (PAHs)
Results of the determination of PAHs in the bottom sediment samples are shown in FiguresC2.4.2.-8 and C2.4.2.-9.
FIGURE C2.4.2.-8: Longitudinal variation in the concentration of individual PAHs in the bottom sediment samples collect-ed from the Danube river and its tributaries during the JDS.
Phenanthrene and Antracene dominated the PAHs contamination in most of the sedimentsamples, however, the sum of the PAHs rarely Reached the 2 mg/kg. As it is better seen inFigure C2.4.2.-8, the highest values were observed in tributaries. None of the samples hadhigher contamination than 20 mg/kg.
- 217 -

FIGURE C2.4.2.-9: Longitudinal variation in the concentration of individual PAHs in selected bottom sediment samples, inwhich sum of PAHs exceeded 2 mg/kg.
The PAHs distribution in the sediment core samples is demonstrated in Figures C2.4.2.-10through C2.4.2.-12.
FIGURE C2.4.2.-10: Vertical variations in the concentration of the PAHs in the Danube bottom sediment, collected in theGabcikovo reservoir (JDS-19).
- 218 -
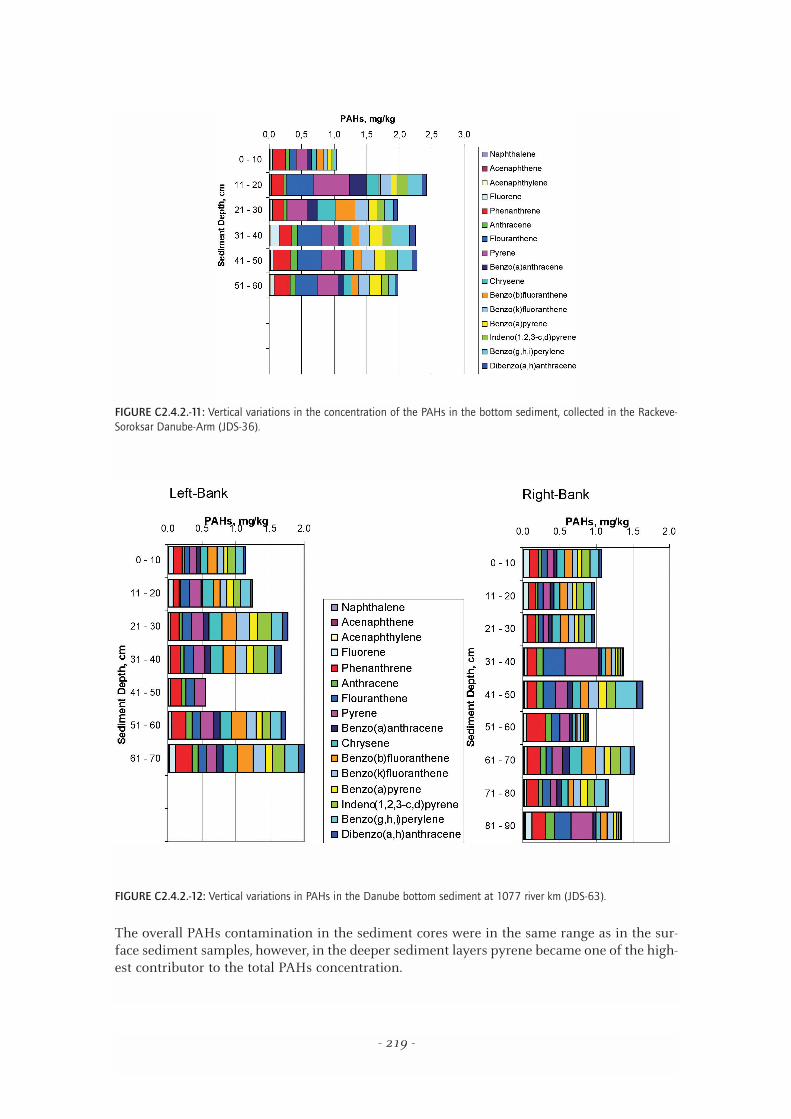
FIGURE C2.4.2.-11: Vertical variations in the concentration of the PAHs in the bottom sediment, collected in the Rackeve-Soroksar Danube-Arm (JDS-36).
FIGURE C2.4.2.-12: Vertical variations in PAHs in the Danube bottom sediment at 1077 river km (JDS-63).
The overall PAHs contamination in the sediment cores were in the same range as in the sur-face sediment samples, however, in the deeper sediment layers pyrene became one of the high-est contributor to the total PAHs concentration.
- 219 -