Embed Size (px)
Citation preview
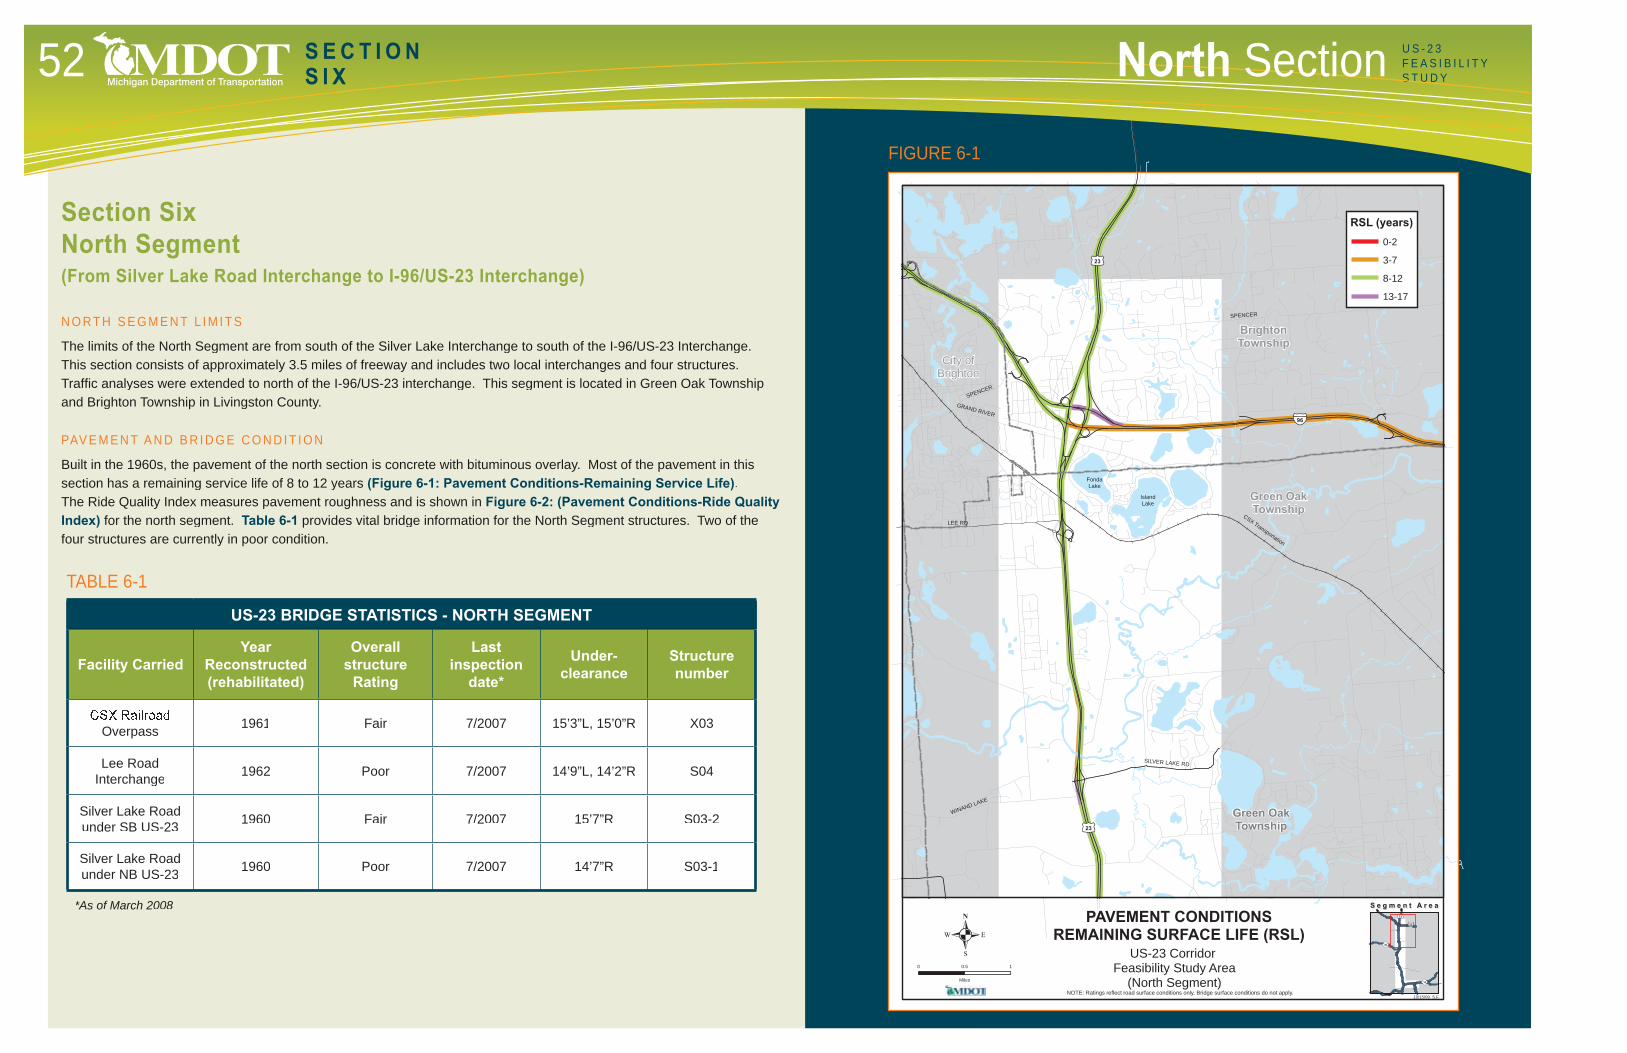
TABLE 6-1
US-23 BRIDGE STATISTICS - NORTH SEGMENT
Facility CarriedYear
Reconstructed(rehabilitated)
Overall structure
Rating
Lastinspection
date*
Under-clearance
Structure number
Overpass 1961 Fair 7/2007 15’3”L, 15’0”R X03
Lee Road Interchange 1962 Poor 7/2007 14’9”L, 14’2”R S04
Silver Lake Roadunder SB US-23 1960 Fair 7/2007 15’7”R S03-2
Silver Lake Roadunder NB US-23 1960 Poor 7/2007 14’7”R S03-1
*As of March 2008
Section Six North Segment(From Silver Lake Road Interchange to I-96/US-23 Interchange)
N O RT H S E G M E N T L I M I T S
The limits of the North Segment are from south of the Silver Lake Interchange to south of the I-96/US-23 Interchange. This section consists of approximately 3.5 miles of freeway and includes two local interchanges and four structures. Traffi c analyses were extended to north of the I-96/US-23 interchange. This segment is located in Green Oak Township and Brighton Township in Livingston County.
PAV E M E N T A N D B R I D G E C O N D I T I O N
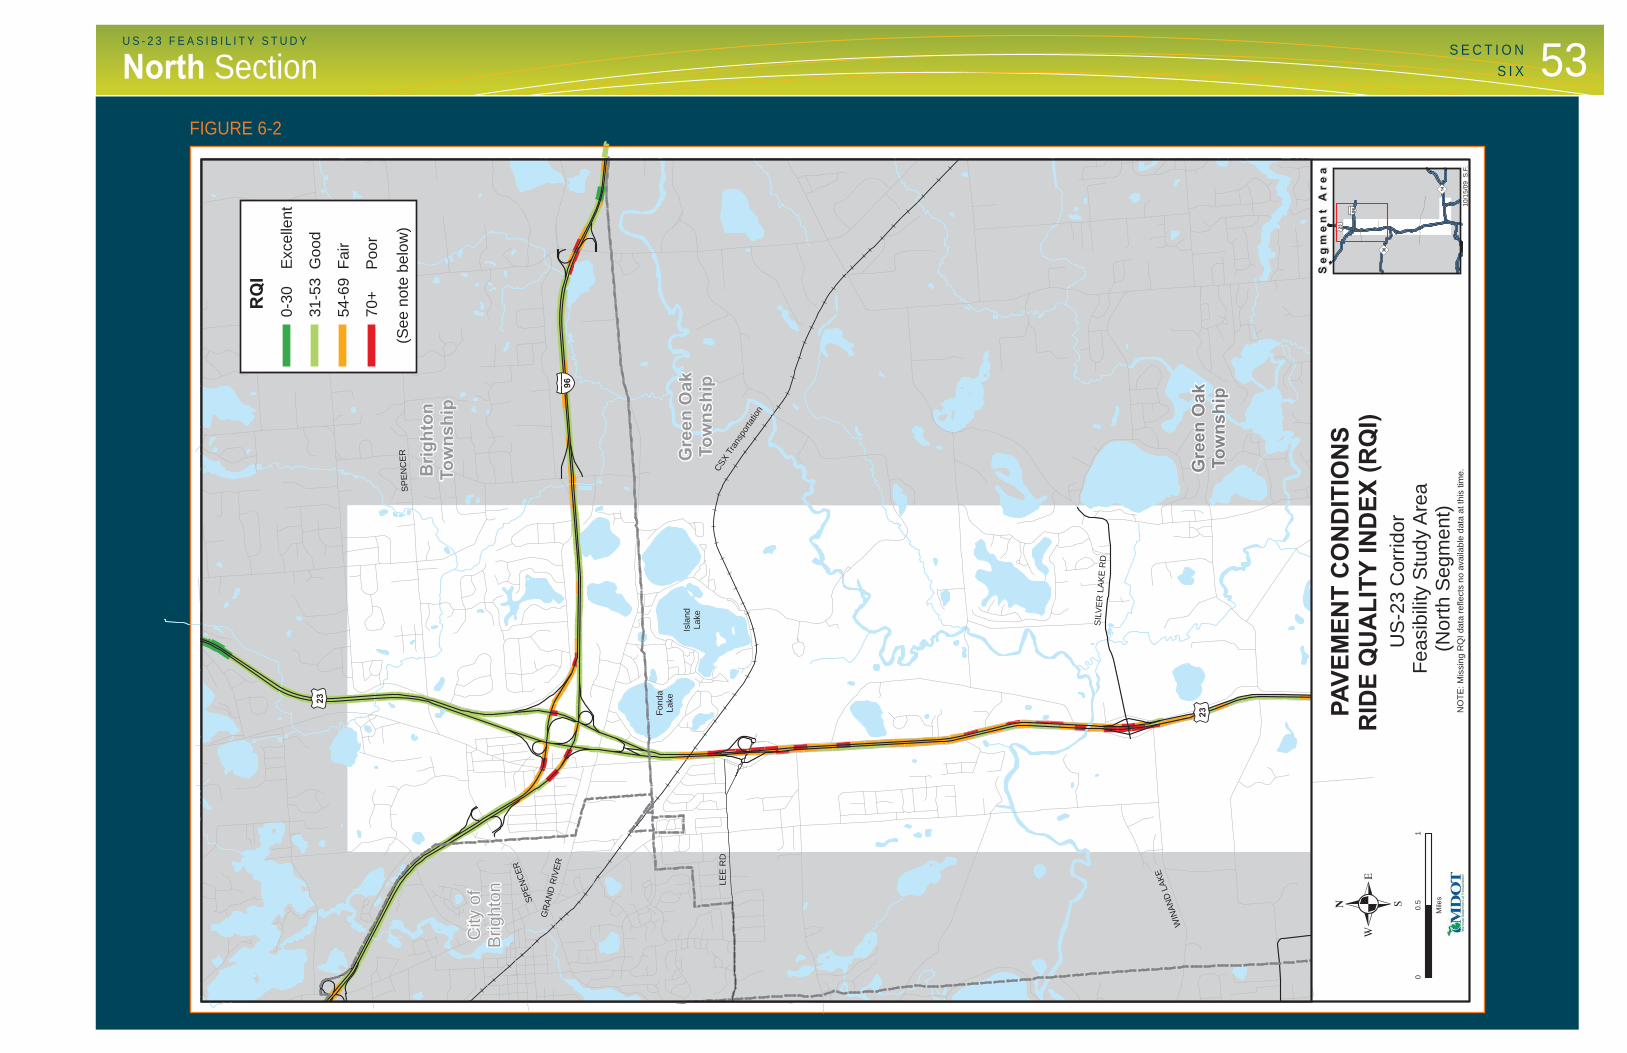
Built in the 1960s, the pavement of the north section is concrete with bituminous overlay. Most of the pavement in thissection has a remaining service life of 8 to 12 years (Figure 6-1: Pavement Conditions-Remaining Service Life). The Ride Quality Index measures pavement roughness and is shown in Figure 6-2: (Pavement Conditions-Ride Quality Index) for the north segment. Table 6-1 provides vital bridge information for the North Segment structures. Two of thefour structures are currently in poor condition.
§̈¦B S
96
tu23
LEE RD
SILVER LAKE RD
tu23
BrightonTownship
CSX Transportation
WINAND LAKE
FondaLake
IslandLake
SPENCER
GRAND RIVER
SPENCER
City ofBrighton
Green OakTownship
Green OakTownship
NOTE: Ratings reflect road surface conditions only. Bridge surface conditions do not apply.
0 10.5
Miles
.S e g m e n t A r e aS e g m e n t A r e a
10/15/09 S.F.
RSL (years)0-2
3-7
8-12
13-17
US-23 Corridor Feasibility Study Area
(North Segment)
PAVEMENT CONDITIONSREMAINING SURFACE LIFE (RSL)
")36
§̈¦96
tu23
")14
FIGURE 6-1
U S - 2 3F E A S I B I L I T YS T U D Y52 North SectionS E C T I O N
S I X
53U S - 2 3 F E A S I B I L I T Y S T U D YS E C T I O N
S I XNorth Section
§̈ ¦BS 96
t u23
LEE
RD
SILV
ER
LAKE
RD
t u23
Brig
hton
Tow
nshi
p
CSX
Tran
spor
tatio
n
WIN
AND
LAKE
Fond
aLa
ke
Isla
ndLa
ke
SPE
NC
ER
GR
AND
RIV
ER
SPEN
CER
City
of
Brig
hton
Gre
en O
akTo
wns
hip
Gre
en O
akTo
wns
hip
NO
TE: M
issi
ng R
QI d
ata
refle
cts
no a
vaila
ble
data
at t
his
time.
01
0.5
Mile
s.S
eg
me
nt
Are
aS
eg
me
nt
Are
a
10/1
5/09
S.F
.
US
-23
Cor
ridor
Fe
asib
ility
Stu
dy A
rea
(Nor
th S
egm
ent)
PAVE
MEN
T C
ON
DIT
ION
SR
IDE
QU
ALI
TY IN
DEX
(RQ
I)
")36
§̈ ¦96t u2
3
")14
RQ
I0-
30
Exc
elle
nt
31-5
3 G
ood
54-6
9 F
air
70+
P
oor
(See
not
e be
low
)
FIGURE 6-2
54 U S - 2 3 F E A S I B I L I T Y S T U D YS E C T I O NS I X North Section
TABLE 6-2
EXISTING (2007) AM & PM PEAK HOURS LEVEL OF SERVICE BASIC FREEWAY SEGMENTS
2007 Southbound US-23 AM Peak 2007 Southbound US-23 PM Peak
Freeway SegmentTo/From
Volume,V
FlowRate,Pc/hr
Density*,Pc/mi/ln LOS Volume,
V
FlowRate,Pc/hr
Density*,Pc/mi/ln LOS
N of I-96 to I-96 Interchange* 2,975 1.752 25.6 C 2,000 1,178 16.8 B
I-96 Interchange to Lee Road 3,225 1,899 28.5 D 3,000 1,767 25.9 C
Lee Road to Silver Lake 3,200 1,844 28.2 D 2,825 1,664 24.1 C
Silver Lake to 9 Mile 3,250 1,914 28.9 D 2,550 1,502 21.5 C
2007 Northbound US-23 AM Peak 2007 Northbound US-23 PM Peak
Freeway SegmentTo/From
Volume,V
FlowRate,Pc/hr
Density*,Pc/mi/ln LOS Volume,
V
FlowRate,Pc/hr
Density*,Pc/mi/ln LOS
9 Mile to Silver Lake 2,000 1,178 16.8 B 3,550 2,061 32.4 D
Silver Lake to Lee Road 2,325 1,369 19.6 C 3,450 2,032 31.6 D
Lee Road to I-96 Interchange 2,400 1,413 20.2 C 3,200 1,884 28.2 D
I-96 Interchange to North of I-96 1,925 1,134 16.2 B 2,650 1,561 22.4 C
*Outside of project area
T Y P I C A L R I G H T- O F - WAY
The right-of-way width along the roadway is 150 feet along the center of the roadway. Individual interchange aerial photos located in the North Segment Structures section illustrate more detailed right-of-way information near the interchanges.
T R A F F I C C O N D I T I O N S
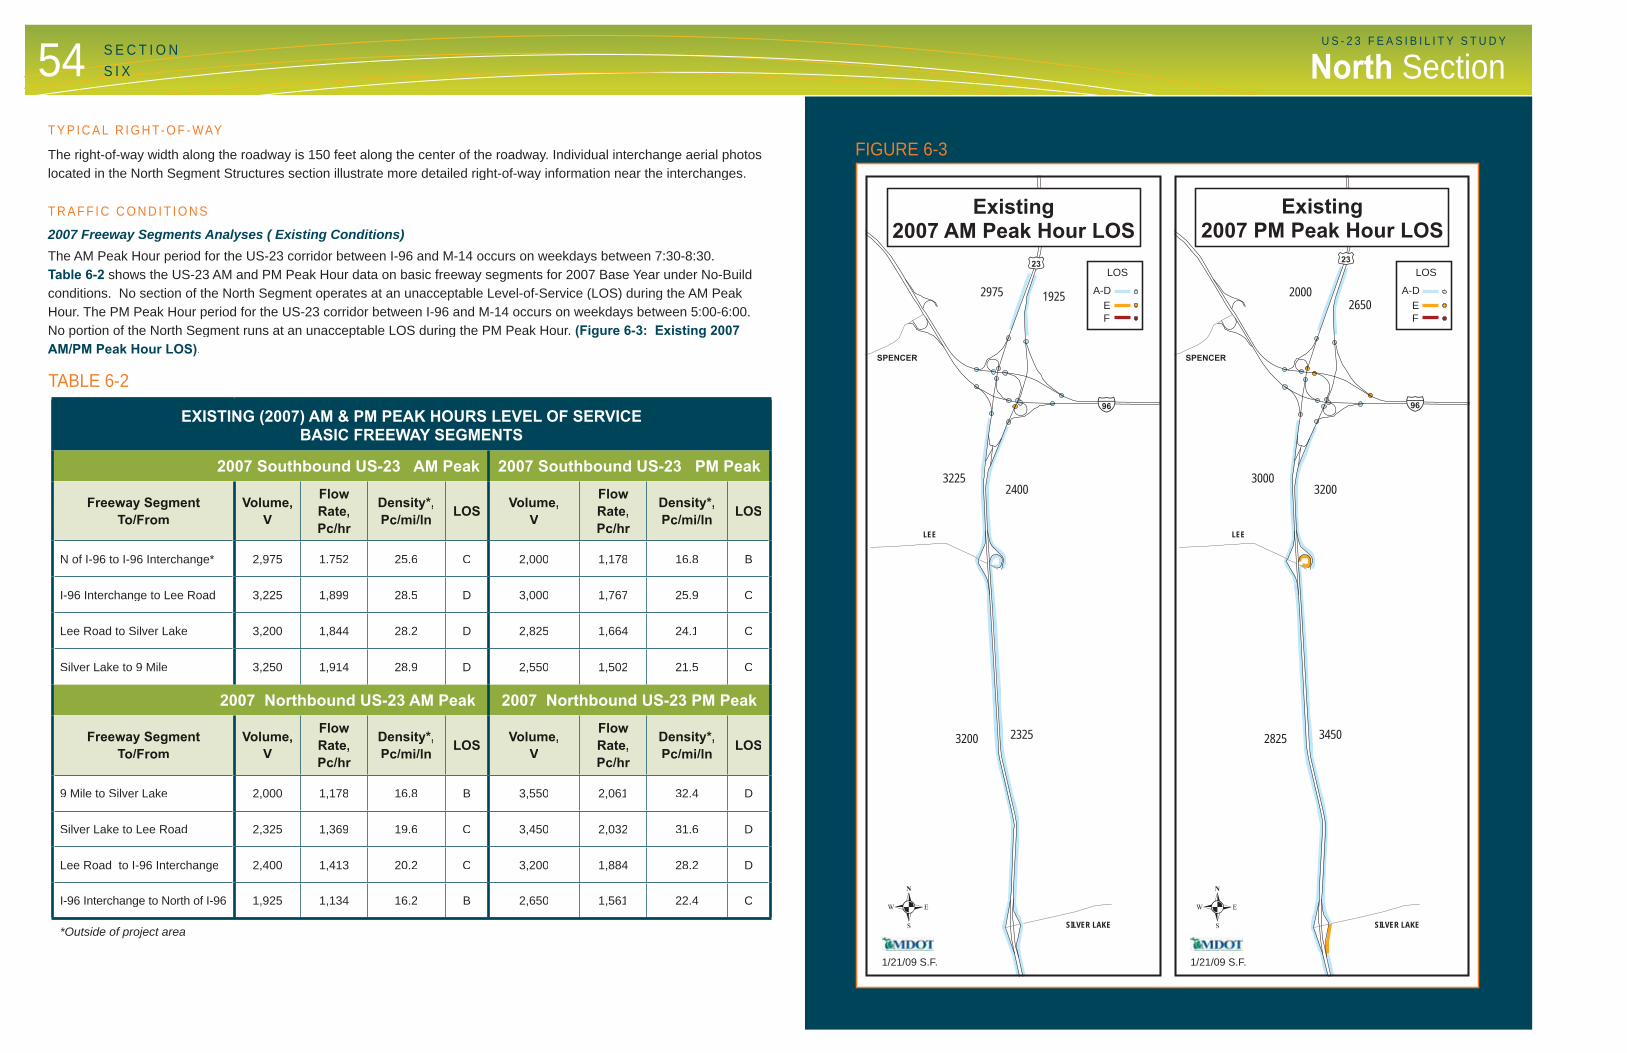
2007 Freeway Segments Analyses ( Existing Conditions)The AM Peak Hour period for the US-23 corridor between I-96 and M-14 occurs on weekdays between 7:30-8:30. Table 6-2 shows the US-23 AM and PM Peak Hour data on basic freeway segments for 2007 Base Year under No-Build conditions. No section of the North Segment operates at an unacceptable Level-of-Service (LOS) during the AM PeakHour. The PM Peak Hour period for the US-23 corridor between I-96 and M-14 occurs on weekdays between 5:00-6:00. No portion of the North Segment runs at an unacceptable LOS during the PM Peak Hour. (Figure 6-3: Existing 2007 AM/PM Peak Hour LOS).
§̈¦96
tu23
LEE
1925
32252400
2325
SPENCER
SILVER LAKE
2975
3200
Existing2007 AM Peak Hour LOS
§̈¦96
tu23
LEE
2650
30003200
3450
SPENCER
SILVER LAKE
2000
2825
Existing2007 PM Peak Hour LOS
1/21/09 S.F.
.1/21/09 S.F.
.
LOS
A-DEF
LOS
A-DEF
FIGURE 6-3
55U S - 2 3 F E A S I B I L I T Y S T U D YS E C T I O N
S I XNorth Section
TABLE 6-3
FUTURE (2030) AM & PM PEAK HOURS LEVEL OF SERVICE BASIC FREEWAY SEGMENTS ( NO-BUILD CONDITIONS)
2030 Southbound US-23 AM Peak 2030 Southbound US-23 PM Peak
Freeway SegmentTo/From
Volume,V
Flow Rate,Pc/hr
Density*,Pc/mi/ln LOS Volume,
V
FlowRate,Pc/hr
Density*,Pc/mi/ln LOS
N of I-96 to I-96 Interchange* 3,800 2,238 37.9 E 2,650 1,561 22.4 C
I-96 Interchange to Lee Road 4,475 2,635 >45 F 3,975 2,341 42.1 E
Lee Road to Silver Lake 4,450 2,621 >45 F 3,825 2,253 38.5 E
Silver Lake to 9 Mile 4,650 2,738 >45 F 3,525 2.076 32.8 D
2030 Northbound US-23 AM Peak 2030 Northbound US-23 PM Peak
Freeway SegmentTo/From
Volume,V
Flow Rate,Pc/hr
Density*,Pc/mi/ln LOS Volume,
V
FlowRate,Pc/hr
Density*,Pc/mi/ln LOS
9 Mile to Silver Lake 2,400 1,413 20.2 C 4,625 2,753 >45 F
Silver Lake to Lee Road 2,875 1,693 24.6 C 4,425 3,003 >45 F
Lee Road to I-96 Interchange 3,125 1,840 27.3 D 4,150 2,989 >45 F
I-96 Interchange to North of I-96 2,450 1,443 20.6 C 3,375 1,989 30.8 D
*Outside of project area
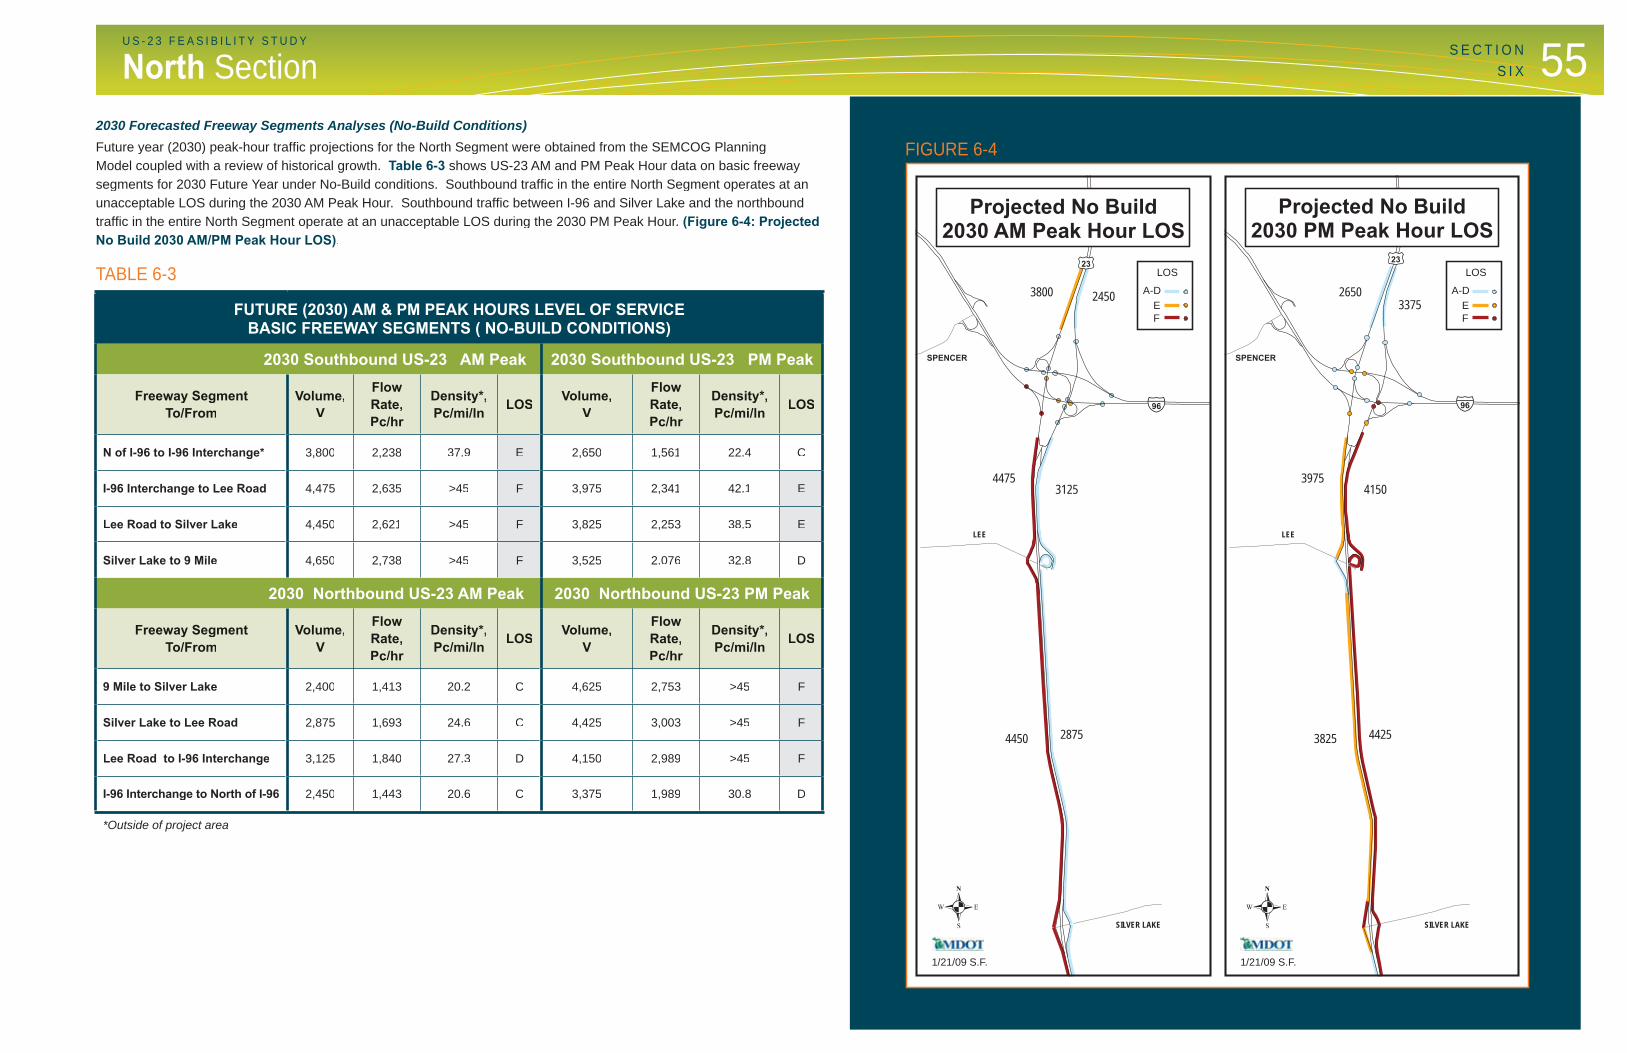
2030 Forecasted Freeway Segments Analyses (No-Build Conditions)Future year (2030) peak-hour traffi c projections for the North Segment were obtained from the SEMCOG PlanningModel coupled with a review of historical growth. Table 6-3 shows US-23 AM and PM Peak Hour data on basic freewaysegments for 2030 Future Year under No-Build conditions. Southbound traffi c in the entire North Segment operates at an unacceptable LOS during the 2030 AM Peak Hour. Southbound traffi c between I-96 and Silver Lake and the northboundtraffi c in the entire North Segment operate at an unacceptable LOS during the 2030 PM Peak Hour. (Figure 6-4: Projected No Build 2030 AM/PM Peak Hour LOS).
§̈¦96
tu23
LEE
2450
44753125
2875
SPENCER
SILVER LAKE
3800
4450
Projected No Build2030 AM Peak Hour LOS
§̈¦96
tu23
LEE
3375
39754150
4425
SPENCER
SILVER LAKE
2650
3825
Projected No Build2030 PM Peak Hour LOS
1/21/09 S.F.
.1/21/09 S.F.
.
LOS
A-DEF
LOS
A-DEF
FIGURE 6-4
56 U S - 2 3 F E A S I B I L I T Y S T U D Y
North SectionS E C T I O NS I X
TABLE 6-4
EXISTING (2007) AM PEAK HOUR LEVEL OF SERVICE MERGE / WEAVE ANALYSIS
2007 Southbound US-23 AM Peak
Fwy.Volume(vph)
RampVolume(vph)
Adj. Ramp NameAdj.
RampVolume
FreewayFlowRate
Ramp FlowRate
Adj.RampFlow
DensityMerge/Diverge
LOS
Lee Road Off Ramp 3,225 475 Lee Road On Ramp 450 3,727 549 520 56.6 D
Lee Road On Ramp 2,750 450 Lee Road Off Ramp 475 3,178 520 549 29.1 D
Silver RoadOff Ramp 3,200 250 Silver Road On
Ramp 300 3,829 282 337 34.9 D
Silver RoadOn Ramp 2,950 300 Silver Road Off
Ramp 250 3,474 338 282 33.5 D
2007 Northbound US-23 AM Peak
Silver RoadOff Ramp 2,000 100 Silver Road On
Ramp 425 2,356 113 479 21.7 C
Silver RoadOn Ramp 1,900 425 Silver Road Off
Ramp 100 2,238 479 113 24.5 C
Lee Road Off Ramp 2,325 375 Lee Road On Ramp 450 2,687 433 520 24.2 C
Lee Road On Ramp 1,950 450 Lee Road Off Ramp 375 2,253 520 433 23.1 C
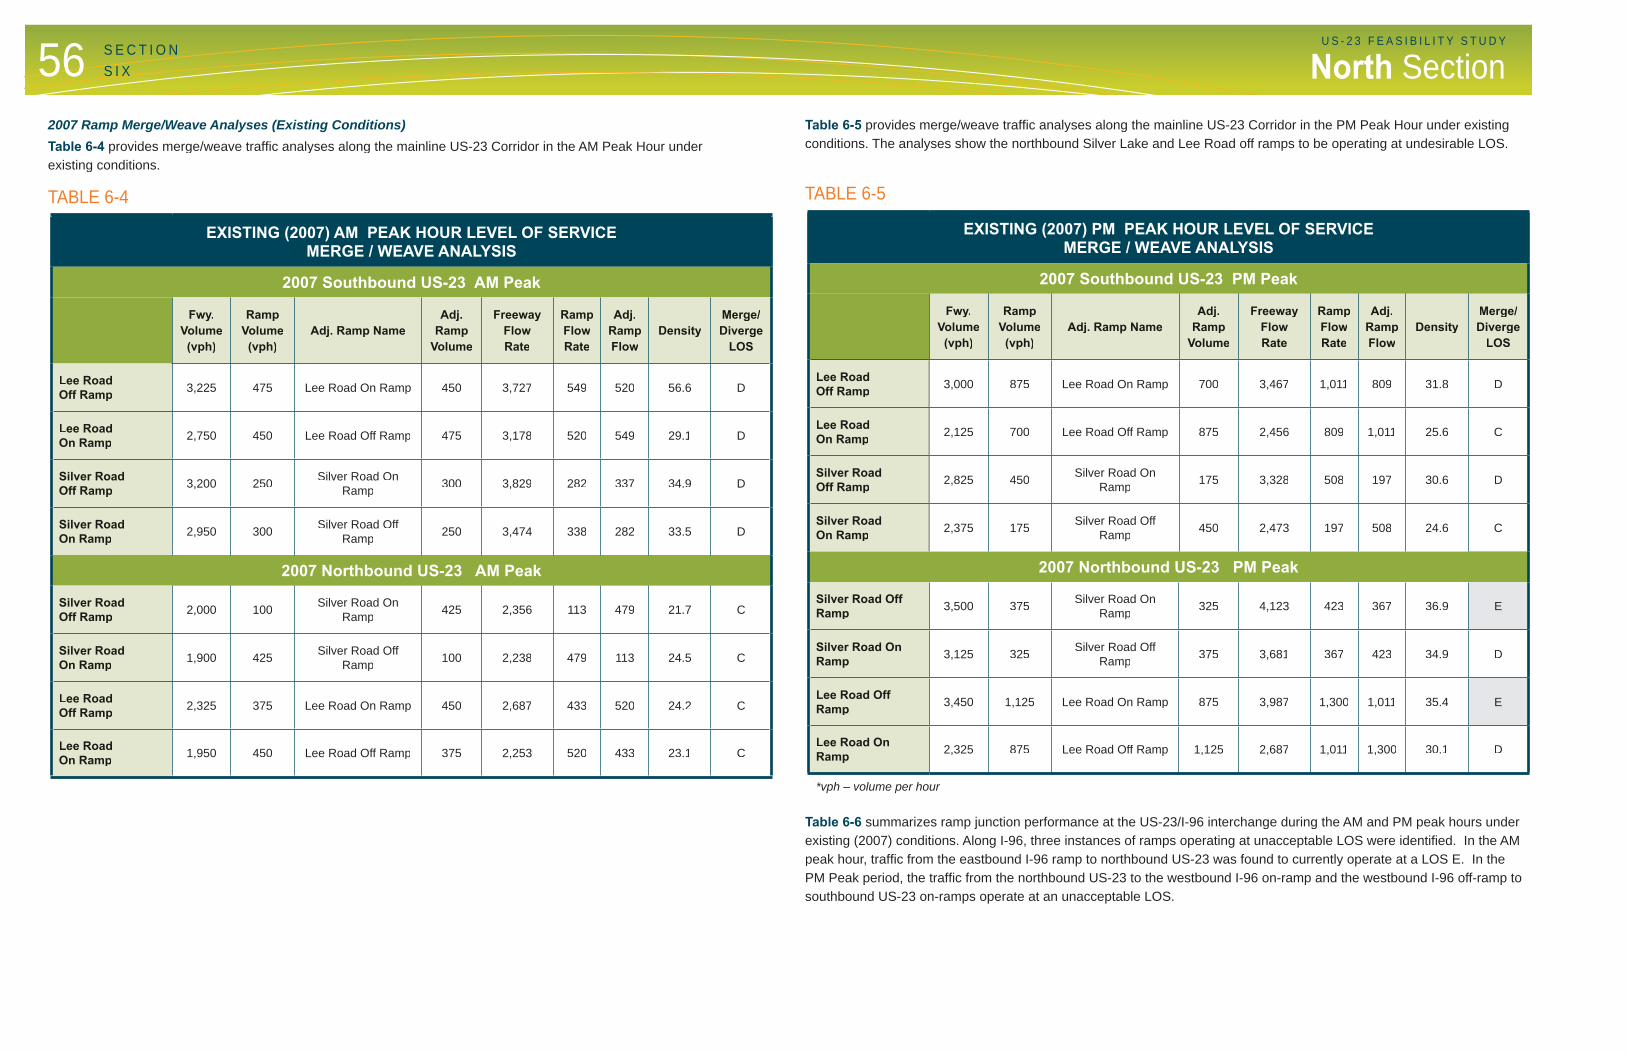
2007 Ramp Merge/Weave Analyses (Existing Conditions)Table 6-4 provides merge/weave traffi c analyses along the mainline US-23 Corridor in the AM Peak Hour under existing conditions.
TABLE 6-5
EXISTING (2007) PM PEAK HOUR LEVEL OF SERVICE MERGE / WEAVE ANALYSIS
2007 Southbound US-23 PM Peak
Fwy.Volume(vph)
RampVolume(vph)
Adj. Ramp NameAdj.
RampVolume
FreewayFlowRate
RampFlowRate
Adj.RampFlow
DensityMerge/Diverge
LOS
Lee RoadOff Ramp 3,000 875 Lee Road On Ramp 700 3,467 1,011 809 31.8 D
Lee RoadOn Ramp 2,125 700 Lee Road Off Ramp 875 2,456 809 1,011 25.6 C
Silver RoadOff Ramp 2,825 450 Silver Road On
Ramp 175 3,328 508 197 30.6 D
Silver RoadOn Ramp 2,375 175 Silver Road Off
Ramp 450 2,473 197 508 24.6 C
2007 Northbound US-23 PM Peak
Silver Road Off Ramp 3,500 375 Silver Road On
Ramp 325 4,123 423 367 36.9 E
Silver Road OnRamp 3,125 325 Silver Road Off
Ramp 375 3,681 367 423 34.9 D
Lee Road Off Ramp 3,450 1,125 Lee Road On Ramp 875 3,987 1,300 1,011 35.4 E
Lee Road OnRamp 2,325 875 Lee Road Off Ramp 1,125 2,687 1,011 1,300 30.1 D
*vph – volume per hour
Table 6-5 provides merge/weave traffi c analyses along the mainline US-23 Corridor in the PM Peak Hour under existingconditions. The analyses show the northbound Silver Lake and Lee Road off ramps to be operating at undesirable LOS.
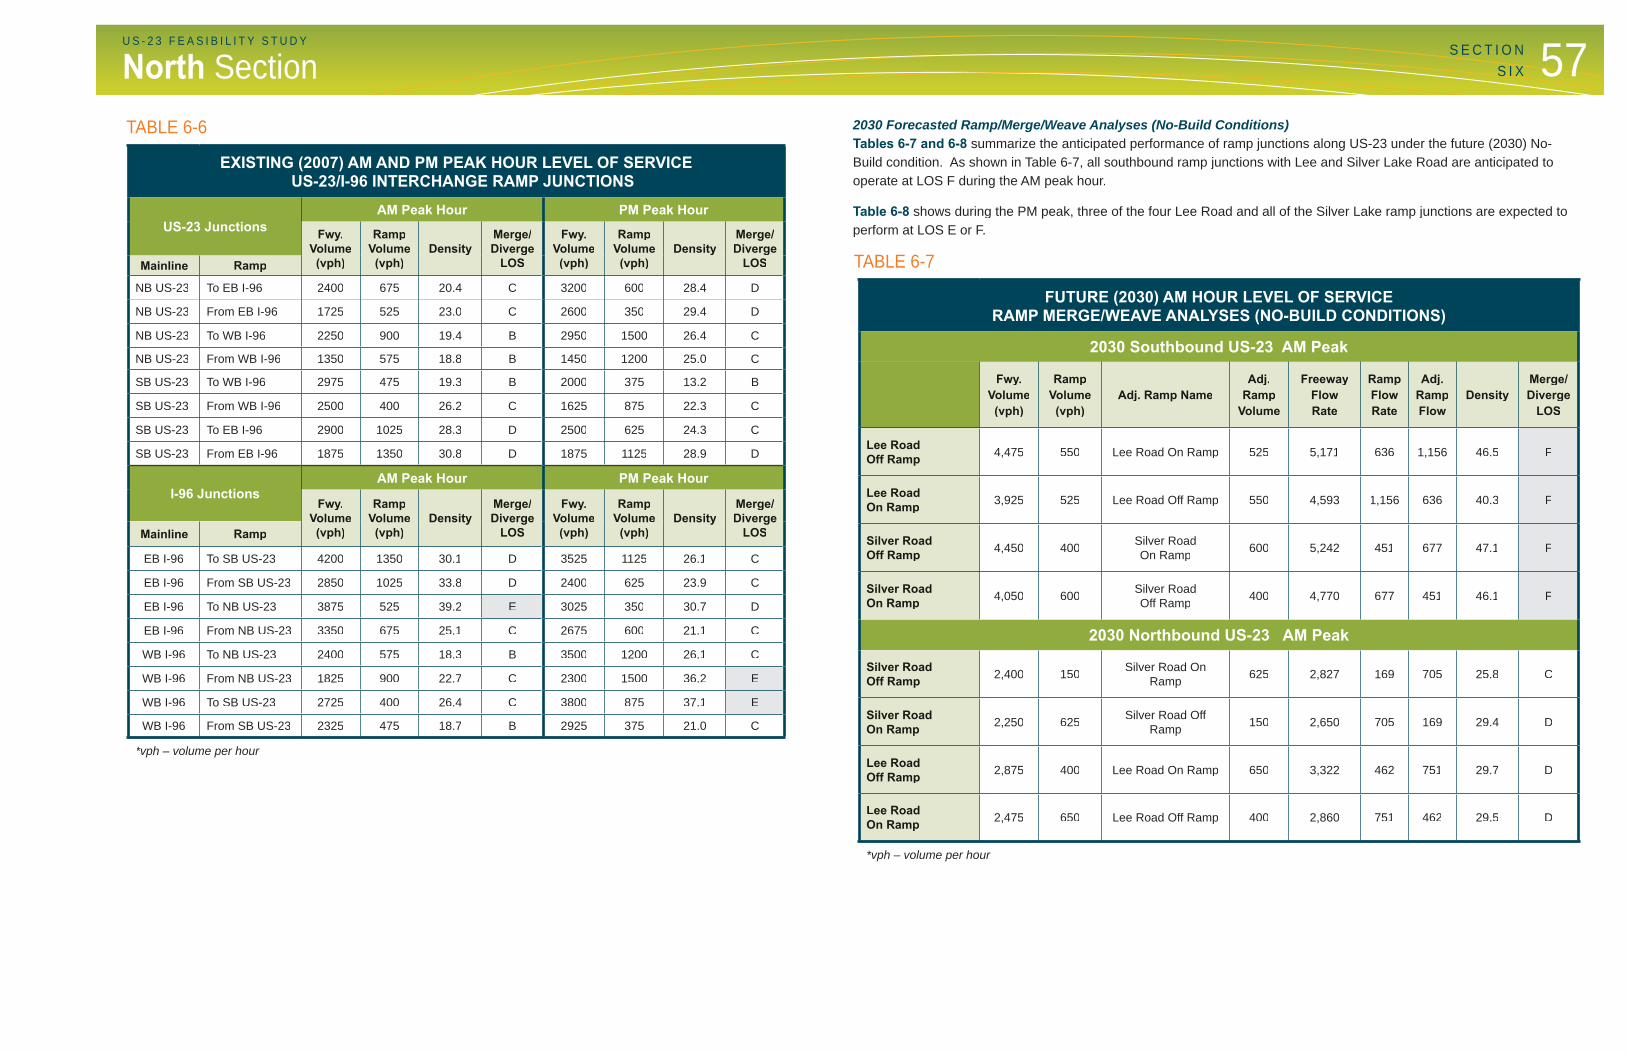
Table 6-6 summarizes ramp junction performance at the US-23/I-96 interchange during the AM and PM peak hours under existing (2007) conditions. Along I-96, three instances of ramps operating at unacceptable LOS were identifi ed. In the AM peak hour, traffi c from the eastbound I-96 ramp to northbound US-23 was found to currently operate at a LOS E. In the PM Peak period, the traffi c from the northbound US-23 to the westbound I-96 on-ramp and the westbound I-96 off-ramp to southbound US-23 on-ramps operate at an unacceptable LOS.
57U S - 2 3 F E A S I B I L I T Y S T U D YS E C T I O N
S I XNorth SectionTABLE 6-6
EXISTING (2007) AM AND PM PEAK HOUR LEVEL OF SERVICE US-23/I-96 INTERCHANGE RAMP JUNCTIONS
US-23 JunctionsAM Peak Hour PM Peak Hour
Fwy.Volume(vph)
RampVolume(vph)
DensityMerge/Diverge
LOS
Fwy.Volume(vph)
RampVolume(vph)
DensityMerge/Diverge
LOSMainline Ramp
NB US-23 To EB I-96 2400 675 20.4 C 3200 600 28.4 D
NB US-23 From EB I-96 1725 525 23.0 C 2600 350 29.4 D
NB US-23 To WB I-96 2250 900 19.4 B 2950 1500 26.4 C
NB US-23 From WB I-96 1350 575 18.8 B 1450 1200 25.0 C
SB US-23 To WB I-96 2975 475 19.3 B 2000 375 13.2 B
SB US-23 From WB I-96 2500 400 26.2 C 1625 875 22.3 C
SB US-23 To EB I-96 2900 1025 28.3 D 2500 625 24.3 C
SB US-23 From EB I-96 1875 1350 30.8 D 1875 1125 28.9 D
I-96 JunctionsAM Peak Hour PM Peak Hour
Fwy.Volume(vph)
RampVolume(vph)
DensityMerge/Diverge
LOS
Fwy.Volume(vph)
RampVolume(vph)
DensityMerge/Diverge
LOSMainline Ramp
EB I-96 To SB US-23 4200 1350 30.1 D 3525 1125 26.1 C
EB I-96 From SB US-23 2850 1025 33.8 D 2400 625 23.9 C
EB I-96 To NB US-23 3875 525 39.2 E 3025 350 30.7 D
EB I-96 From NB US-23 3350 675 25.1 C 2675 600 21.1 C
WB I-96 To NB US-23 2400 575 18.3 B 3500 1200 26.1 C
WB I-96 From NB US-23 1825 900 22.7 C 2300 1500 36.2 E
WB I-96 To SB US-23 2725 400 26.4 C 3800 875 37.1 E
WB I-96 From SB US-23 2325 475 18.7 B 2925 375 21.0 C
*vph – volume per hour
TABLE 6-7
FUTURE (2030) AM HOUR LEVEL OF SERVICERAMP MERGE/WEAVE ANALYSES (NO-BUILD CONDITIONS)
2030 Southbound US-23 AM Peak
Fwy.Volume(vph)
RampVolume(vph)
Adj. Ramp NameAdj.
RampVolume
FreewayFlowRate
Ramp FlowRate
Adj.RampFlow
DensityMerge/Diverge
LOS
Lee Road Off Ramp 4,475 550 Lee Road On Ramp 525 5,171 636 1,156 46.5 F
Lee Road On Ramp 3,925 525 Lee Road Off Ramp 550 4,593 1,156 636 40.3 F
Silver RoadOff Ramp 4,450 400 Silver Road
On Ramp 600 5,242 451 677 47.1 F
Silver RoadOn Ramp 4,050 600 Silver Road
Off Ramp 400 4,770 677 451 46.1 F
2030 Northbound US-23 AM Peak
Silver RoadOff Ramp 2,400 150 Silver Road On
Ramp 625 2,827 169 705 25.8 C
Silver RoadOn Ramp 2,250 625 Silver Road Off
Ramp 150 2,650 705 169 29.4 D
Lee Road Off Ramp 2,875 400 Lee Road On Ramp 650 3,322 462 751 29.7 D
Lee Road On Ramp 2,475 650 Lee Road Off Ramp 400 2,860 751 462 29.5 D
*vph – volume per hour
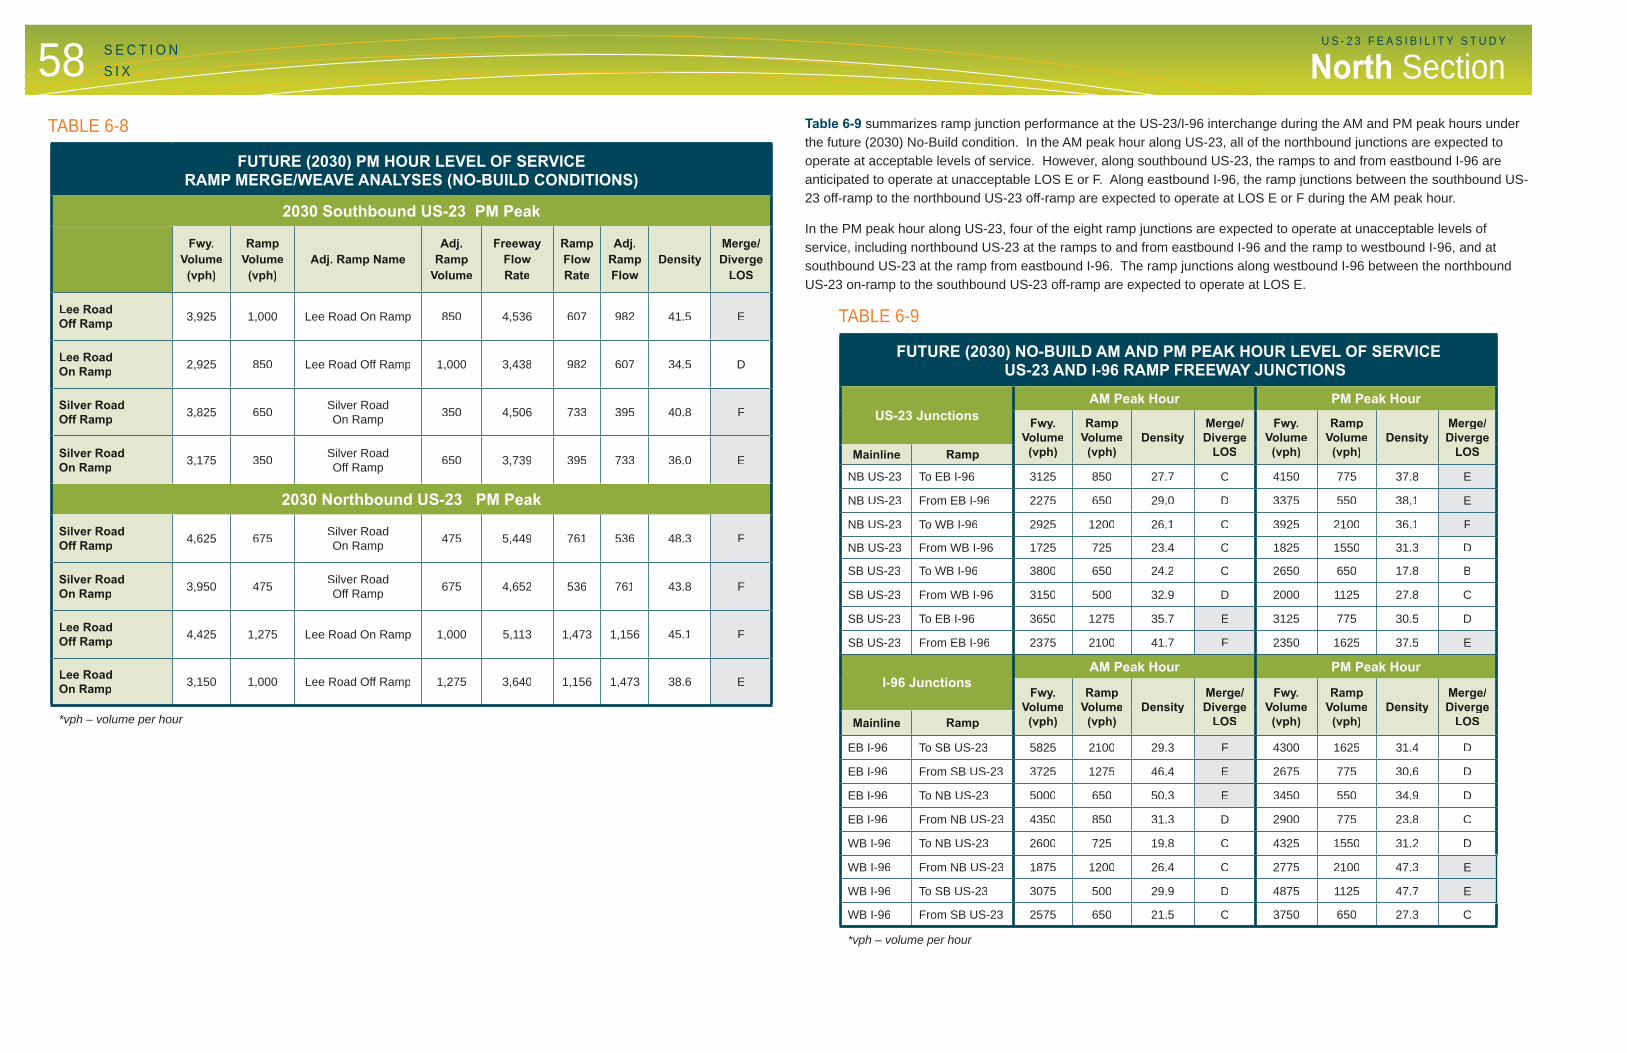
2030 Forecasted Ramp/Merge/Weave Analyses (No-Build Conditions)Tables 6-7 and 6-8 summarize the anticipated performance of ramp junctions along US-23 under the future (2030) No-Build condition. As shown in Table 6-7, all southbound ramp junctions with Lee and Silver Lake Road are anticipated tooperate at LOS F during the AM peak hour.
Table 6-8 shows during the PM peak, three of the four Lee Road and all of the Silver Lake ramp junctions are expected toperform at LOS E or F.
58 U S - 2 3 F E A S I B I L I T Y S T U D Y
North SectionS E C T I O NS I X
TABLE 6-8
FUTURE (2030) PM HOUR LEVEL OF SERVICERAMP MERGE/WEAVE ANALYSES (NO-BUILD CONDITIONS)
2030 Southbound US-23 PM Peak
Fwy.Volume(vph)
RampVolume(vph)
Adj. Ramp NameAdj.
RampVolume
FreewayFlowRate
Ramp FlowRate
Adj.RampFlow
DensityMerge/Diverge
LOS
Lee Road Off Ramp 3,925 1,000 Lee Road On Ramp 850 4,536 607 982 41.5 E
Lee Road On Ramp 2,925 850 Lee Road Off Ramp 1,000 3,438 982 607 34.5 D
Silver RoadOff Ramp 3,825 650 Silver Road
On Ramp 350 4,506 733 395 40.8 F
Silver RoadOn Ramp 3,175 350 Silver Road
Off Ramp 650 3,739 395 733 36.0 E
2030 Northbound US-23 PM Peak
Silver RoadOff Ramp 4,625 675 Silver Road
On Ramp 475 5,449 761 536 48.3 F
Silver RoadOn Ramp 3,950 475 Silver Road
Off Ramp 675 4,652 536 761 43.8 F
Lee Road Off Ramp 4,425 1,275 Lee Road On Ramp 1,000 5,113 1,473 1,156 45.1 F
Lee Road On Ramp 3,150 1,000 Lee Road Off Ramp 1,275 3,640 1,156 1,473 38.6 E
*vph – volume per hour
TABLE 6-9
FUTURE (2030) NO-BUILD AM AND PM PEAK HOUR LEVEL OF SERVICE US-23 AND I-96 RAMP FREEWAY JUNCTIONS
US-23 JunctionsAM Peak Hour PM Peak Hour
Fwy.Volume(vph)
RampVolume(vph)
DensityMerge/Diverge
LOS
Fwy.Volume(vph)
RampVolume(vph)
DensityMerge/Diverge
LOSMainline Ramp
NB US-23 To EB I-96 3125 850 27.7 C 4150 775 37.8 E
NB US-23 From EB I-96 2275 650 29.0 D 3375 550 38.1 E
NB US-23 To WB I-96 2925 1200 26.1 C 3925 2100 36.1 F
NB US-23 From WB I-96 1725 725 23.4 C 1825 1550 31.3 D
SB US-23 To WB I-96 3800 650 24.2 C 2650 650 17.8 B
SB US-23 From WB I-96 3150 500 32.9 D 2000 1125 27.8 C
SB US-23 To EB I-96 3650 1275 35.7 E 3125 775 30.5 D
SB US-23 From EB I-96 2375 2100 41.7 F 2350 1625 37.5 E
I-96 JunctionsAM Peak Hour PM Peak Hour
Fwy.Volume(vph)
RampVolume(vph)
DensityMerge/Diverge
LOS
Fwy.Volume(vph)
RampVolume(vph)
DensityMerge/Diverge
LOSMainline Ramp
EB I-96 To SB US-23 5825 2100 29.3 F 4300 1625 31.4 D
EB I-96 From SB US-23 3725 1275 46.4 E 2675 775 30.6 D
EB I-96 To NB US-23 5000 650 50.3 E 3450 550 34.9 D
EB I-96 From NB US-23 4350 850 31.3 D 2900 775 23.8 C
WB I-96 To NB US-23 2600 725 19.8 C 4325 1550 31.2 D
WB I-96 From NB US-23 1875 1200 26.4 C 2775 2100 47.3 E
WB I-96 To SB US-23 3075 500 29.9 D 4875 1125 47.7 E
WB I-96 From SB US-23 2575 650 21.5 C 3750 650 27.3 C
*vph – volume per hour
Table 6-9 summarizes ramp junction performance at the US-23/I-96 interchange during the AM and PM peak hours under the future (2030) No-Build condition. In the AM peak hour along US-23, all of the northbound junctions are expected to operate at acceptable levels of service. However, along southbound US-23, the ramps to and from eastbound I-96 areanticipated to operate at unacceptable LOS E or F. Along eastbound I-96, the ramp junctions between the southbound US-23 off-ramp to the northbound US-23 off-ramp are expected to operate at LOS E or F during the AM peak hour.
In the PM peak hour along US-23, four of the eight ramp junctions are expected to operate at unacceptable levels of service, including northbound US-23 at the ramps to and from eastbound I-96 and the ramp to westbound I-96, and atsouthbound US-23 at the ramp from eastbound I-96. The ramp junctions along westbound I-96 between the northbound US-23 on-ramp to the southbound US-23 off-ramp are expected to operate at LOS E.
59U S - 2 3 F E A S I B I L I T Y S T U D YS E C T I O N
S I XNorth Section
TABLE 6-10
US-23 CRASH TYPESNORTH SEGMENT
3/2005-3/2008Crash Type Count
Misc. 1 Vehicle 45
Overturn 16
Fixed Object 90
Other Object 17
Animal 44
Angle Straight 13
Rear-End Straight 335
Side Swipe Same 68
Other 9
Total 640
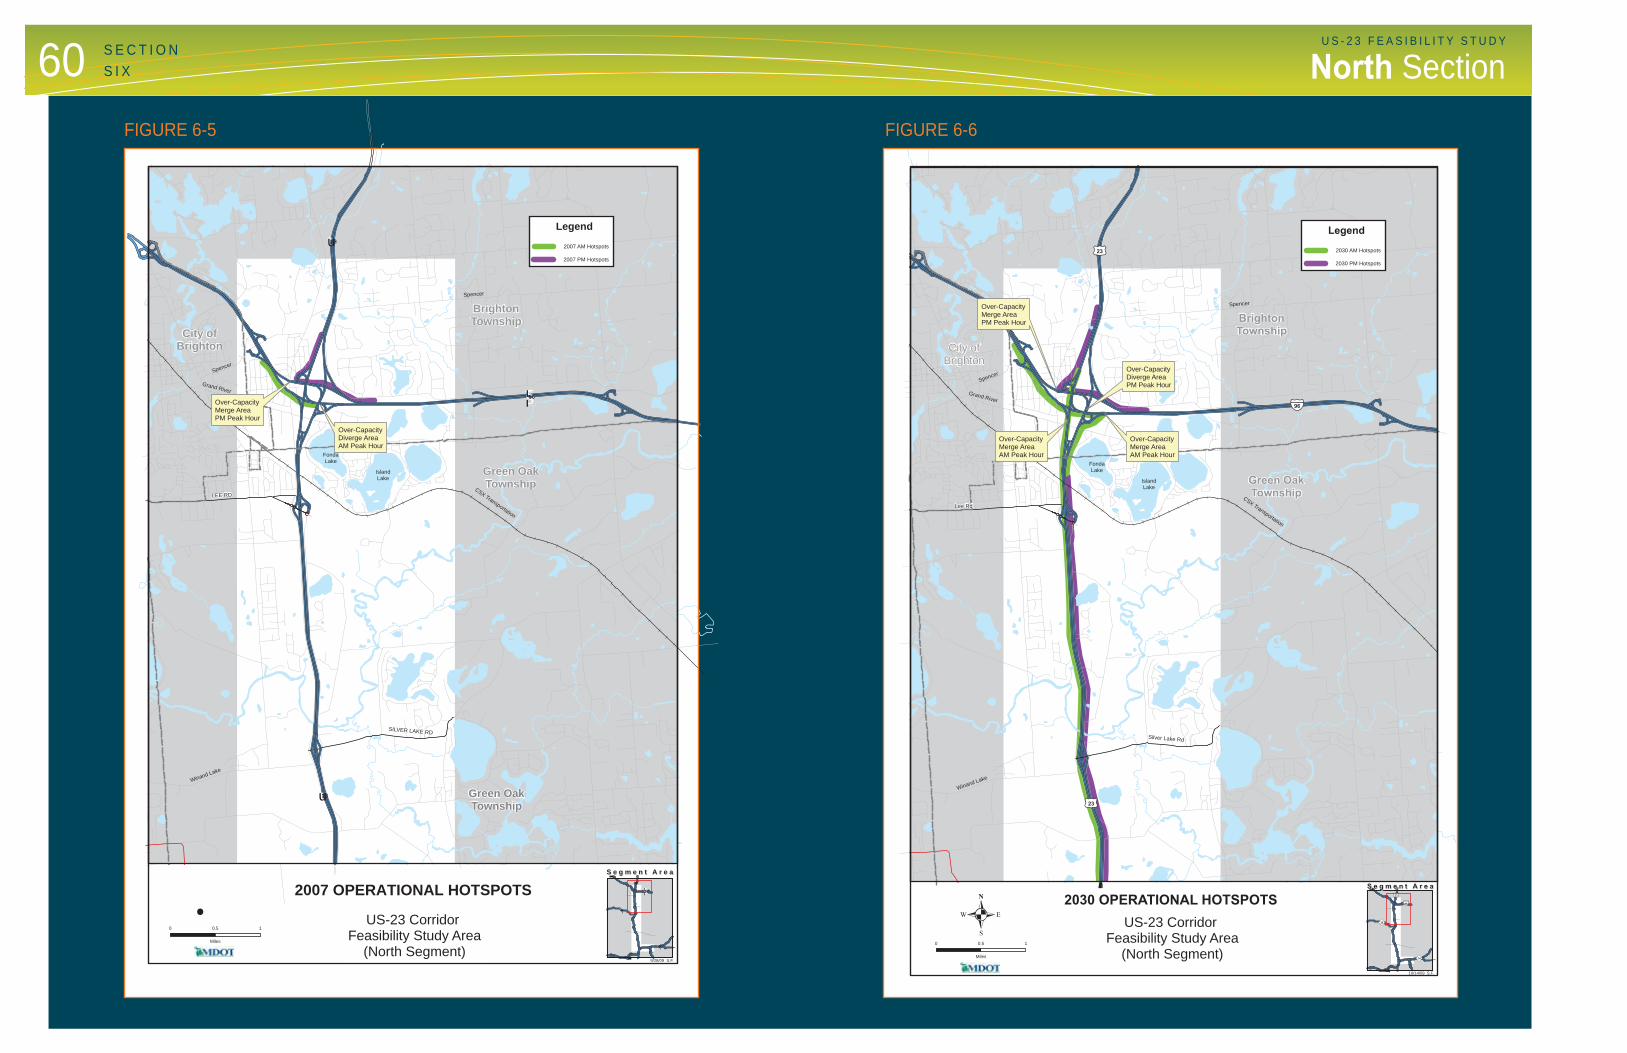
Figure 6-5: 2007 Operational Hotspots and Figure 6-6: 2030 Operational Hotspots provides a summaryof the primary traffi c/operational concerns for each of the interchanges along the North Segment for 2007 Base Year and 2030 Future Year conditions. The 2007 Base Year and 2030 Future Year AM and PM Peak Hour traffi c and Level of Service schematics for the each interchanges in the North Segment and I-96/US-23 are located at the end of this section. (Figures 6-10 through 6-14) These No-Build schematics include detailed turning movements atthe interchange termini and analyses of selected adjacentroads’ intersections.
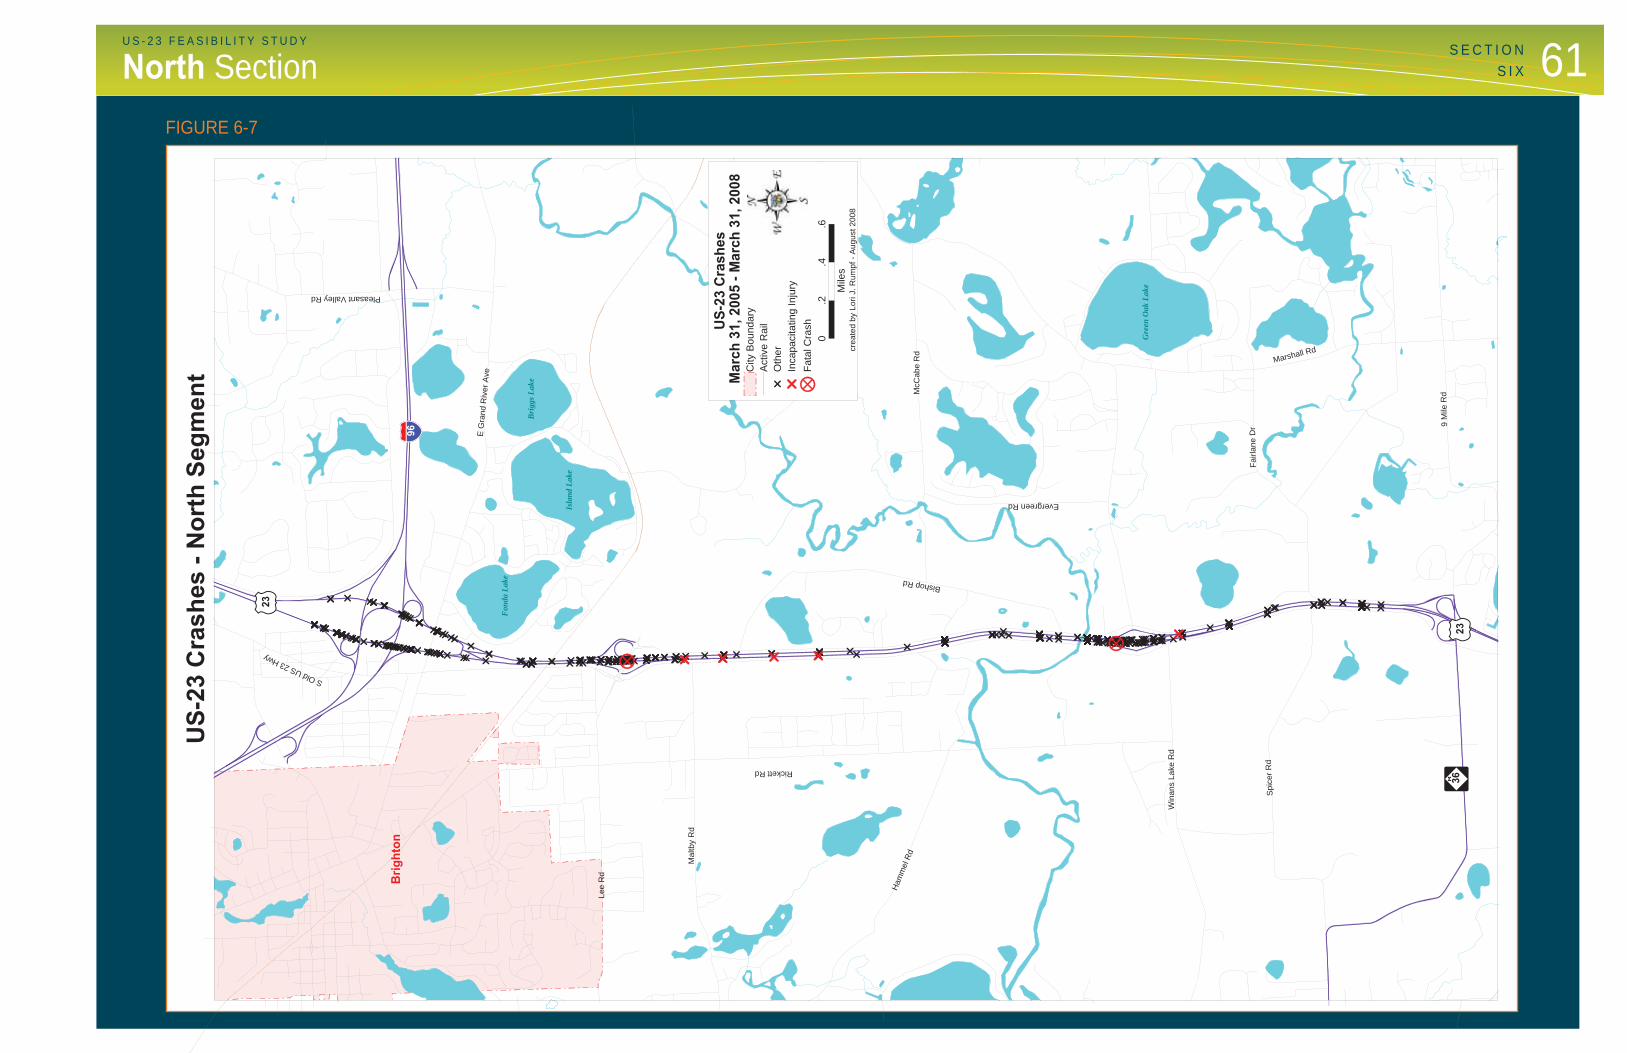
SafetyTable 6-10 provides crash data covering the NorthSegment between March 2005 and March 2008. Crashestotal 640 and are broken down into nine categories as shown in the table. The most common crash type is theRear-End Straight totaling 335 crashes, 52 percent of the total. Just under 60 percent of the crashes took place during the hours of darkness, and in icy or wet conditions. There were three fatalities and 147 injuries during thisthree-year period.
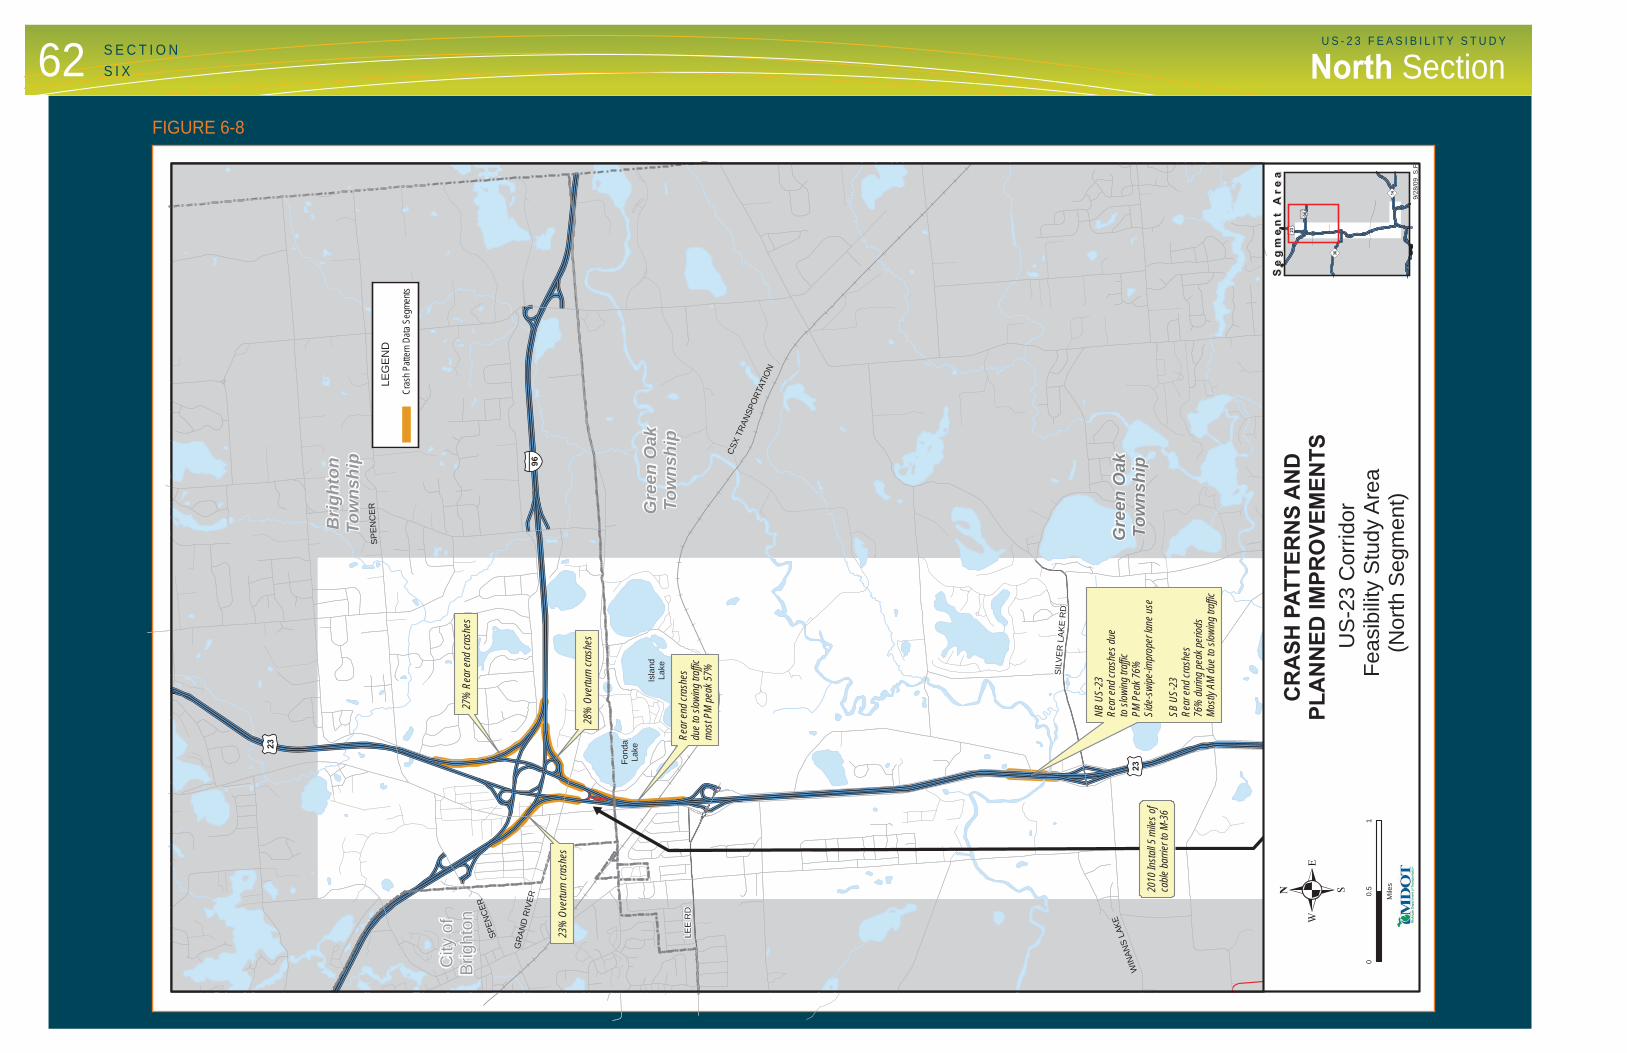
Figure 6-7: Crashes North Segment distinguishes the incapacitating injuries and fatalities from the remainingcrashes by location in the north segment. Figure 6-8: Crash Patterns and Planned Improvements provides crash patterns and planned improvements along thenorth segment.
MobilityUnder existing conditions, there is no fi xed-route transitservice offered along this segment of the US-23 corridor,or on nearby collector roadways. Livingston EssentialTransportation Service (LETS) does offer demand-responsive para-transit services in the vicinity, although these services do not play a signifi cant role in supportingtravel along the corridor itself.
MDOT operates and maintains four carpool lots alongor within the vicinity of the North Segment: one is locatedat the US-23/Silver Lake Road interchange, one at theUS-23/Lee Road interchange, and two located at theI-96/Spencer Road interchange. The Silver Lake Road lot is a gravel surface with 50 parking spaces. At Lee Road, a new paved lot was recently constructed as part of an interchange improvement project, which includes144 spaces.
P O T E N T I A L E N V I R O N M E N TA L I M PA C T S A N D A S S O C I AT E D C O N S T R A I N T S
The potential environmental constraints within the North Segment of the project study area include 4(f) and 6(f)concerns at the Island Lake Recreation Area; this isonly a concern if additional ROW is required. There arenumerous wetlands located in this segment of the studyarea. A Part 303 permit from the Michigan Departmentof Environmental Quality (MDEQ) will be required, aswell as, wetland mitigation if there is any loss of wetland area. Additionally, there may be “no work” dates during the breeding season from March 1st through May 31st for any work within the Huron River or Horseshoe Lake Drain. Figure 6-9: Constraints Map shows the Constraints Mapfor the North Segment.
60 U S - 2 3 F E A S I B I L I T Y S T U D YS E C T I O NS I X North Section
§̈¦B S
96
tu23
LEE RD
tu23
BrightonTownship
CSX Transportation
Winand Lake
FondaLake
IslandLake
Spencer
Grand River
Spencer
City ofBrighton
Green OakTownship
Green OakTownship
Over-CapacityMerge AreaPM Peak Hour
Over-CapacityDiverge AreaAM Peak Hour
SILVER LAKE RD
10 0.5
Miles
.
2007 AM Hotspots
Legend
2007 PM Hotspots
2007 OPERATIONAL HOTSPOTS
")36
§̈¦96
tu23
")14
S e g m e n t A r e aS e g m e n t A r e a
9/28/09 S.F.
US-23 Corridor Feasibility Study Area
(North Segment)
§̈¦96
tu23
Lee Rd
Silver Lake Rd
tu23
BrightonTownship
CSX Transportation
Winand Lake
FondaLake
IslandLake
Spencer
Grand River
Spencer
City ofBrighton
Green OakTownship
Over-CapacityMerge AreaPM Peak Hour
Over-CapacityDiverge AreaPM Peak Hour
Over-CapacityMerge AreaAM Peak Hour
Over-CapacityMerge AreaAM Peak Hour
0 10.5
Miles
.2030 OPERATIONAL HOTSPOTS
2030 AM Hotspots
Legend
2030 PM Hotspots
10/14/09 S.F.
US-23 Corridor Feasibility Study Area
(North Segment)
")36
§̈¦96
tu23
")14
S e g m e n t A r e aS e g m e n t A r e a
FIGURE 6-5 FIGURE 6-6
61U S - 2 3 F E A S I B I L I T Y S T U D Y
North SectionS E C T I O N
S I X
Brig
hton
96
Ham
mel
Rd
Evergreen Rd
BishopRd
Spi
cerR
d
Win
ans
Lake
Rd
36
Mal
tby
Rd
EG
rand
Riv
erA
ve
Marshall Rd
Rickett Rd
9M
ileR
dMcC
abe
Rd
Pleasant Valley Rd
Fairl
ane
Dr
S Old US23 Hwy
Lee
Rd
23
23
Gre
en O
ak L
ake
Isla
nd L
ake
Fon
da L
ake
Bri
ggs L
ake
US-
23 C
rash
es
0.2
.4.6
Mile
scr
eate
d by
Lor
i J. R
umpf
- A
ugus
t 200
8
Mar
ch 3
1, 2
005
- Mar
ch 3
1, 2
008
City
Bou
ndar
yA
ctiv
e R
ail
Oth
erIn
capa
cita
ting
Inju
ryFa
tal C
rash
US-
23 C
rash
es -
Nor
th S
egm
ent
FIGURE 6-7
62 U S - 2 3 F E A S I B I L I T Y S T U D Y
North SectionS E C T I O NS I X
LEE
RD
SILV
ER
LAKE
RD
Brig
hton
Tow
nshi
p CSX
TRAN
SPO
RTAT
ION
WIN
ANS
LAKE
Fond
aLa
ke
Isla
ndLa
ke
SPE
NC
ER
GR
AND
RIV
ER
SPEN
CER
City
of
Brig
hton
Gre
en O
akTo
wns
hip
Gre
en O
akTo
wns
hip
2010
Insta
ll 5 m
iles o
fca
ble b
arrie
r to
M-36
NB U
S-23
Rear
end
cras
hes d
ueto
slow
ing tr
affic
PM P
eak 7
6%Si
de-s
wipe
-impr
oper
lane
use
SB U
S-23
Rear
end
cras
hes
76%
durin
g pe
ak p
eriod
sM
ostly
AM
due
to sl
owing
traff
ic
Rear
end
cras
hes
due
to sl
owing
traff
icmo
st PM
pea
k 57%
23%
Ove
rturn
cras
hes
27%
Rea
r end
cras
hes
28%
Ove
rturn
cras
hes
§̈ ¦96
t u23
t u23
#
")36
§̈ ¦96t u2
3
")14
Se
gm
en
t A
rea
Se
gm
en
t A
rea
01
0.5
Mile
s.9/
28/0
9 S
.F.
Cras
h Patt
ern D
ata S
egme
nts
LEG
END
US
-23
Cor
ridor
Fe
asib
ility
Stu
dy A
rea
(Nor
th S
egm
ent)
CR
ASH
PAT
TER
NS
AN
DPL
AN
NED
IMPR
OVE
MEN
TS
FIGURE 6-8

63U S - 2 3 F E A S I B I L I T Y S T U D YS E C T I O N
S I XNorth Section
t u23
LEE
RD
Silv
erLa
keR
d
t u23
Brig
hton
Tow
nshi
p
CSXTr
ansp
orta
tion
WIN
AND
LAKE
Fond
aLa
ke
Isla
ndLa
ke
SPE
NC
ER
GR
AND
RIV
ER
SPEN
CER
City
of
Brig
hton
Gre
en O
akTo
wns
hip
§̈ ¦96
§̈ ¦96
t u23
")14
")36
Se
gm
en
t A
rea
Se
gm
en
t A
rea
8/3/
09 S
.F.
01
0.5
Mile
s.
Lege
nd
GFLe
akin
g U
nder
grou
nd S
tora
ge T
anks
Fore
sted
Wet
land
Farm
land
Lake
s, R
iver
s an
d St
ream
s
!G
roun
dwat
er C
onta
min
ated
& C
lean
up
Pote
ntia
l His
toric
Are
a
Stat
e R
ecre
atio
n A
rea
Proj
ect A
rea
ENVI
RO
NM
ENTA
L C
ON
STR
AIN
TSU
S-2
3 C
orrid
or
Feas
ibilit
y S
tudy
Are
a(N
orth
Seg
men
t)
FIGURE 6-9
64 U S - 2 3 F E A S I B I L I T Y S T U D Y
North SectionS E C T I O NS I X
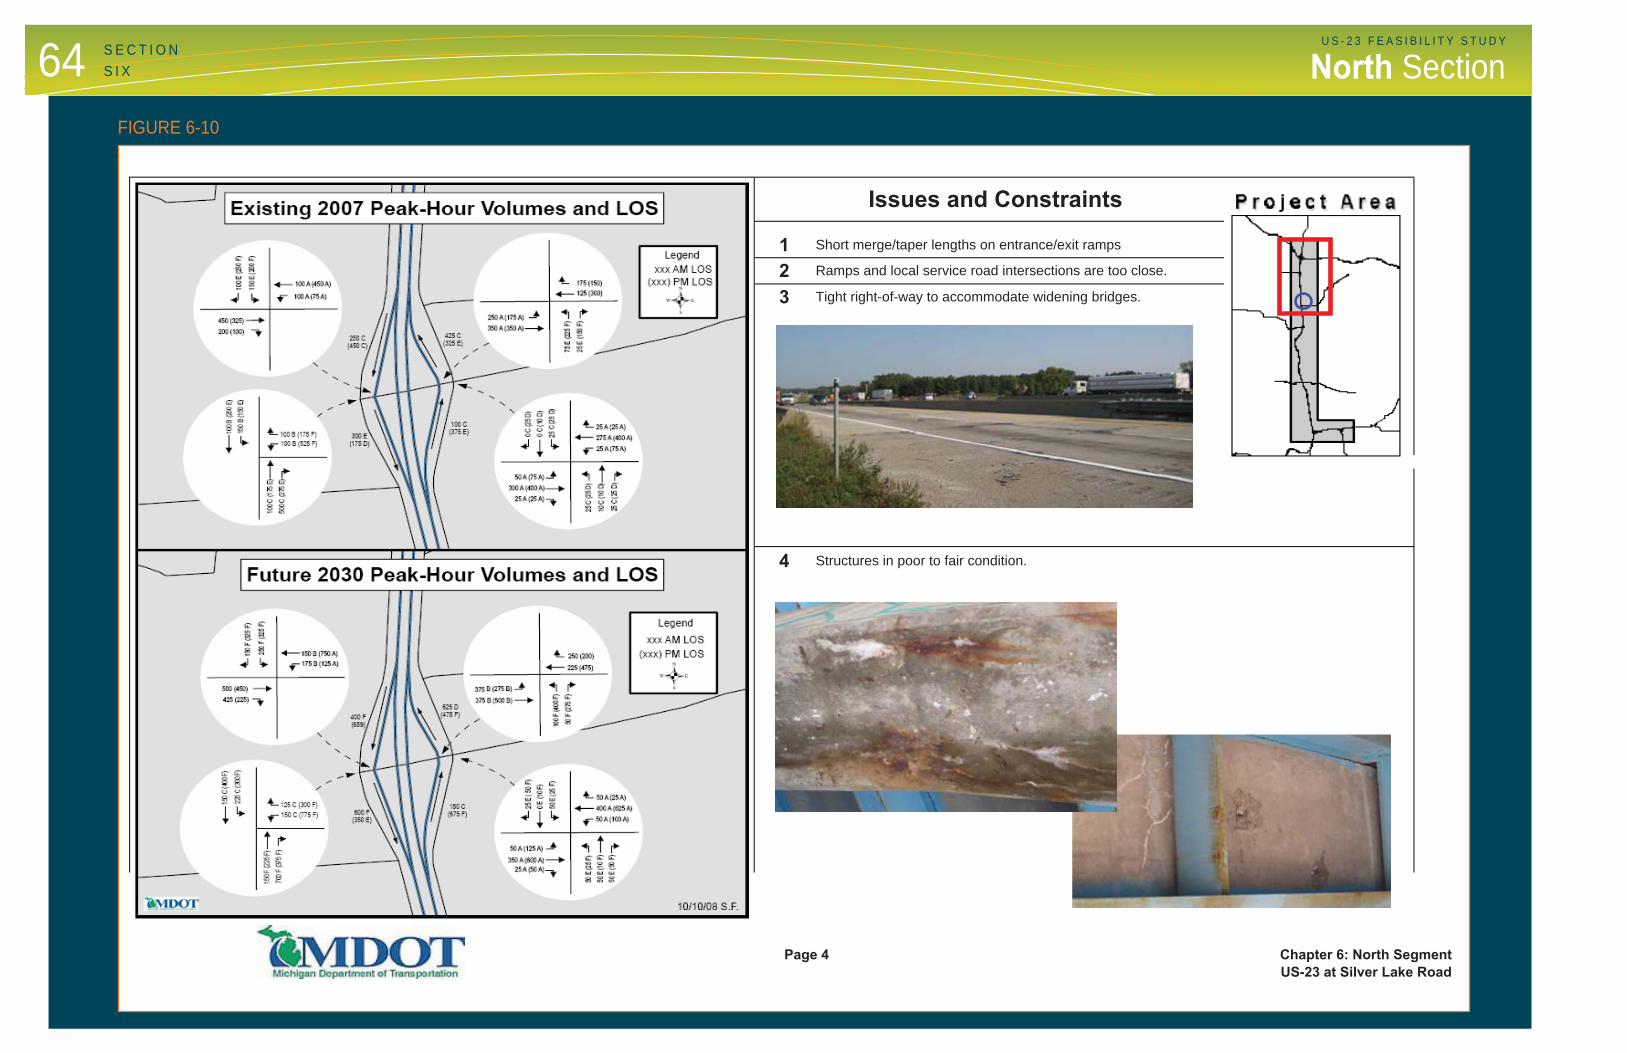
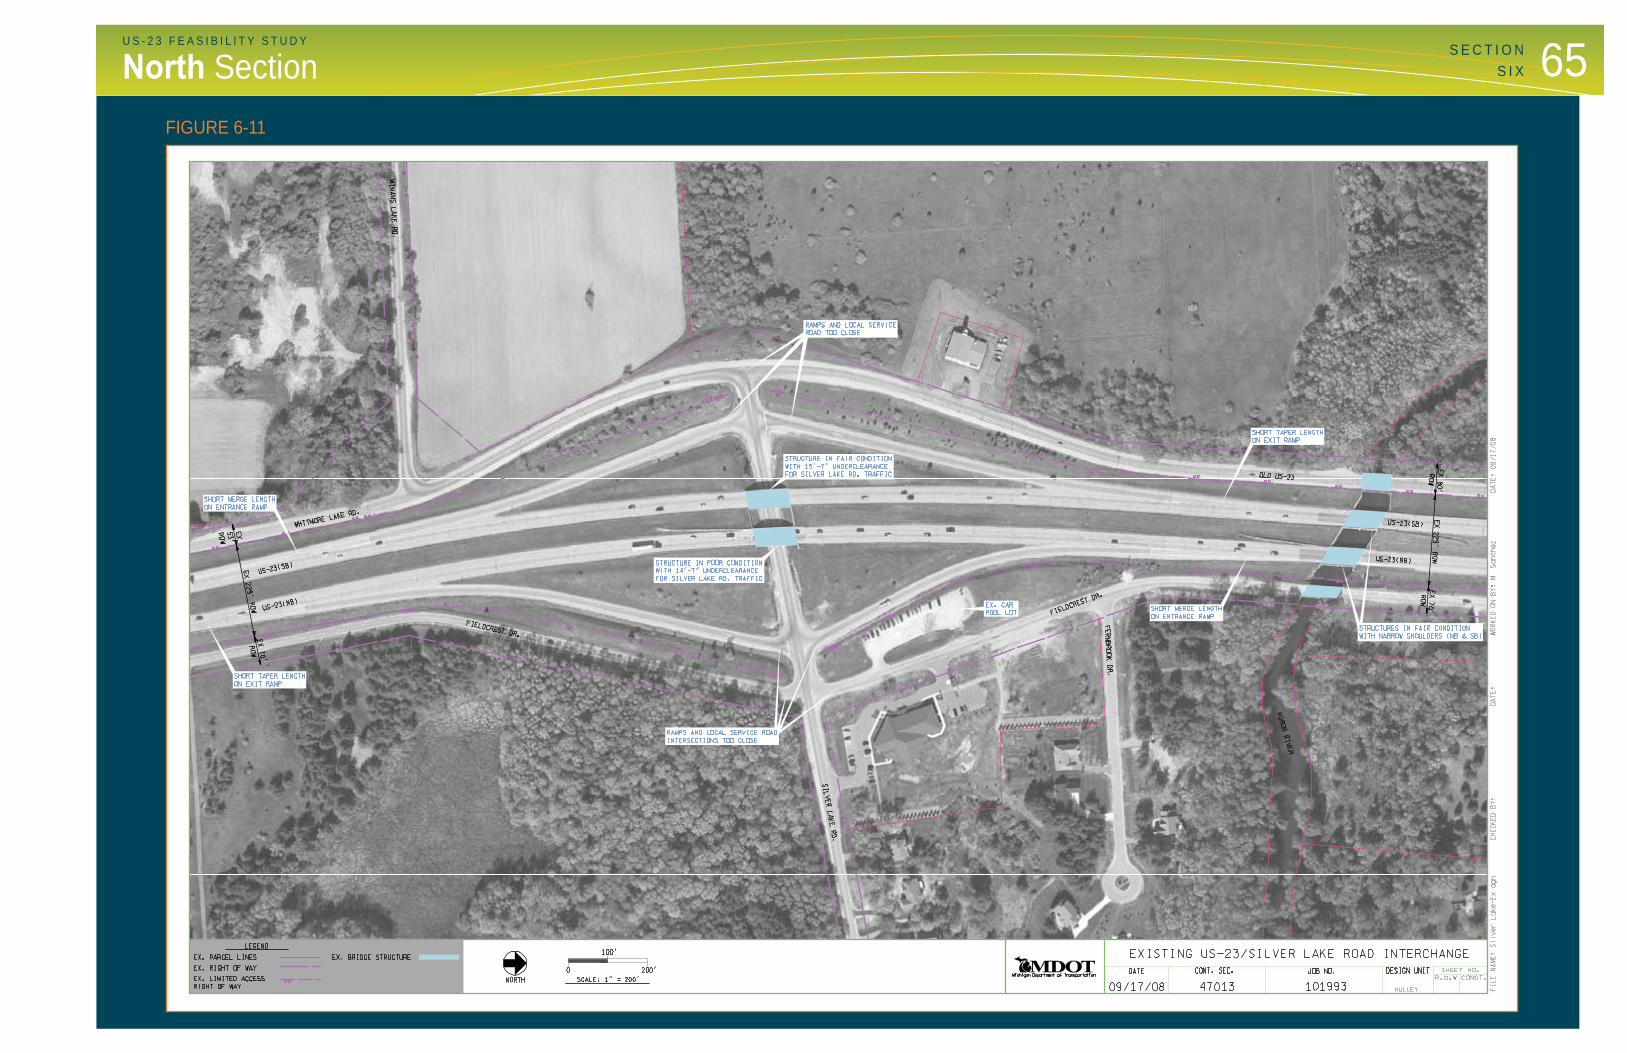
3Ramps and local service road intersections are too close.
Issues and Constraints
2Short merge/taper lengths on entrance/exit ramps
4 Structures in poor to fair condition.
Tight right-of-way to accommodate widening bridges.
1
Page 4 Chapter 6: North SegmentUS-23 at Silver Lake Road
FIGURE 6-10
65U S - 2 3 F E A S I B I L I T Y S T U D YS E C T I O N
S I XNorth SectionFIGURE 6-11
66 U S - 2 3 F E A S I B I L I T Y S T U D Y
North SectionS E C T I O NS I X
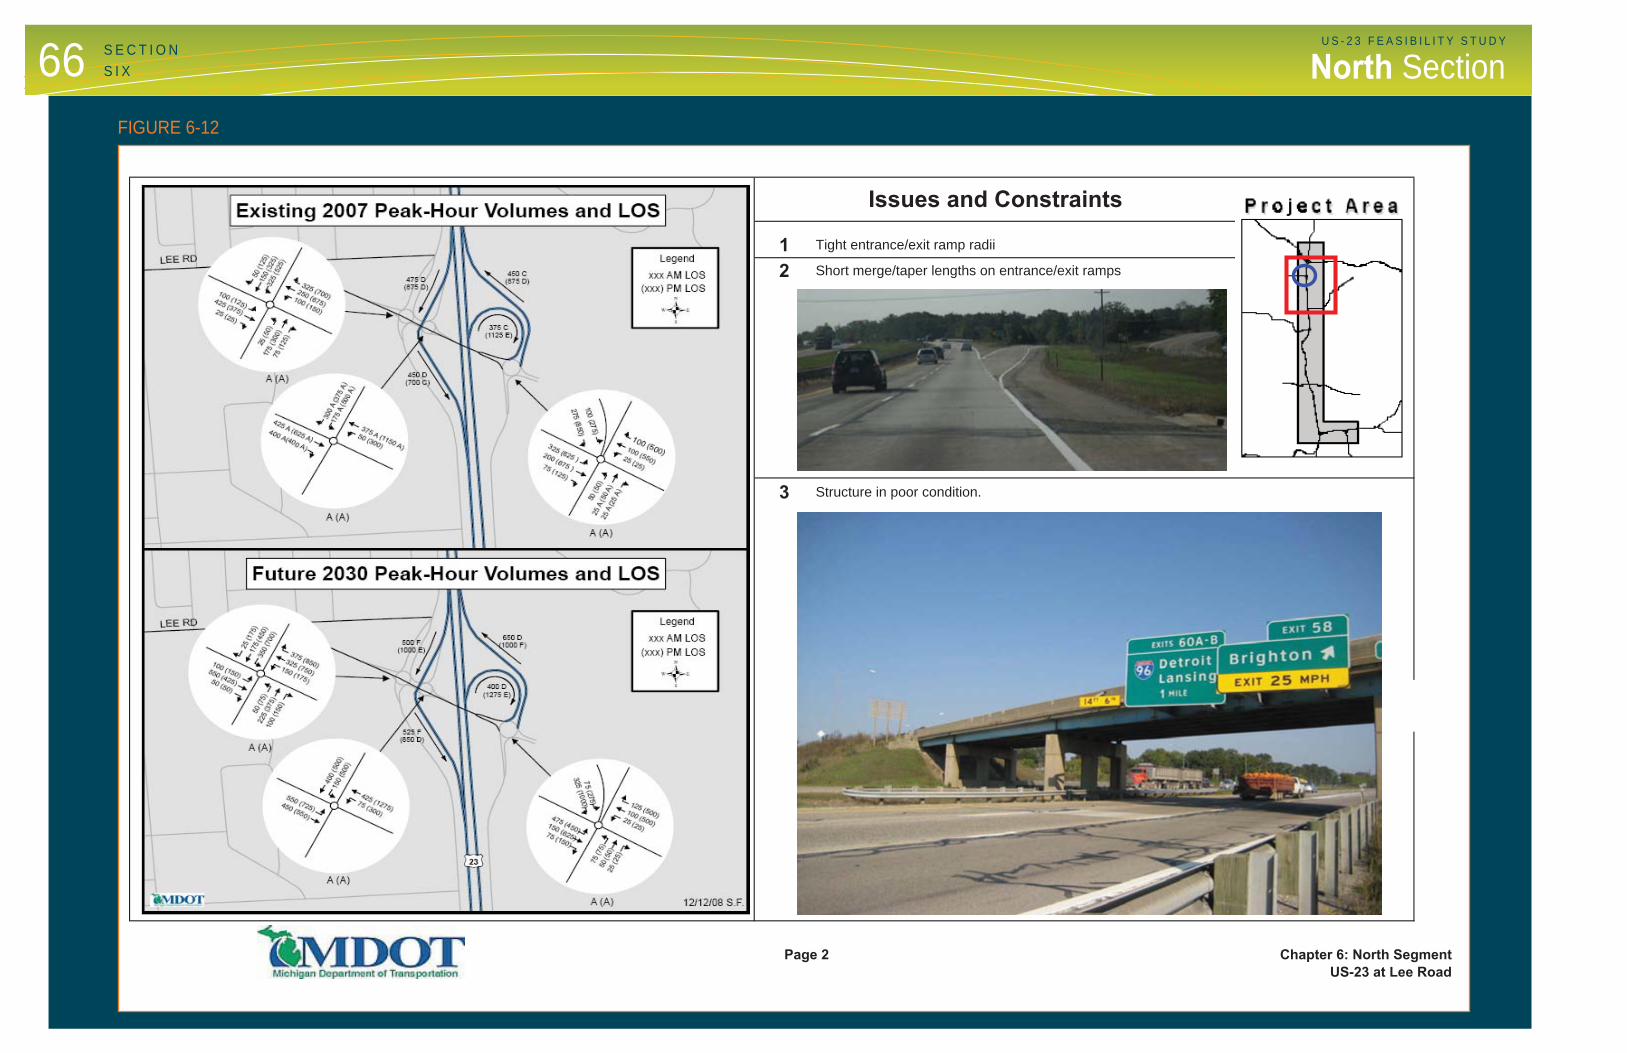
Issues and Constraints
2 Short merge/taper lengths on entrance/exit ramps
3 Structure in poor condition.
Tight entrance/exit ramp radii1
Page 2 Chapter 6: North SegmentUS-23 at Lee Road
FIGURE 6-12

67U S - 2 3 F E A S I B I L I T Y S T U D YS E C T I O N
S I XNorth SectionFIGURE 6-13
68 U S - 2 3 F E A S I B I L I T Y S T U D Y
North SectionS E C T I O NS I X
400
(875
)
525
(350
)
475
(375
)
575
(120
0)
1025
(625
)
1350
(112
5)
900
(150
0)
675
(600
)
t u23
§̈ ¦BS 96
500
(112
5)
650
(550
)
650
(650
)
725
(155
0)
1275
(775
)12
00(2
100)
2100
(162
5)
850
(775
)
§̈ ¦BS 96
t u23
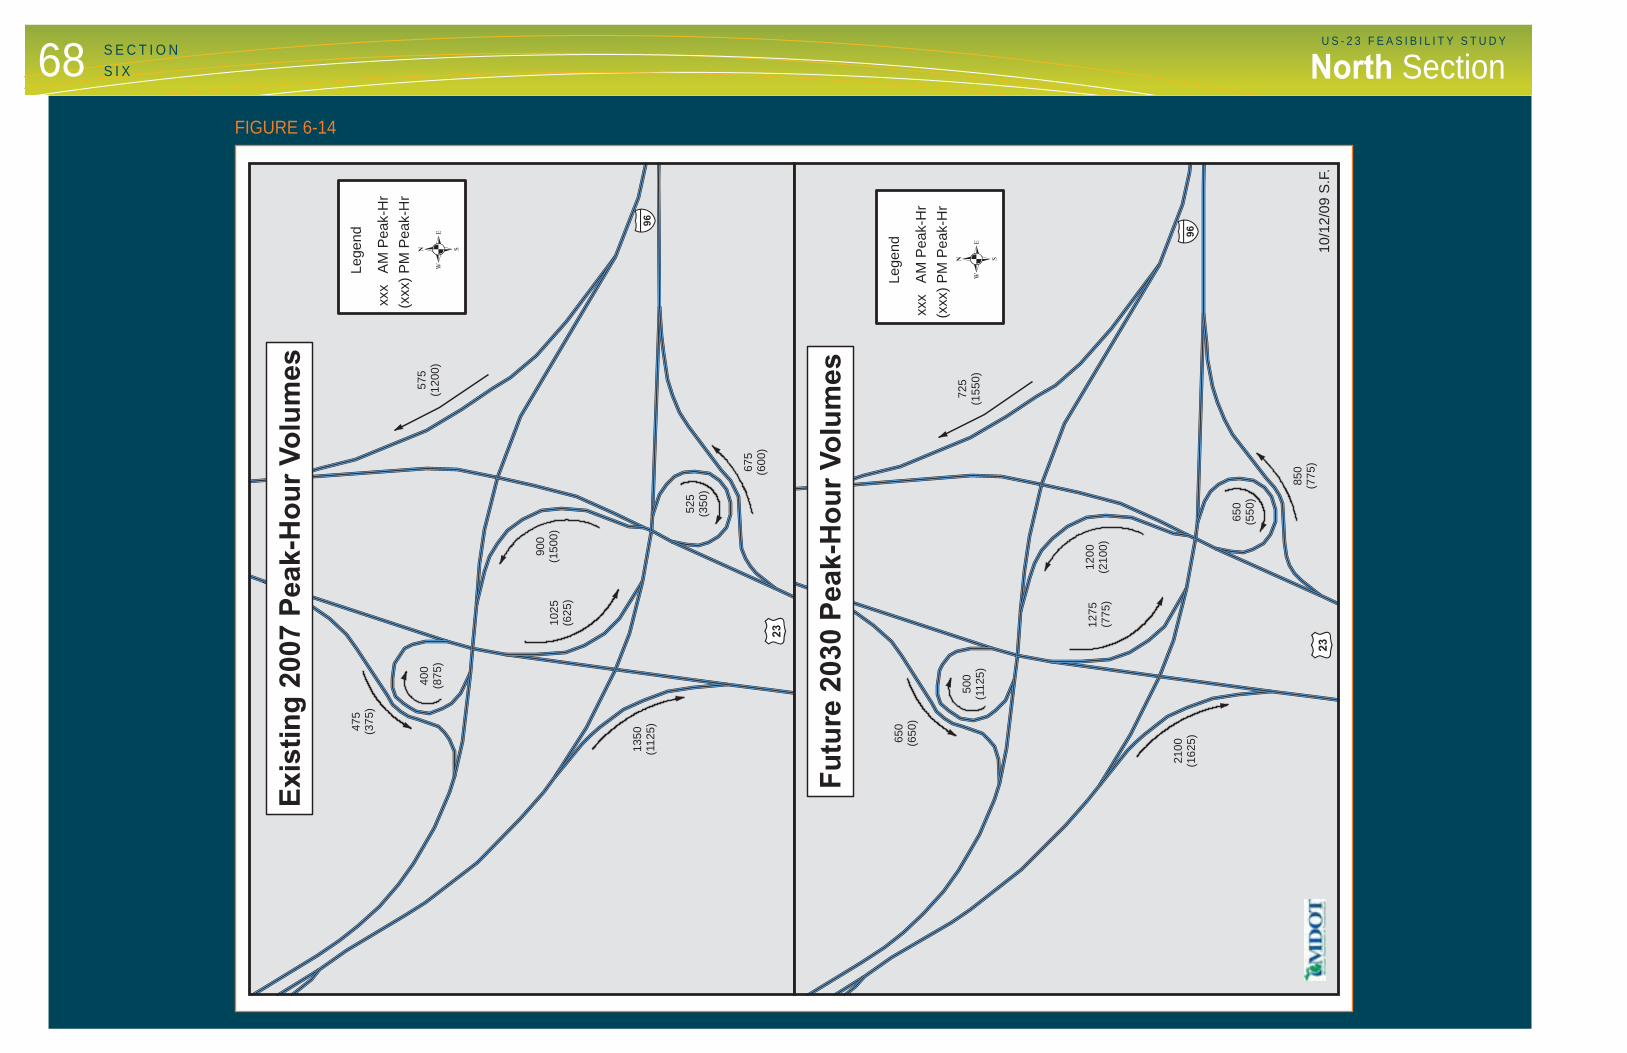
Exis
ting
2007
Pea
k-H
our V
olum
es
Futu
re 2
030
Peak
-Hou
r Vol
umes
10/1
2/09
S.F
.
Lege
nd
xxx
AM
Pea
k-H
r(x
xx) P
M P
eak-
Hr
.
Lege
nd
xxx
AM
Pea
k-H
r(x
xx) P
M P
eak-
Hr
.
FIGURE 6-14
This page intentionally left blank


![[4122] - Reinforced Concrete Frame Connections Rehabilitated by Jacketing.pdf](https://img.dokumen.tips/doc/110x75/55cf8e06550346703b8dbe4b/4122-reinforced-concrete-frame-connections-rehabilitated-by-jacketingpdf.jpg)