Embed Size (px)
DESCRIPTION
50 Most Important Marketing Charts of 2014
Citation preview
50 Charts on the Future of Marketing and Technology
What is the future of marketing?
Marketing is in transition. Technology has transformed the way we communicate, stay informed, and make buying decisions. Smart marketers know they have to stay abreast the rapidly changing landscape in order to be effective. In this collection, experts at Percolate have curated 50 charts that analyze key trends, insights, and perspectives on how marketing has changed and the future of the enterprise. !
Spanning five sections: mobile, social, global, content, and general marketing technology, each chart tells an important story about how the world has changed and how we can prepare for the future. !From the growth of smartphones in China to the $30B gap in advertising to the rise of image sharing on mobile messaging services, this collection is bound to offer actionable insights for marketers of all types.
Mobile
Dig
ital I
nfor
mat
ion
Cre
ated
& S
hare
d (z
etta
byte
s)
0
1
2
3
4
5
6
7
8
2005 2007 2009 2011 2013 2015E
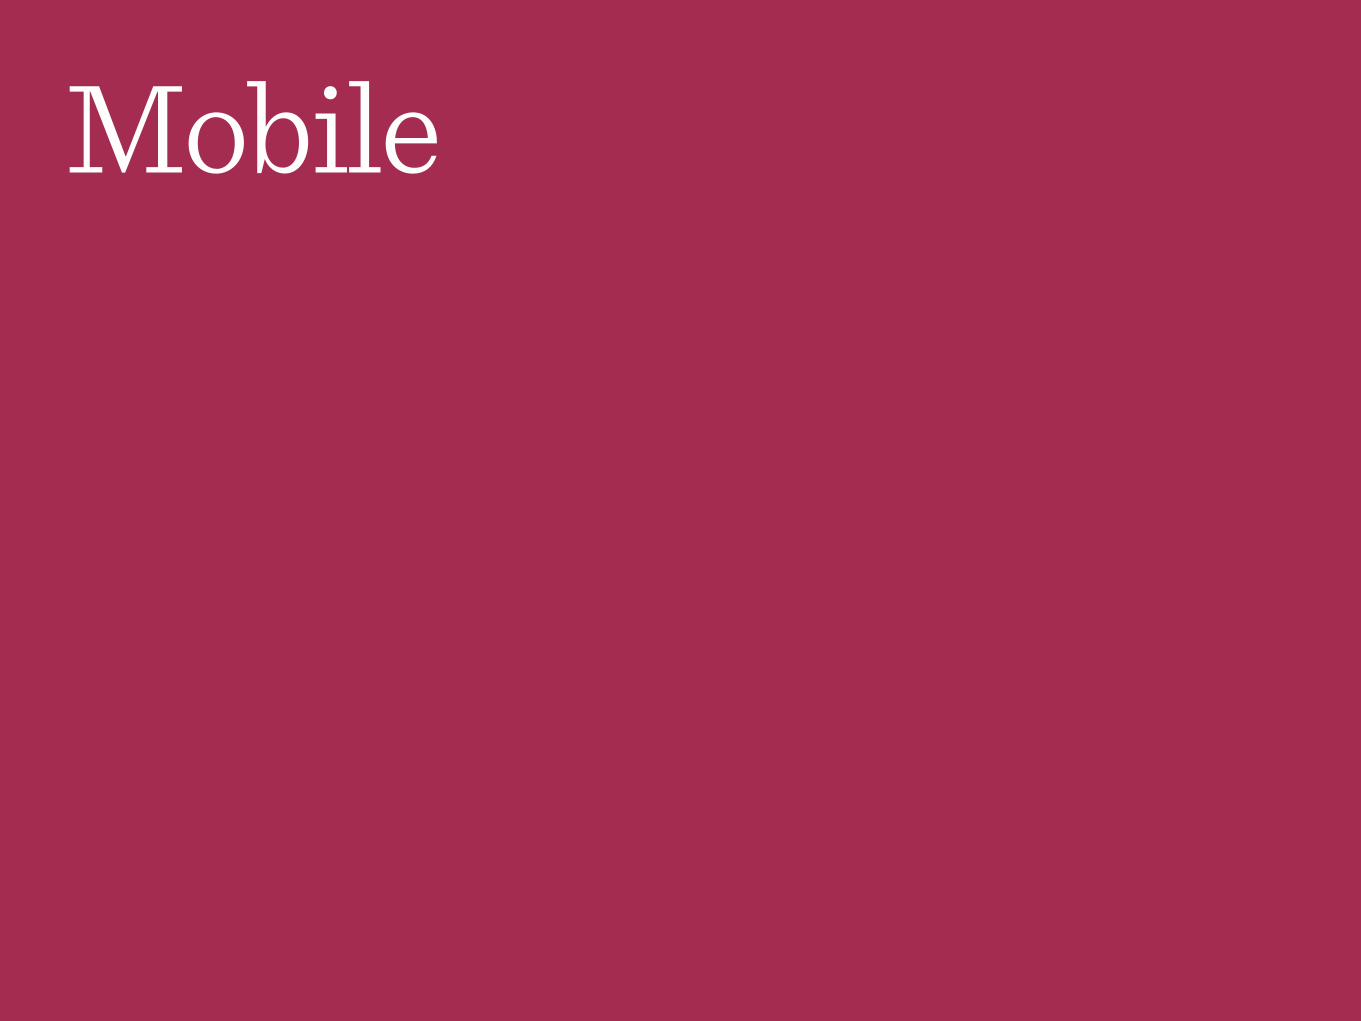
Mayr Meeker 2014 Internet Trends Presentation
Photos shared on WhatsApp, Snapchat, Instagram, Facebook, Flickr each day total 1.8 Billion
1.8 Billion Photos Are Shared Daily
Gartner, Strategy Analytics, company filings
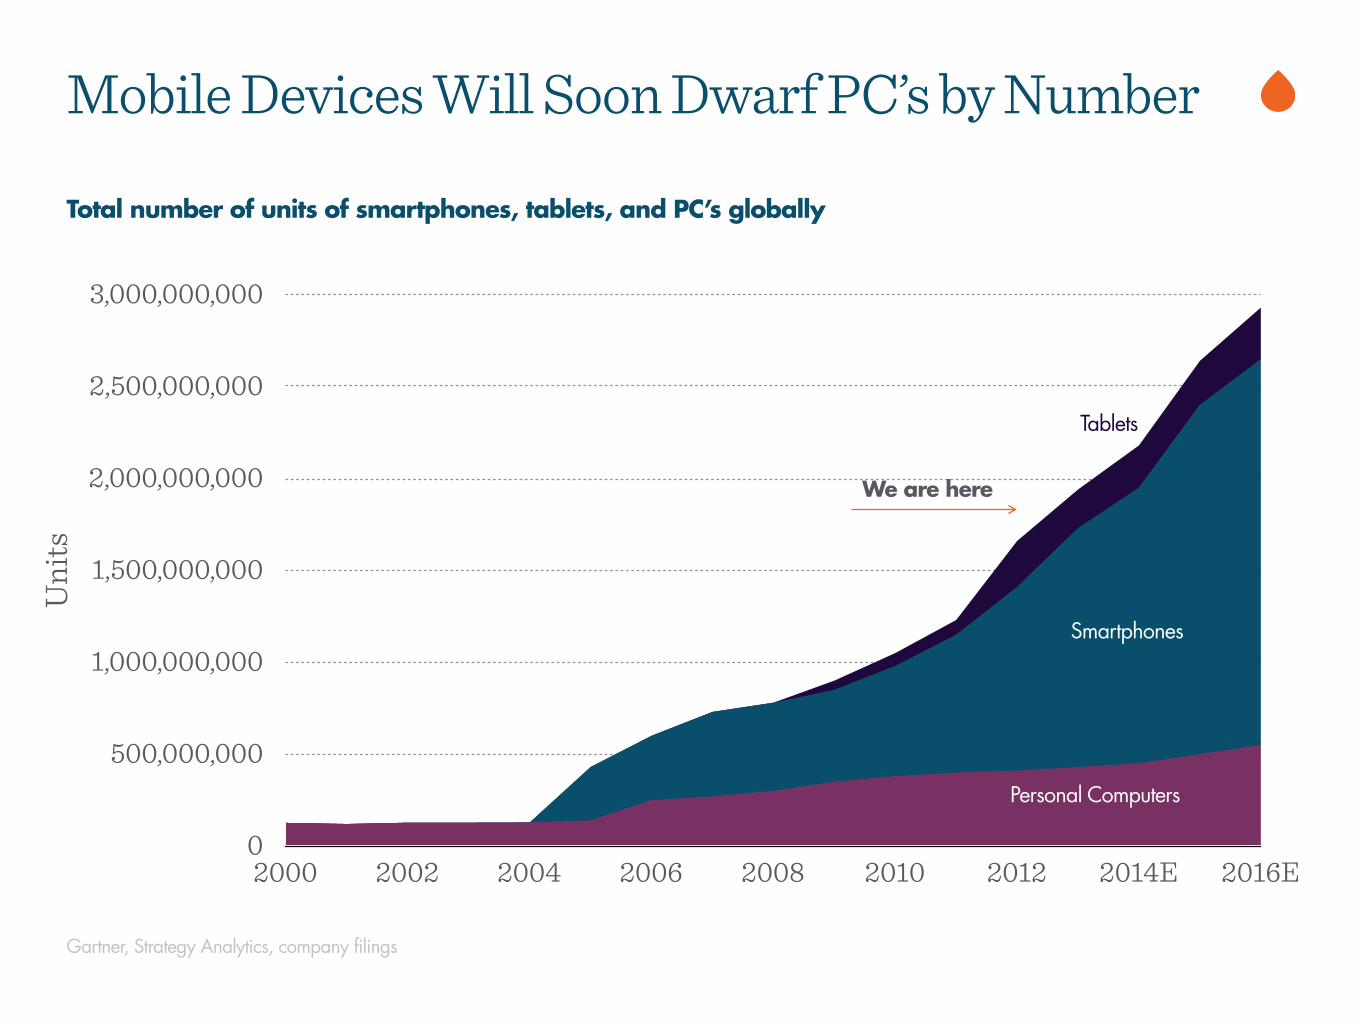
Total number of units of smartphones, tablets, and PC’s globally
Mobile Devices Will Soon Dwarf PC’s by NumberU
nits
0
500,000,000
1,000,000,000
1,500,000,000
2,000,000,000
2,500,000,000
3,000,000,000
2000 2002 2004 2006 2008 2010 2012 2014E 2016E
Tablets
Smartphones
Personal Computers
We are here
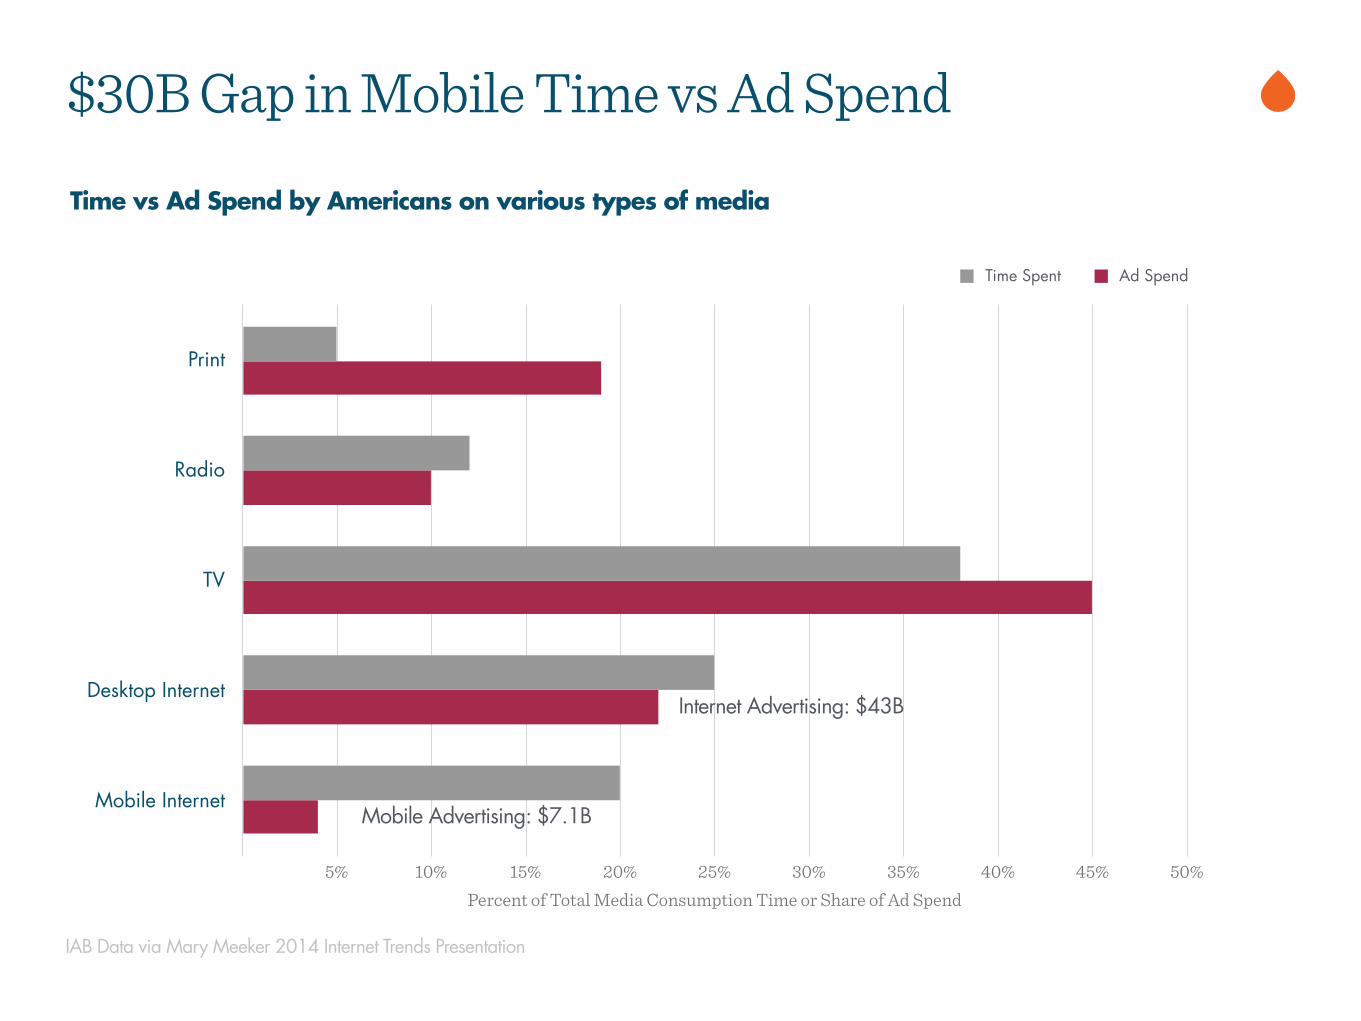
Time vs Ad Spend by Americans on various types of media
$30B Gap in Mobile Time vs Ad Spend
IAB Data via Mary Meeker 2014 Internet Trends Presentation
Radio
TV
Desktop Internet
Mobile Internet
Percent of Total Media Consumption Time or Share of Ad Spend5% 10% 15% 20% 25% 30% 35% 40% 45% 50%
Time Spent Ad Spend
Internet Advertising: $43B
Mobile Advertising: $7.1B
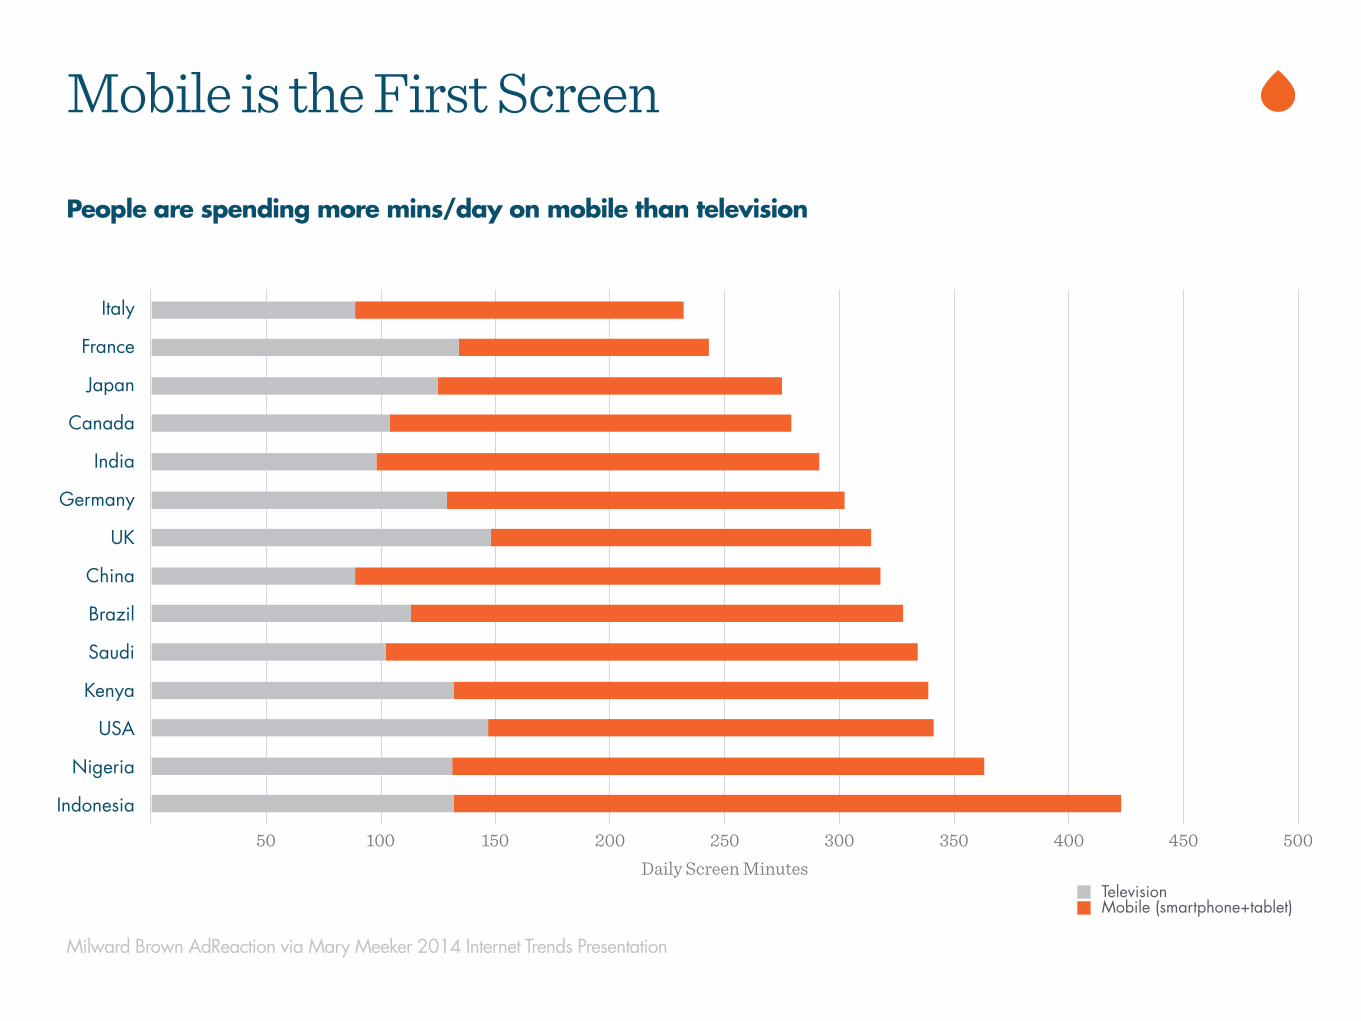
People are spending more mins/day on mobile than television
Mobile is the First Screen
Milward Brown AdReaction via Mary Meeker 2014 Internet Trends Presentation
Italy
France
Japan
Canada
India
Germany
UK
China
Brazil
Saudi
Kenya
USA
Nigeria
Indonesia
Daily Screen Minutes50 100 150 200 250 300 350 400 450 500
TelevisionMobile (smartphone+tablet)
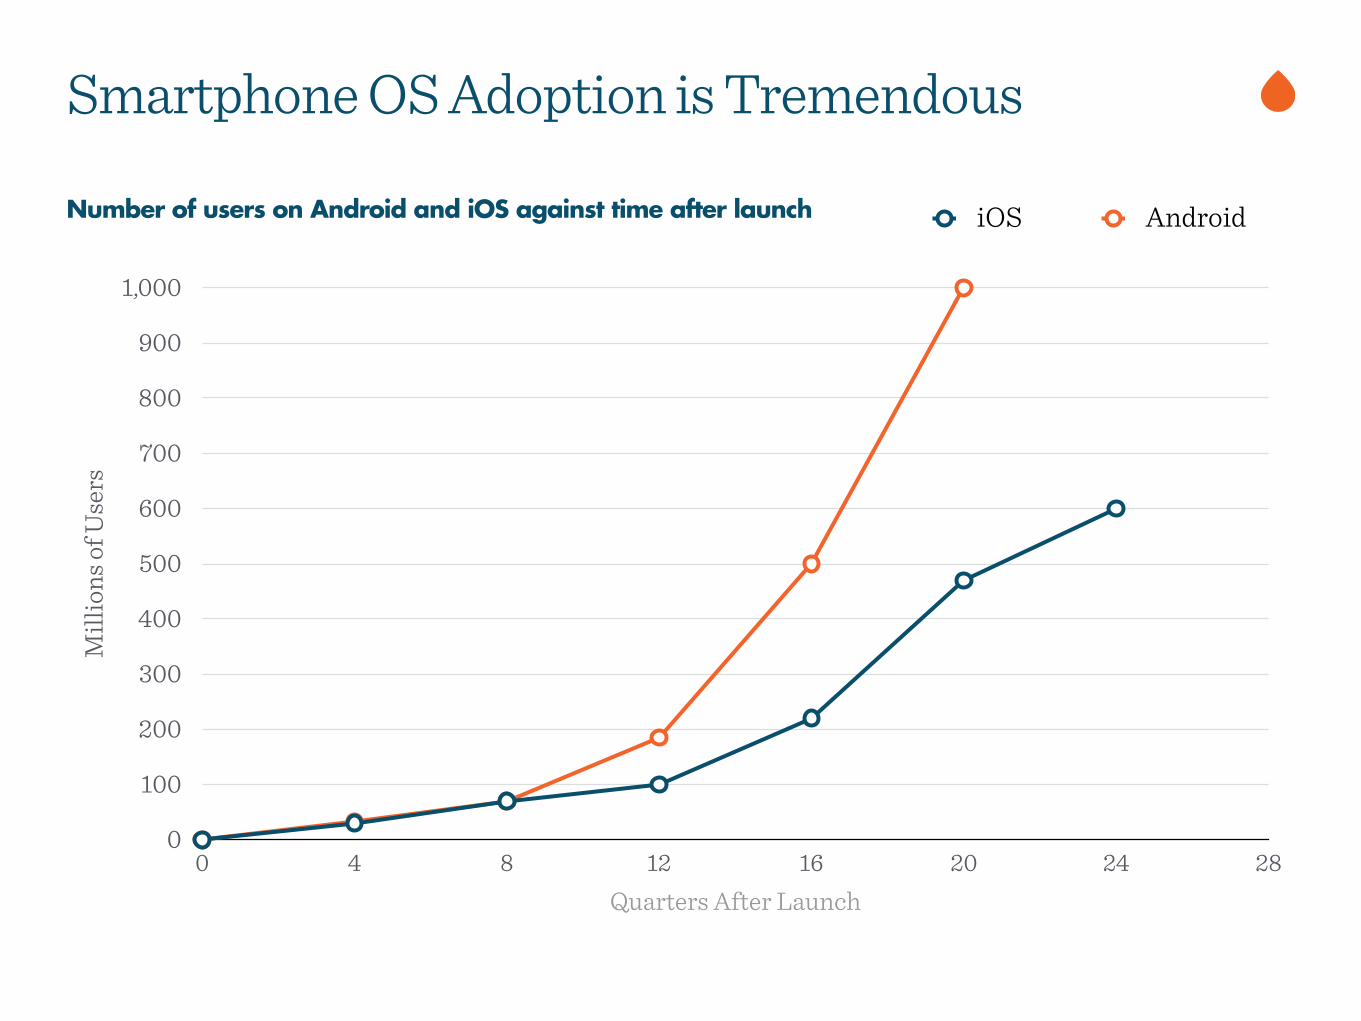
Number of users on Android and iOS against time after launch
Smartphone OS Adoption is TremendousM
illio
ns o
f Use
rs
0
100
200
300
400
500
600
700
800
900
1,000
Quarters After Launch0 4 8 12 16 20 24 28
iOS Android
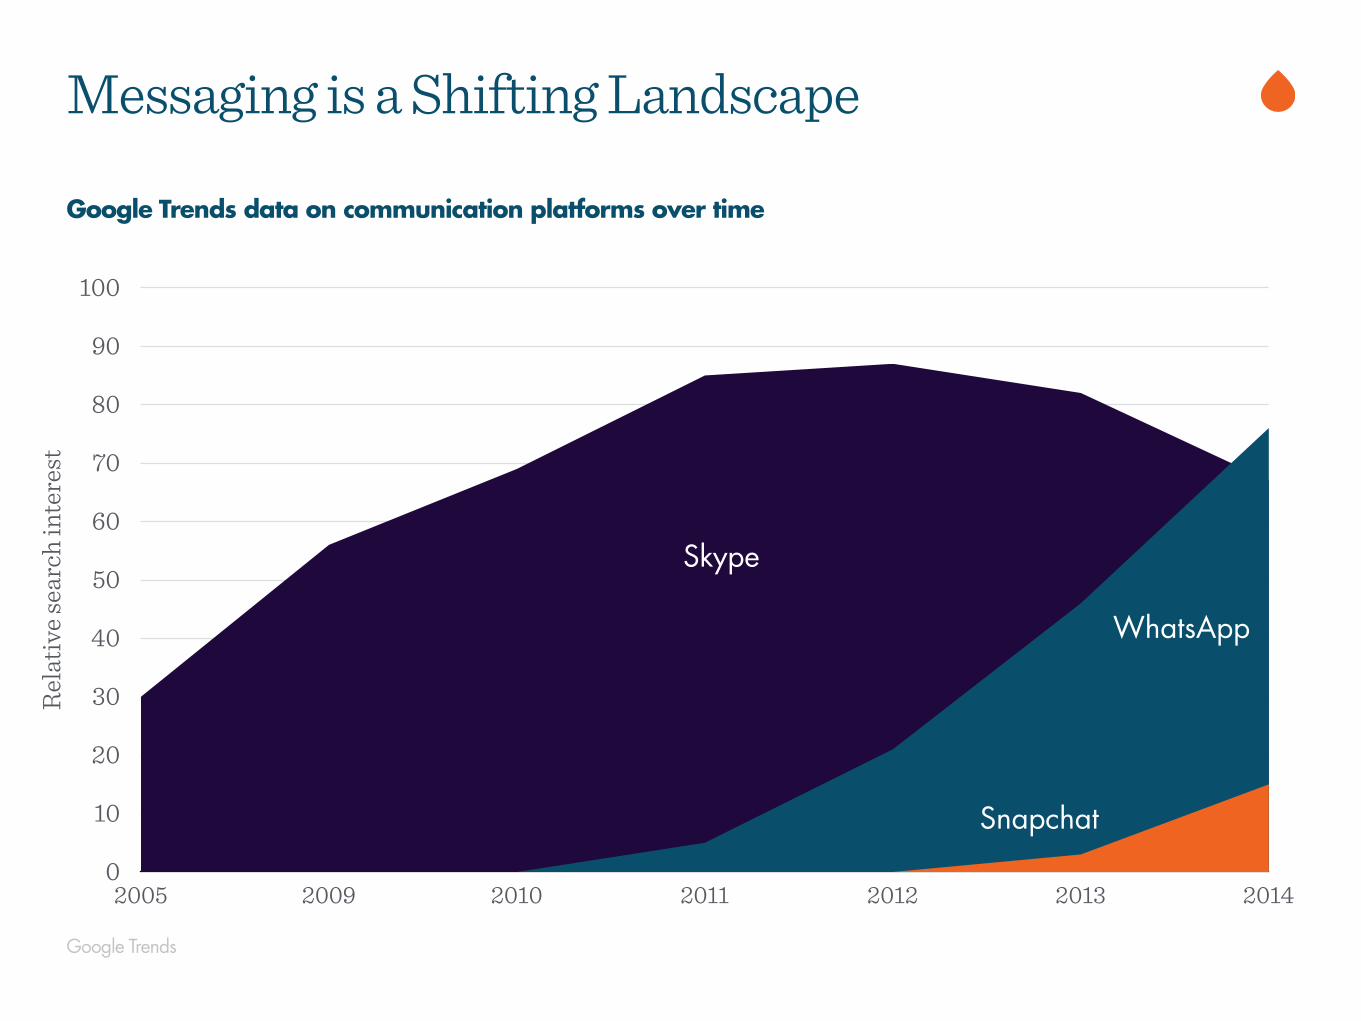
Google Trends
Google Trends data on communication platforms over time
Messaging is a Shifting LandscapeR
elat
ive s
earc
h in
tere
st
0
10
20
30
40
50
60
70
80
90
100
2005 2009 2010 2011 2012 2013 2014
Skype
Snapchat
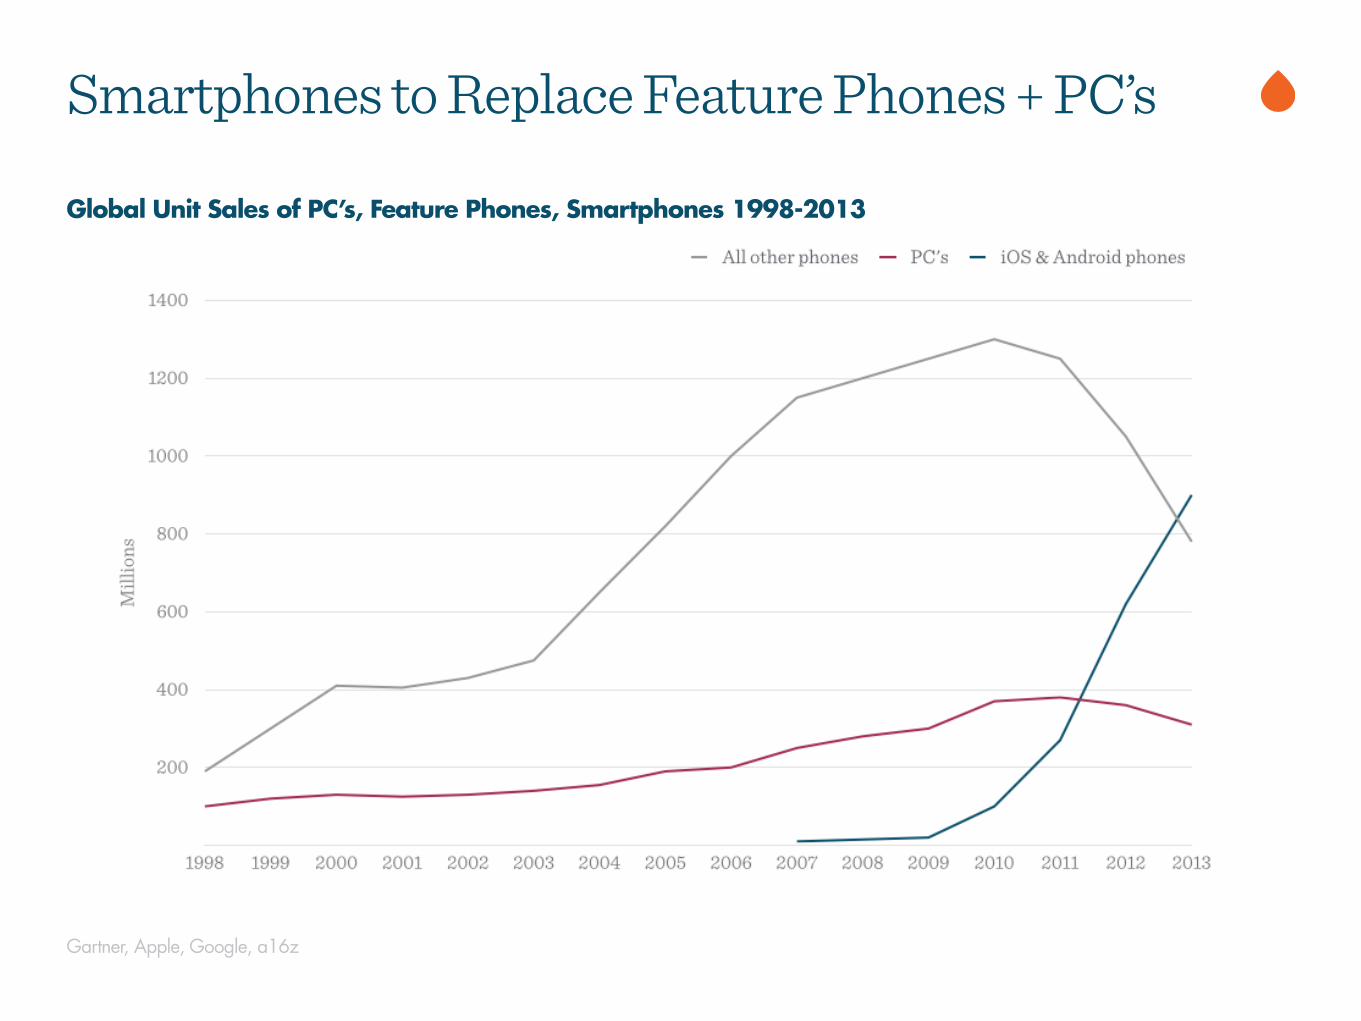
Gartner, Apple, Google, a16z
Global Unit Sales of PC’s, Feature Phones, Smartphones 1998-2013
Smartphones to Replace Feature Phones + PC’s
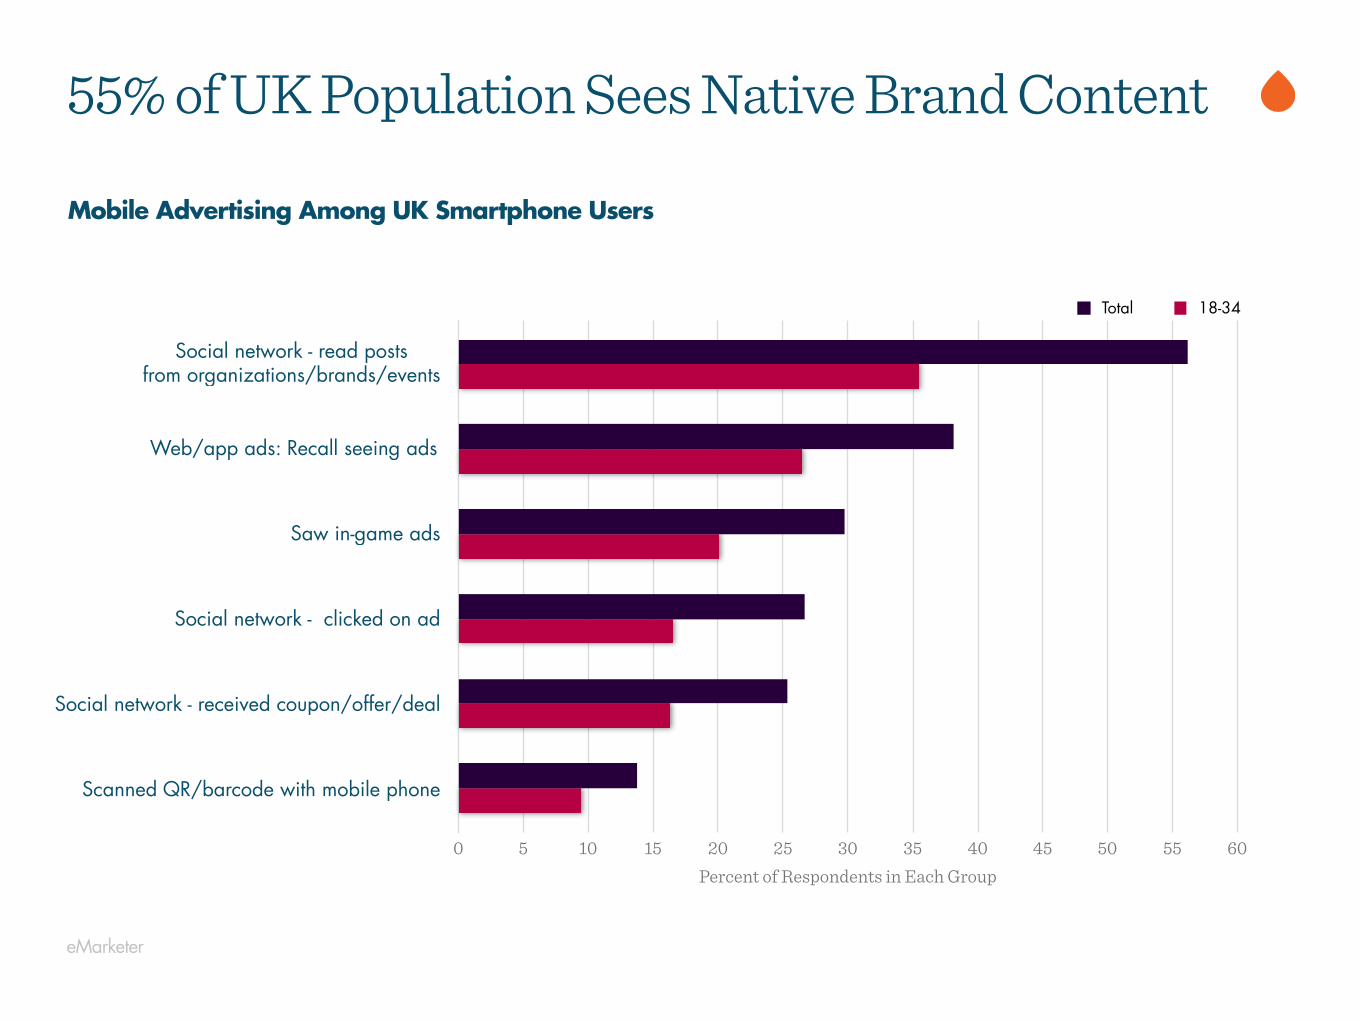
eMarketer
Mobile Advertising Among UK Smartphone Users
55% of UK Population Sees Native Brand Content
Social network - read postsfrom organizations/brands/events
Web/app ads: Recall seeing ads
Saw in-game ads
Social network - clicked on ad
Social network - received coupon/offer/deal
Scanned QR/barcode with mobile phone
Percent of Respondents in Each Group0 5 10 15 20 25 30 35 40 45 50 55 60
Total 18-34

Nielsen, BI Intelligence
Average monthly hours spent on the Internet by device
Internet Usage Now Led by Mobile DevicesH
ours
:Min
utes
0
8.75
17.5
26.25
35
Q3 2012 Q4 2012 Q1 2013 Q2 2013 Q3 2013
Using Browser/Apps on a Smartphone Internet on a Computer
Average Monthly Time Spent Per User
Smartphone Vs. Desktop
Source: Nielsen, BI Intelligence
29 29
2827 27
26
28
3032
34

Social
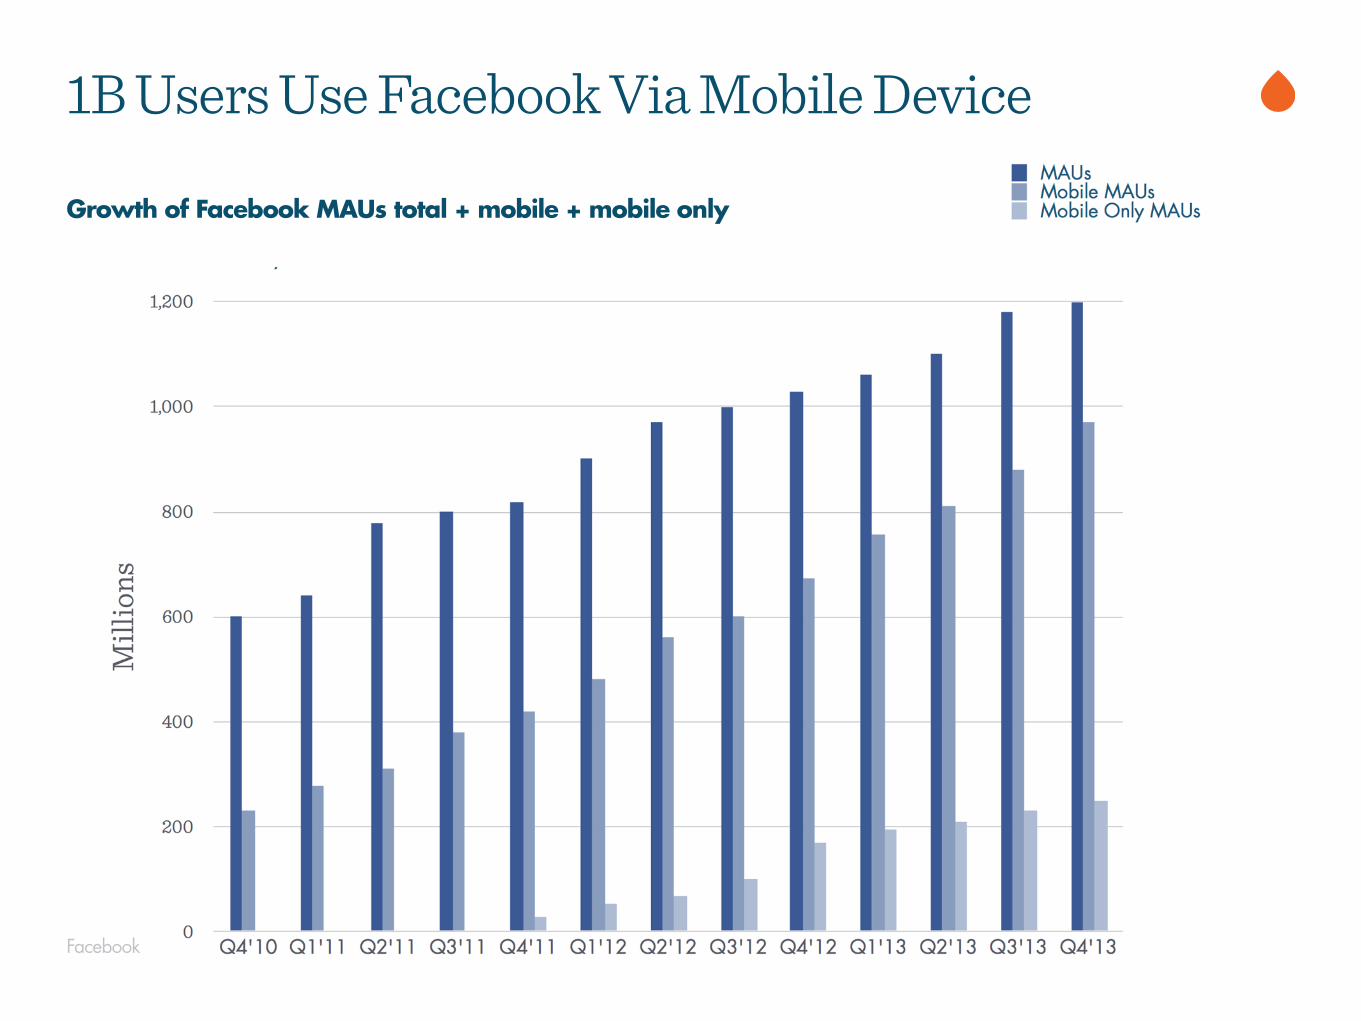
Growth of Facebook MAUs total + mobile + mobile only
1B Users Use Facebook Via Mobile Device
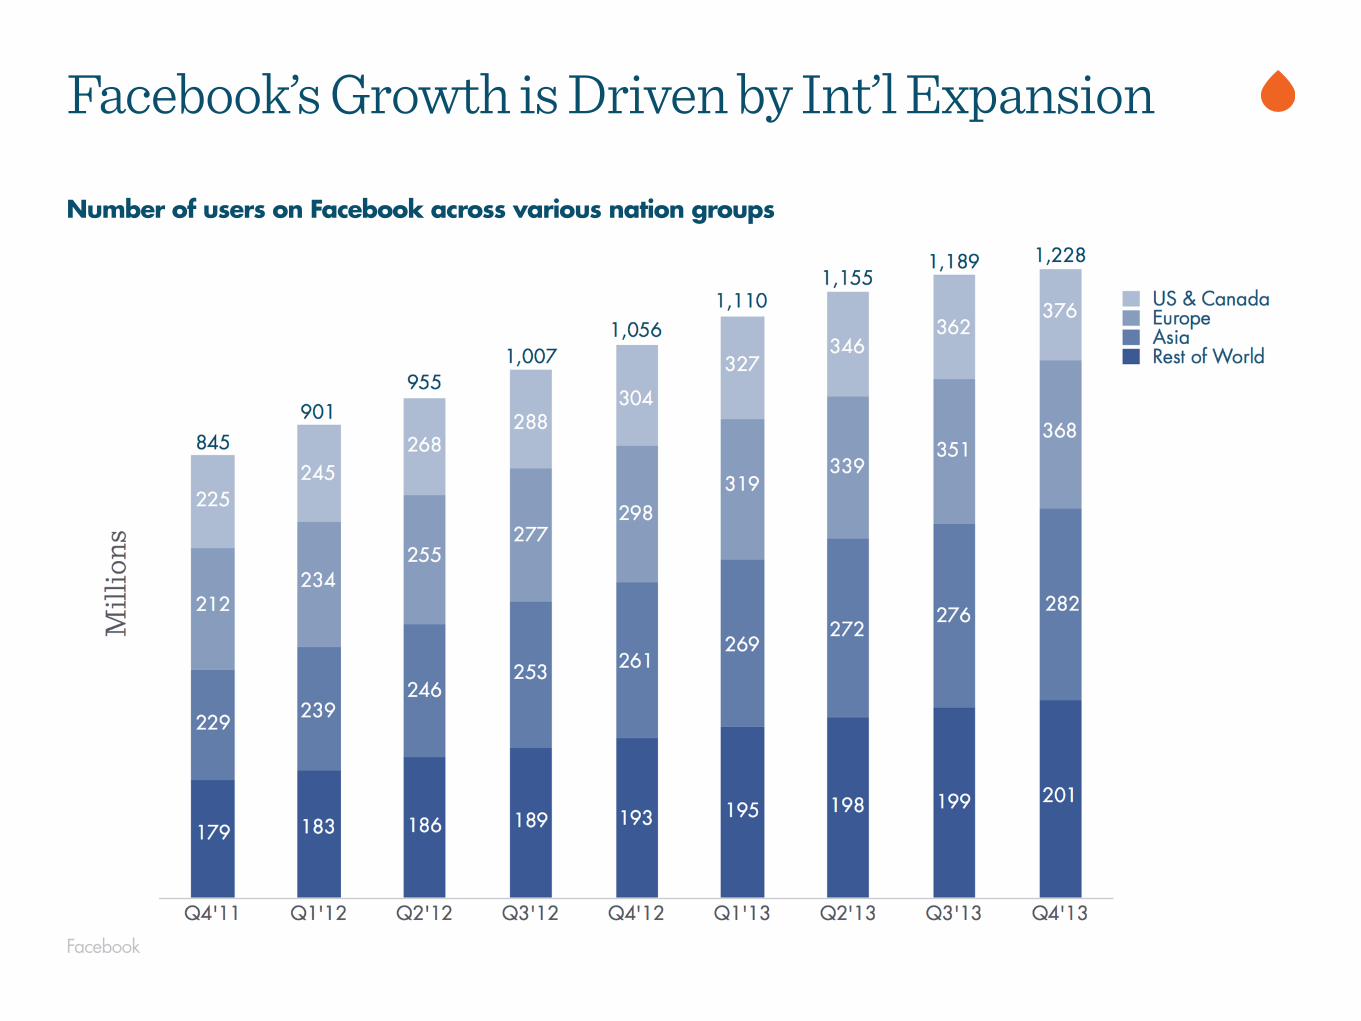
Facebook’s Growth is Driven by Int’l Expansion
Number of users on Facebook across various nation groups
SimplyMeasured, Interbrand 100
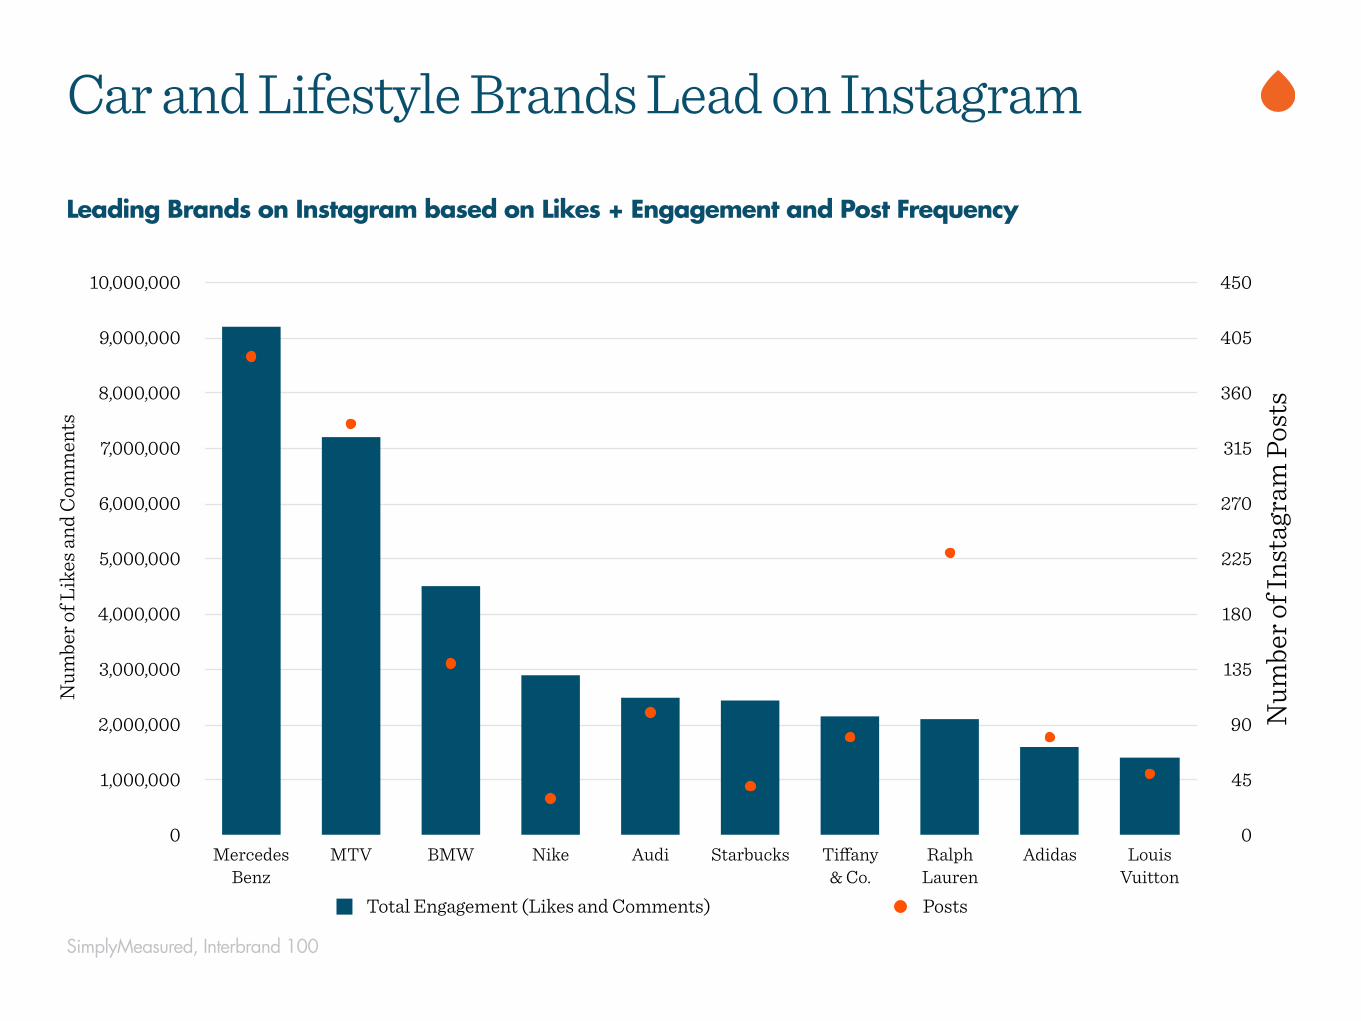
Car and Lifestyle Brands Lead on Instagram
Title
Num
ber o
f Ins
tagr
am P
osts
0
45
90
135
180
225
270
315
360
405
450
Num
ber o
f Lik
es an
d Co
mm
ents
0
1,000,000
2,000,000
3,000,000
4,000,000
5,000,000
6,000,000
7,000,000
8,000,000
9,000,000
10,000,000
Category Axis
MercedesBenz
MTV BMW Nike Audi Starbucks Tiffany & Co.
Ralph Lauren
Adidas Louis Vuitton
Total Engagement (Likes and Comments) Posts
Leading Brands on Instagram based on Likes + Engagement and Post Frequency
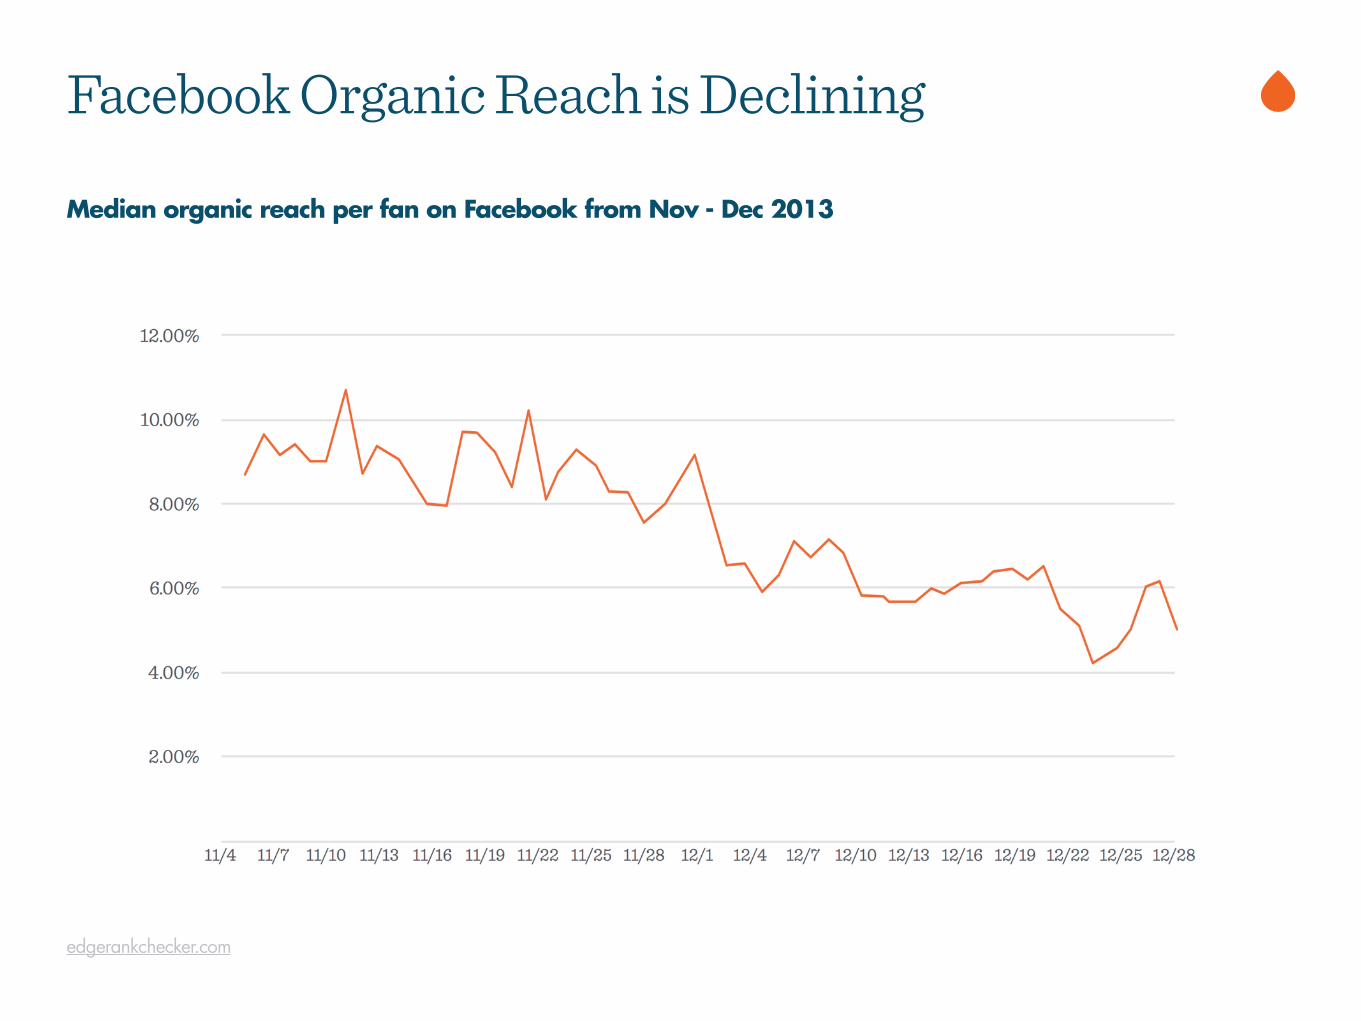
Median organic reach per fan on Facebook from Nov - Dec 2013
Facebook Organic Reach is Declining
edgerankchecker.com
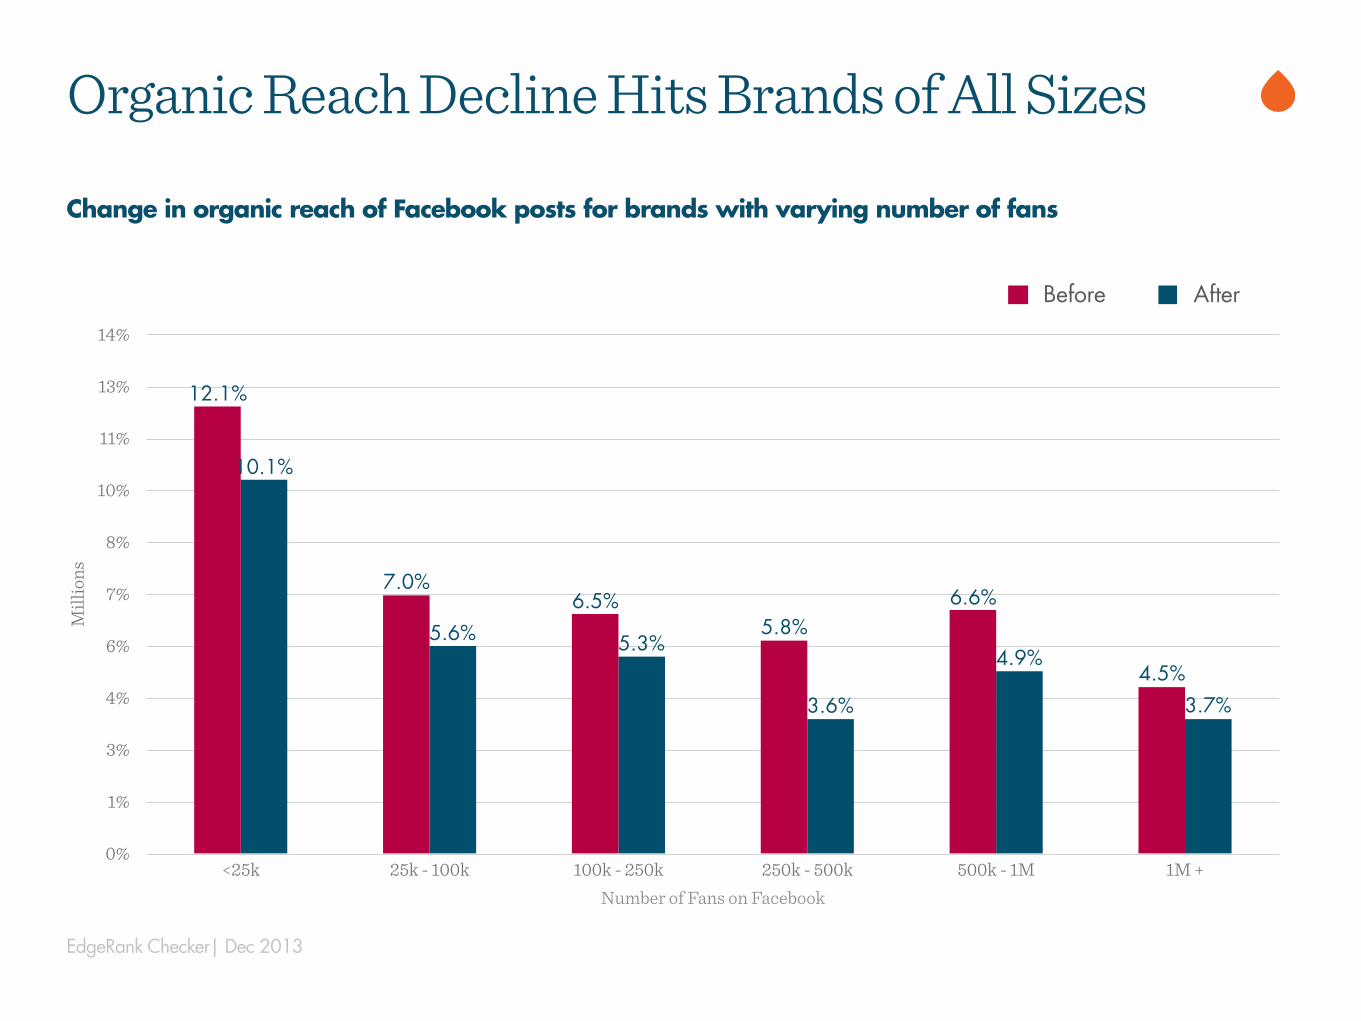
EdgeRank Checker| Dec 2013
Organic Reach Decline Hits Brands of All SizesM
illio
ns
0%
1%
3%
4%
6%
7%
8%
10%
11%
13%
14%
Number of Fans on Facebook<25k 25k - 100k 100k - 250k 250k - 500k 500k - 1M 1M +
3.7%
4.9%
3.6%
5.3%5.6%
10.1%
4.5%
6.6%5.8%
6.5%7.0%
12.1%
Before After
Change in organic reach of Facebook posts for brands with varying number of fans
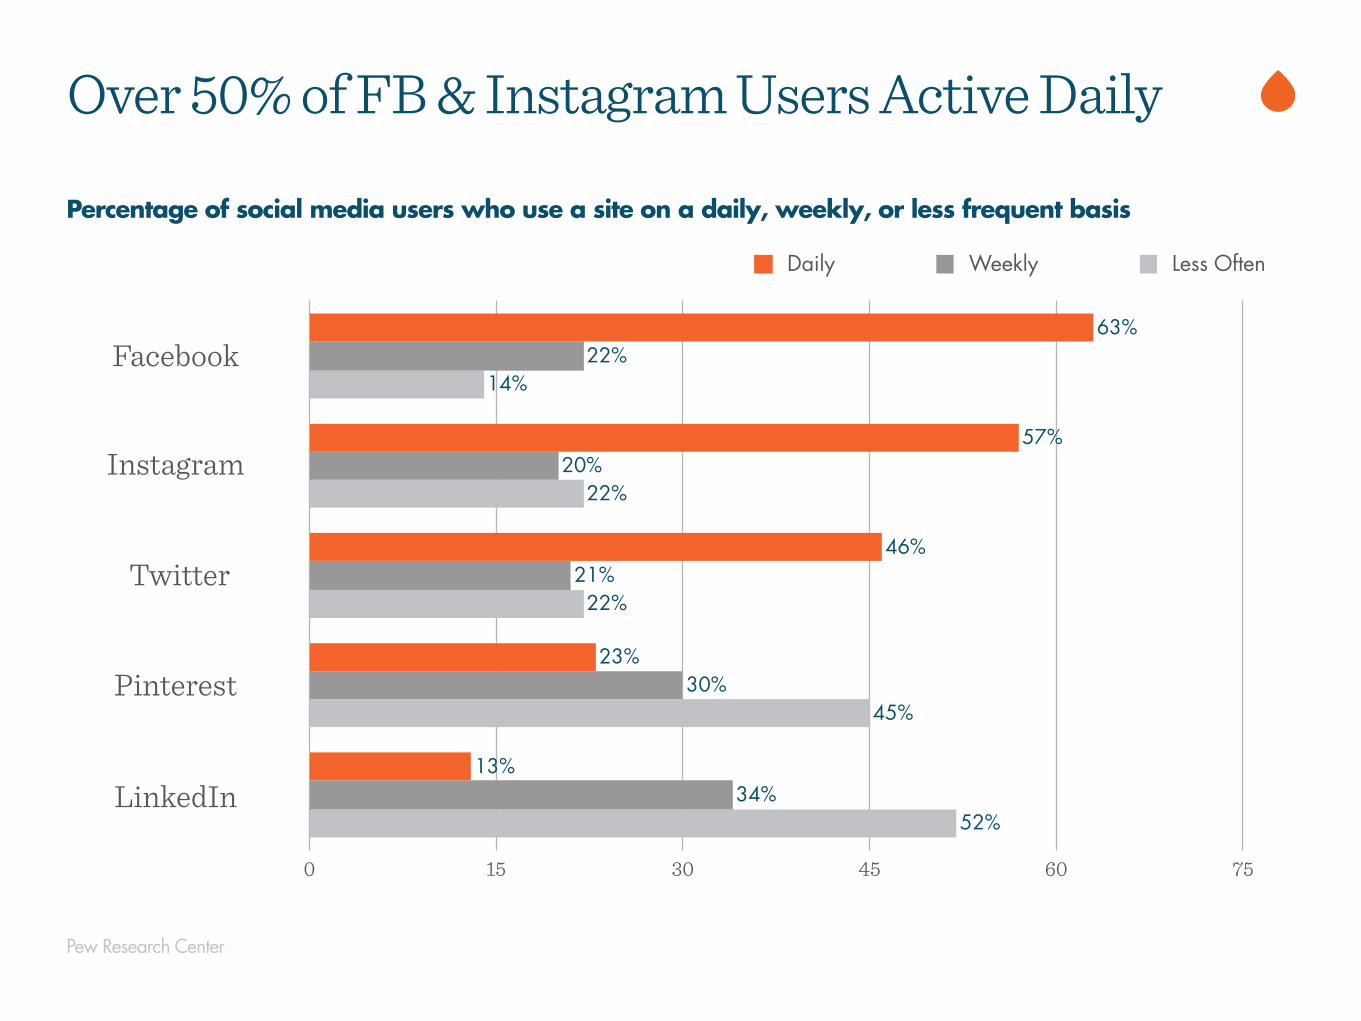
Pew Research Center
Percentage of social media users who use a site on a daily, weekly, or less frequent basis
Over 50% of FB & Instagram Users Active Daily
0 15 30 45 60 75
52%
45%
22%
22%
14%
34%
30%
21%
20%
22%
13%
23%
46%
57%
63%
Daily Weekly Less Often
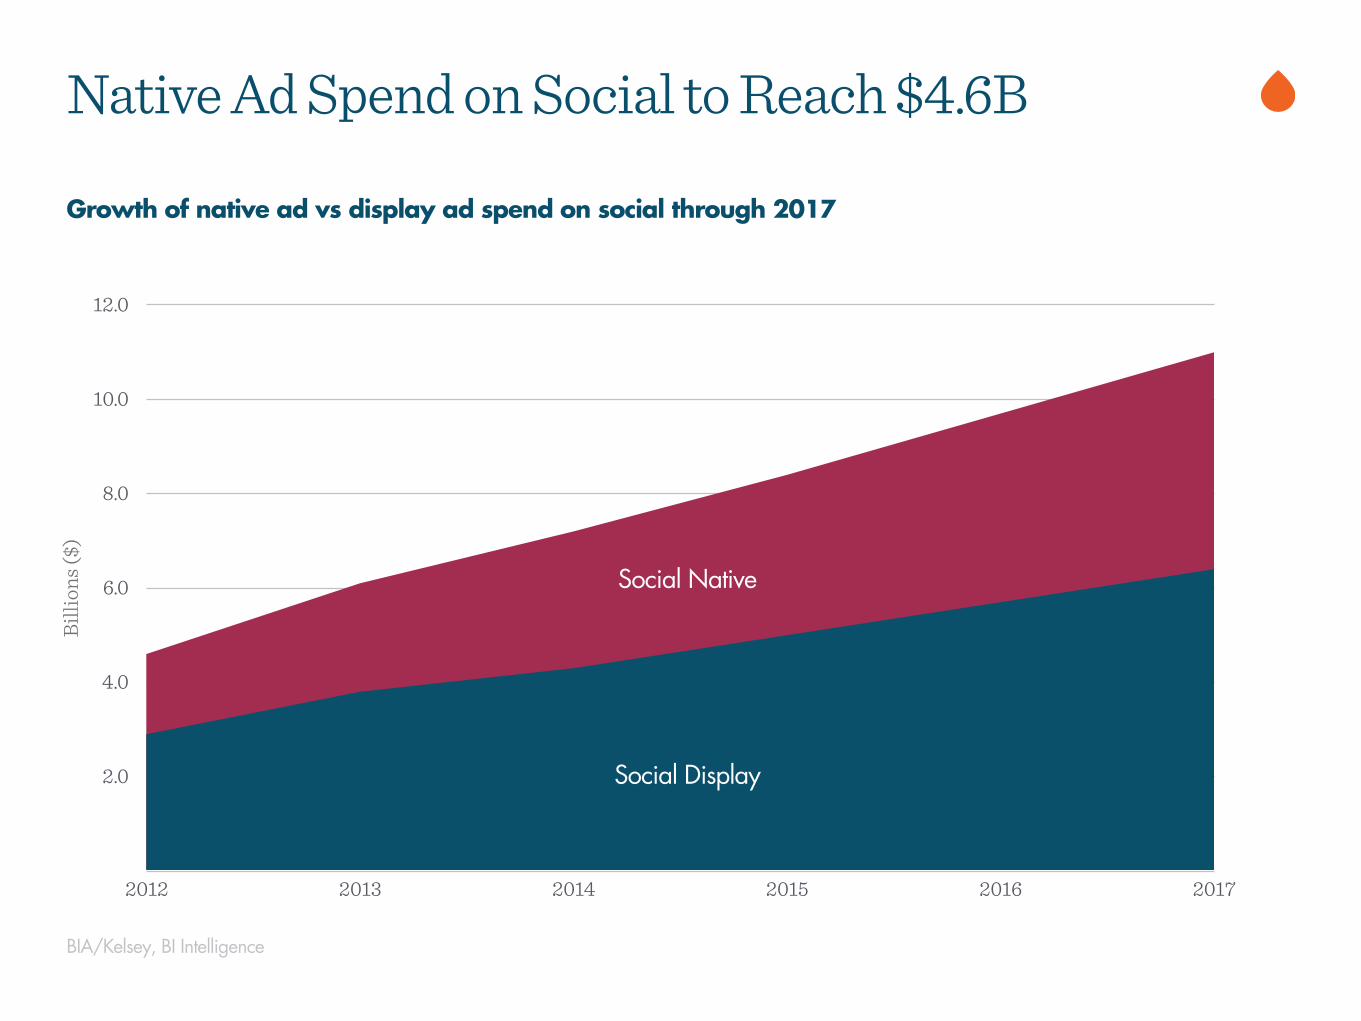
BIA/Kelsey, BI Intelligence
Growth of native ad vs display ad spend on social through 2017
Native Ad Spend on Social to Reach $4.6BBi
llion
s ($)
2.0
4.0
6.0
8.0
10.0
12.0
2012 2013 2014 2015 2016 2017
Social Display
Social Native
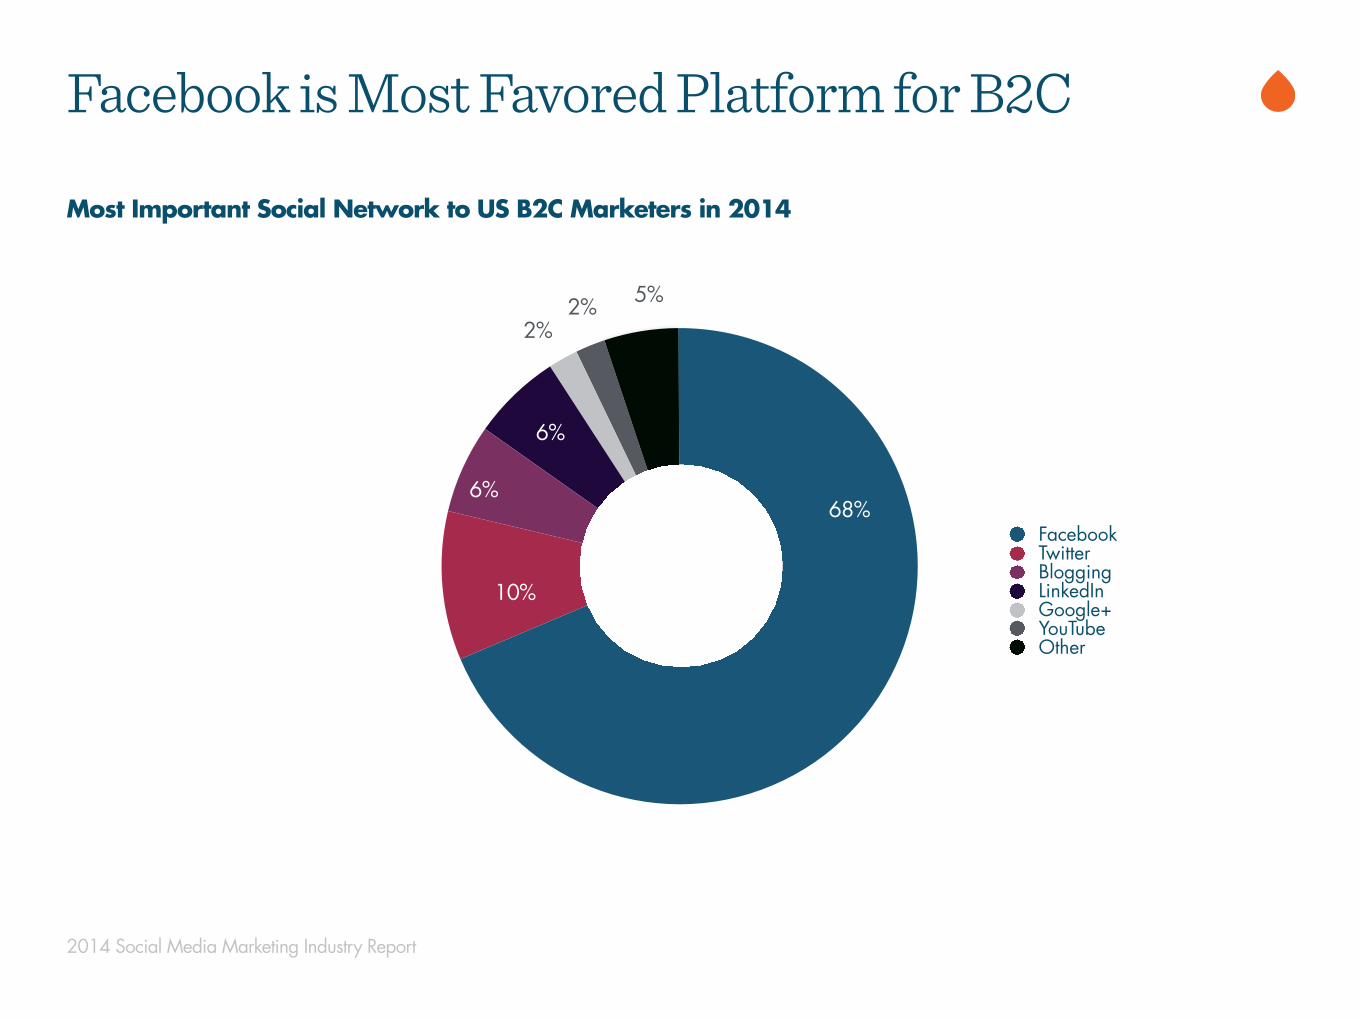
FacebookTwitterBloggingLinkedInGoogle+YouTubeOther
Most Important Social Network to US B2C Marketers in 2014
Facebook is Most Favored Platform for B2C
5%2%
10%
6%
6%
68%
2014 Social Media Marketing Industry Report
2%
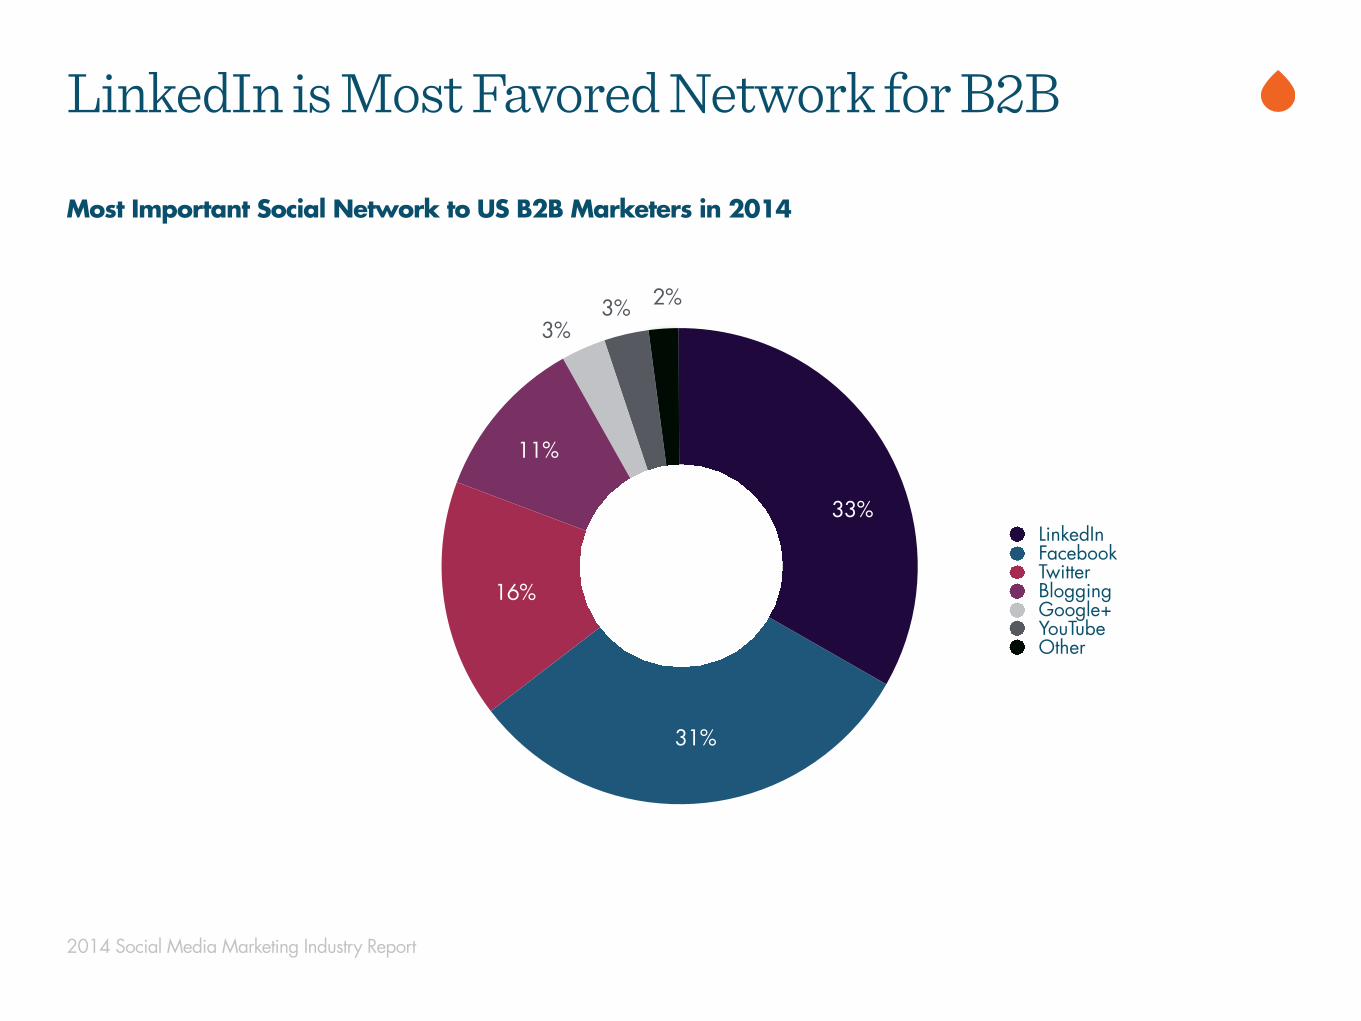
LinkedInFacebookTwitterBloggingGoogle+YouTubeOther
Most Important Social Network to US B2B Marketers in 2014
LinkedIn is Most Favored Network for B2B
2%3%
16%
31%
11%
2014 Social Media Marketing Industry Report
3%
33%
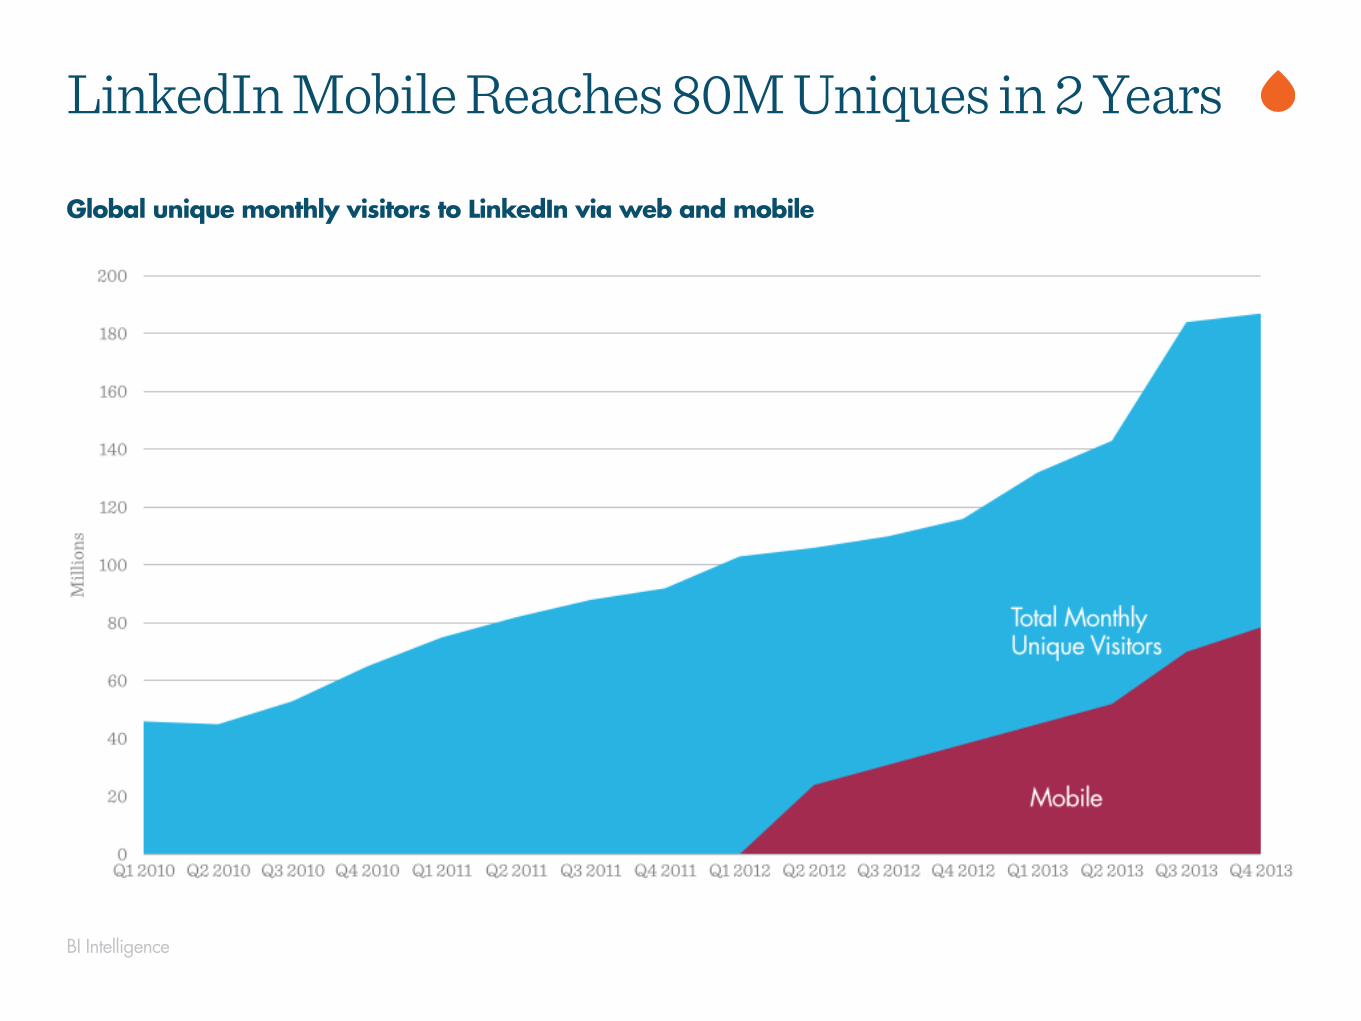
BI Intelligence
Global unique monthly visitors to LinkedIn via web and mobile
LinkedIn Mobile Reaches 80M Uniques in 2 Years
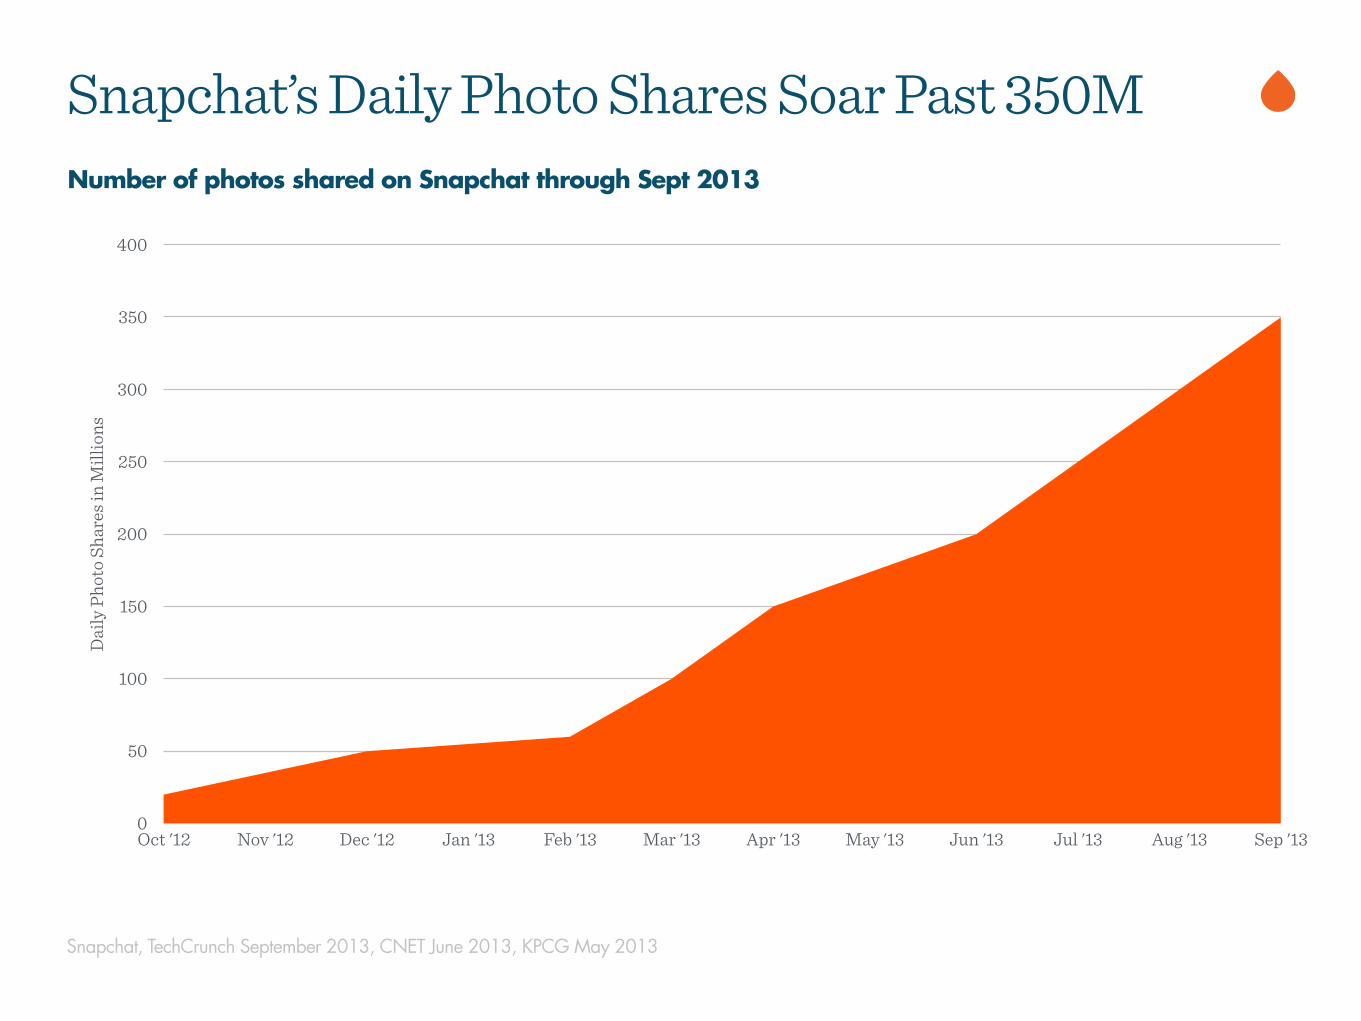
Snapchat, TechCrunch September 2013, CNET June 2013, KPCG May 2013
Snapchat’s Daily Photo Shares Soar Past 350MD
aily
Pho
to S
hare
s in
Mill
ions
0
50
100
150
200
250
300
350
400
Oct '12 Nov '12 Dec '12 Jan '13 Feb '13 Mar '13 Apr '13 May '13 Jun '13 Jul '13 Aug '13 Sep '13
Number of photos shared on Snapchat through Sept 2013
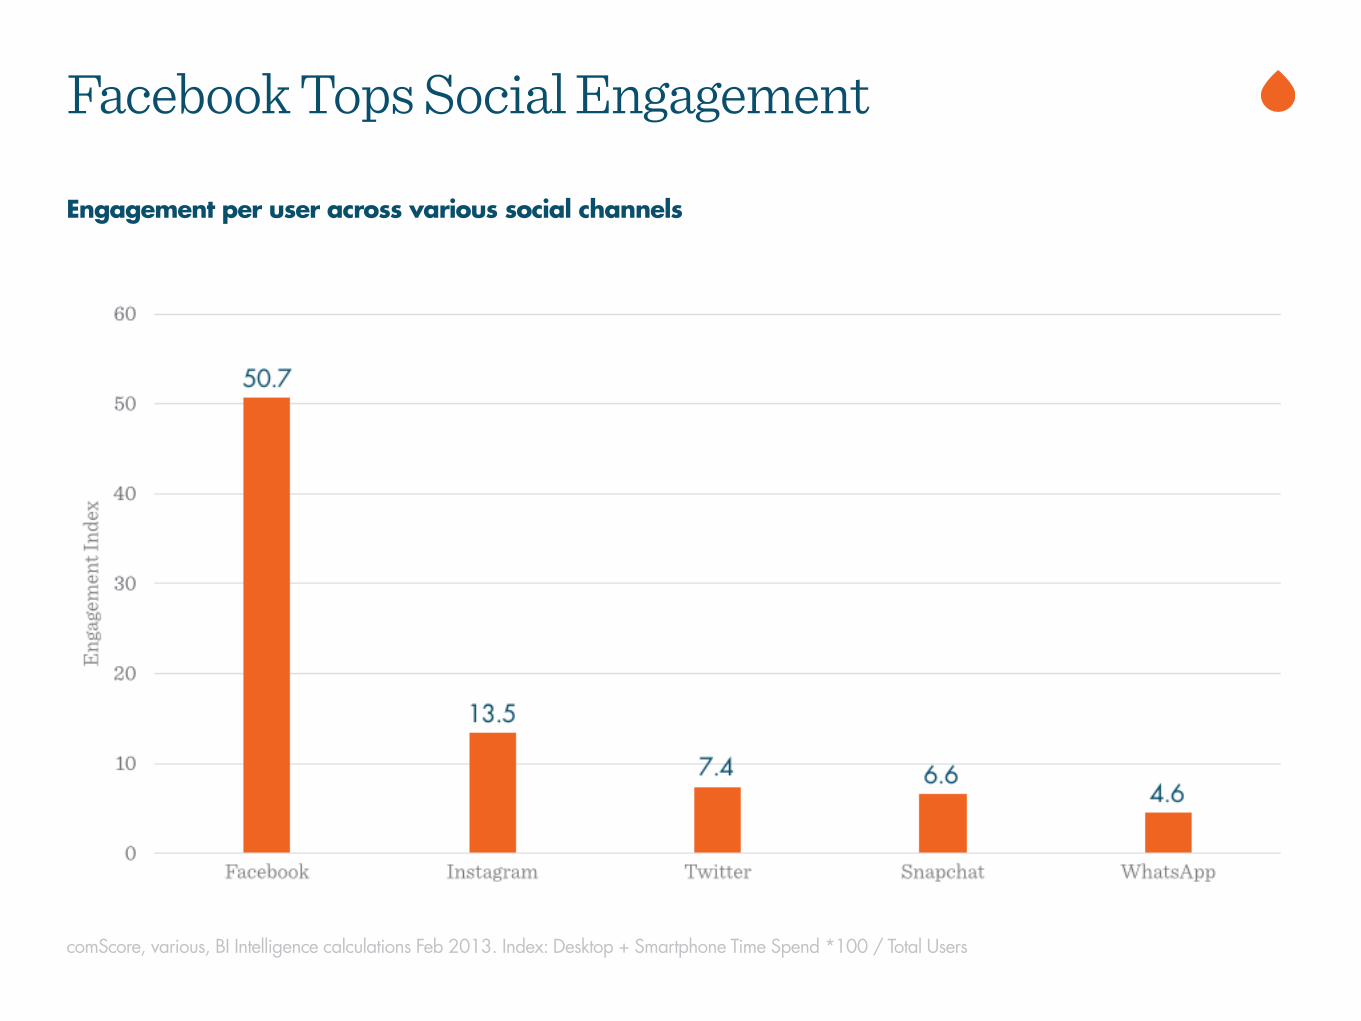
comScore, various, BI Intelligence calculations Feb 2013. Index: Desktop + Smartphone Time Spend *100 / Total Users
Engagement per user across various social channels
Facebook Tops Social Engagement
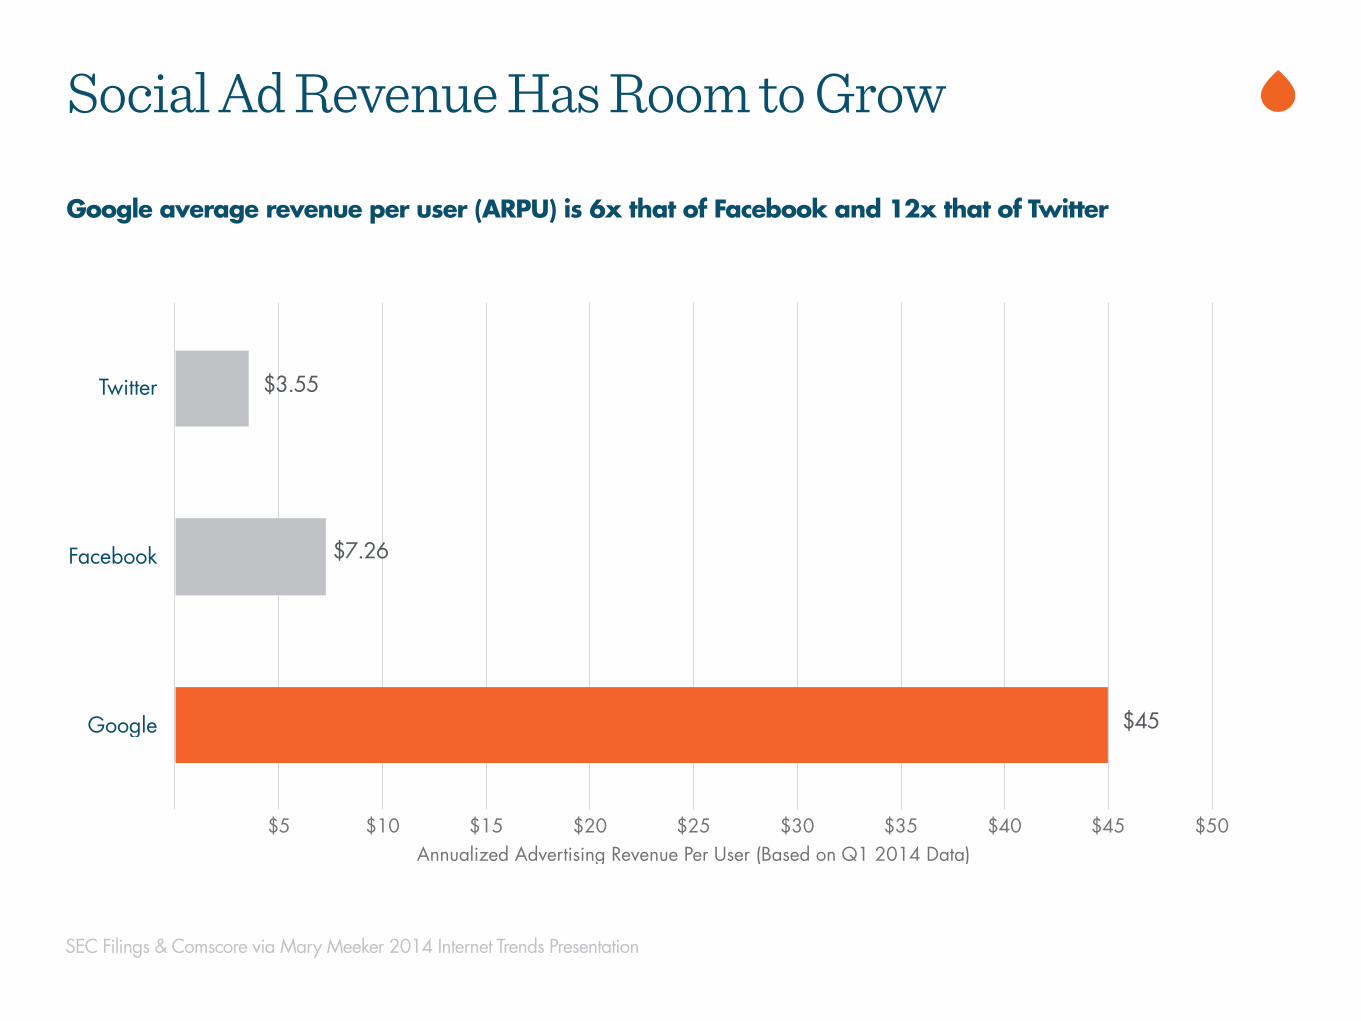
Google average revenue per user (ARPU) is 6x that of Facebook and 12x that of Twitter
Social Ad Revenue Has Room to Grow
SEC Filings & Comscore via Mary Meeker 2014 Internet Trends Presentation
Annualized Advertising Revenue Per User (Based on Q1 2014 Data)$5 $10 $15 $20 $25 $30 $35 $40 $45 $50
$3.55
$7.26
$45
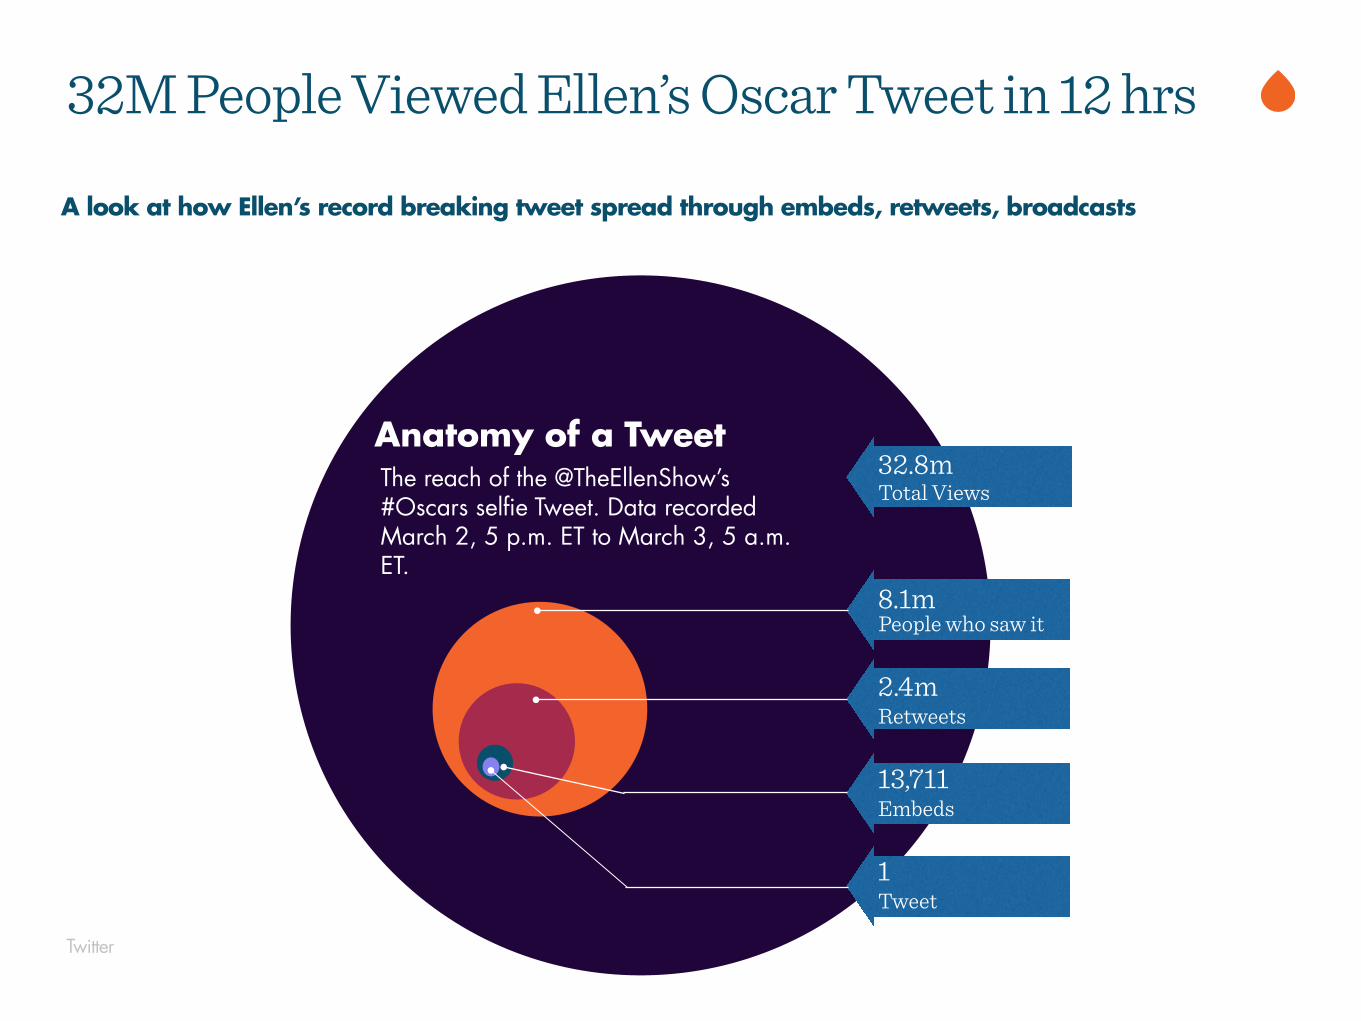
32M People Viewed Ellen’s Oscar Tweet in 12 hrs
d
Anatomy of a Tweet The reach of the @TheEllenShow’s #Oscars selfie Tweet. Data recorded March 2, 5 p.m. ET to March 3, 5 a.m. ET.
32.8mTotal Views
8.1mPeople who saw it
2.4mRetweets
13,711Embeds
1Tweet
A look at how Ellen’s record breaking tweet spread through embeds, retweets, broadcasts
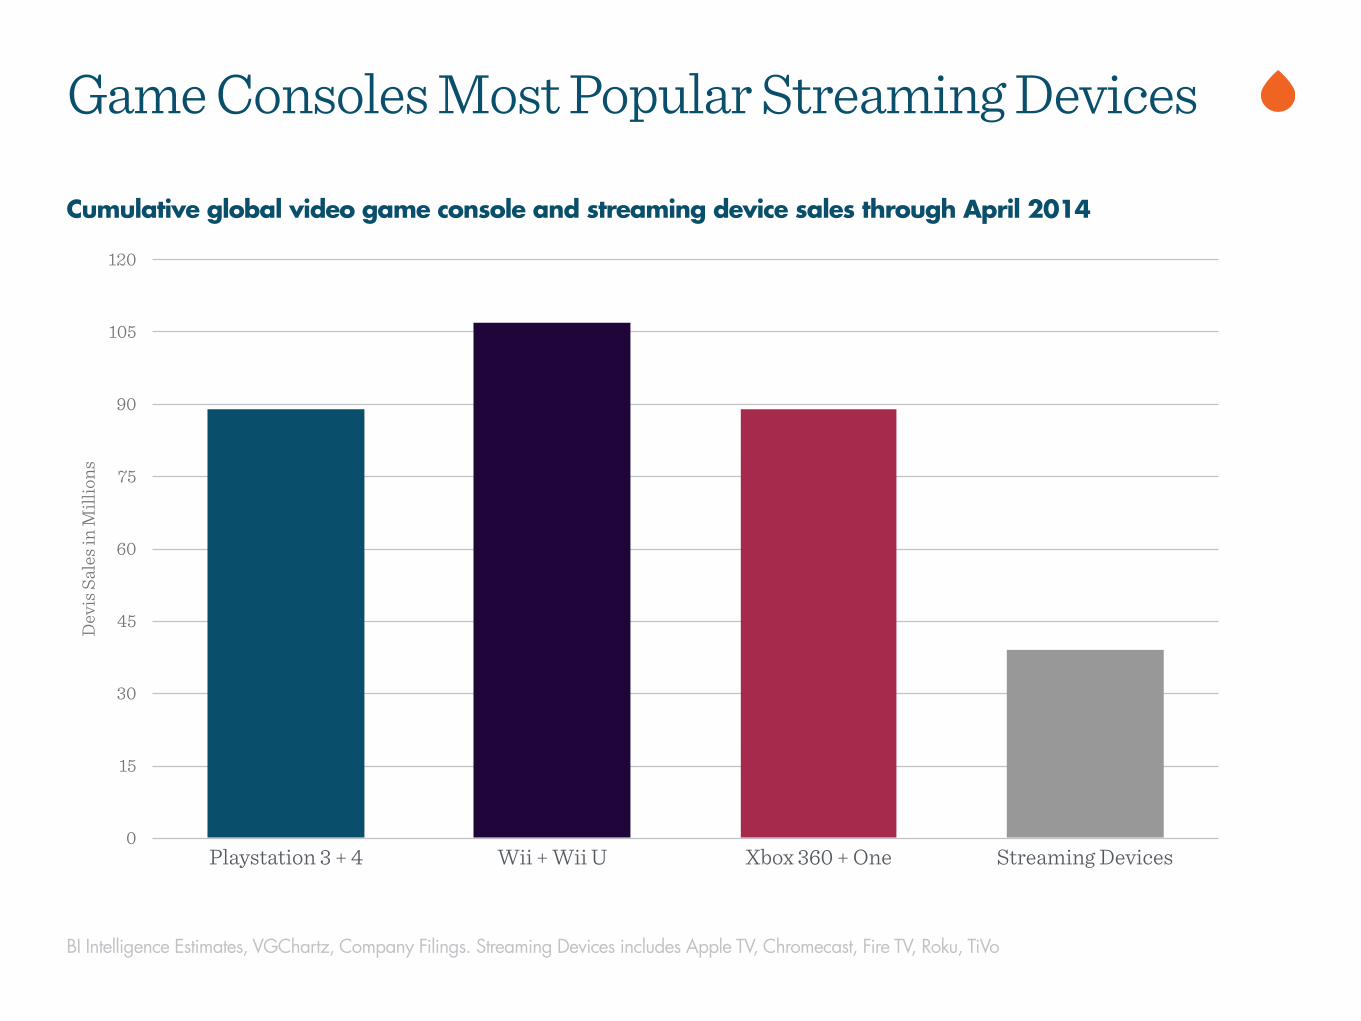
BI Intelligence Estimates, VGChartz, Company Filings. Streaming Devices includes Apple TV, Chromecast, Fire TV, Roku, TiVo
Cumulative global video game console and streaming device sales through April 2014
Game Consoles Most Popular Streaming DevicesD
evis
Sal
es in
Mill
ions
0
15
30
45
60
75
90
105
120
Playstation 3 + 4 Wii + Wii U Xbox 360 + One Streaming Devices

Global
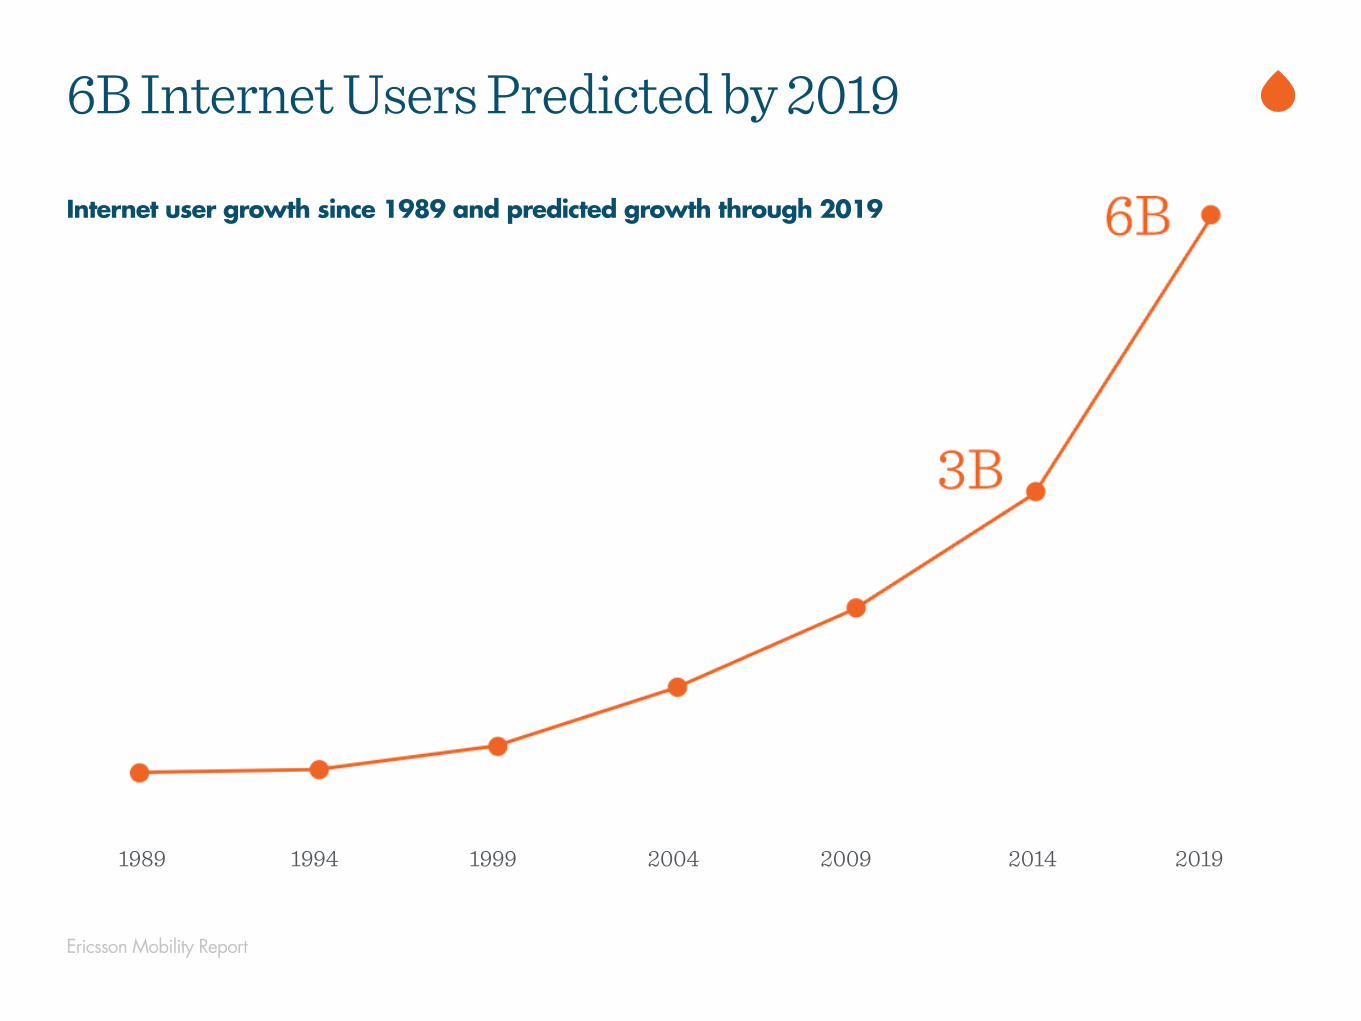
Ericsson Mobility Report
6B Internet Users Predicted by 2019
Internet user growth since 1989 and predicted growth through 2019
1989 1994 1999 2004 2009 2014 2019
Dig
ital I
nfor
mat
ion
Cre
ated
& S
hare
d (z
etta
byte
s)
0
1
2
3
4
5
6
7
8
2005 2007 2009 2011 2013 2015E
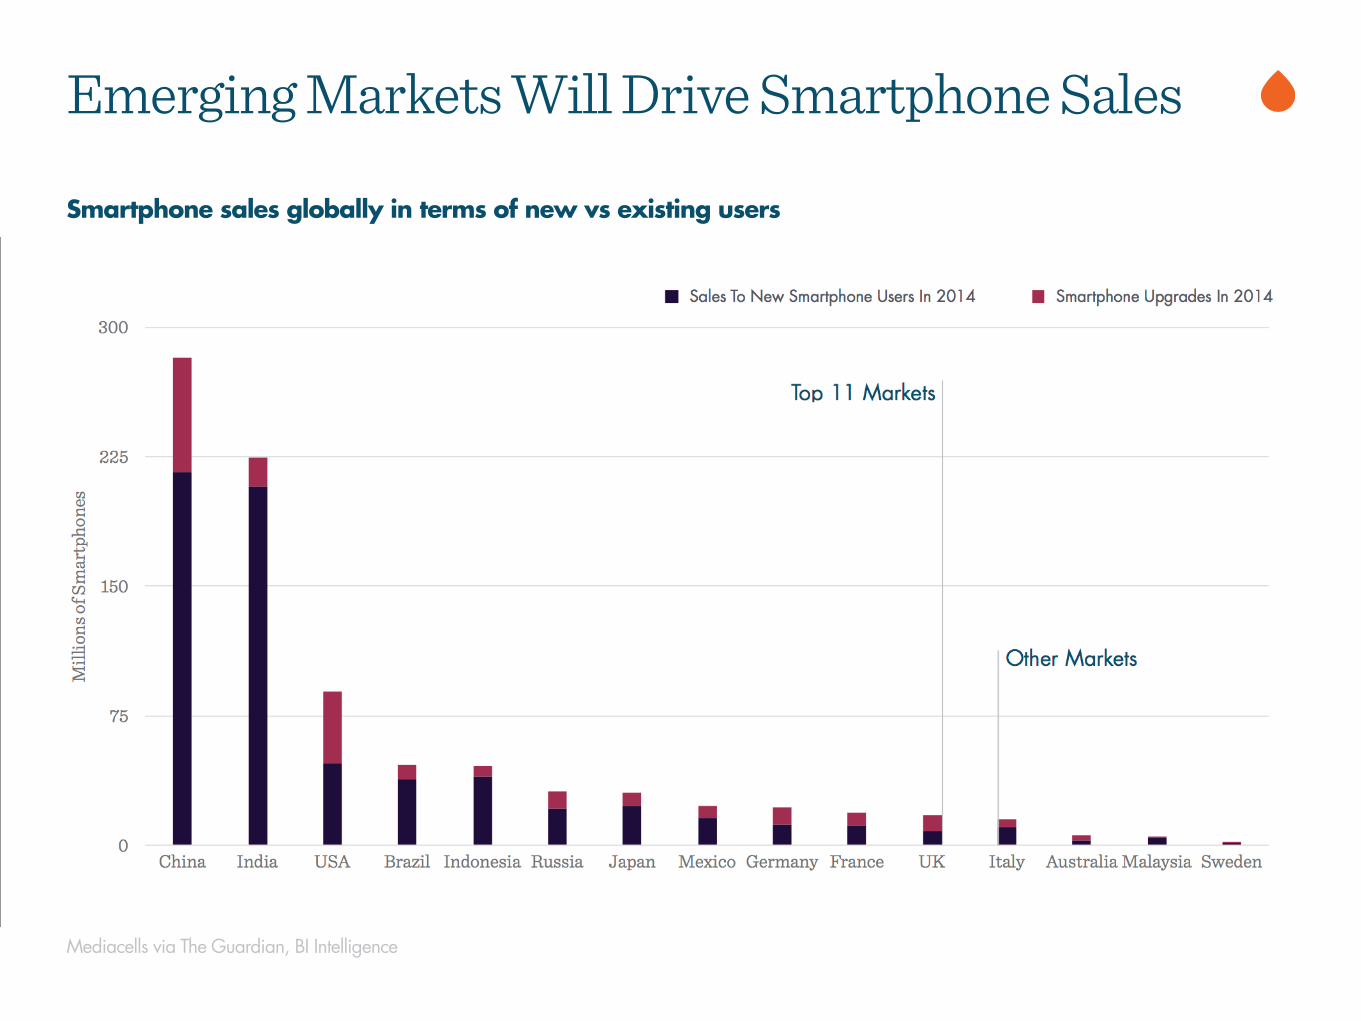
Mediacells via The Guardian, BI Intelligence
Smartphone sales globally in terms of new vs existing users
Emerging Markets Will Drive Smartphone Sales
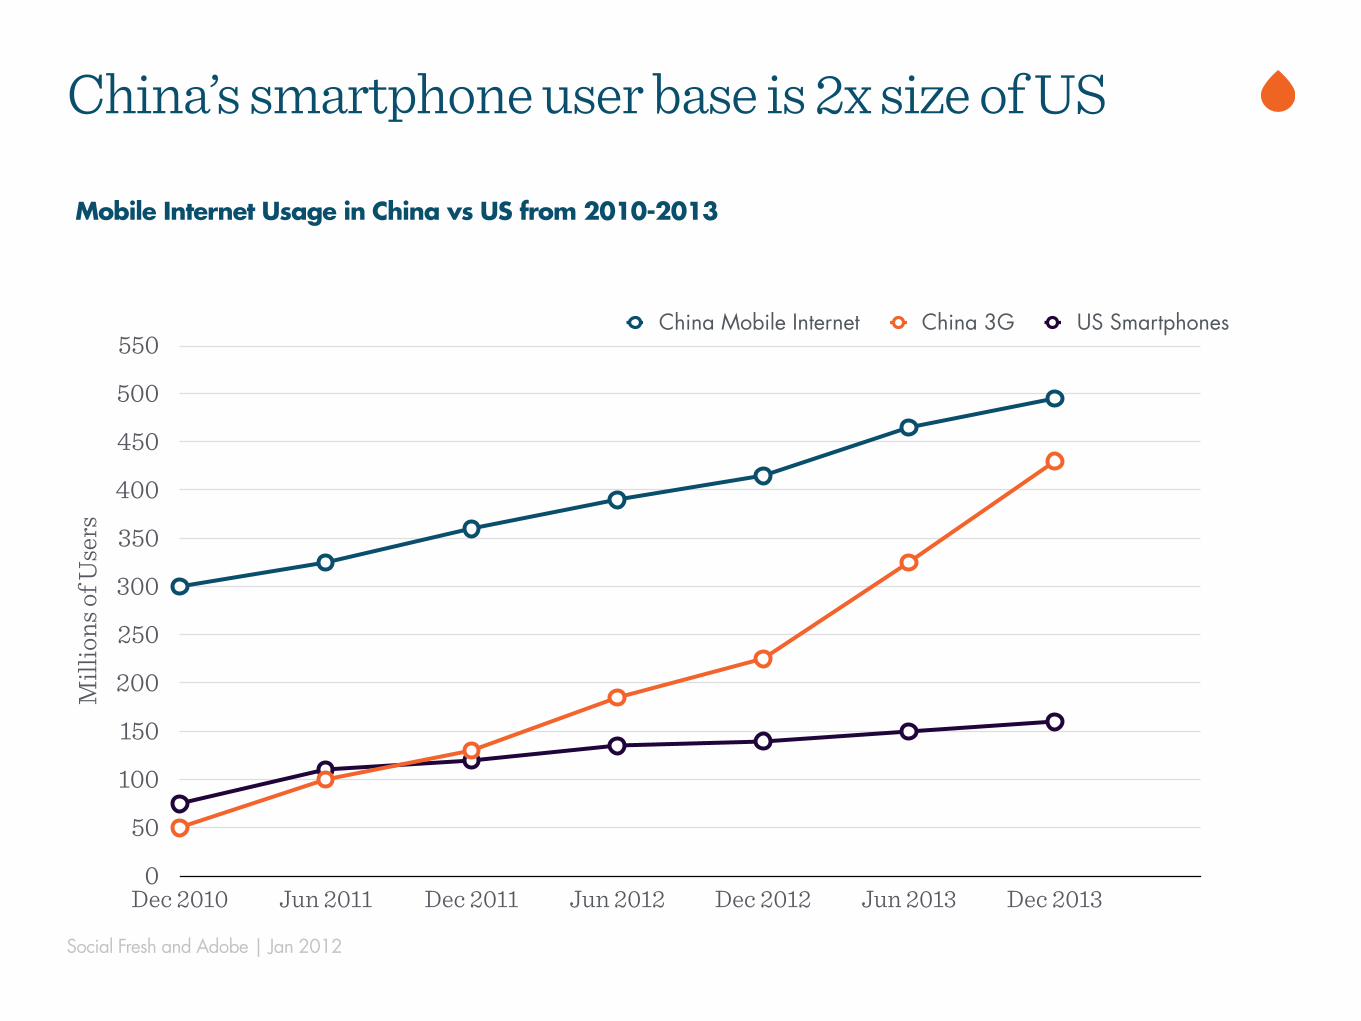
Social Fresh and Adobe | Jan 2012
Mobile Internet Usage in China vs US from 2010-2013
China’s smartphone user base is 2x size of USM
illio
ns o
f Use
rs
0
50
100
150
200
250
300
350
400
450
500
550
Dec 2010 Jun 2011 Dec 2011 Jun 2012 Dec 2012 Jun 2013 Dec 2013
China Mobile Internet China 3G US Smartphones
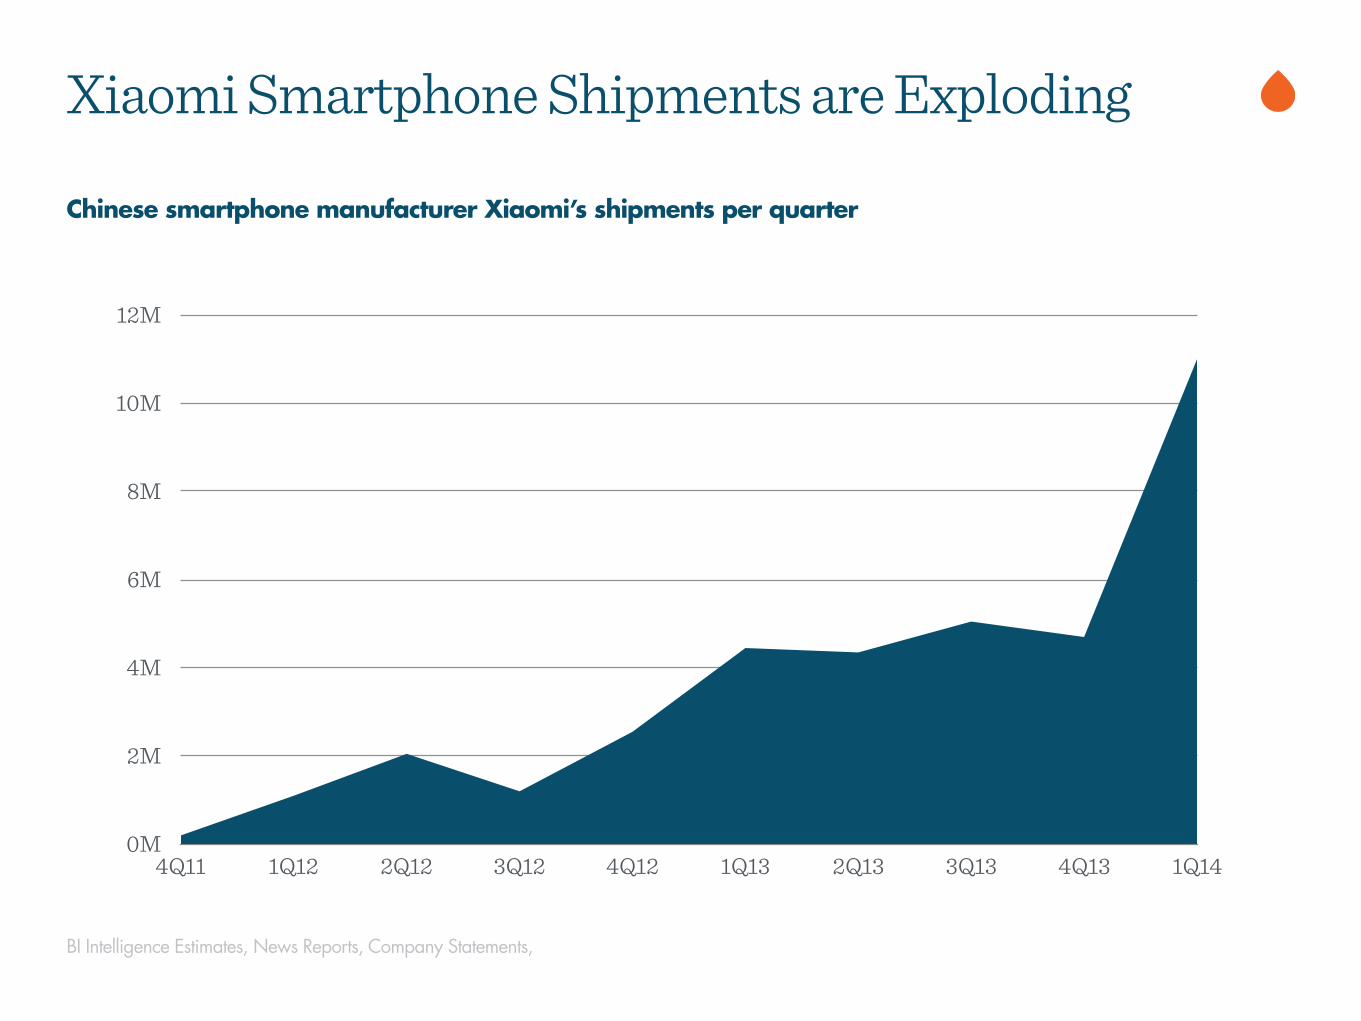
BI Intelligence Estimates, News Reports, Company Statements,
Chinese smartphone manufacturer Xiaomi’s shipments per quarter
Xiaomi Smartphone Shipments are ExplodingD
aily
Pho
to S
hare
s in
Mill
ions
0M
2M
4M
6M
8M
10M
12M
4Q11 1Q12 2Q12 3Q12 4Q12 1Q13 2Q13 3Q13 4Q13 1Q14
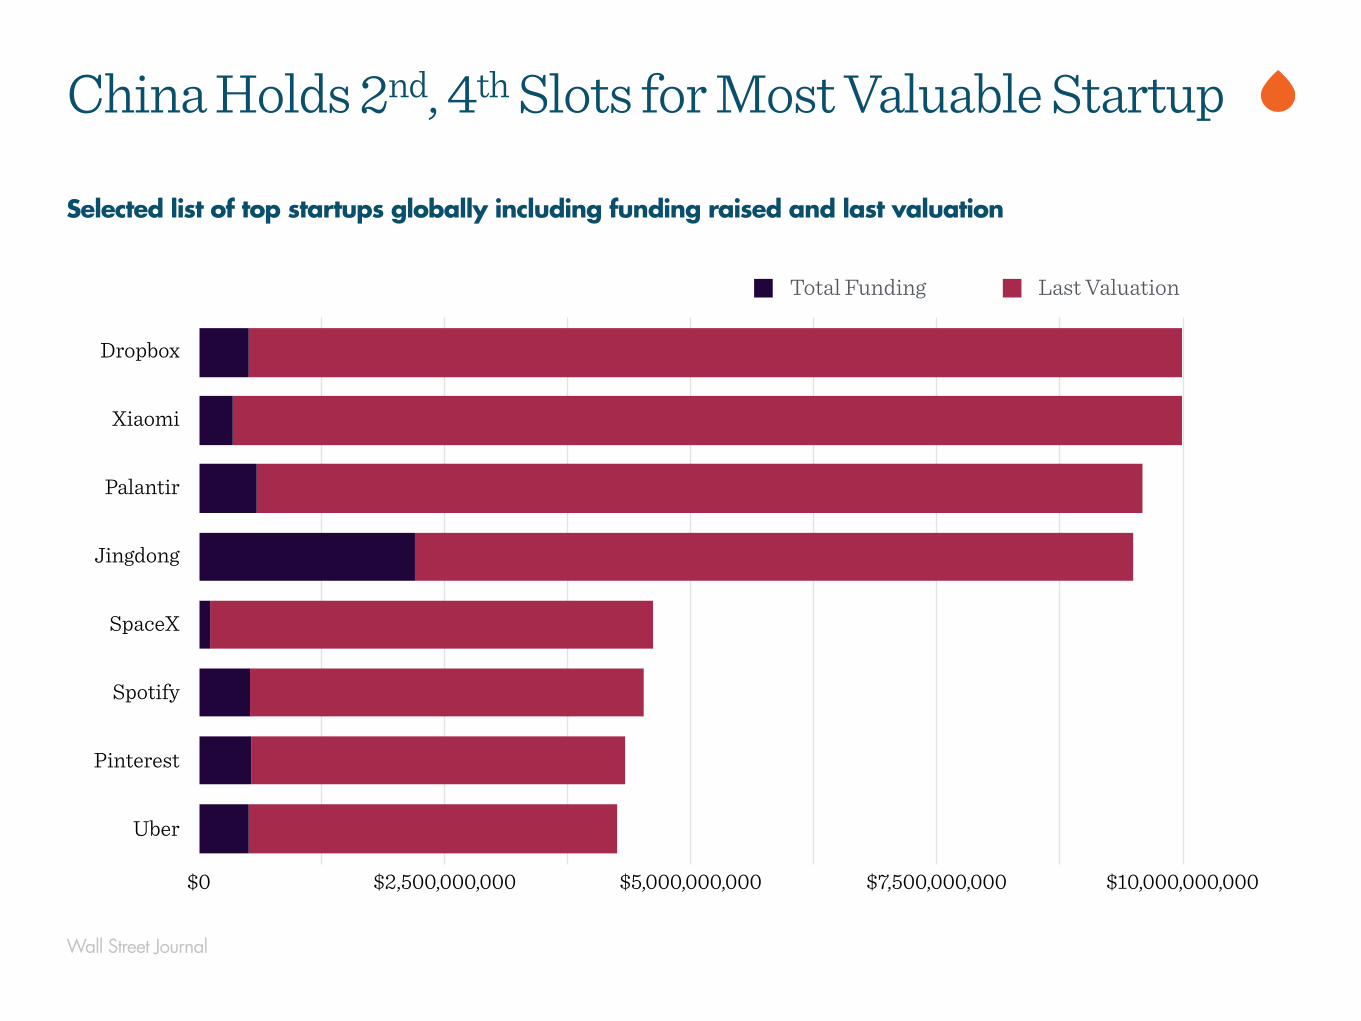
Wall Street Journal
China Holds 2nd, 4th Slots for Most Valuable Startup
Dropbox
Xiaomi
Palantir
Jingdong
SpaceX
Spotify
Uber
$0 $2,500,000,000 $5,000,000,000 $7,500,000,000 $10,000,000,000
Total Funding Last Valuation
Selected list of top startups globally including funding raised and last valuation
Dig
ital I
nfor
mat
ion
Cre
ated
& S
hare
d (z
etta
byte
s)
0
1
2
3
4
5
6
7
8
2005 2007 2009 2011 2013 2015E
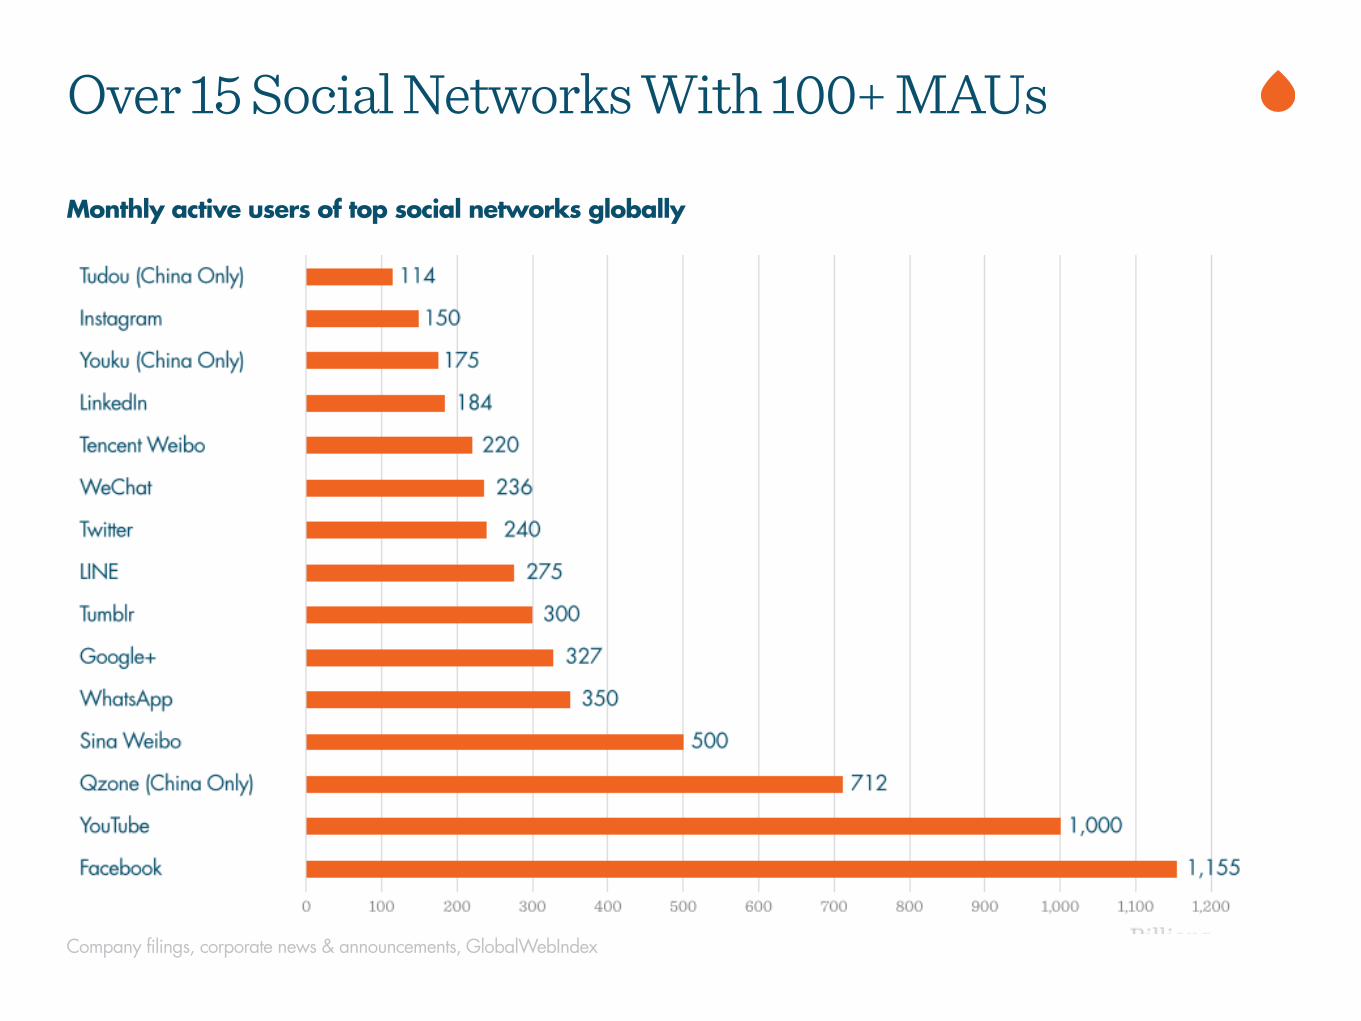
Company filings, corporate news & announcements, GlobalWebIndex
Monthly active users of top social networks globally
Over 15 Social Networks With 100+ MAUs
Dig
ital I
nfor
mat
ion
Cre
ated
& S
hare
d (z
etta
byte
s)
0
1
2
3
4
5
6
7
8
2005 2007 2009 2011 2013 2015E
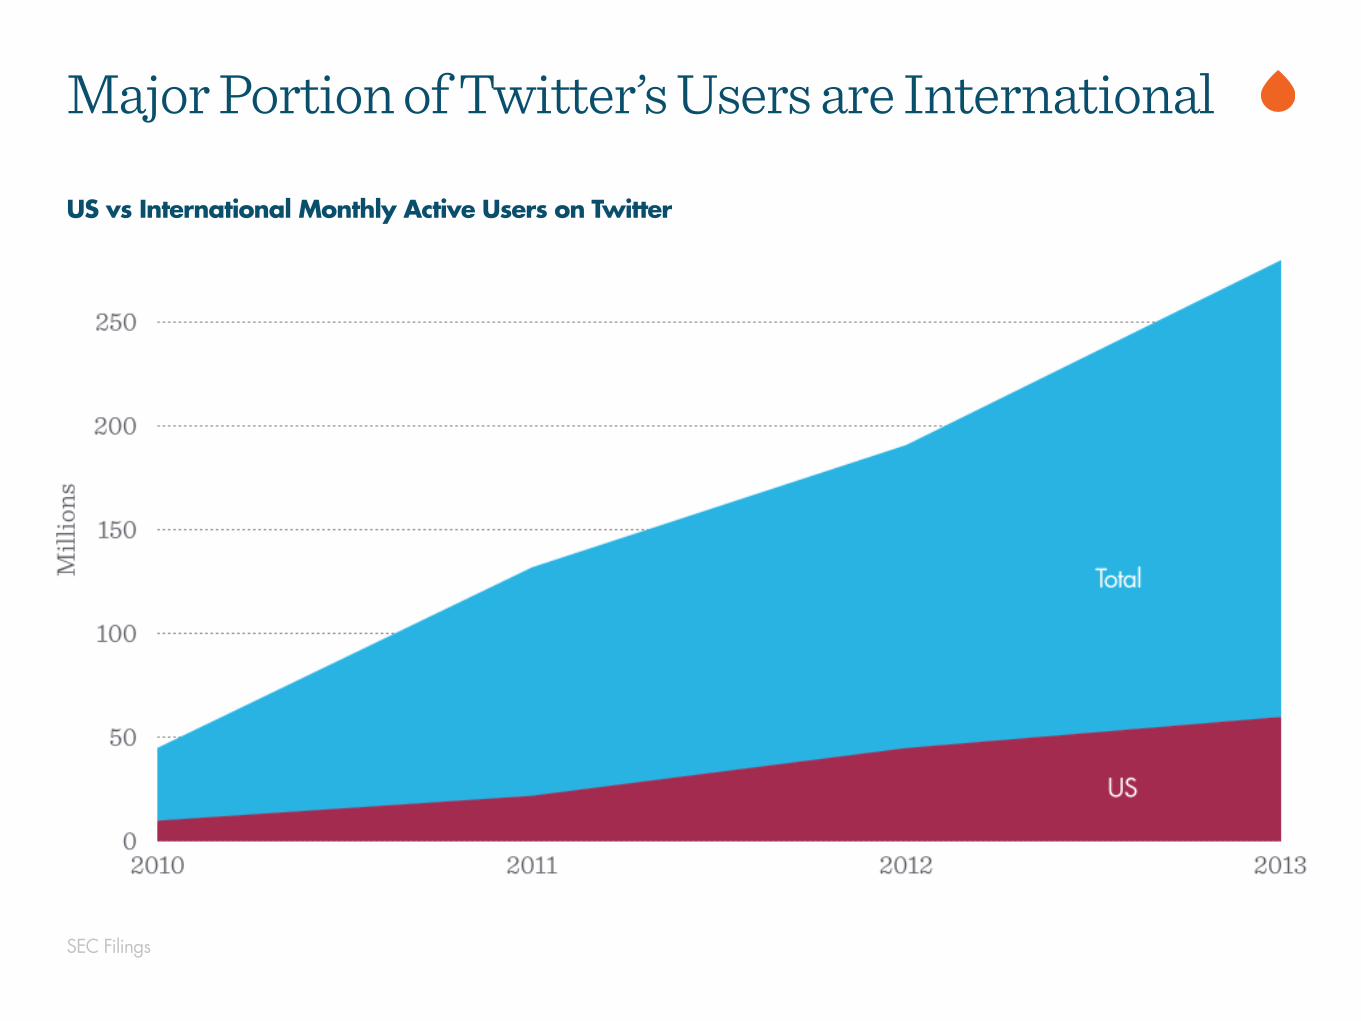
SEC Filings
US vs International Monthly Active Users on Twitter
Major Portion of Twitter’s Users are International

Content
Dig
ital I
nfor
mat
ion
Cre
ated
& S
hare
d (z
etta
byte
s)
0
1
2
3
4
5
6
7
8
2005 2007 2009 2011 2013 2015E
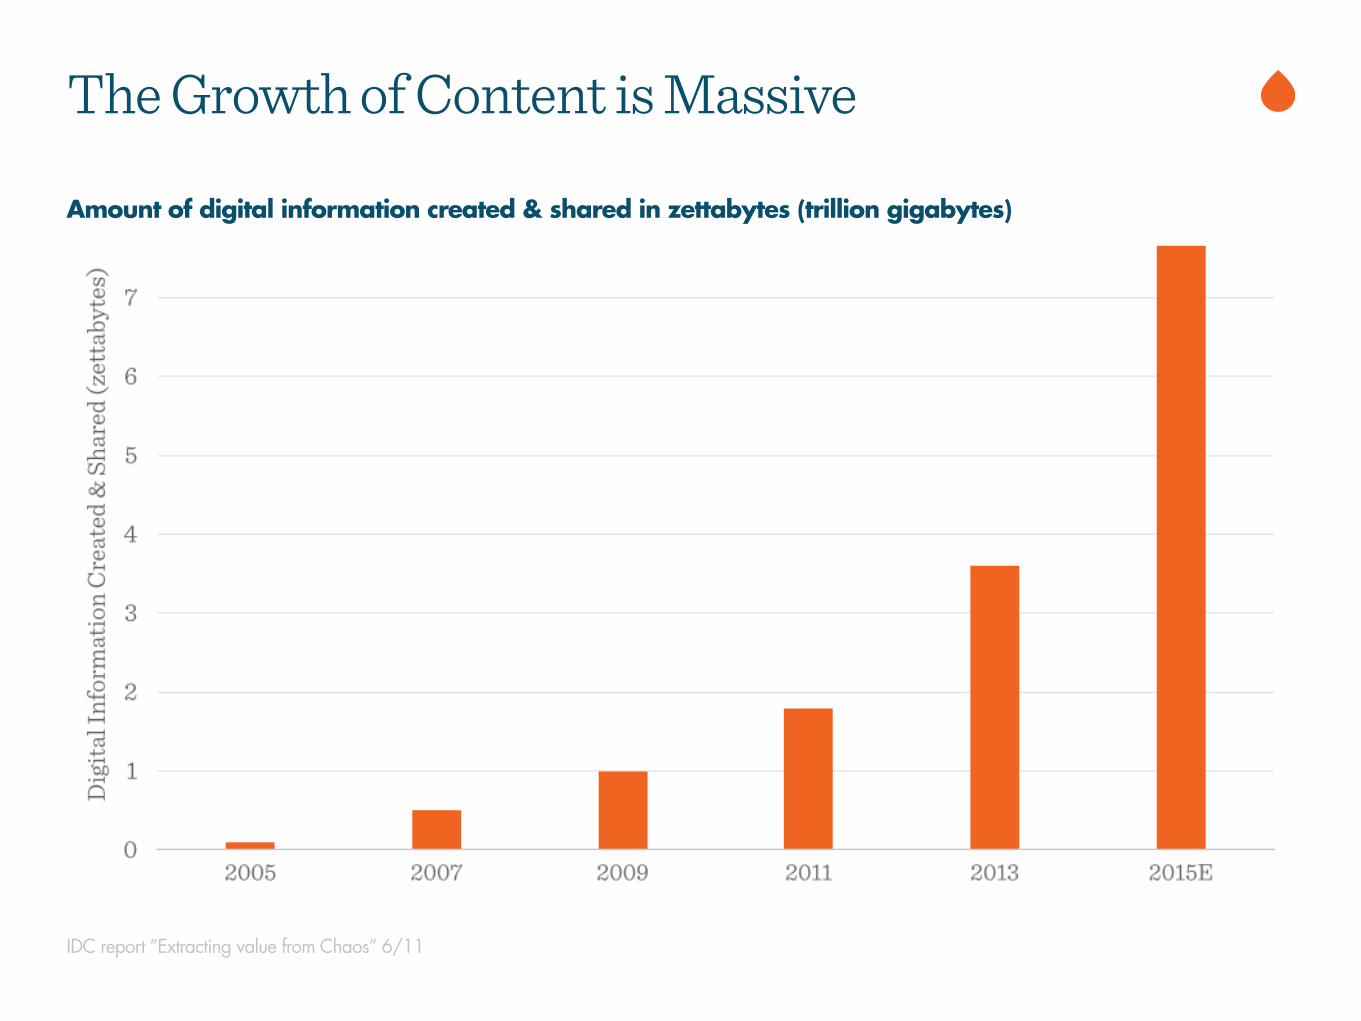
IDC report “Extracting value from Chaos” 6/11
Amount of digital information created & shared in zettabytes (trillion gigabytes)
The Growth of Content is Massive
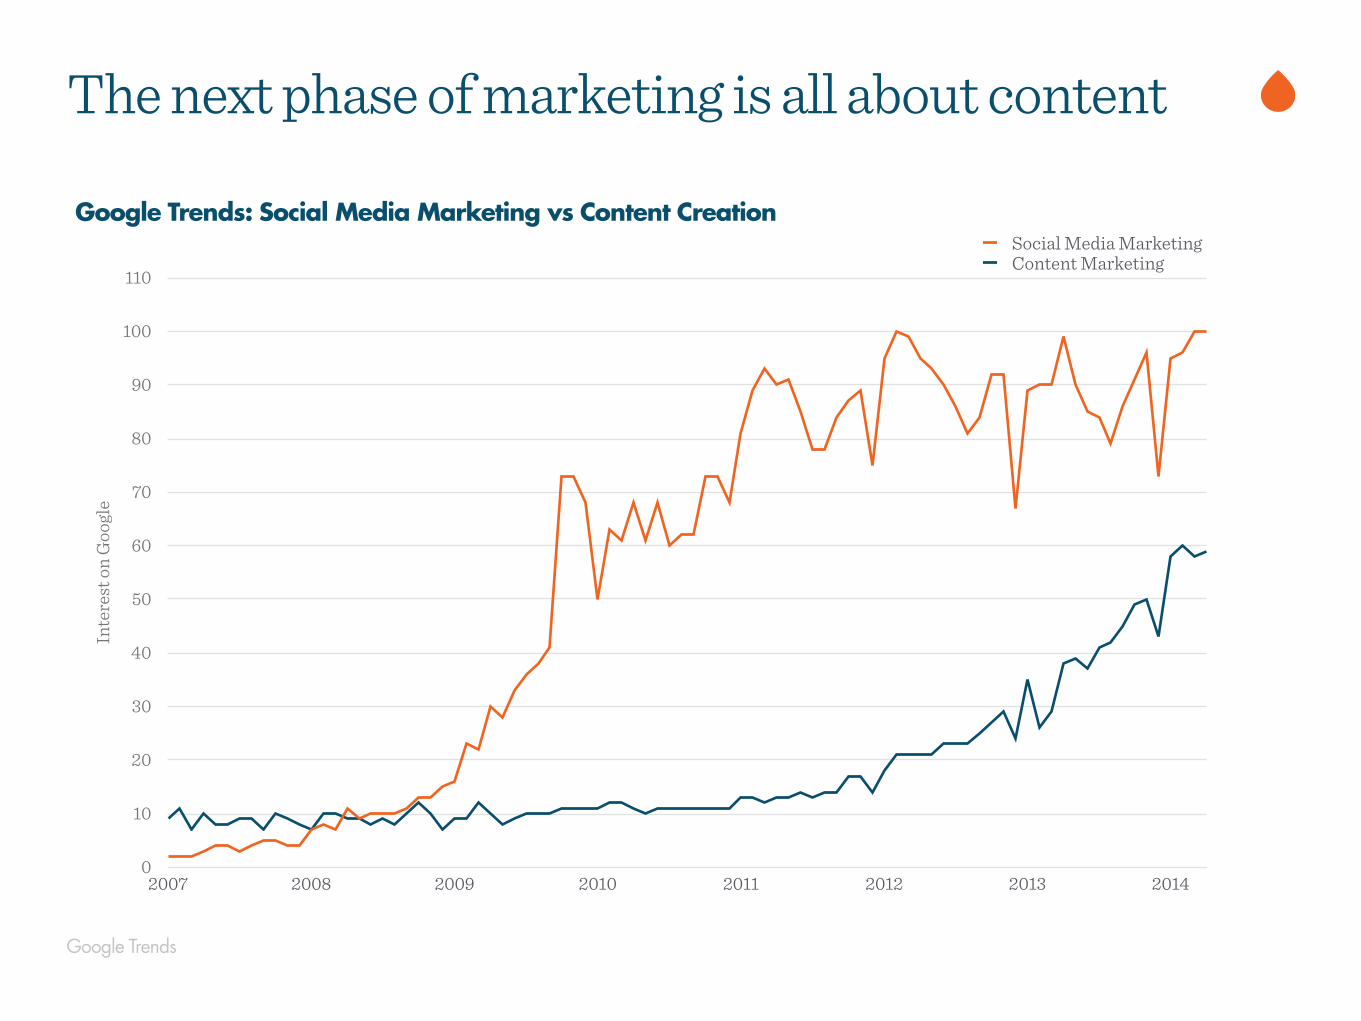
Google Trends
The next phase of marketing is all about contentIn
tere
st o
n G
oogl
e
0
10
20
30
40
50
60
70
80
90
100
110
2007 2008 2009 2010 2011 2012 2013 2014
Social Media MarketingContent Marketing
Google Trends: Social Media Marketing vs Content Creation
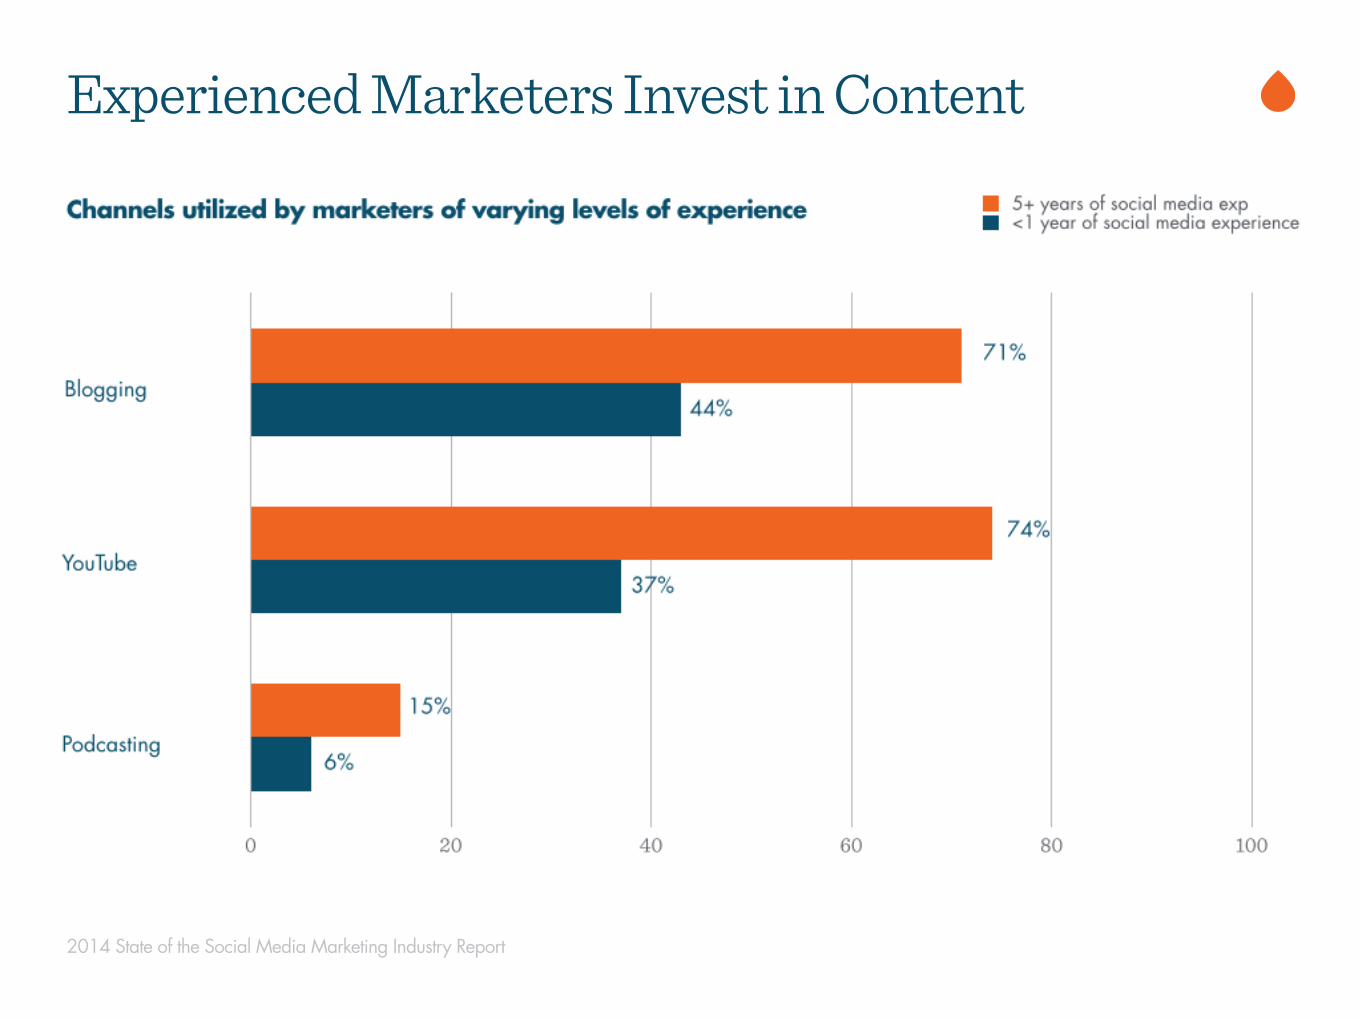
2014 State of the Social Media Marketing Industry Report
Labels go here, and are to be used at your discretion
Experienced Marketers Invest in Content
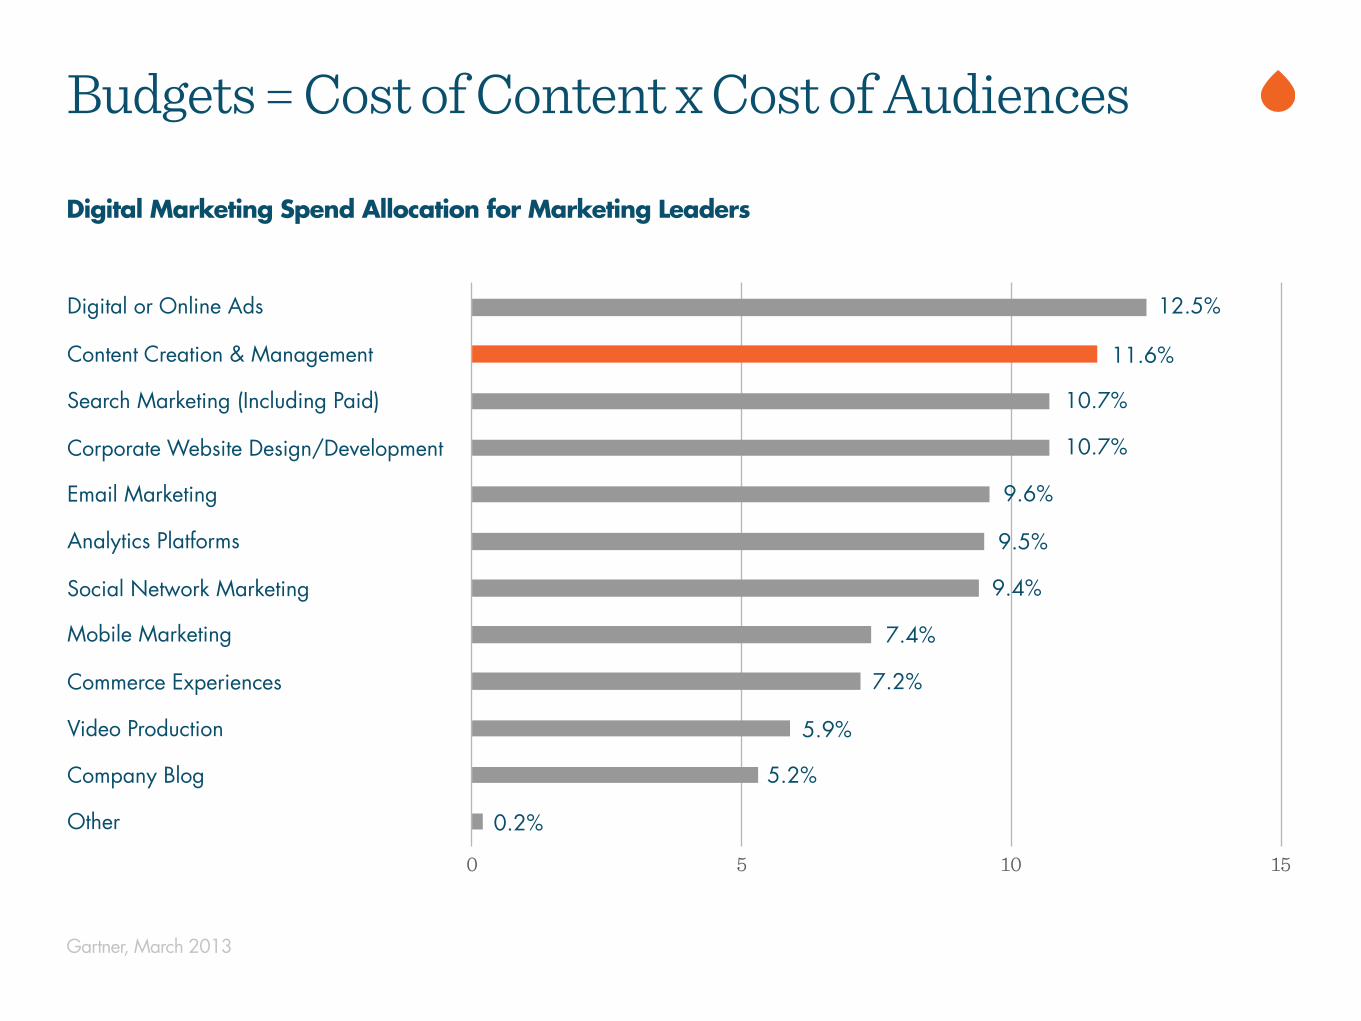
Budgets = Cost of Content x Cost of Audiences
Digital Marketing Spend Allocation for Marketing Leaders
Gartner, March 2013
0 5 10 15
Digital or Online Ads
Content Creation & Management
Search Marketing (Including Paid)
Corporate Website Design/Development
Email Marketing
Analytics Platforms
Social Network Marketing
Mobile Marketing
Commerce Experiences
Video Production
Company Blog
Other
11.6%
10.7%
10.7%
9.6%
9.5%
7.4%
7.2%
5.9%
0.2%
9.4%
5.2%
12.5%
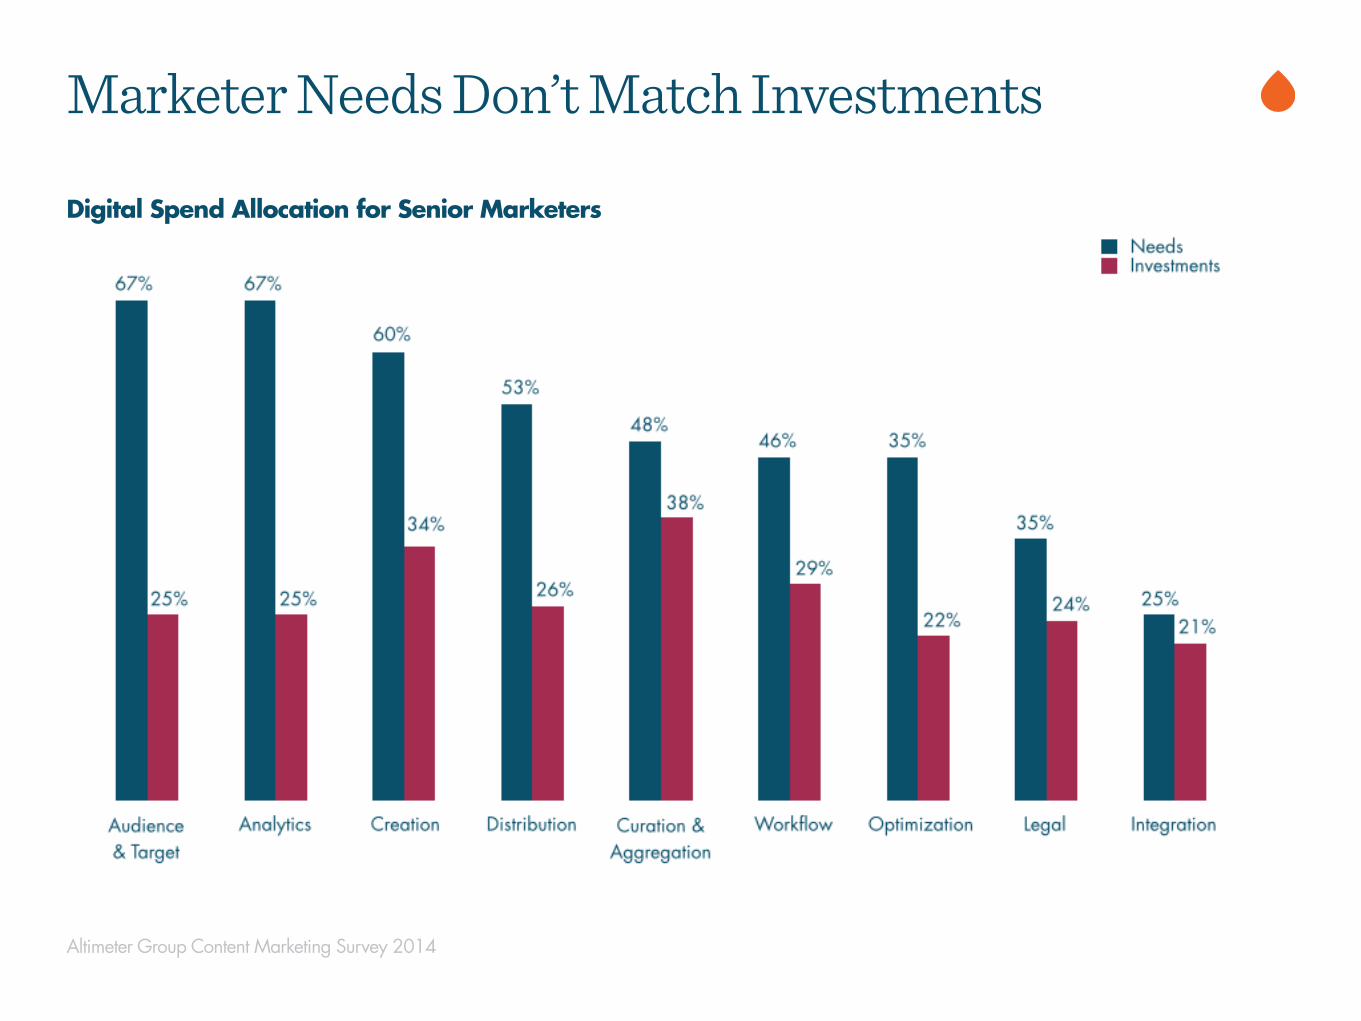
Altimeter Group Content Marketing Survey 2014
Marketer Needs Don’t Match Investments
Digital Spend Allocation for Senior Marketers
2014 State of Social Media Marketing Industry Report
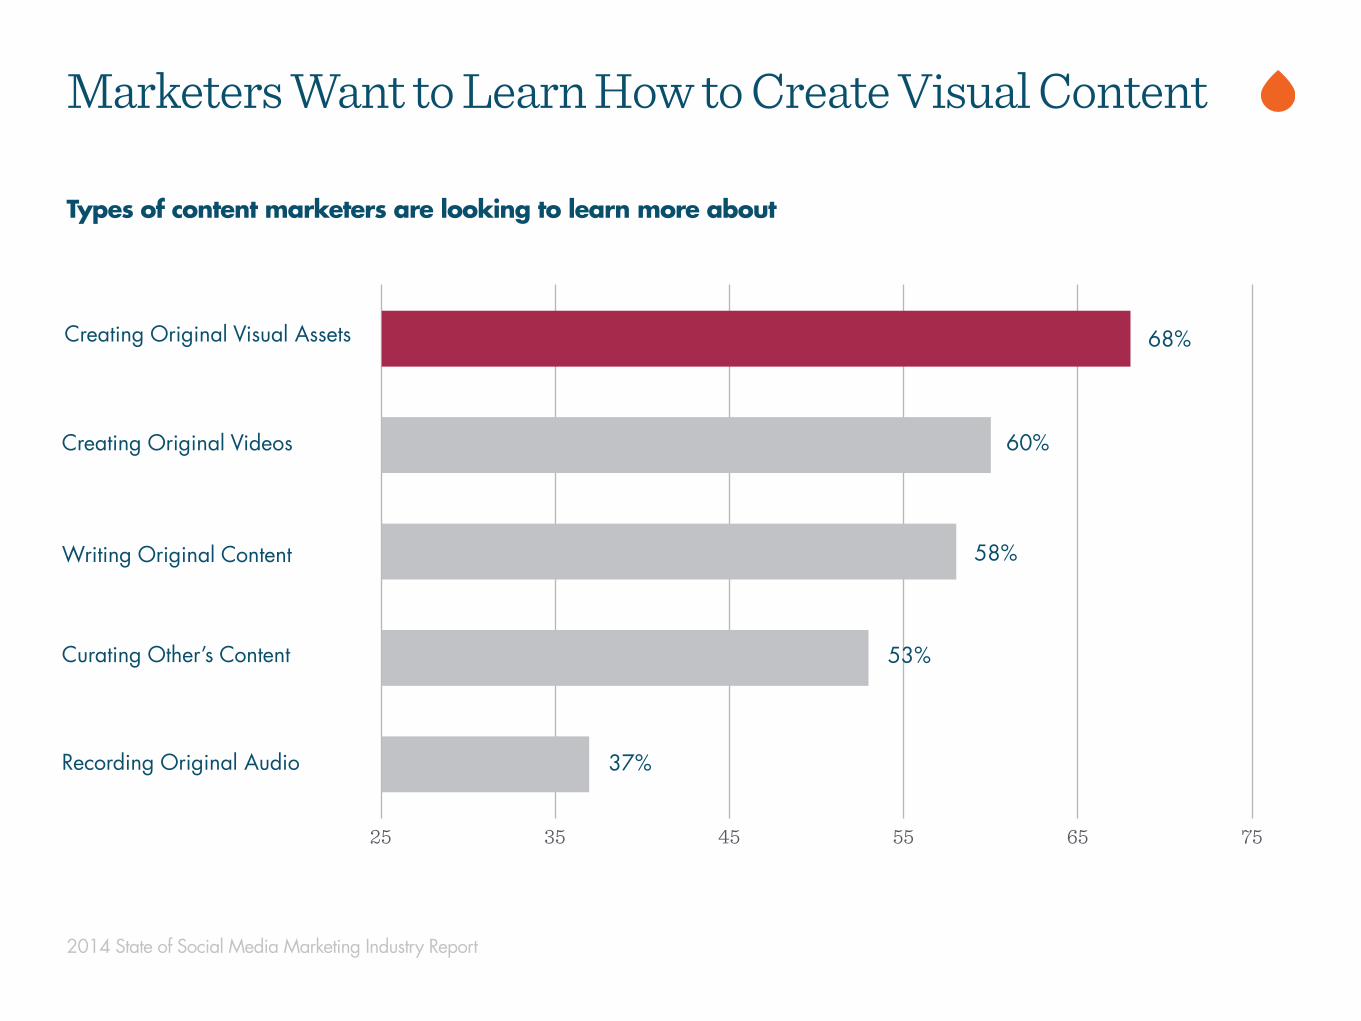
25 35 45 55 65 75
Writing Original Content
Creating Original Visual Assets
Recording Original Audio
68%
58%
60%
53%
37%
Creating Original Videos
Curating Other’s Content
Types of content marketers are looking to learn more about
Marketers Want to Learn How to Create Visual Content
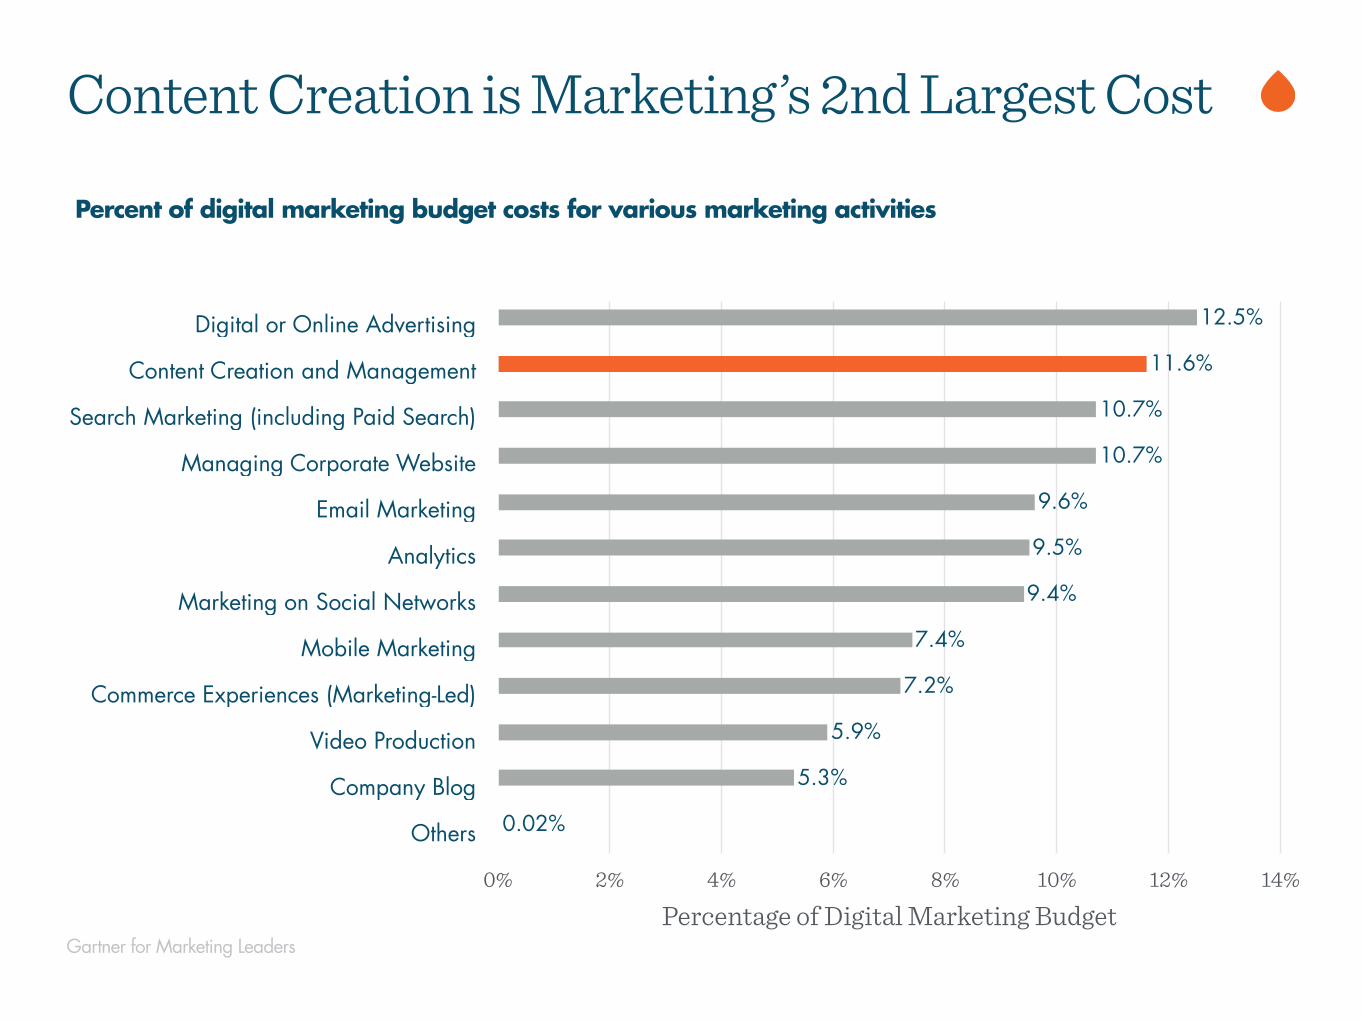
Percent of digital marketing budget costs for various marketing activities
Gartner for Marketing Leaders
Digital or Online Advertising
Content Creation and Management
Search Marketing (including Paid Search)
Managing Corporate Website
Email Marketing
Analytics
Marketing on Social Networks
Mobile Marketing
Commerce Experiences (Marketing-Led)
Video Production
Company Blog
Others
Percentage of Digital Marketing Budget0% 2% 4% 6% 8% 10% 12% 14%
0.02%
5.3%
5.9%
7.2%
7.4%
9.4%
9.5%
9.6%
10.7%
10.7%
11.6%
12.5%
Content Creation is Marketing’s 2nd Largest Cost
Sporting News Media, Kantar Media Sports, Sports Business Group, BI Intelligence
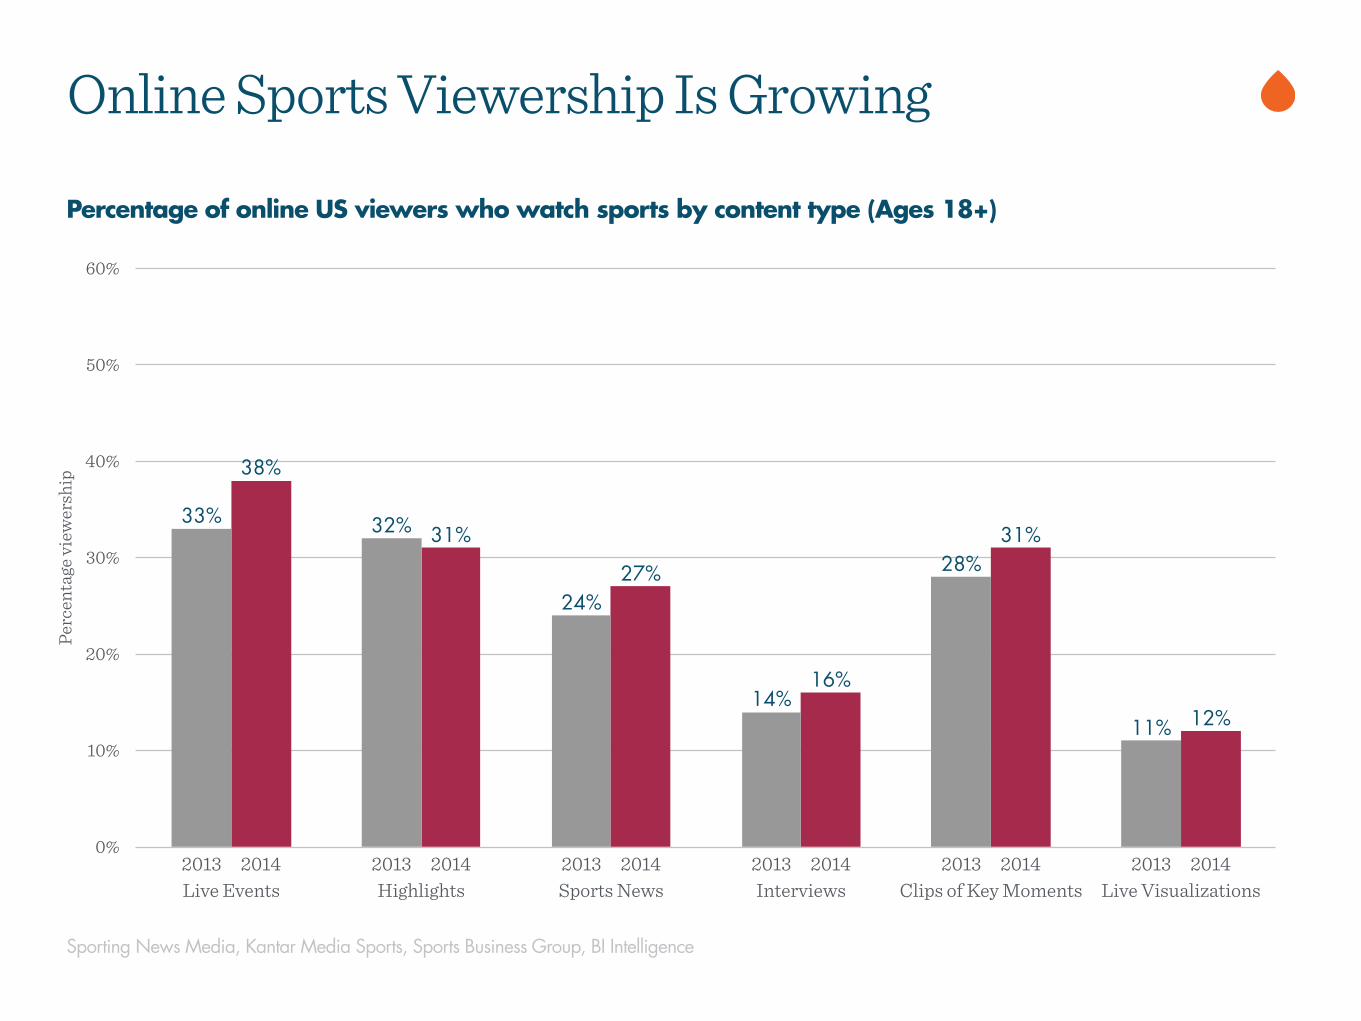
Percentage of online US viewers who watch sports by content type (Ages 18+)
Online Sports Viewership Is GrowingPe
rcen
tage
view
ersh
ip
0%
10%
20%
30%
40%
50%
60%
Live Events Highlights Sports News Interviews Clips of Key Moments Live Visualizations 2013 2014 2013 2014 2013 2014 2013 2014 2013 2014 2013 2014
12%
31%
16%
27%
31%
38%
11%
28%
14%
24%
32%33%
Marketing/Technology
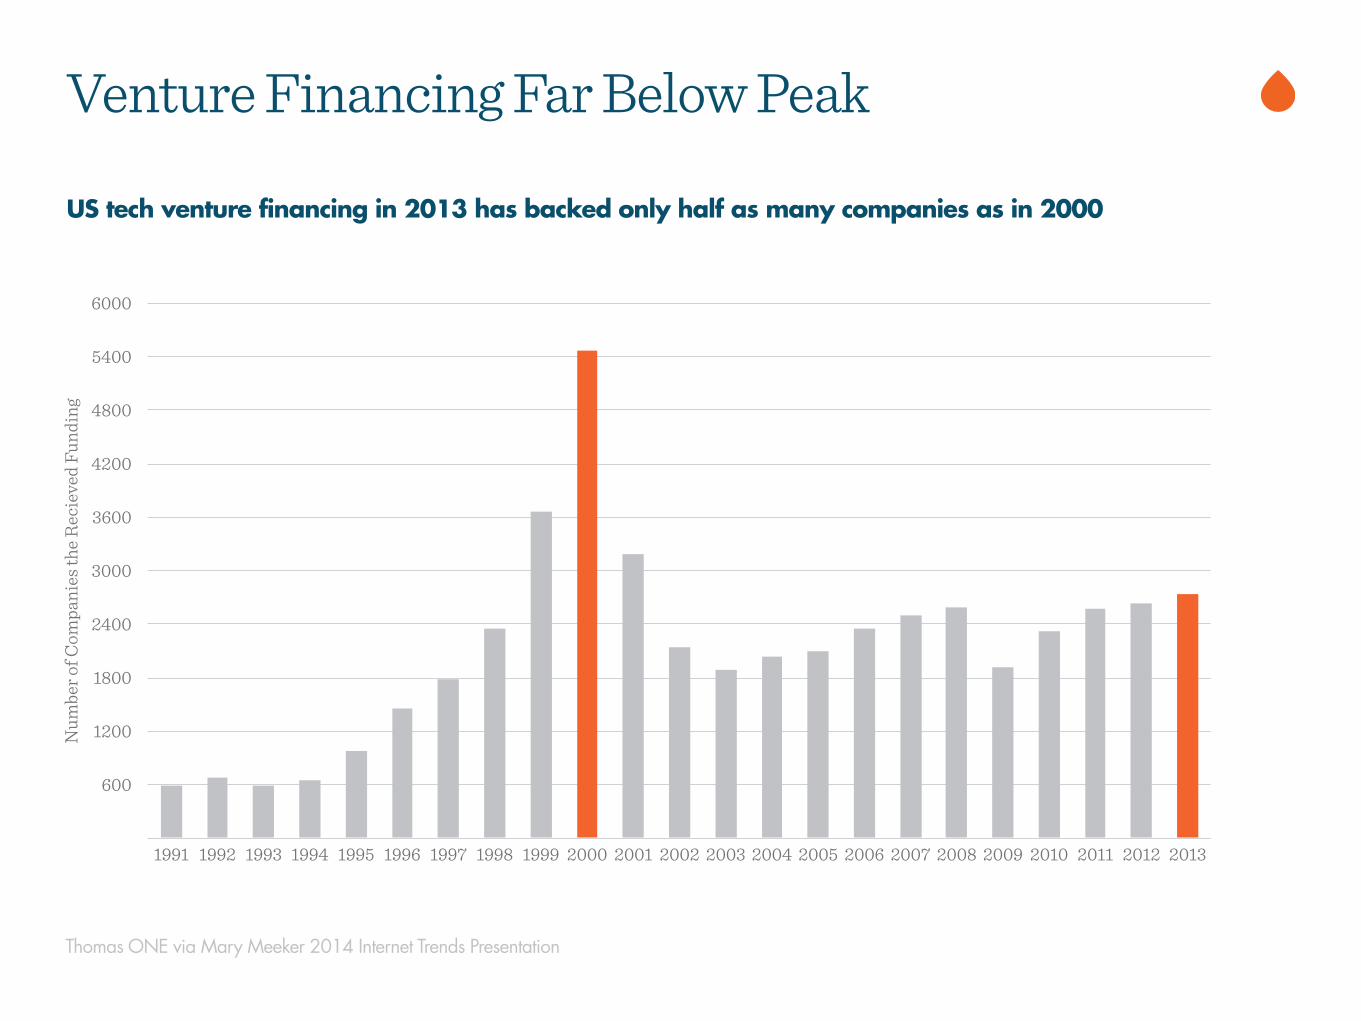
US tech venture financing in 2013 has backed only half as many companies as in 2000
Venture Financing Far Below Peak
Thomas ONE via Mary Meeker 2014 Internet Trends Presentation
Num
ber o
f Com
pani
es th
e Rec
ieve
d Fu
ndin
g
600
1200
1800
2400
3000
3600
4200
4800
5400
6000
1991 1992 1993 1994 1995 1996 1997 1998 1999 2000 2001 2002 2003 2004 2005 2006 2007 2008 2009 2010 2011 2012 2013
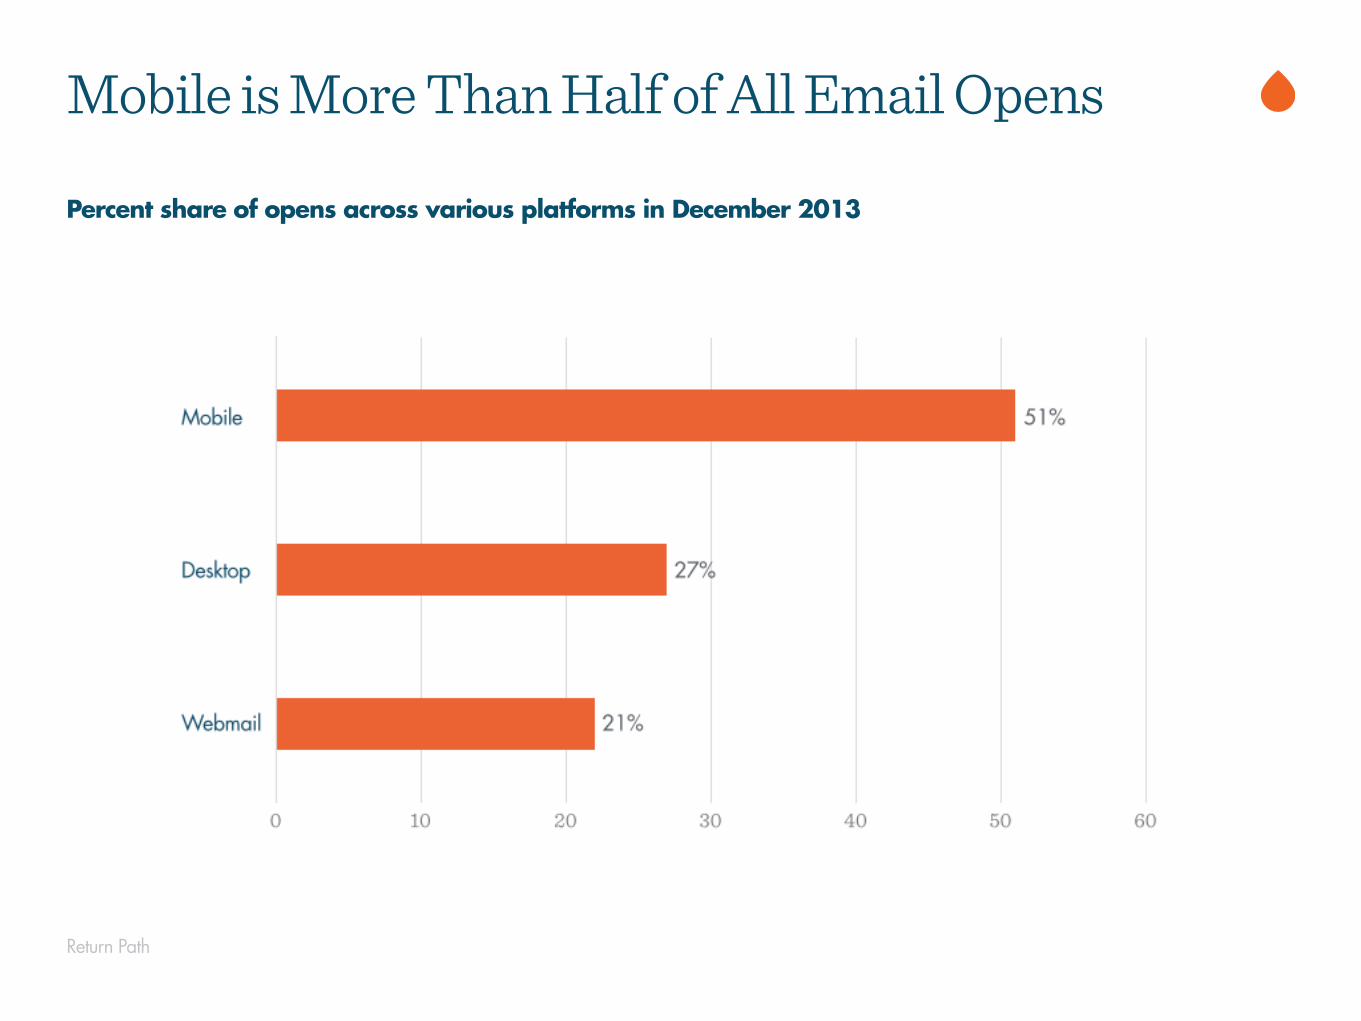
Return Path
Percent share of opens across various platforms in December 2013
Mobile is More Than Half of All Email Opens
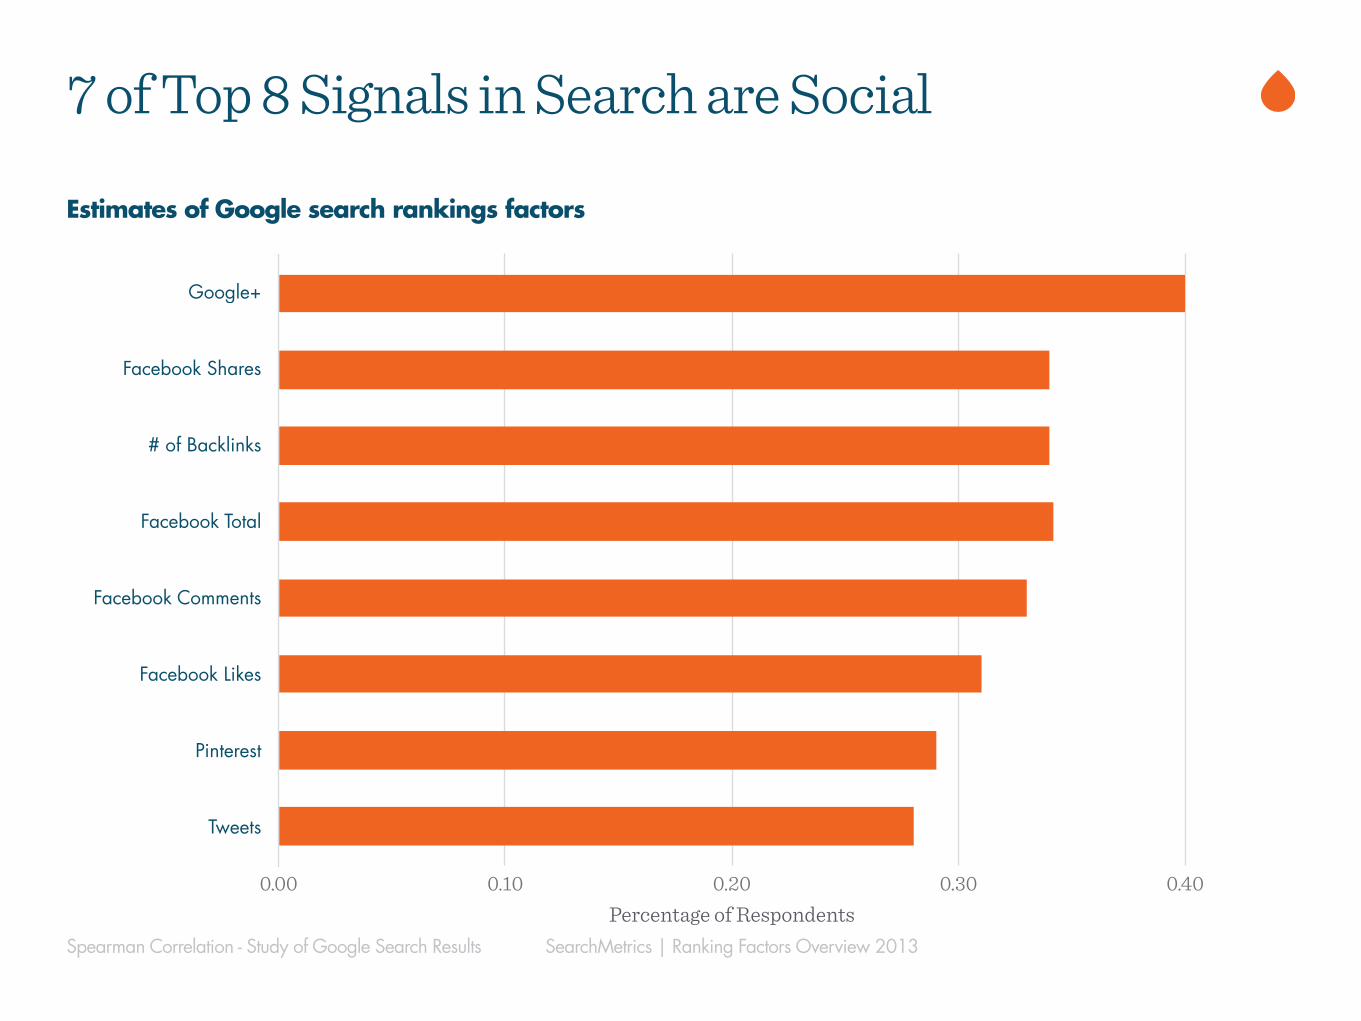
Spearman Correlation - Study of Google Search Results SearchMetrics | Ranking Factors Overview 2013
Estimates of Google search rankings factors
7 of Top 8 Signals in Search are Social
Google+
Facebook Shares
# of Backlinks
Facebook Total
Facebook Comments
Facebook Likes
Tweets
Percentage of Respondents0.00 0.10 0.20 0.30 0.40
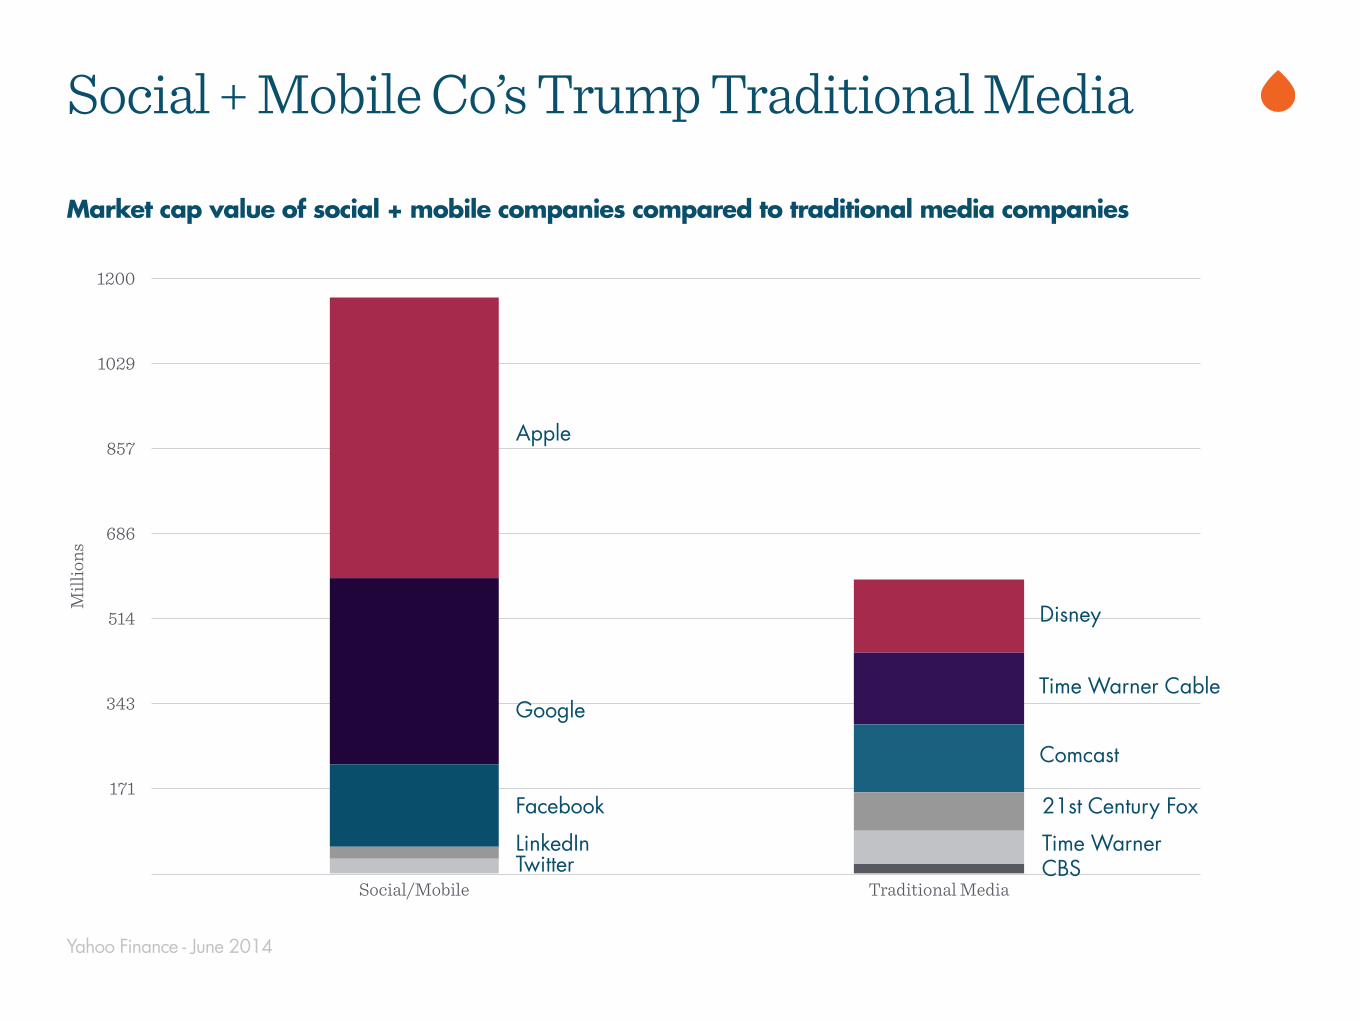
Yahoo Finance - June 2014
Market cap value of social + mobile companies compared to traditional media companies
Social + Mobile Co’s Trump Traditional MediaM
illio
ns
171
343
514
686
857
1029
1200
Social/Mobile Traditional Media
FacebookLinkedInTwitter
Comcast
Disney
Time Warner21st Century Fox
Time Warner Cable
CBS
Apple
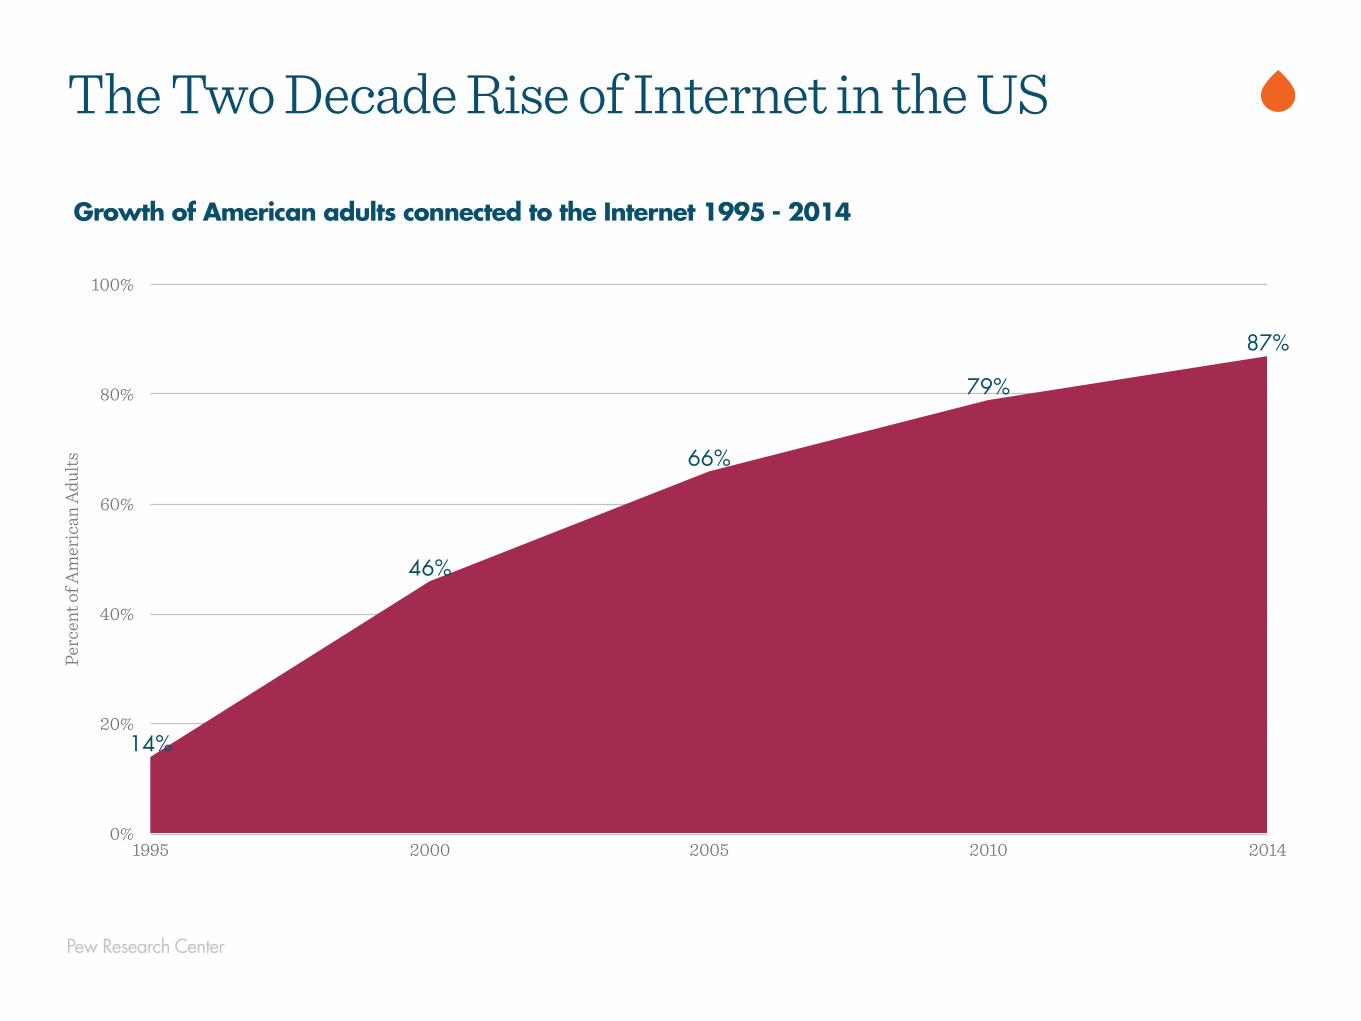
Pew Research Center
Growth of American adults connected to the Internet 1995 - 2014
The Two Decade Rise of Internet in the USPe
rcen
t of A
mer
ican
Adu
lts
0%
20%
40%
60%
80%
100%
1995 2000 2005 2010 2014
14%
46%
66%
79%
87%
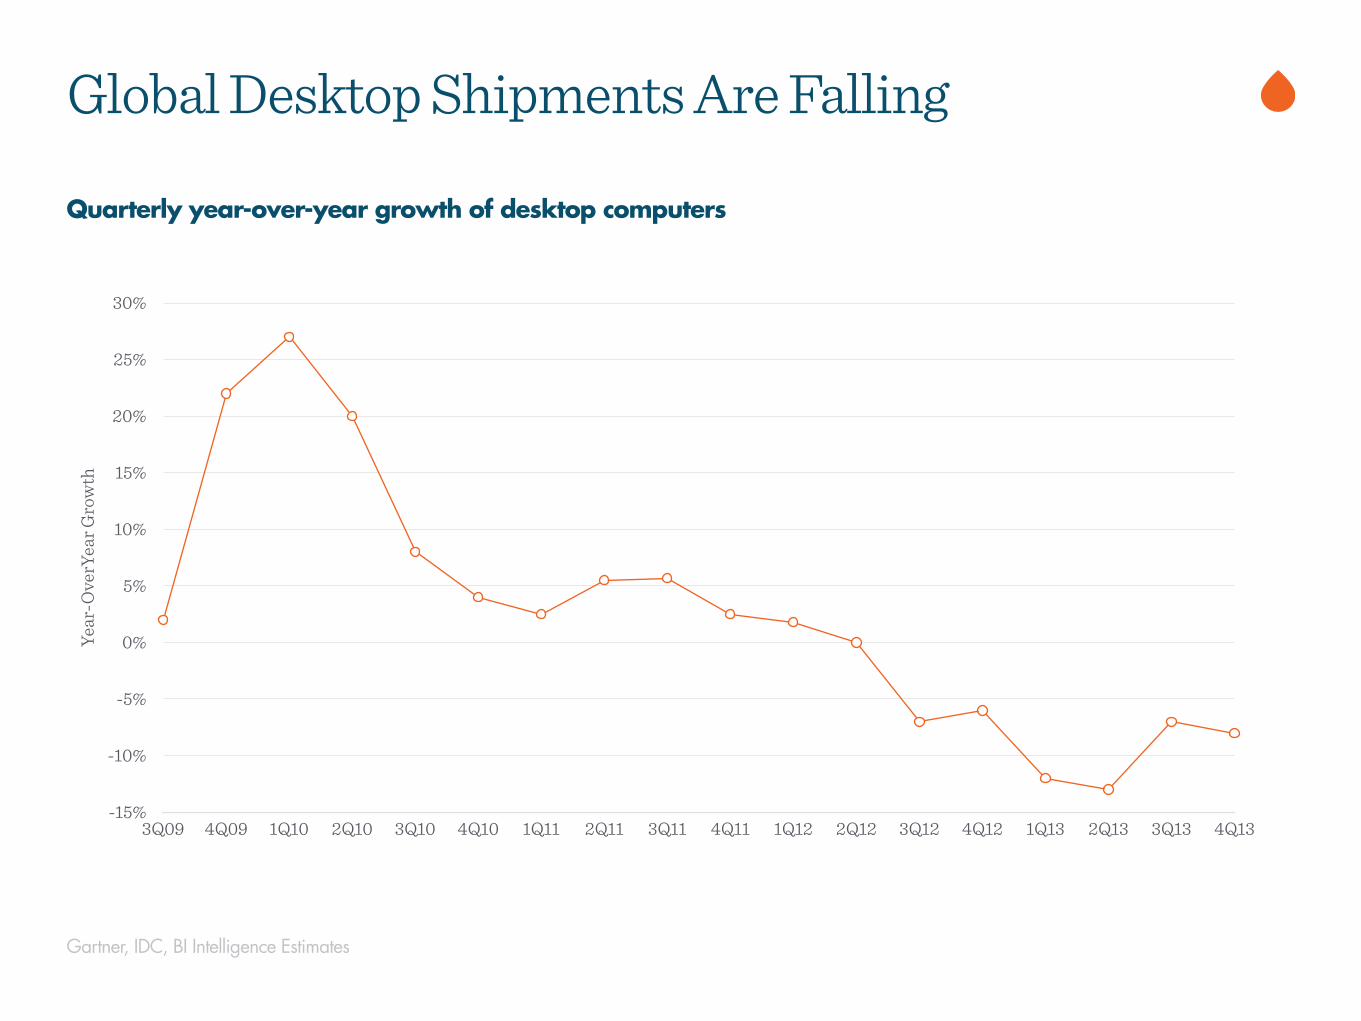
Year
-Ove
rYea
r Gro
wth
-15%
-10%
-5%
0%
5%
10%
15%
20%
25%
30%
3Q09 4Q09 1Q10 2Q10 3Q10 4Q10 1Q11 2Q11 3Q11 4Q11 1Q12 2Q12 3Q12 4Q12 1Q13 2Q13 3Q13 4Q13
Global Desktop Shipments Are Falling
Quarterly year-over-year growth of desktop computers
Gartner, IDC, BI Intelligence Estimates
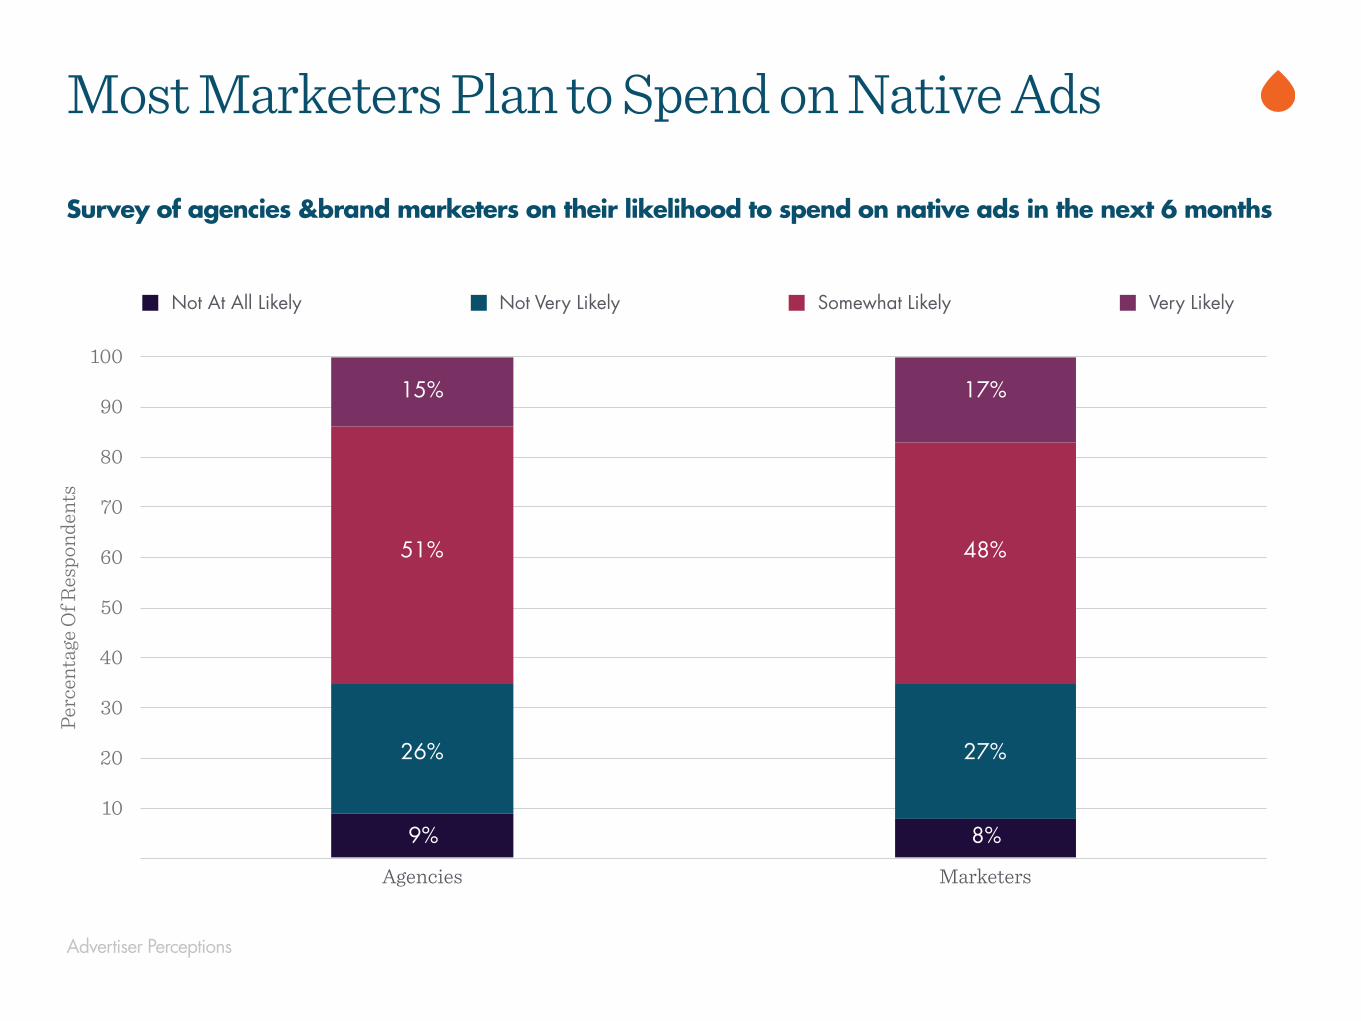
Most Marketers Plan to Spend on Native AdsPe
rcen
tage
Of R
espo
nden
ts
10
20
30
40
50
60
70
80
90
100
Agencies Marketers
Not At All Likely Not Very Likely Somewhat Likely Very Likely
Advertiser Perceptions
Survey of agencies &brand marketers on their likelihood to spend on native ads in the next 6 months
9%
26%
15%
51%
8%
27%
17%
48%
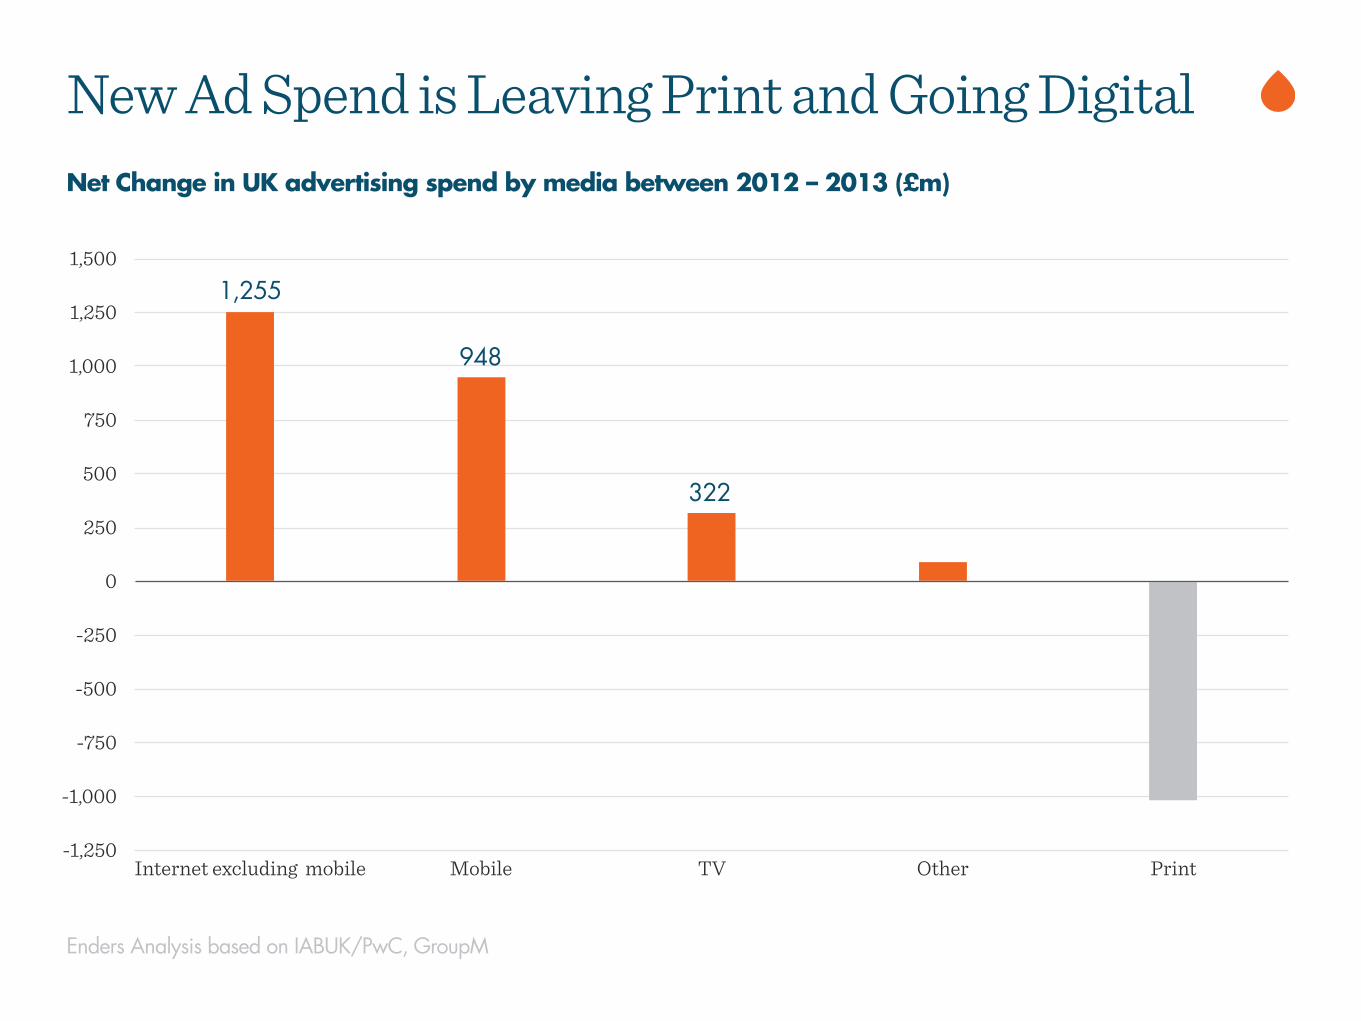
-1,250
-1,000
-750
-500
-250
0
250
500
750
1,000
1,250
1,500
Internet excluding mobile Mobile TV Other Print
Enders Analysis based on IABUK/PwC, GroupM
Net Change in UK advertising spend by media between 2012 – 2013 (£m)
New Ad Spend is Leaving Print and Going Digital
1,255
948
322
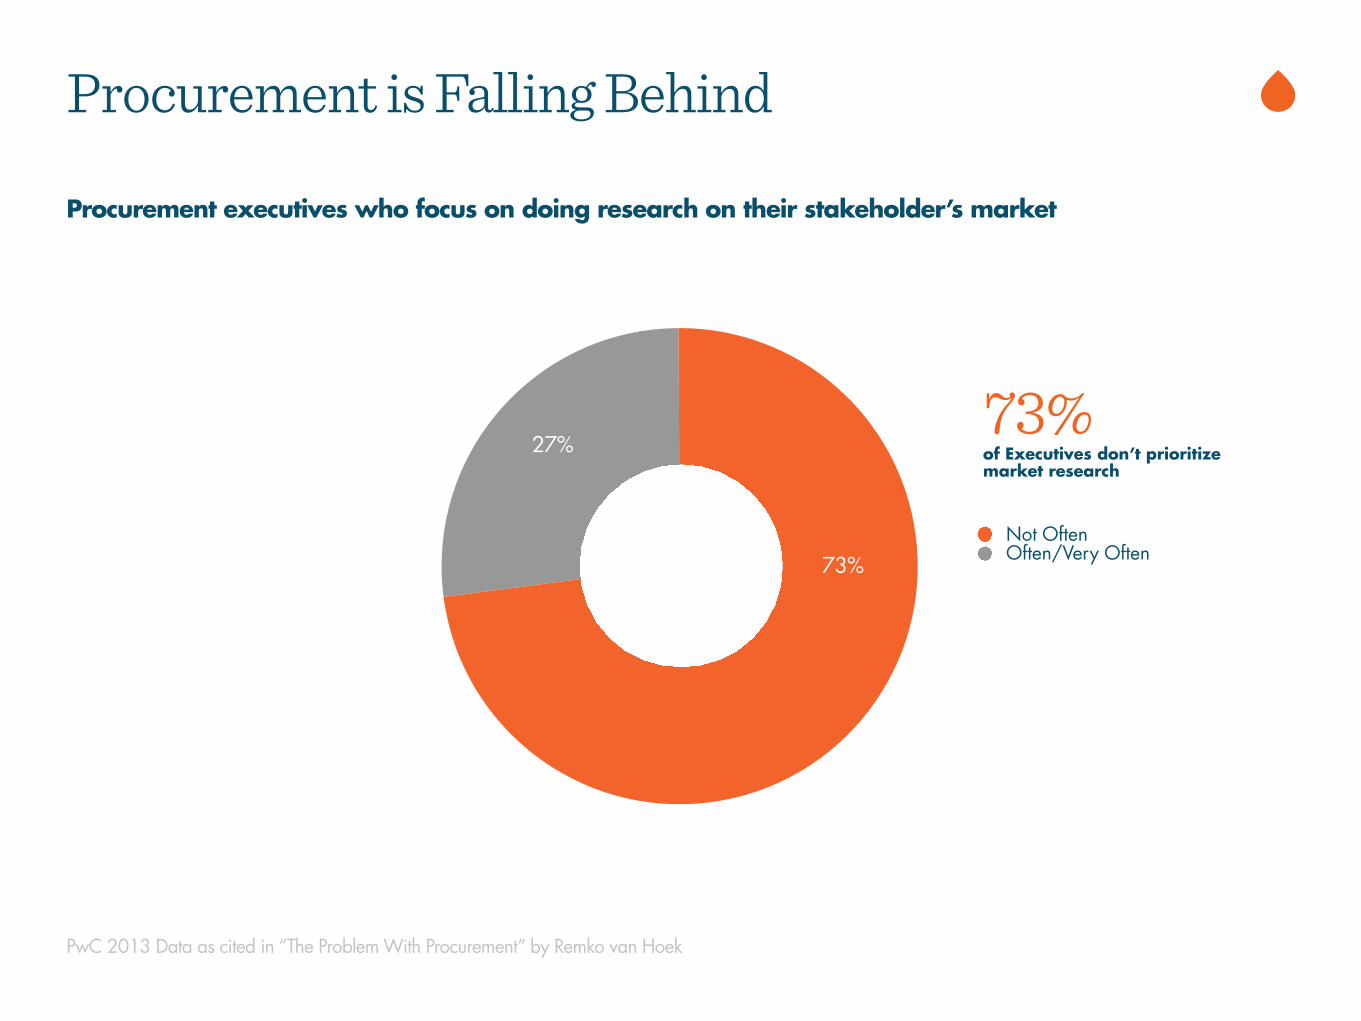
Not OftenOften/Very Often
Procurement executives who focus on doing research on their stakeholder’s market
Procurement is Falling Behind
73%
27%
PwC 2013 Data as cited in “The Problem With Procurement” by Remko van Hoek
73%of Executives don’t prioritize market research
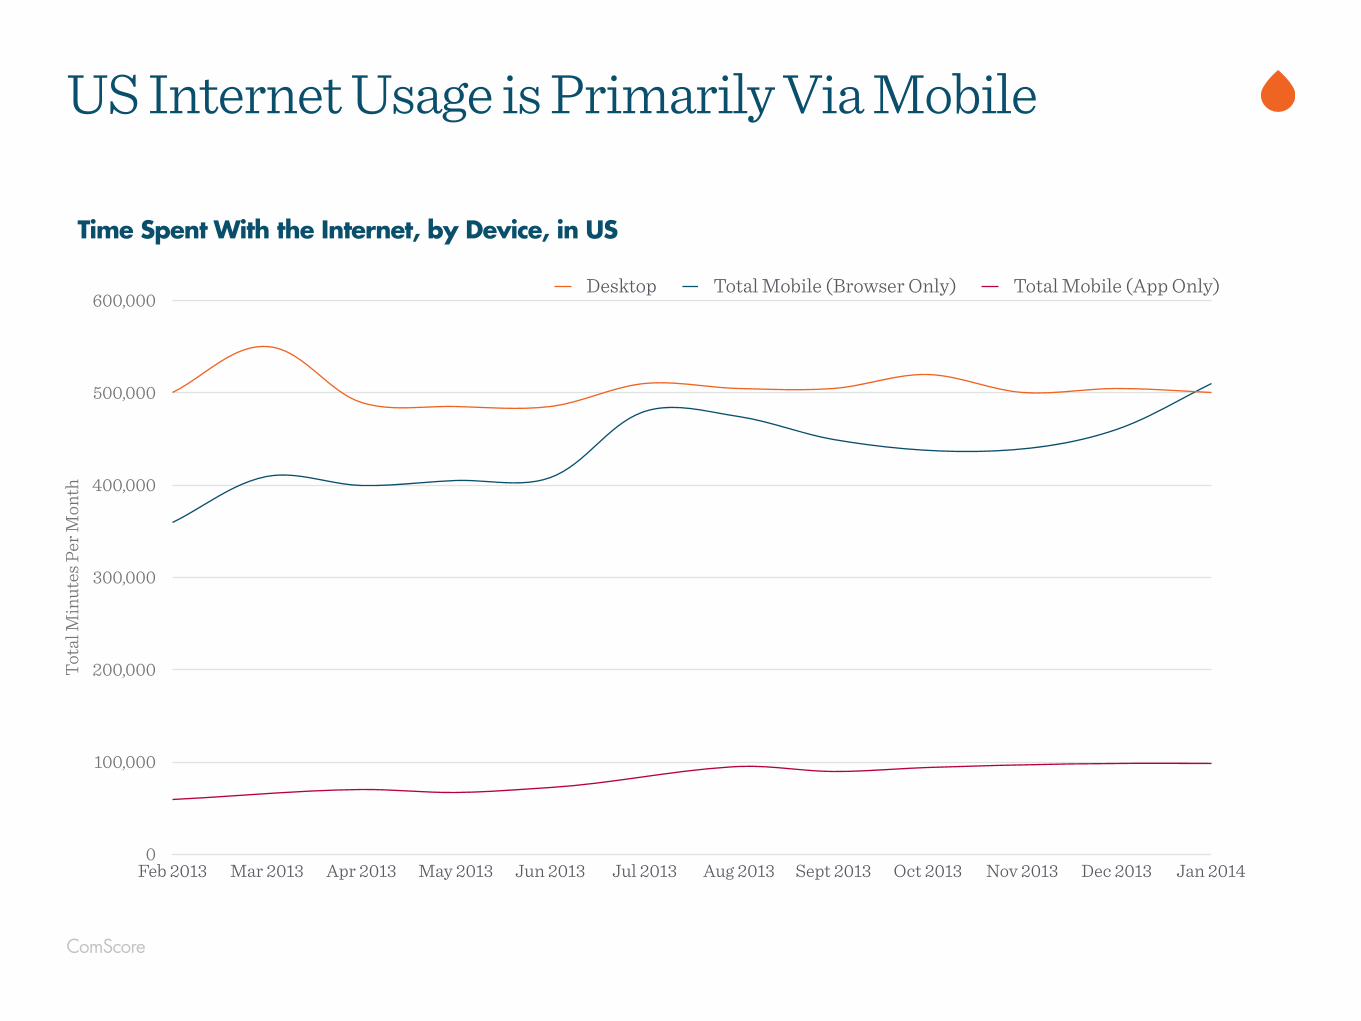
ComScore
US Internet Usage is Primarily Via MobileTo
tal M
inut
es P
er M
onth
0
100,000
200,000
300,000
400,000
500,000
600,000
Feb 2013 Mar 2013 Apr 2013 May 2013 Jun 2013 Jul 2013 Aug 2013 Sept 2013 Oct 2013 Nov 2013 Dec 2013 Jan 2014
Desktop Total Mobile (Browser Only) Total Mobile (App Only)
Time Spent With the Internet, by Device, in US
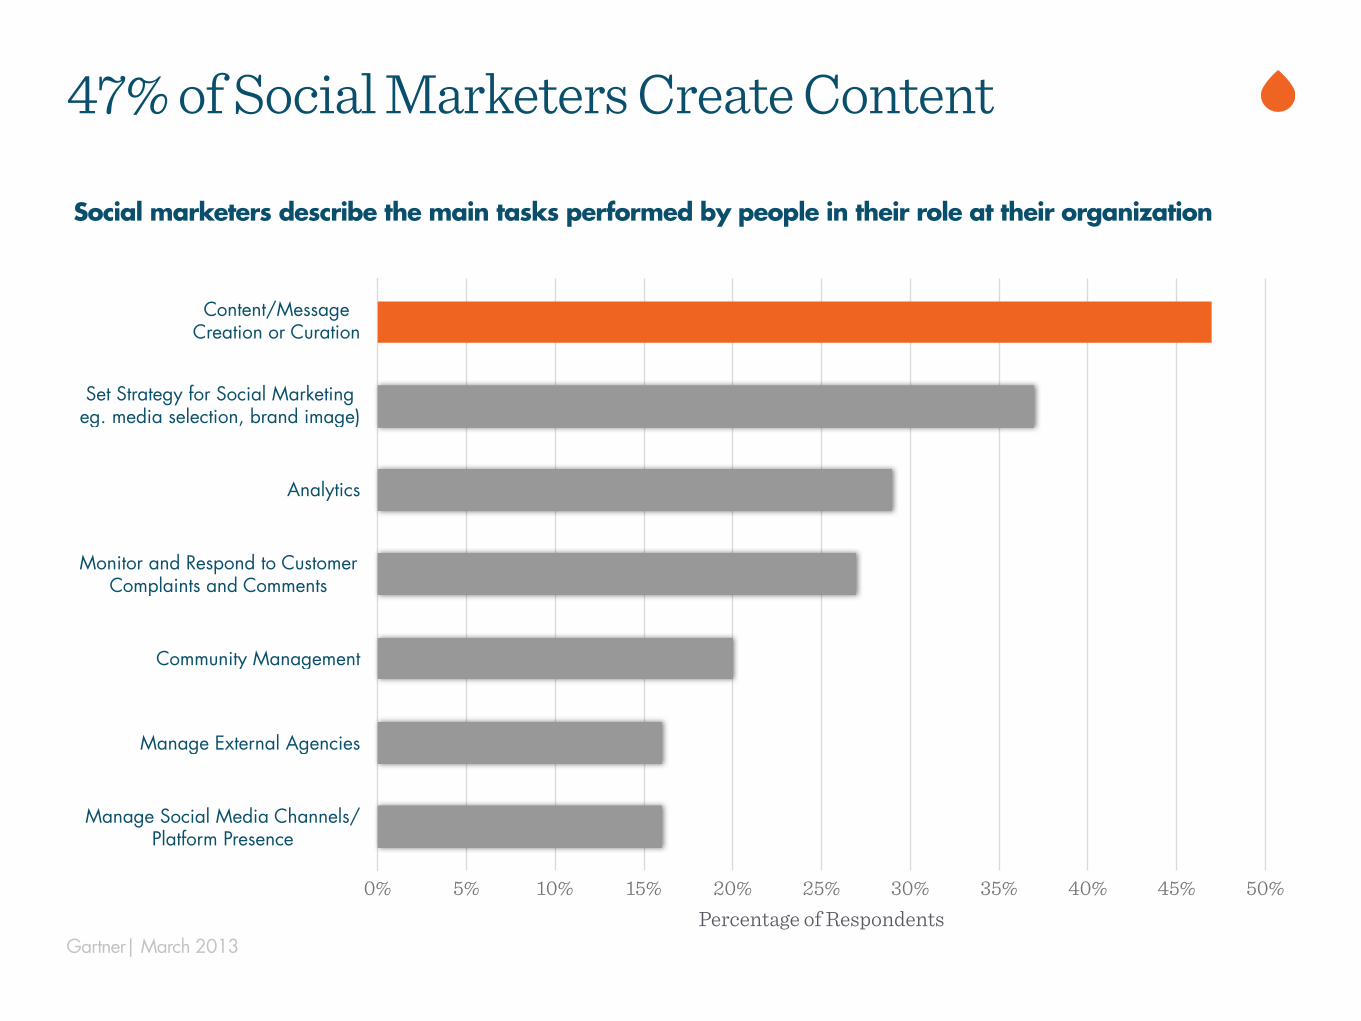
Gartner| March 2013
47% of Social Marketers Create Content
Content/Message Creation or Curation
Set Strategy for Social Marketing eg. media selection, brand image)
Analytics
Monitor and Respond to Customer Complaints and Comments
Community Management
Manage External Agencies
Manage Social Media Channels/Platform Presence
Percentage of Respondents0% 5% 10% 15% 20% 25% 30% 35% 40% 45% 50%
Social marketers describe the main tasks performed by people in their role at their organization
Percolate is the world’s leading content marketing platform with a mission to help brands create content at scale.
Want to learn more?Contact [email protected] for more information or request a demo today at percolate.com/request-demo