Embed Size (px)
Citation preview
5 Sri Lanka Don Ranjith Sisirakuman Hapuarachchi I. Introduction 1.1 Geographical Features and History
The Democratic Socialist Republic of Sri Lanka is an island located in the Indian Ocean to the south of India, between 5.55-9.50 north latitudes and 79.42-81.53 east longitudes. Area of Sri Lanka is 65610 square kilometers with land area comprising 62705 sq. km. and the rest 2905 sq. km. by inland waters. Most of the area is low, flat plains except for mountains in the southern central region. The length of coast line is 1340 kilometers and Indian Ocean marks the lowest point, while Pidurutalagala is the highest point with 2524 meters. Although a country with tropical monsoon climate generating a temperature of 24 – 32 degrees Celsius throughout the year, cold climate can be experienced in central mountainous areas.
Natural resources of Sri Lanka include lime stones, graphite, gems, mineral sands, phosphates, clay and hydropower. Around 15 % of territorial land has been used for permanent crops while arable land area is 14 % and permanent pastures are 7 %, forests and woodlands are 32 % and the rest 32 % is the other use. Sri Lanka is an agricultural country with paddy cultivation being prominent, which covers a large portion of used land, along with other food crops such as cereals, fruit and vegetable. In addition, market and export oriented plantations such as tea; rubber and coconut are widely spread, especially in wet zone. Many processing industries are connected with these plantations, coconut industry being outstanding. During the past few decades, export oriented industries in the caliber of textiles and garments, leather goods, diamonds and jewellery and processed food and beverages have emerged as mainstays in that sector.
Except for occasional cyclones and tornadoes Sri Lanka does not experience any natural hazards, but suffered from floods and landslides heavily in May 2003, probably the worst hit after floods in 1947. The reason for this natural disaster could have been the continuous torrential rains coupled with unauthorized mining for gems in mountainous areas. Urbanization and industrialization have inspired several environmental issues including pollution of air and clean water, soil erosion and deforestation which is threatening to extinction of many varieties of fauna and flora, including some animals and species of birds that are peculiar to Sri Lanka. Some varieties of wild life have already ended due to poaching and deforestation.
Having one of the world’s oldest written history in ‘Choolawansa’ and ‘Mahawansa’, which were written around 500 AD, Sri Lanka reveals her ancient heritage with technically sophisticated reservoirs, Dagobas, temples and many other monuments and ruins. Sinhalese settled in the country in 6th century BC and the civilization linked with the Buddhism developed since then. Tamils and Muslims have been also living in Sri Lanka for many centuries. Sri Lanka has been called throughout the ages in many names including Taprobane, Serendib and Ceylon.
In the year of 1505 AD Portuguese came to the island and after a lot of battles for years they rule the coastal areas and plains, the lion’s share of country. Then Dutch defeated them in the 17th century and the British superseded the Dutch to be the only invaders who ruled the whole country, when Kandy, the last kingdom of Sri Lanka was dominated in 1815 AD. They ruled the country more than one century until Sri Lanka got independence on February 4th, 1948. During British regime many changes occurred. The plantation sector was introduced and developed, transport system was improved by introduction of railway, Christianity was promoted and a new education system was introduced.
149
1. 2 Political Structure
Political system of Sri Lanka has been dominated by two major political parties that ruled the country from time to time, since achieving independence. The Westminster style constitution with the bicameral legislature was changed to unicameral when Sri Lanka became a republic in 1972. Major changes to the constitution took place in 1978 when a peculiar type of executive presidency, one of the most powerful political positions in the world, was introduced. The legislative branch is the parliament with 225 members including Prime Minister, whom are elected by a proportionate system and judicial branch has several parts with Supreme Court being the highest. Legal system is extremely complex, being a mixture of English common law, Roman-Dutch law, Muslim law and Sinhalese and customary law.
In addition to the national legislature, provincial councils and local governments too prevail. Provincial councils were introduced by Indo-Sri Lanka accord, as a remedy for less privileged parts of the island after demands by Tamils. The provincial administrative system consists of 8 divisions.
Tamil political parties failed to achieve most of their aims and unrest created by that lifted the demand for a separate state by extreme groups. Normal life in the country was filled with terror as a result of a series of killings and bomb blasts. Repressive action of the government troops brought no good results. Peace talks held from time to time were failures, except for the ongoing peace process with the international assistance.
Sri Lanka has never being involved in any conflict with other countries and a member of Asian Development Bank, South Asian Association for Regional Co-operation and commonwealth.
Sinhala and Tamil, which are spoken by 74 % and 18 % respectively of the population, are the official languages of Sri Lanka, while English that is spoken by 10 % of the population is a link language and widely used in business circles.
The currency of Sri Lanka is Sri Lankan Rupee which is equal to 97 Rupees for one US dollar and 0.80 rupees for one Yen approximately, according to the prevailing exchange rates. 1. 3 Population and Education
The total population figured at 19,007,500 in the middle of 2002. Population growth rate is 0.85 as estimated in 2002. Life expectancy at birth is 70.7 years for males and 75.4 years for females in 2002. The sex ratio of the total population is 0.97 % males / females. Population density in 2002 was 304 persons per square kilometer. As for age groups 26 % represented 0-14 years, 67 % 14-65 years and 7 % 65years and over as revealed by statistics of 2000. The unemployment rate as a %age of labor force was 9.1 in 2002.
Sinhalese people are 74 % of the total population while Tamils represent 18 %. Other ethnic groups comprise Moors at 7 % and Burgher, Malay and others 1%. Seventy % of the population is Buddhists, 15 % is Hindus, 8 % is Christians and 7 % is Muslims.
Sri Lanka has a fairly high literacy rate of 90.2%, most probably a beneficial consequence of free education, which is available from primary level to the university. Although the old education system of ‘Pirivena’ still survive in Sri Lanka, especially for Buddhist monks, the widely spread English style education system maintained by the government at stages of primary and secondary covers every nook and corner of the country. But education in remote areas is less privileged. Institutions of tertiary education are mainly located in major towns of the country. Table 1 Demography
1998 1999 2000 2001 2002 Mid year population (‘000 persons) (b) Growth of mid year population (%) (b) Population density (persons per sq.km.) (b) Labour force (‘000 persons) Labour force participation rate (%) Unemployment rate (% of labour force)
17,935 1.3
286 6,660 51.7
9.2
18,208 1.5 290 6,673 50.7
8.9
8,467 1.4
295 6,827
50.3 7.6
18,732 1.4
299 6,773
48.8 7.9
19.007 1.5
304 7.050
49.4 9.1
Source – Central Bank of Sri Lanka
150
II. Overview of Macroeconomic Activity and Fiscal Position (A) The pre-1977 period
The macroeconomic activities changed gradually after Sri Lanka achieved independence in 1948. Being an agricultural country and having more than 70 % of her total population in rural areas, Sri Lanka’s journey towards the industrial development was very slow during the early stages. Characteristics of the period from 1948 to mid 50s highlight the development of agriculture, especially paddy cultivation. But export oriented plantations were the main contributors to the national income.
From mid 50s to early 70s expansion of industrial sector and services with the government collaboration is outstanding. Some industries and provision of services were started, mainly by government owned corporations, while initial expansion of the banking and financial services with the formation of government owned banks occurred during the same period. Economic policy of the post independence era up to 1970 had mixed characteristics of both public and private sector. But the modest economic growth had been a common feature during this period.
Restriction of private sector activities including import restrictions and price controls during 1970-1977 was consequent to many bad effects on market activities, capital formation and normal life of the public. Many business activities including plantation sector were nationalized. Many programs were implemented especially in the agricultural sector, for achieving self-sufficiency. However, during this period, the economic performance shrank further. (B) The post-1977 period
The period after 1977 highlights a completely different economic policy, implemented with the vision to achieve accelerated economic development. The aim of this liberal and open economic policy was the economic growth by the increase of investments and higher employment. Import restrictions and price controls were abolished and many areas were opened for private sector. Encouragement of foreign investments by granting tax incentives and providing infrastructure was a phenomenon in this period, during which several investment promotion zones were declared. The currency, which stood independently, was devalued several times as to increase the exports and to better the weak balance of payments.
The slow moving Mahaweli diversion program was converted to a gigantic irrigation and agricultural project under Accelerated Mahaweli Program. A considerable portion of nationalized estate plantations were privatized so that a proper management is performed to earn better returns. The rest of the plantation sector giving a considerable percentage of the total production, more than 60% of tea, 30% of rubber and around 10% of coconut remained state owned.
Stock market and the banking and financial sector marked a boom during this period. With the introduction of the privatization programs investments and capital mobilization went up and daily transactions in the share market started to increase as never before. Moreover, many private banks were established to smooth the economic activities.
Starting from1989 and during 1990s the liberalization program was further expanded. Many state owned enterprises were privatized up to 1994. Foreign exchange regulations too were further liberalized. Removal of limitation of foreign investments in companies inspired the further improvement of stock exchange.
The annual average rate of growth which stood at 2.9 % during 1970-1977 increased to 6 % with the implementation of the open economy. However, sabotage activities by the terrorists starting from 1983 have had detrimental effects on economic activities and growth. Besides, disturbances by extremists during 1988-1989 were more detrimental, crippling the economy during that period. The problem of terrorism affected not only tourism, which is a major source of foreign exchange, but also foreign investment, which reduced the employment opportunities. Unemployment that was fallen up to 12 % in early ‘80s increased up to 20 % in the latter part of the same decade.
151
(C) Recent Performances In 2001 Sri Lankan economy contracted by 1.4 %, the first negative growth since achieving
Independence in 1948. This was a deviation of the medium term annual growth trend of around 5 % during the recent past. The total government revenue was Rs. 231,463 million and current expenditure was Rs. 300,406 million, while capital and net lending amounted to Rs. 83,279 million. The result was an overall budget deficit of a Rs. I52, 222. The contraction was a reflection of world economic slowdown on the Sri Lankan exports and consequences of the long lasted drought on agriculture and hydropower generation. Power cuts were common throughout the first half of the year disturbing all economic activities and normal life. Terrorist attack on Colombo International Air Port in July 2001 and uncertain political situation added salt in the economy’s wounds by further deteriorating the situation.
The challenge of converting the economic contraction of 2001 to a growth was successfully handled by the policy makers paying due attention to required areas. The concerned areas were a solution to conflict between government and terrorists that lasted for two decades weakening the economic growth, improving the efficiency of the economy with optimum use of resources, private sector growth and reduction of high fiscal deficit.
The progress was relieving as economic growth rose during 2002 to 4 % from the previous year’s contraction. During the first half of the year, the GDP grew by 1.7 % and in the second half it was 6.1 %, a performance that fell drastically in the previous year, was driven forward by above mentioned factors. It is a gradual and convincing recovery and a reflection of improved domestic conditions due to the cessation of hostilities and ongoing peace process, more favorable international environment, strong fiscal consolidation efforts, accommodative monetary policy and structural reforms. The growth could be largely seen in services and agricultural sectors while weak export demand for productions continued to be prevalent.
Although there was an increase with regard to number of prices, inflation declined during 2002. But the inflation rate is still high. The percentage increase of Colombo Consumer Price Index which is the major indicator of prices went down to 9.6 % from the increase of 14.2 % in 2001.
A noteworthy improvement of fiscal front reflected in decline of government accounts. The current account deficit, primary deficit and the overall deficit declined, despite a considerable fall of revenue below the expectation. This was a considerable decline of overall public sector deficit, including public enterprises by 2 % of GDP. The external current account deficit further widened. But the surplus in overall balance of payments raised the external resources and reduced the pressure on the floating exchange rate. However, the recovery of export demand was very slow.
The Central Bank reduced its policy rates. Interest rates on deposits and loans were further reduced to accelerate reforms in the financial sector. Reforms in state owned banks moved further, but slowly. The publishing of bank-wise interest rates, commissions and charges was started by the Central Bank, with a view to encourage competition in the financial market.
The unemployment rate as a percentage of the labor force was 9.1 in2002, while the same was 7.9 in 2001. Labor force figured at 7,050,000 in 2002. 2. 1 Macroeconomic Activity 2.1.1 International Environment
Having an open economy, Sri Lanka always gets a big impact of the changes in global economy. In 2002 the global economy recovered at a moderate rate benefiting from the recoveries in the United States, Canada and newly industrialized Asian economies including Developing countries. This recovery was ably stimulated by accommodative monetary policies, fiscal stimulus and interest rate reductions. There were two large obstacles in Euro area and Japan continuing to be weak, disturbing a faster global recovery during the year. In spite of the growth of the Japanese economy stood at 1.4 % euro area grew only by 0.8 %. The growth rate of world output was 3 % in 2002. An increase of exports by developing countries, by 6.3 % in 2002, in comparison to 3 % increase of the same in 2001 was seen, although it is still below the rate of 15 % in 2000. There was a partial recovery of the
152
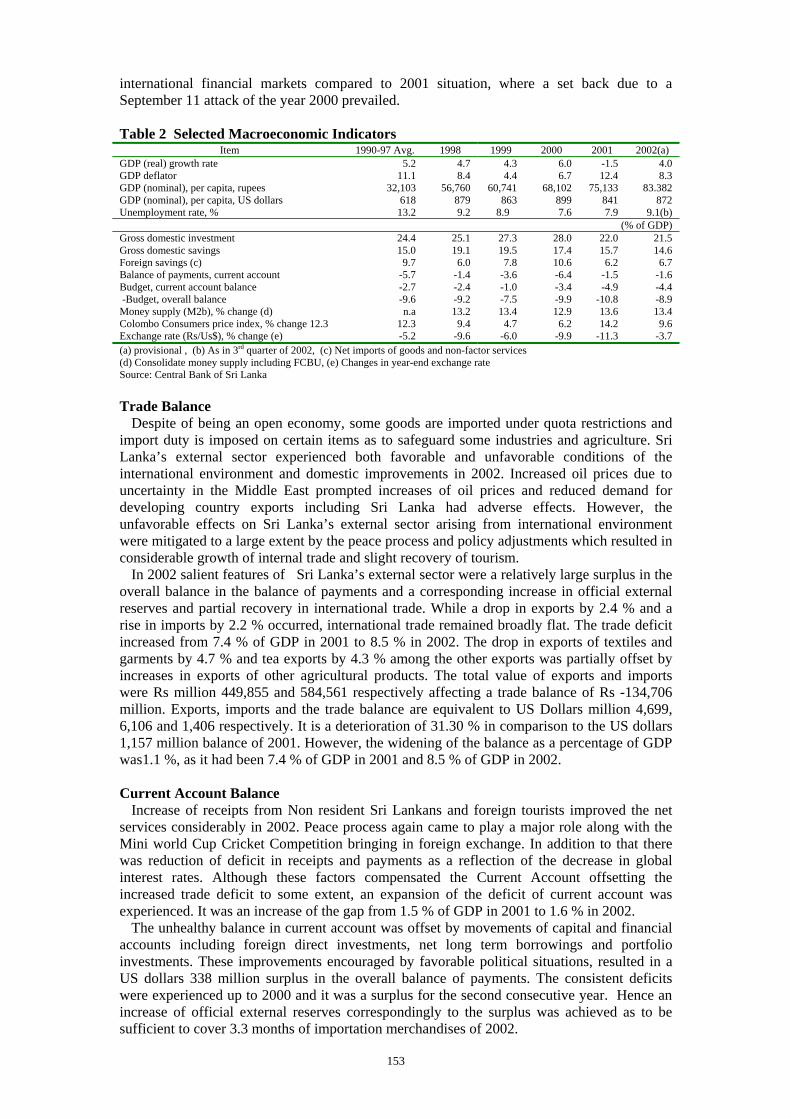
international financial markets compared to 2001 situation, where a set back due to a September 11 attack of the year 2000 prevailed. Table 2 Selected Macroeconomic Indicators
Item 1990-97 Avg. 1998 1999 2000 2001 2002(a) GDP (real) growth rate GDP deflator GDP (nominal), per capita, rupees GDP (nominal), per capita, US dollars Unemployment rate, %
5.211.1
32,10361813.2
4.78.4
56,7608799.2
4.34.4
60,741863
8.9
6.0 6.7
68,102 899 7.6
-1.5 12.4
75,133 841 7.9
4.08.3
83.382872
9.1(b)(% of GDP)
Gross domestic investmentGross domestic savings Foreign savings (c) Balance of payments, current account Budget, current account balance -Budget, overall balance Money supply (M2b), % change (d) Colombo Consumers price index, % change 12.3Exchange rate (Rs/Us$), % change (e)
24.415.0
9.7-5.7-2.7-9.6n.a
12.3-5.2
25.119.1
6.0-1.4-2.4-9.213.2
9.4-9.6
27.319.5
7.8-3.6-1.0-7.513.4
4.7-6.0
28.0 17.4 10.6 -6.4 -3.4 -9.9 12.9
6.2 -9.9
22.0 15.7
6.2 -1.5 -4.9
-10.8 13.6 14.2
-11.3
21.514.6
6.7-1.6-4.4-8.913.4
9.6-3.7
(a) provisional , (b) As in 3rd quarter of 2002, (c) Net imports of goods and non-factor services (d) Consolidate money supply including FCBU, (e) Changes in year-end exchange rate Source: Central Bank of Sri Lanka Trade Balance
Despite of being an open economy, some goods are imported under quota restrictions and import duty is imposed on certain items as to safeguard some industries and agriculture. Sri Lanka’s external sector experienced both favorable and unfavorable conditions of the international environment and domestic improvements in 2002. Increased oil prices due to uncertainty in the Middle East prompted increases of oil prices and reduced demand for developing country exports including Sri Lanka had adverse effects. However, the unfavorable effects on Sri Lanka’s external sector arising from international environment were mitigated to a large extent by the peace process and policy adjustments which resulted in considerable growth of internal trade and slight recovery of tourism.
In 2002 salient features of Sri Lanka’s external sector were a relatively large surplus in the overall balance in the balance of payments and a corresponding increase in official external reserves and partial recovery in international trade. While a drop in exports by 2.4 % and a rise in imports by 2.2 % occurred, international trade remained broadly flat. The trade deficit increased from 7.4 % of GDP in 2001 to 8.5 % in 2002. The drop in exports of textiles and garments by 4.7 % and tea exports by 4.3 % among the other exports was partially offset by increases in exports of other agricultural products. The total value of exports and imports were Rs million 449,855 and 584,561 respectively affecting a trade balance of Rs -134,706 million. Exports, imports and the trade balance are equivalent to US Dollars million 4,699, 6,106 and 1,406 respectively. It is a deterioration of 31.30 % in comparison to the US dollars 1,157 million balance of 2001. However, the widening of the balance as a percentage of GDP was1.1 %, as it had been 7.4 % of GDP in 2001 and 8.5 % of GDP in 2002. Current Account Balance
Increase of receipts from Non resident Sri Lankans and foreign tourists improved the net services considerably in 2002. Peace process again came to play a major role along with the Mini world Cup Cricket Competition bringing in foreign exchange. In addition to that there was reduction of deficit in receipts and payments as a reflection of the decrease in global interest rates. Although these factors compensated the Current Account offsetting the increased trade deficit to some extent, an expansion of the deficit of current account was experienced. It was an increase of the gap from 1.5 % of GDP in 2001 to 1.6 % in 2002.
The unhealthy balance in current account was offset by movements of capital and financial accounts including foreign direct investments, net long term borrowings and portfolio investments. These improvements encouraged by favorable political situations, resulted in a US dollars 338 million surplus in the overall balance of payments. The consistent deficits were experienced up to 2000 and it was a surplus for the second consecutive year. Hence an increase of official external reserves correspondingly to the surplus was achieved as to be sufficient to cover 3.3 months of importation merchandises of 2002.
153
Exports
Sri Lanka heavily depended on agricultural exports comprising tea, rubber and coconut until 1977, where drastic economic reforms were introduced liberalizing and opening the economy so that foreign investments are formed to improve the industrial sector. Today as 2002 figures with those of the last decade show industrial sector, although limited to a few items has dominated in exports. In 1977, agricultural exports contributed 79 % of the total exports. Industrial exports were a mere 14 %. In 2002 industrial exports are 77 % of the total exports, while agricultural exports shared 20 %. If the industrial exports are further analyzed, 51 % of total exports were textiles and garments while all other industrial exports contributed only 26 % of the total exports.
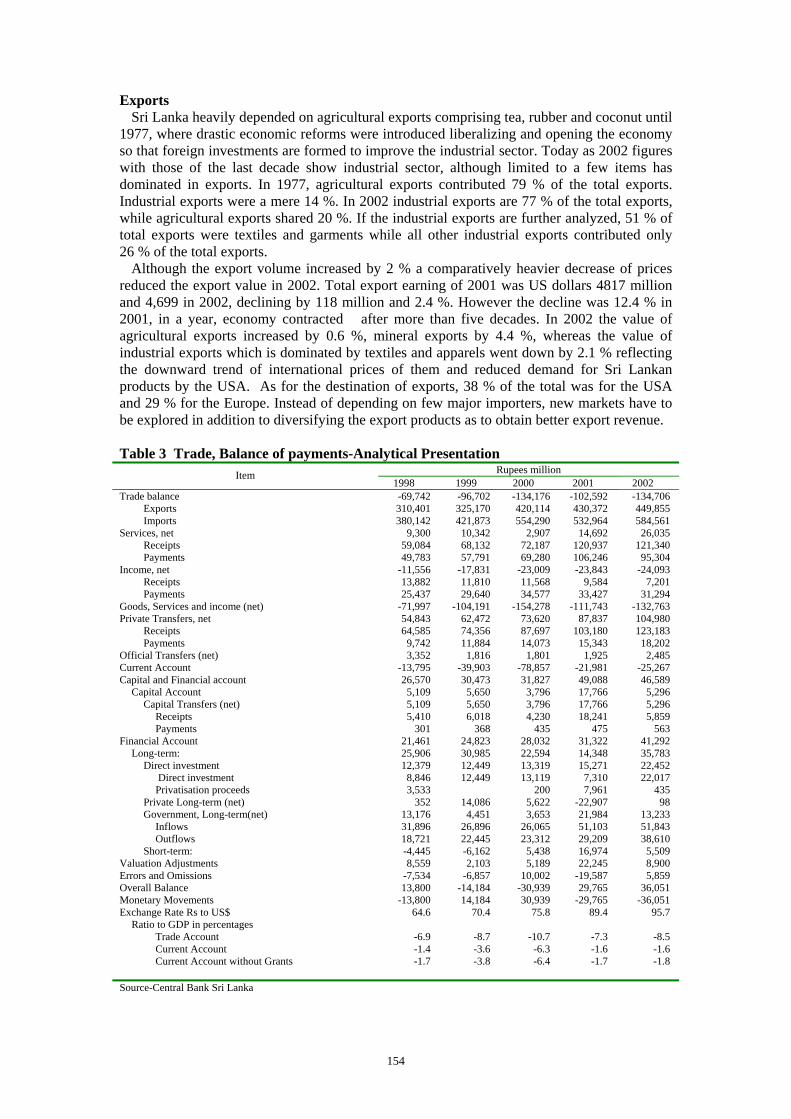
Although the export volume increased by 2 % a comparatively heavier decrease of prices reduced the export value in 2002. Total export earning of 2001 was US dollars 4817 million and 4,699 in 2002, declining by 118 million and 2.4 %. However the decline was 12.4 % in 2001, in a year, economy contracted after more than five decades. In 2002 the value of agricultural exports increased by 0.6 %, mineral exports by 4.4 %, whereas the value of industrial exports which is dominated by textiles and apparels went down by 2.1 % reflecting the downward trend of international prices of them and reduced demand for Sri Lankan products by the USA. As for the destination of exports, 38 % of the total was for the USA and 29 % for the Europe. Instead of depending on few major importers, new markets have to be explored in addition to diversifying the export products as to obtain better export revenue. Table 3 Trade, Balance of payments-Analytical Presentation
Rupees million Item 1998 1999 2000 2001 2002
Trade balance Exports Imports
Services, net Receipts Payments
Income, net Receipts Payments
Goods, Services and income (net) Private Transfers, net
Receipts Payments
Official Transfers (net) Current Account Capital and Financial account
Capital Account Capital Transfers (net)
Receipts Payments
Financial Account Long-term:
Direct investment Direct investment Privatisation proceeds
Private Long-term (net) Government, Long-term(net)
Inflows Outflows
Short-term: Valuation Adjustments Errors and Omissions Overall Balance Monetary Movements Exchange Rate Rs to US$
Ratio to GDP in percentages Trade Account Current Account Current Account without Grants
-69,742310,401380,142
9,30059,08449,783
-11,55613,88225,437
-71,99754,84364,585
9,7423,352
-13,79526,570
5,1095,1095,410
30121,46125,90612,379
8,8463,533
35213,17631,89618,721-4,4458,559
-7,53413,800
-13,80064.6
-6.9-1.4-1.7
-96,702325,170421,87310,34268,13257,791
-17,83111,81029,640
-104,19162,47274,35611,884
1,816-39,90330,473
5,6505,6506,018
36824,82330,98512,44912,449
14,0864,451
26,89622,445-6,1622,103
-6,857-14,18414,184
70.4
-8.7-3.6-3.8
-134,176420,114554,290
2,90772,18769,280
-23,00911,56834,577
-154,27873,62087,69714,073
1,801-78,85731,827
3,7963,7964,230
43528,03222,59413,31913,119
2005,6223,653
26,06523,312
5,4385,189
10,002-30,93930,939
75.8
-10.7-6.3-6.4
-102,592 430,372 532,964 14,692
120,937 106,246 -23,843
9,584 33,427
-111,743 87,837
103,180 15,343
1,925 -21,981 49,088 17,766 17,766 18,241
475 31,322 14,348 15,271
7,310 7,961
-22,907 21,984 51,103 29,209 16,974 22,245
-19,587 29,765
-29,765 89.4
-7.3 -1.6 -1.7
-134,706449,855584,56126,035
121,34095,304
-24,0937,201
31,294-132,763104,980123,18318,202
2,485-25,26746,589
5,2965,2965,859
56341,29235,78322,45222,017
43598
13,23351,84338,610
5,5098,9005,859
36,051-36,051
95.7
-8.5-1.6-1.8
Source-Central Bank Sri Lanka
154
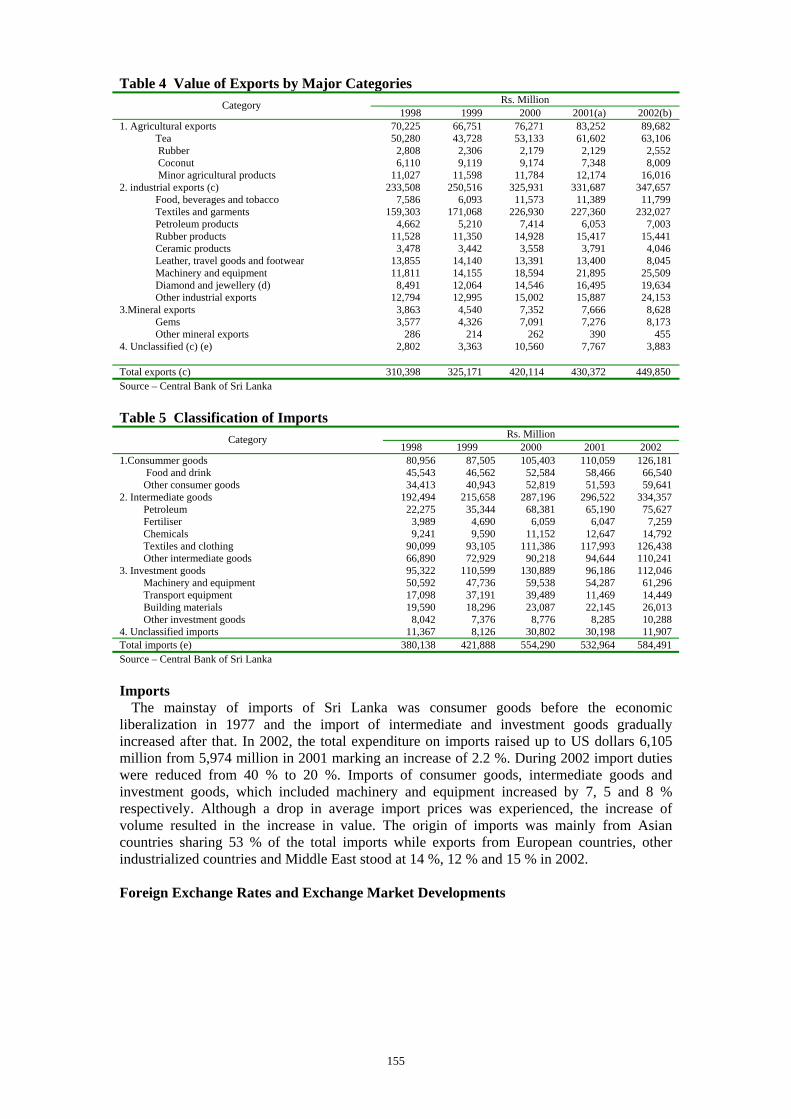
Table 4 Value of Exports by Major Categories Rs. Million Category
1998 1999 2000 2001(a) 2002(b)1. Agricultural exports
Tea Rubber Coconut Minor agricultural products
2. industrial exports (c) Food, beverages and tobacco Textiles and garments Petroleum products Rubber products Ceramic products Leather, travel goods and footwear Machinery and equipment Diamond and jewellery (d) Other industrial exports
3.Mineral exports Gems Other mineral exports
4. Unclassified (c) (e)
70,225 50,280
2,808 6,110
11,027 233,508
7,586 159,303
4,662 11,528
3,478 13,855 11,811
8,491 12,794
3,863 3,577
286 2,802
66,751 43,728
2,306 9,119
11,598 250,516
6,093 171,068
5,210 11,350
3,442 14,140 14,155 12,064 12,995
4,540 4,326
214 3,363
76,271 53,133
2,179 9,174
11,784 325,931 11,573
226,930 7,414
14,928 3,558
13,391 18,594 14,546 15,002
7,352 7,091
262 10,560
83,252 61,602
2,129 7,348
12,174 331,687 11,389
227,360 6,053
15,417 3,791
13,400 21,895 16,495 15,887
7,666 7,276
390 7,767
89,68263,106
2,5528,009
16,016347,65711,799
232,0277,003
15,4414,0468,045
25,50919,63424,153
8,6288,173
4553,883
Total exports (c) 310,398 325,171 420,114 430,372 449,850Source – Central Bank of Sri Lanka Table 5 Classification of Imports
Rs. Million Category 1998 1999 2000 2001 2002
1.Consummer goods Food and drink Other consumer goods
2. Intermediate goods Petroleum Fertiliser Chemicals Textiles and clothing Other intermediate goods
3. Investment goods Machinery and equipment Transport equipment Building materials Other investment goods
4. Unclassified imports
80,95645,54334,413
192,49422,275
3,9899,241
90,09966,89095,32250,59217,09819,590
8,04211,367
87,50546,56240,943
215,65835,344
4,6909,590
93,10572,929
110,59947,73637,19118,296
7,3768,126
105,40352,58452,819
287,19668,381
6,05911,152
111,38690,218
130,88959,53839,48923,087
8,77630,802
110,059 58,466 51,593
296,522 65,190
6,047 12,647
117,993 94,644 96,186 54,287 11,469 22,145
8,285 30,198
126,18166,54059,641
334,35775,627
7,25914,792
126,438110,241112,04661,29614,44926,01310,28811,907
Total imports (e) 380,138 421,888 554,290 532,964 584,491Source – Central Bank of Sri Lanka Imports
The mainstay of imports of Sri Lanka was consumer goods before the economic liberalization in 1977 and the import of intermediate and investment goods gradually increased after that. In 2002, the total expenditure on imports raised up to US dollars 6,105 million from 5,974 million in 2001 marking an increase of 2.2 %. During 2002 import duties were reduced from 40 % to 20 %. Imports of consumer goods, intermediate goods and investment goods, which included machinery and equipment increased by 7, 5 and 8 % respectively. Although a drop in average import prices was experienced, the increase of volume resulted in the increase in value. The origin of imports was mainly from Asian countries sharing 53 % of the total imports while exports from European countries, other industrialized countries and Middle East stood at 14 %, 12 % and 15 % in 2002. Foreign Exchange Rates and Exchange Market Developments
155
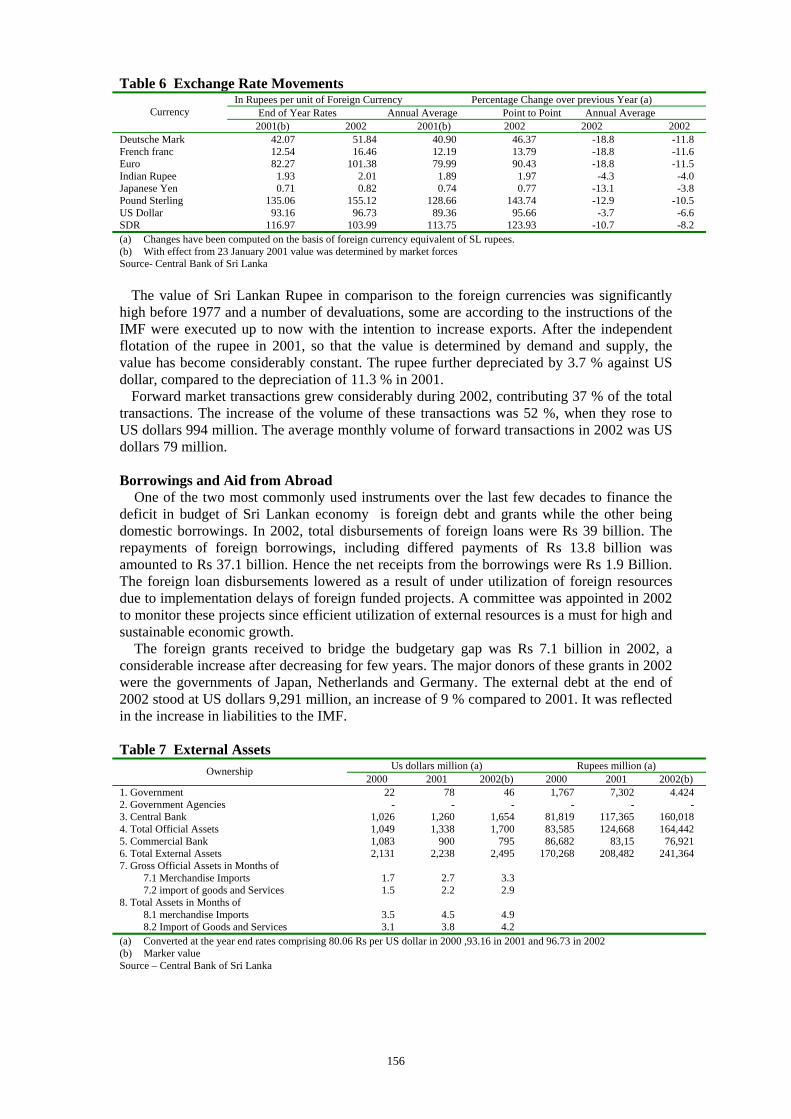
Table 6 Exchange Rate Movements In Rupees per unit of Foreign Currency Percentage Change over previous Year (a) End of Year Rates Annual Average Point to Point Annual Average Currency 2001(b) 2002 2001(b) 2002 2002 2002
Deutsche Mark French franc Euro Indian Rupee Japanese Yen Pound Sterling US Dollar SDR
42.07 12.54 82.27
1.93 0.71
135.06 93.16
116.97
51.8416.46
101.382.010.82
155.1296.73
103.99
40.9012.1979.99
1.890.74
128.6689.36
113.75
46.3713.7990.43
1.970.77
143.7495.66
123.93
-18.8 -18.8 -18.8
-4.3 -13.1 -12.9
-3.7 -10.7
-11.8 -11.6 -11.5
-4.0 -3.8
-10.5 -6.6 -8.2
(a) Changes have been computed on the basis of foreign currency equivalent of SL rupees. (b) With effect from 23 January 2001 value was determined by market forces Source- Central Bank of Sri Lanka
The value of Sri Lankan Rupee in comparison to the foreign currencies was significantly high before 1977 and a number of devaluations, some are according to the instructions of the IMF were executed up to now with the intention to increase exports. After the independent flotation of the rupee in 2001, so that the value is determined by demand and supply, the value has become considerably constant. The rupee further depreciated by 3.7 % against US dollar, compared to the depreciation of 11.3 % in 2001.
Forward market transactions grew considerably during 2002, contributing 37 % of the total transactions. The increase of the volume of these transactions was 52 %, when they rose to US dollars 994 million. The average monthly volume of forward transactions in 2002 was US dollars 79 million. Borrowings and Aid from Abroad
One of the two most commonly used instruments over the last few decades to finance the deficit in budget of Sri Lankan economy is foreign debt and grants while the other being domestic borrowings. In 2002, total disbursements of foreign loans were Rs 39 billion. The repayments of foreign borrowings, including differed payments of Rs 13.8 billion was amounted to Rs 37.1 billion. Hence the net receipts from the borrowings were Rs 1.9 Billion. The foreign loan disbursements lowered as a result of under utilization of foreign resources due to implementation delays of foreign funded projects. A committee was appointed in 2002 to monitor these projects since efficient utilization of external resources is a must for high and sustainable economic growth.
The foreign grants received to bridge the budgetary gap was Rs 7.1 billion in 2002, a considerable increase after decreasing for few years. The major donors of these grants in 2002 were the governments of Japan, Netherlands and Germany. The external debt at the end of 2002 stood at US dollars 9,291 million, an increase of 9 % compared to 2001. It was reflected in the increase in liabilities to the IMF. Table 7 External Assets
Us dollars million (a) Rupees million (a) Ownership 2000 2001 2002(b) 2000 2001 2002(b)
1. Government 2. Government Agencies 3. Central Bank 4. Total Official Assets 5. Commercial Bank 6. Total External Assets 7. Gross Official Assets in Months of
7.1 Merchandise Imports 7.2 import of goods and Services
8. Total Assets in Months of 8.1 merchandise Imports 8.2 Import of Goods and Services
22 -
1,026 1,049 1,083 2,131
1.7 1.5
3.5 3.1
78 -
1,260 1,338
900 2,238
2.7 2.2
4.5 3.8
46 -
1,654 1,700
795 2,495
3.3 2.9
4.9 4.2
1,767 -
81,819 83,585 86,682
170,268
7,302 -
117,365 124,668
83,15 208,482
4.424 -
160,018 164,442 76,921
241,364
(a) Converted at the year end rates comprising 80.06 Rs per US dollar in 2000 ,93.16 in 2001 and 96.73 in 2002 (b) Marker value Source – Central Bank of Sri Lanka
156

Table 8 External Debt and Banking sector Liabilities US dollars Million Rupees Million Item
2000 2001 2002(a) 2000 2001 2002(a) 1. Medium and Long-term Debt
1.1 Government 1.2 Public Corporations and private Sector With Government Guarantee 1.3 Public Corporations and private Sector With Government Guarantee 1.4 IMF Drawing
2. Short – term Debt 2.1 Government 2.2 other(CPC and other trade credit) (b)
3. Banking Sector External Liabilities (c) 3.1 Central Bank 3.2 Commercial Bank 3.3 ACU Liabilities
4. total External Debt (1+2) 5.Total External Debt and Liabilities (1+2+3)
8,456 6,989
1,028
278 161 575
- 575
1,076 …
938 137
9,031
10,106
8,011 6,808
744
249 209 533
- 533
1,119 2
1,009 107
8,544
9,662
8,690 7,442
689
272 287 601
- 601
1,001 1
865 135
9,291
10,292
676,045 559,544
82,302
22,257 11,943 46,034
- 46,034 86,132
33 75,101 10,998
722,079
808,211
746,270 634,255
69,349
23,203 19,463 49,648
- 49,648
104,201 172
94,030 9,999
795,918
900,119
840,619 719,902
66,618
26,311 27,787 58,100
- 58,100 96,807
123 83,655 13,029
898,718
995,526 (a) Provisional (b) Includes credit of Ceylon petroleum Corporation (CPC) (c) Foreign liabilities of commercial banks including FCBUs
Source – Central Bank of Sri Lanka The tendency of decreasing value of external assets was reversed during the years of 2001
and 2002, as a consequence of the favorable balance of payments. In 2000 the value of external assets was US dollars 2,131 million and went up to 2,238 in 2001 and 2,495 in 2002 which is an 11 % increase compared to 2001. Foreign direct investments, large capital inflows to the country in the form of private remittances, long term borrowing and short term capital inflows to the share market were instrumental in increasing the external reserves. The use of IMF resources under the Stand-By Agreements (SBA) further boosted the external reserves during 2002. 2.1.2. Domestic Environment Economic Growth
Growth of the Sri Lankan economy was very slow and gradual even after achieving the independence in 1948. In addition to agriculture, governments put emphasis in developing health services an education which was a needful at that time. Industrial sector, starting to develop very slowly in 1960s made a leap towards acceleration after 1977. However, the largest contribution to the GDP was given by agricultural sector until1977, where industrial and services sectors were mediocre. The annual average economic growth measured with the growth of (GDP) during 1970-1977 was only 2.9 %, but outstanding during 1978-1983, when it grew rapidly to 6 %. After 1983, GDP growth averaged between 4 % and 5 %, although notable growth was seen in 1990 at 6.4 % and 2000 at 6%. But drawback of economic activities connected with the unfavorable situation prevailed in domestic and international markets, security and weather, resulted in a contraction of the economy.
157
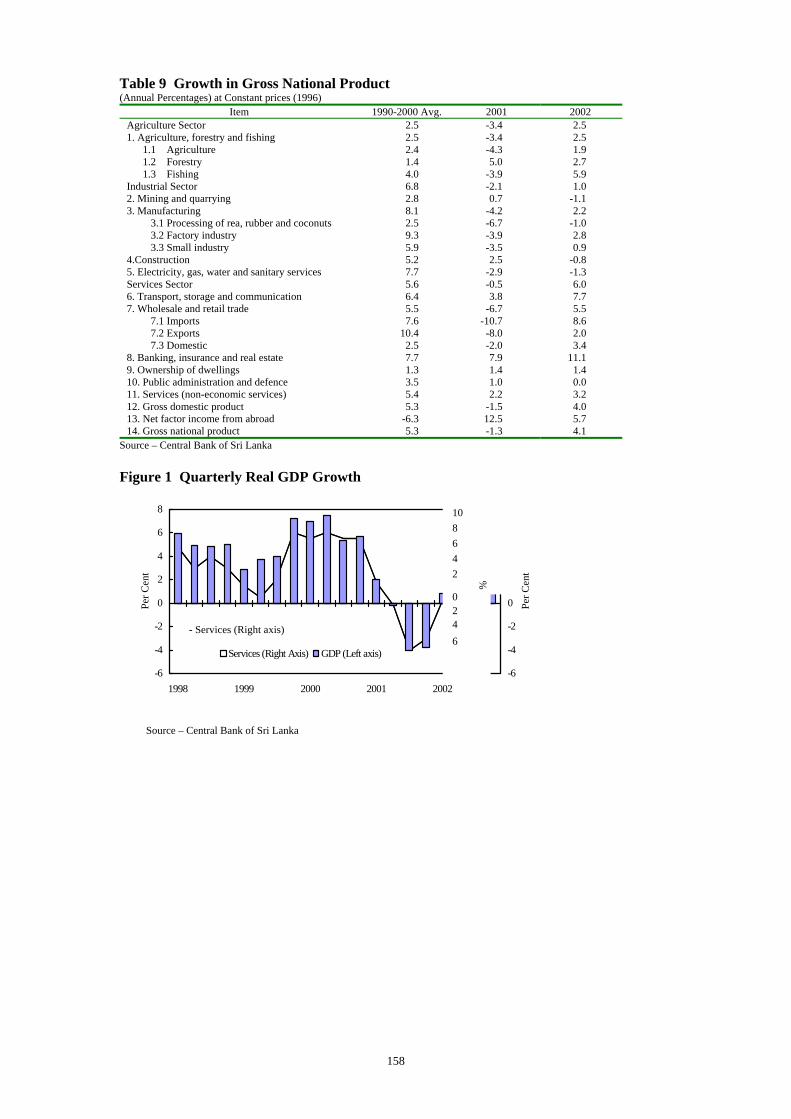
Table 9 Growth in Gross National Product (Annual Percentages) at Constant prices (1996)
Item 1990-2000 Avg. 2001 2002 Agriculture Sector 1. Agriculture, forestry and fishing
1.1 Agriculture 1.2 Forestry 1.3 Fishing
Industrial Sector 2. Mining and quarrying 3. Manufacturing
3.1 Processing of rea, rubber and coconuts 3.2 Factory industry 3.3 Small industry
4.Construction 5. Electricity, gas, water and sanitary services Services Sector 6. Transport, storage and communication 7. Wholesale and retail trade
7.1 Imports 7.2 Exports 7.3 Domestic
8. Banking, insurance and real estate 9. Ownership of dwellings 10. Public administration and defence 11. Services (non-economic services) 12. Gross domestic product 13. Net factor income from abroad 14. Gross national product
2.5 2.5 2.4 1.4 4.0 6.8 2.8 8.1 2.5 9.3 5.9 5.2 7.7 5.6 6.4 5.5 7.6
10.4 2.5 7.7 1.3 3.5 5.4 5.3
-6.3 5.3
-3.4 -3.4 -4.3 5.0
-3.9 -2.1 0.7
-4.2 -6.7 -3.9 -3.5 2.5
-2.9 -0.5 3.8
-6.7 -10.7
-8.0 -2.0 7.9 1.4 1.0 2.2
-1.5 12.5 -1.3
2.5 2.5 1.9 2.7 5.9 1.0
-1.1 2.2
-1.0 2.8 0.9
-0.8 -1.3 6.0 7.7 5.5 8.6 2.0 3.4
11.1 1.4 0.0 3.2 4.0 5.7 4.1
Source – Central Bank of Sri Lanka Figure 1 Quarterly Real GDP Growth
-6
-4
-2
0
2
4
6
8
1998 1999 2000 2001 2002
Per C
ent
-6
-4
-2
0
2
4
6
8Pe
r Cen
t
Services (Right Axis) GDP (Left axis)
%
10
8
6
4
2
0
2
4
6
- Services (Right axis)
Source – Central Bank of Sri Lanka
158

Table 10 Sectoral Composition and Increase of GDP Rate of increase Contribution to Change
in GDP (%) Percentage share Of
GDP (%) Sector 2001(a) 2002(b) 2001(a) 2002(b) 2001(a) 2002(b)
1. Agriculture 1.1 Agriculture, forestry and fishing
Agriculture Tea Rubber Coconut Paddy Other Forestry Fishing
2. Industry 2.1 Mining and quarrying 2.2 Manufacturing Processing of tea, rubber, & coconut etc. Factory industry Small industry 2.3 Construction 2.4 Electricity, gas, water and sanitary services 3.Services 3.1 Transport, storage and communication 3.2 Wholesale and retail trade Imports Exports Domestic 3.3 Banking insurance and teal estate 3.4 Ownership of dwellings 3.5 Public admin station and deference 3.6 Service (non economic) 4. Gross domestic product (1+2+3)
-3.4-3.4-4.3-3.5-1.5
-13.5-5.7-2.25.0
-3.9-2.10.7
-4.2-6.7-3.9-3.52.5
-2.9-0.53.8
-6.7-10.7
-8.0-2.07.91.41.02.2
-1.5
2.5 2.5 1.9 5.0 5.0
-13.6 6.1 2.5 2.7 5.9 1.0
-1.1 2.2
-1.0 2.8 0.9
-0.8 -1.3 6.0 7.7 5.5 8.6 2.0 3.4
11.0 1.4 0.0 3.2 4.0
-44.9 -44.9 -43.8
-3.2 -0.4
-15.4 -12.0 -12.9
5.9 -6.9
-37.7 0.7
-46.9 -9.0
-35.0 -2.9 11.2 -2.8
-17.4 28.7
-95.2 -68.9 -13.9 -12.4 38.8
1.6 3.1 5.5
-100.0
12.6 12.6
7.3 1.8 0.5
-5.3 4.8 5.6 1.3 4.0 7.1
-0.5 9.5
-0.5 9.7 0.3
-1.5 -0.5 80.3 24.1 29.1 19.8
1.3 8.0
23.2 0.6 0.0 3.4
100.0
20.1 20.1 15.6
1.4 0.4 1.5 3.1 9.0 1.9 2.7
27.1 1.8
16.9 2.0
13.7 1.3 7.3 1.4
52.5 12.4 20.9
9.0 2.5 9.4 8.3 1.8 5.0 4.1
100.0
19.8 19.8 15.1
1.4 0.4 1.3 3.2 8.9 1.9 2.7
26.6 1.7
16.7 1.9
13.5 1.2 6.9 1.4
53.6 12.8 21.3
9.4 2.5 9.4 8.9 1.8 4.8 4.1
100.0 (a) Revised, (b) Provisional Source: Central Bank of Sri Lanka
Recovering from the contraction of 1.4 % in 2001, Gross Domestic Production (GDP) grew by 4%, in 2002. The services sector contributed 54 %, industries 26 % and agriculture 20% in 2002. Services sector improved by 6 % compared to 2001 accounting for 80 % of overall growth in 2002, while industrial sector grew by 1%, contributing 7.1 % of the overall growth. This sector had a negative growth up to the third quarter due to the weak export demand. Agriculture, Benefiting from the better weather conditions compared to 2001, improved by 2.5 % and contributed 12.6% of the overall growth. At current market prices GDP was US dollars 16.2 billion in 2002, a growth of 12.6 % while GNP amounted to US dollars 16.2 billion. This favorable situation is a combined result of all major production sectors consisting of agriculture, fisheries, industry and services. Besides hydro-power generation became normal in 2002 and instrumental in bringing good results. The removal of war risk premium assisted recovery of trade and tourism. Table 11 Output and Percentage Changes
1999 2000 2001 2002 GDP at current market price (Rs. billion) GNP at current market price (Rs. Billion) Per capita GDP at market prices (Rs .b) Per capita GNP at market prices (Rs .b) Per capita GDP at market prices (US $ b) Per capita GNP at market prices (US $ b)
Real OUTPUT (percentage change) GNP GDP Sectoral Classification of GDP
Agriculture Industry Services
1,1061,090
60,74159,882
863851
3.84.3
4.54.84.0
1,2581,233
68,10266,790
899881
5.86.0
1.87.57.0
1,407 1,382
75,133 73,795
841 826
-1.3 -1.5
-3.4 -2.1 -0.5
1,5851,560
83,38282,076
872858
4.14.0
2.51.06.0
Source- Central Bank of Sri Lanka Inflation Rate
The increasing tendency of inflation rate continued during the recent years up to 2001, where the highest increase in recent years was experienced at 14.2 % after 1990 which was at 21.2 % according to the Colombo Consumers Price Index (CCPI), which is the official
159
measure of price changes. But the index was 9.6% for 2002 indicating a considerable decline in increase of prices. This was due to two reasons. The Central Bank of Sri Lanka pursued tight demand management policies to curb excessive growth in nominal demand, while improvement in supply of consumer goods including necessary items was seen in the market. This is, again, result of improved security situation allowing free movement of goods, increase of imports and better agricultural production. However, the nominal wage rate index for workers indicated a percentage change of 7.4 during the year. GNP Deflator was 8.3 % in 2002 compared to 12.4 % in 2001.
The comparatively high increase of the inflation rate in 2001 could have been due to unfavorable situation and additional weight of devaluation of Sri Lankan rupee. Table 12 Percentage change of Prices (Colombo Consumers Price Index/ 1952=100)
Average Index Annual Average Percentage Change
Contribution to Increase in (%) Item Weights
2001 2002 2001 2002 2001 2002 All items Commodity wise
Food Clothing Fuel and light Rent Miscellaneous
100.0
61.9 9.4 4.3 5.7
18.7
2,899.4
3,244.7 909.6
5,328.9 109.8
3,131.1
3,176.4
3,589.9 950.5
5,795.8 109.8
3,372.9
14.2
15.2 4.2
14.3 -
11.7
9.6
10.6 4.5 8.8
- 6.3
100.0
76.8 1.0 7.9
- 14.3
100.0
80.31.47.2
-11.1
Source: Department of Census and Statistics Consumption
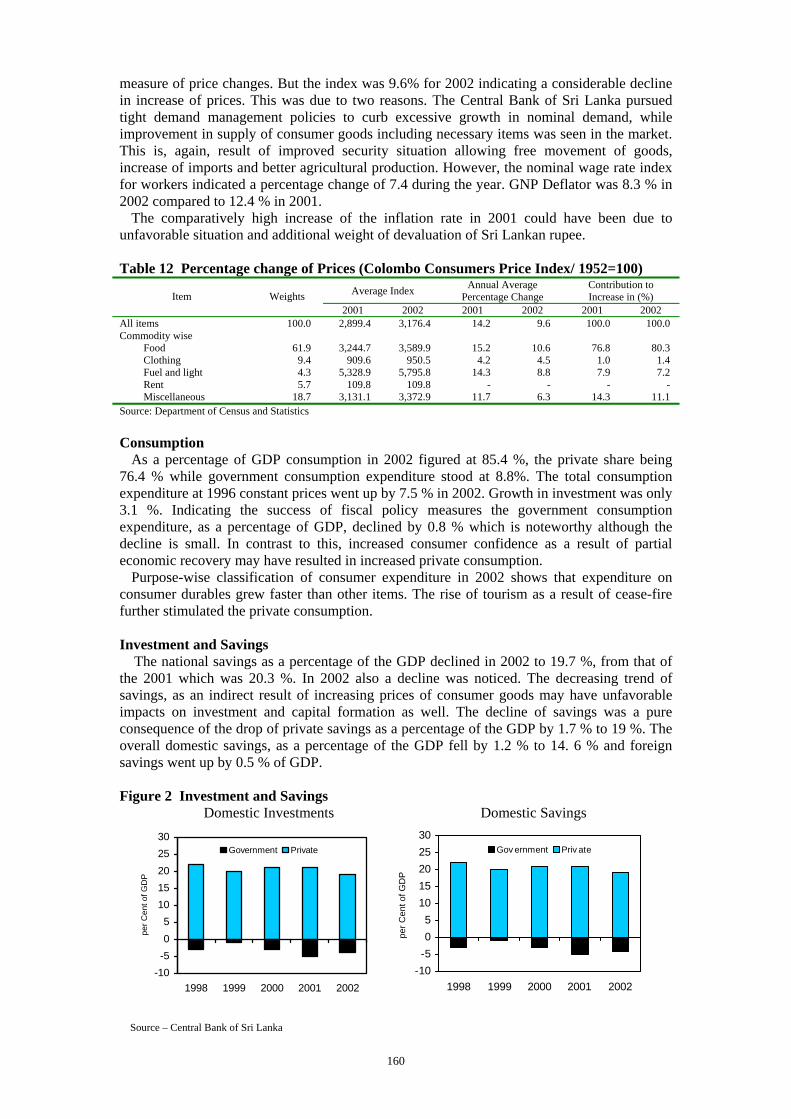
As a percentage of GDP consumption in 2002 figured at 85.4 %, the private share being 76.4 % while government consumption expenditure stood at 8.8%. The total consumption expenditure at 1996 constant prices went up by 7.5 % in 2002. Growth in investment was only 3.1 %. Indicating the success of fiscal policy measures the government consumption expenditure, as a percentage of GDP, declined by 0.8 % which is noteworthy although the decline is small. In contrast to this, increased consumer confidence as a result of partial economic recovery may have resulted in increased private consumption.
Purpose-wise classification of consumer expenditure in 2002 shows that expenditure on consumer durables grew faster than other items. The rise of tourism as a result of cease-fire further stimulated the private consumption. Investment and Savings
The national savings as a percentage of the GDP declined in 2002 to 19.7 %, from that of the 2001 which was 20.3 %. In 2002 also a decline was noticed. The decreasing trend of savings, as an indirect result of increasing prices of consumer goods may have unfavorable impacts on investment and capital formation as well. The decline of savings was a pure consequence of the drop of private savings as a percentage of the GDP by 1.7 % to 19 %. The overall domestic savings, as a percentage of the GDP fell by 1.2 % to 14. 6 % and foreign savings went up by 0.5 % of GDP. Figure 2 Investment and Savings Domestic Investments Domestic Savings
-10-505
1015202530
1998 1999 2000 2001 2002
per C
ent o
f GD
P
Government Private
-10-505
1015202530
1998 1999 2000 2001 2002
per C
ent o
f GD
P
Gov ernment Priv ate
Source – Central Bank of Sri Lanka
160
Remaining at a low level in 2002 Declined from 22 % in 2001 to 21.3 % in 2002, the
investment/GDP ratio was below than its average value of 25.4 % during the five years from 1997-2001. This investment ratio is far below than the expected rate of 30 %, as to achieve a healthy annual growth of 8 %.
Therefore an investment promotion plan with aggressive and diversified surface as to improve quality and quantity of foreign and domestic investments is vital for reaching a higher economic growth rate. Investments in export-oriented industries will serve better results towards the much talked and most needful economic growth. Money Supply
The Central Bank of Sri Lanka uses its key policy rates as to control money supply, for implementation of the monetary policy and controlling money supply, in accordance with the changing requirements of the government. The monetary policy was focused on providing sufficient liquidity facilities to recover from the contraction of 2001 and the Central Bank further reduced her key policy rates considering the declining trend of inflation and healthy situation in money and foreign exchange markets. The reduction was done both in Repurchase (Rapo) and Reverse Repurchase (Reverse Rapo) rates. Table 13 Money Supply and Financial Statistics
Change Item End 2002
Rs.bn 2001Amount Rs.bn % 2002 Amount
Rs.bn. %
Monetary aggregates: Narrow money supply (M1) Broad money supply (M2) Consolidated broad money supply (M2b)
Underlying factors (a) Domestics credit to:
Government (net) Public corporations Private sector
External assets (net) Other items (net)
Reserve money
Government (net) Commercial bank External assets (net) Other items (net)
139.4 510.4 622.5
680.4 193.0
43.0 444.4 110.4
-168.5
126.4 70.9
… 117.4 -61.9
3.7
46.0 65.7
89.0 54.0
2.6 32.4
4.6 -27.9
7.3 -6.9 -0.4 26.4
-11.8
3.2
11.4 13.6
16.2 36.7
6.7 8.9 6.6
20.5
7.0 -7.7
-71.2 45.6
-25.9
17.2 59.7 73.4
41.5 -8.3 2.2
47.6 36.5 -4.7
13.9 -13.6
-0.1 33.0 -5.4
14.013.213.4
6.5-4.15.4
12.049.3-2.9
12.3-16.1
-8.039.2-9.6
Interest rates
91-day Treasury bills (%) Commercial banks’ weighted avg. prime lending rate (%)
Share Market All Share Price Index (1985=100) Market capitalisation (Rs.bn)
End 2001
12.92 14.31
621.0 124.0
End 2002
9.92 12.24
815.1 162.6
(a) in relation to M2b Source – Central bank of Sri Lanka
The money supply, stimulated by the monetary policy was slightly higher than the projected supply, especially in the middle of the year. Growth of money supply (M2b) reached 17.9%, its peak in June 2002, marking an excess of 2% over anticipated supply. Then it declined gradually down to 13.4 in December. However, the monetary growth declined in the latter part of the year. The amendments to the Monetary Law Act, providing adequate flexibilities to the Central Bank, in implementing the monetary policy were utilized at the end of 2002 and 2003. Capital Stock and Foreign direct Investments
The post independence period up to 1977 did not show a considerable growth of capital stock. After the economy was opened in 1977 and gigantic projects undergone providing infrastructure for investments a comparatively huge increase of the physical capital stock occurred. Many factories were established and a number of other establishments like banks, financial institutions and insurance, providing assistance for industrial sector were erected
161
adding more muscle to the capital stock. A project of 200 garment factories underwent during 1980s further increasing the capital stock. Moreover, machineries and heavy equipment in several heavy industries and supply of telecommunication, electricity, water and gas services increased considerably. Facilities for importation of capital goods by the private sector remain open for the purpose of increasing the capital stock which is a primary requirement for the sustainable economic growth.
The ongoing peace process and structural reforms under IMF and Stand by Agreements (SBA) making a favorable environment, long term capital flows began to increase again. Thus, private sector long term capital flows increased to US $ 139 million in 2002 from US $ 45 million in 2001, although long term capital received by the government declined in 2002.
The policy of encouraging foreign direct investments in Sri Lanka was implemented further with attractive benefits including tax incentives. This includes the investment in developing infrastructure facilities. But the investments were not up to the expectations after mid 1980s due to the troubled situation prevailed in the country until 2002. Further liberalization of the capital account in the balance of payments, completely removing restrictions on foreign direct investments was performed by the government on her policy front. The further liberalized areas were banking, insurance, financial services, stock broking, telecommunications, mass transportation and professional services. With the above policy and the ongoing peace process more investments can be expected in future.
In 2000, foreign direct investments declined sharply, but increased significantly from US $ 82 million in 2001 to 242 million in 2002. If these outstanding FDI flows were analyzed, 25 % of that was for power and 10 % was towards the communication. The shares of FDI for manufacturing industries and port services were 20 % and 15 % respectively. Stock Market
The development of stock market in Sri Lanka started gradually with the momentum of increasing the number of companies with limited liabilities. The period before the economy was opened for private enterprise the development was very slow, where a few stock brokers engaged in these low-scale activities.1977 marked a vast increase of the market with both local and foreign investors participating in transactions in large scale. With the opening of the Colombo Stock Exchange (CSE), the number of listed companies boomed. The main indicators of the market are All Share Price Index (ASPI) maintained by the Exchange, whilst another index, namely Milanka Price Index (MPI) also prevailing as a key indicator.
During the period after 1983, again the activities of the market became mediocre, but showing a gradual increase. The decade of 1980 was filled with terrorist activities which brought the economy to a near stand still in all the activities including investment. With the dawn of the next decade share market started its progress again, but with many ups and downs. After 1999 again the trend was downward and during the year of 2001, share market was severely affected by the shrink of the economy.
In 2002, a significant improvement was visible in comparison to 2001. Key market indicators recorded large gains, particularly in the first part of the year, in which the Exchange was noted as one of the best performing markets in that year. The primary market activities increased with several companies making initial public offers and the government’s offer to sell 12 % of equity of Sri Lanka Telecom, while some companies issued debentures. Primary activities raised Rupees 7.3 billion by way of issuing shares and debentures this year. Table 14 Share Market Indicators
2000 2001 2002 1. Market Capitalisation (Rs.bn.) (a) 2. Number of New issued (No) 3. Total Number of New Shares issued 9mn.) 4. Value of New Shares issued (mn.) 5. Number of Shares Traded (mn.) 6. Value of Shares Traded (Rs. mn.) 7. Price Indices (a)
CSE All Share Index Milanka Index
89 2 6
60 449
10,624
447.6 696.5
124 - - -
747 13,905
621.0
1,031.0
163 5
244 3,637 1,220
30,183
815.1 1,374.6
(a) at the end of the year Source: Colombo Stock Exchange
162
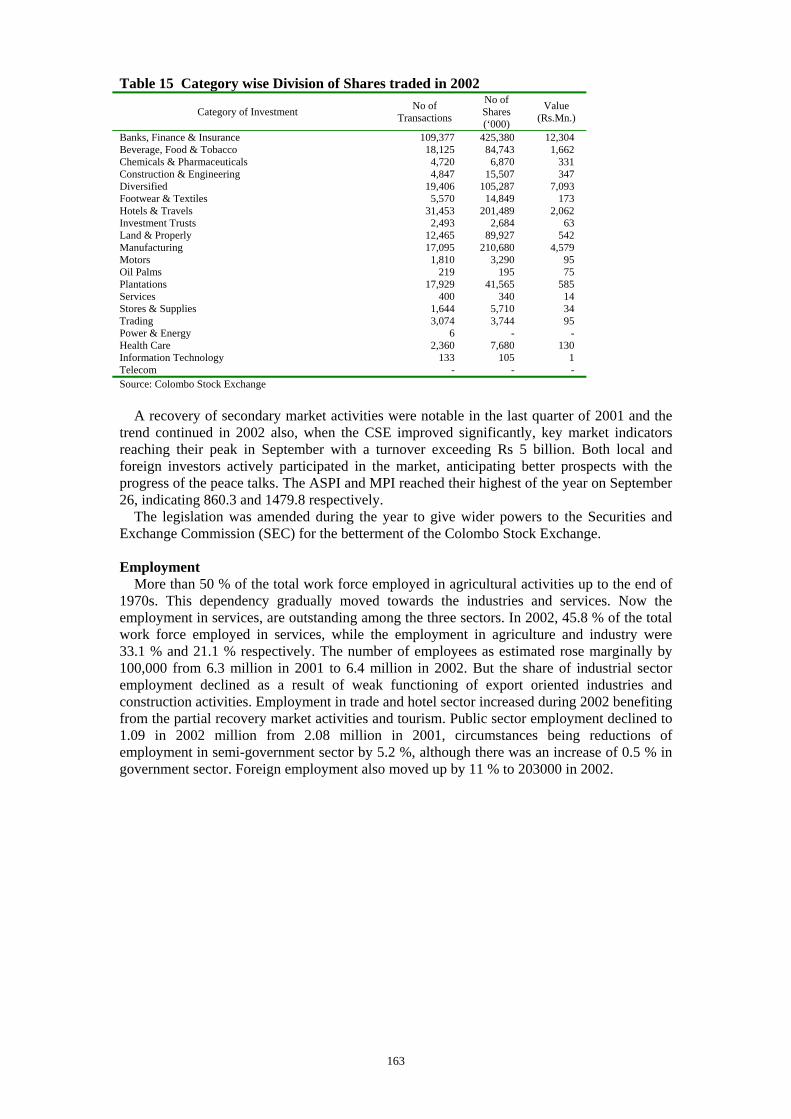
Table 15 Category wise Division of Shares traded in 2002
Category of Investment No of Transactions
No of Shares (‘000)
Value (Rs.Mn.)
Banks, Finance & Insurance Beverage, Food & Tobacco Chemicals & Pharmaceuticals Construction & Engineering Diversified Footwear & Textiles Hotels & Travels Investment Trusts Land & Properly Manufacturing Motors Oil Palms Plantations Services Stores & Supplies Trading Power & Energy Health Care Information Technology Telecom
109,377 18,125
4,720 4,847
19,406 5,570
31,453 2,493
12,465 17,095
1,810 219
17,929 400
1,644 3,074
6 2,360
133 -
425,380 84,743
6,870 15,507
105,287 14,849
201,489 2,684
89,927 210,680
3,290 195
41,565 340
5,710 3,744
- 7,680
105 -
12,304 1,662
331 347
7,093 173
2,062 63
542 4,579
95 75
585 14 34 95
- 130
1 -
Source: Colombo Stock Exchange
A recovery of secondary market activities were notable in the last quarter of 2001 and the trend continued in 2002 also, when the CSE improved significantly, key market indicators reaching their peak in September with a turnover exceeding Rs 5 billion. Both local and foreign investors actively participated in the market, anticipating better prospects with the progress of the peace talks. The ASPI and MPI reached their highest of the year on September 26, indicating 860.3 and 1479.8 respectively.
The legislation was amended during the year to give wider powers to the Securities and Exchange Commission (SEC) for the betterment of the Colombo Stock Exchange. Employment
More than 50 % of the total work force employed in agricultural activities up to the end of 1970s. This dependency gradually moved towards the industries and services. Now the employment in services, are outstanding among the three sectors. In 2002, 45.8 % of the total work force employed in services, while the employment in agriculture and industry were 33.1 % and 21.1 % respectively. The number of employees as estimated rose marginally by 100,000 from 6.3 million in 2001 to 6.4 million in 2002. But the share of industrial sector employment declined as a result of weak functioning of export oriented industries and construction activities. Employment in trade and hotel sector increased during 2002 benefiting from the partial recovery market activities and tourism. Public sector employment declined to 1.09 in 2002 million from 2.08 million in 2001, circumstances being reductions of employment in semi-government sector by 5.2 %, although there was an increase of 0.5 % in government sector. Foreign employment also moved up by 11 % to 203000 in 2002.
163

Table 16 Employment by Economic Activity
In Thousand Persons Percentage
Total Employment
2001(a) 2002 2001 2002 Sector
2000(a) Q1 Q3 Q4 Q1 Q2 Q3 Q3 Q3
Agriculture Industry
Mining and quarrying (c) Manufacturing Construction Electricity, gas and water (d)
Service Trade and hotels, etc. Transport, storage & Communication Finance, Insurance and real estate Personal services and other
Total employment Percentage of labour force
2,274 1,491 67 1,045 348 31 2,645 801 307 131 1,307 6,310 92.4
1,9921,474101 1,036337 2,746820 412 138 1,3766,21292.3
2,0071,554118 1,088348 2,641738 406 118 1,3766,20292.2
2,1011,445111 1,047287 2,747875 348 165 1,3596,29391.7
2,3421,422 1,125297 2,898973 282 153 1,4906,66291.3
2,152 1,313 1,035 278 2,865 928 334 155 1,448 6,330 90.2
2,120 1,355 1,092 263 2,034 1,012 297 189 1,436 6,409 90.9
32.4 25.1 1.9 17.5 5.6 42.6 11.9 6.5 1.9 22.2 100.1
33.1 21.1 17.0 4.1 45.8 15.8 4.6 2.9 22.4 100.0
(a) Average of four quarters (b) Quarterly labour force survey was not conducted in 2001-Q2 (c) Mining and quarrying categorized under personal services from 2002-Q1 (d) Electricity, gas and water categorized under personal services from 2001-Q1 Source: Department of Census and Statics Table 17 Public Sector Employment
Year Government Institutions(a)
Semi- Government Institutions (b) Total
1990 1998 1999 2000 2001 2002 (c)
649,000 790,492 822,122 856,665 863,993 825,995
703,200 300,654 298,248 299,615 300,997 264,355
1,352,200 1,091,146 1,120,370 1,156,280 1,164,900 1,090,350
(a) Central Government, Local Governments and Provincial Councils (b) State Corporations, Statutory Boards and State Authorities Source: Central Bank of Sri Lanka
In the meantime, steps were taken to amend regulations of some old Acts and Ordinances as to solve long standing labor market issues. These amendments were done to the legislation of Factory Ordinance of 1942; Industrial disputes Act of 1950 and Termination of Employment Act of 1971.
Labor force participation rate rose from 48.3 % in 2001 to 49.4 % up to the third quarter of 2002, whilst the unemployment rate of the third quarter of 2002 was 9.1 % as a percentage of the total labor force. Table 18 Unemployment Rate as a Percentage of Labor Force
One Week Reference Period 12 Months Reference Period Period
Male Female All Excluding Unpaid Family Workers All
1998 1999 2000 2001(a)
1st Quarter 2nd Quarter (b) 3rd Quarter 4th Quarter
2002 (a) 1st Quarter 2nd Quarter 3rd Quarter
6.5 6.7 5.8 6.2 5.8 n.a. 6.0 6.8 7.0 6.5 7.3 7.1
14.013.011.111.411.7n.a.
11.511.113.612.814.813.2
9.28.97.67.97.7n.a.7.88.39.28.79.89.1
10.5 10.1
8.6 8.8 8.5 n.a. 8.6 9.2
10.3 9.8
10.8 10.0
10.4 9.1 8.2 8.2 7.7 n.a. 8.5 8.3 9.0 8.5 9.9 8.6
(a) Average of three quarters (b) Quarterly survey was not conducted for 2001-Q2 Sources: Department of Census and Statistics, Central bank Sri Lanka
164
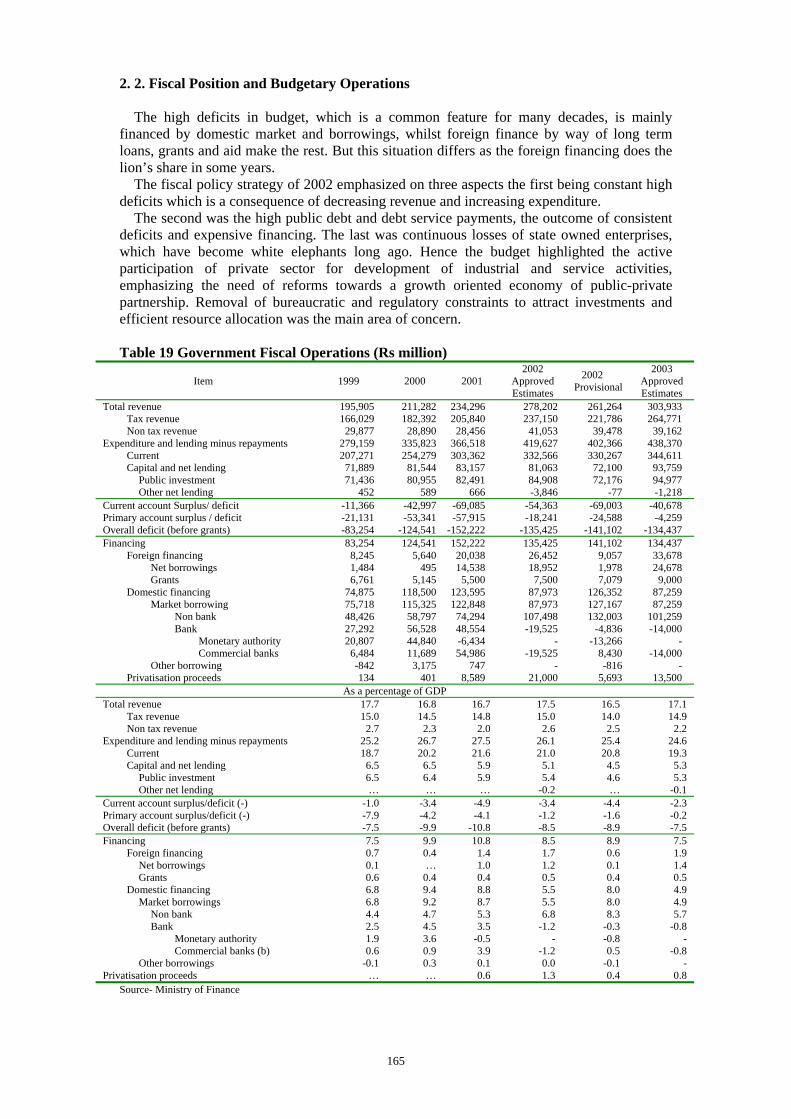
2. 2. Fiscal Position and Budgetary Operations
The high deficits in budget, which is a common feature for many decades, is mainly financed by domestic market and borrowings, whilst foreign finance by way of long term loans, grants and aid make the rest. But this situation differs as the foreign financing does the lion’s share in some years.
The fiscal policy strategy of 2002 emphasized on three aspects the first being constant high deficits which is a consequence of decreasing revenue and increasing expenditure.
The second was the high public debt and debt service payments, the outcome of consistent deficits and expensive financing. The last was continuous losses of state owned enterprises, which have become white elephants long ago. Hence the budget highlighted the active participation of private sector for development of industrial and service activities, emphasizing the need of reforms towards a growth oriented economy of public-private partnership. Removal of bureaucratic and regulatory constraints to attract investments and efficient resource allocation was the main area of concern. Table 19 Government Fiscal Operations (Rs million)
Item 1999 2000 2001 2002
Approved Estimates
2002 Provisional
2003 Approved Estimates
Total revenue Tax revenue Non tax revenue
Expenditure and lending minus repayments Current Capital and net lending
Public investment Other net lending
195,905 166,029 29,877
279,159 207,271 71,889 71,436
452
211,282182,39228,890
335,823254,27981,54480,955
589
234,296 205,840 28,456
366,518 303,362 83,157 82,491
666
278,202237,15041,053
419,627332,56681,06384,908-3,846
261,264 221,786 39,478
402,366 330,267 72,100 72,176
-77
303,933 264,771 39,162
438,370 344,611 93,759 94,977 -1,218
Current account Surplus/ deficit Primary account surplus / deficit Overall deficit (before grants)
-11,366 -21,131 -83,254
-42,997-53,341
-124,541
-69,085 -57,915
-152,222
-54,363-18,241
-135,425
-69,003 -24,588
-141,102
-40,678 -4,259
-134,437 Financing
Foreign financing Net borrowings Grants
Domestic financing Market borrowing
Non bank Bank
Monetary authority Commercial banks
Other borrowing Privatisation proceeds
83,254 8,245 1,484 6,761
74,875 75,718 48,426 27,292 20,807
6,484 -842 134
124,5415,640
4955,145
118,500115,32558,79756,52844,84011,689
3,175401
152,222 20,038 14,538
5,500 123,595 122,848 74,294 48,554 -6,434 54,986
747 8,589
135,42526,45218,952
7,50087,97387,973
107,498-19,525
--19,525
-21,000
141,102 9,057 1,978 7,079
126,352 127,167 132,003
-4,836 -13,266
8,430 -816
5,693
134,437 33,678 24,678
9,000 87,259 87,259
101,259 -14,000
- -14,000
- 13,500
As a percentage of GDP Total revenue
Tax revenue Non tax revenue
Expenditure and lending minus repayments Current Capital and net lending
Public investment Other net lending
17.715.0
2.725.218.7
6.56.5…
16.814.5
2.326.720.2
6.56.4…
16.714.8
2.027.521.6
5.95.9…
17.515.0
2.626.121.0
5.15.4
-0.2
16.5 14.0
2.5 25.4 20.8
4.5 4.6 …
17.114.9
2.224.619.3
5.35.3
-0.1Current account surplus/deficit (-) Primary account surplus/deficit (-) Overall deficit (before grants)
-1.0-7.9-7.5
-3.4-4.2-9.9
-4.9-4.1
-10.8
-3.4-1.2-8.5
-4.4 -1.6 -8.9
-2.3-0.2-7.5
Financing Foreign financing
Net borrowings Grants
Domestic financing Market borrowings
Non bank Bank
Monetary authority Commercial banks (b)
Other borrowings Privatisation proceeds
7.50.70.10.66.86.84.42.51.90.6
-0.1…
9.90.4…
0.49.49.24.74.53.60.90.3…
10.81.41.00.48.88.75.33.5
-0.53.90.10.6
8.51.71.20.55.55.56.8
-1.2-
-1.20.01.3
8.9 0.6 0.1 0.4 8.0 8.0 8.3
-0.3 -0.8 0.5
-0.1 0.4
7.51.91.40.54.94.95.7
-0.8-
-0.8-
0.8Source- Ministry of Finance
165
2. 2. 1. Government Expenditure and Public Borrowing
Defense expenditure, starting from mid 1980s to be the main item of expenditure had been increasing heavily until the end of 2000. In 2002, the strenuous effort made as to avoid overruns of expenditure and non-priority expenditure caused in containing of current expenditure to 21 % of GDP and public investment at 5.4 % of GDP. Rationalization of expenditure achieved the target limiting current expenditure at 20.8 % of GDP.
A decline of current expenditure by 21.6 %, as a percentage of GDP was a notable factor in2002. This is mainly due to the ongoing peace process, which reduces the defense expenditure. However current expenditure increased by 9 % over the previous year to Rs 330.9 billion during 2002. Expenditure on salaries and wages, which was 27 % of current expenditure, amounted to Rs 88.8 billion indicating an increase of 13 % compared to 2001. This figure might have been more if the new recruitment to all government departments and agencies was not suspended.
With the benefit of the cessation of hostilities in north and east, the war affected areas of the country; defense expenditure could be managed within budgeted level of Rs 49.2 billion, a 9 % reduction over 2001. The decline was 3.1 % of the GDP.
Interest expenditure accounted to 35 % of recurrent expenditure of 2002. This is a growth of 24 % of the figure in 2001. As a percentage of GDP it rose up to 7.4 % in 2002 from 6.7 % in 2001. This is completely due to the accumulation of high cost domestic debt, which has been used as a bridge to reduce budget deficit. Becoming the highest single item of current expenditure, interest on domestic loans amounted to Rs 105.9 billion, an increase of 25 % over 2001. Interest payments on treasury bonds amounted to Rs 36.4 billion, while the interest on Rupee securities was Rs 38.2 billion. Interest payments on treasury bills and government overdrafts and outstanding import bills amounted to Rs 25.7 billion and Rs 4.4 billion respectively.
Public investment program, at 5.4 % was the lowest planned investment program of the recent years. A strict policy in allocating domestic funds to public investment program was followed in budget of 2002 whilst more emphasis was placed in absorbing concessional foreign funds for this purpose.
A number of social welfare programs are underway considering eliminating poverty. Commencing from food stamp program in 1979, which was replaced by “Janasaviya” in 1989, the program covers most of the needy people under “Samurdhi” program today. Along with the fertilizer subsidy and distribution of school uniforms and text books these programs benefit most of the needy groups in society, although some weaknesses can be noticed in implementation of these programs. The total expenditure on such programs amounted to Rs 18,989 million in 2002, compared to expenditure of Rs 21,618 million in 2001. 2. 2. 2. Aggregate Tax Revenue
Tax revenue as indicated in the performances during the last two decades has contributed around 85 % of the total government revenue. But tax revenue as a percentage of GDP continued to fall and was 14 % of GDP compared to 14.6 % in 2001. This happened in spite of reforms undertaken to simplify the tax system and broaden the tax base together with improvement of tax administration. The reasons for the decline of potential tax revenue in terms of the GDP can be identified as the sluggish recovery of the economy and the implementation of major tax reforms with a wide tax amnesty in all fields. The increase in non-tax revenue was 2.5 % in 2002 and resulted in total revenue to GDP ratio at 16.5 %, which was similar to the percentage of 2001. Non-tax revenue was Rs 39.5 billion in 2002, in comparison to 28.5 billion in 2001 although there was a shortfall of the targeted figure which was Rs 41 billion.
166
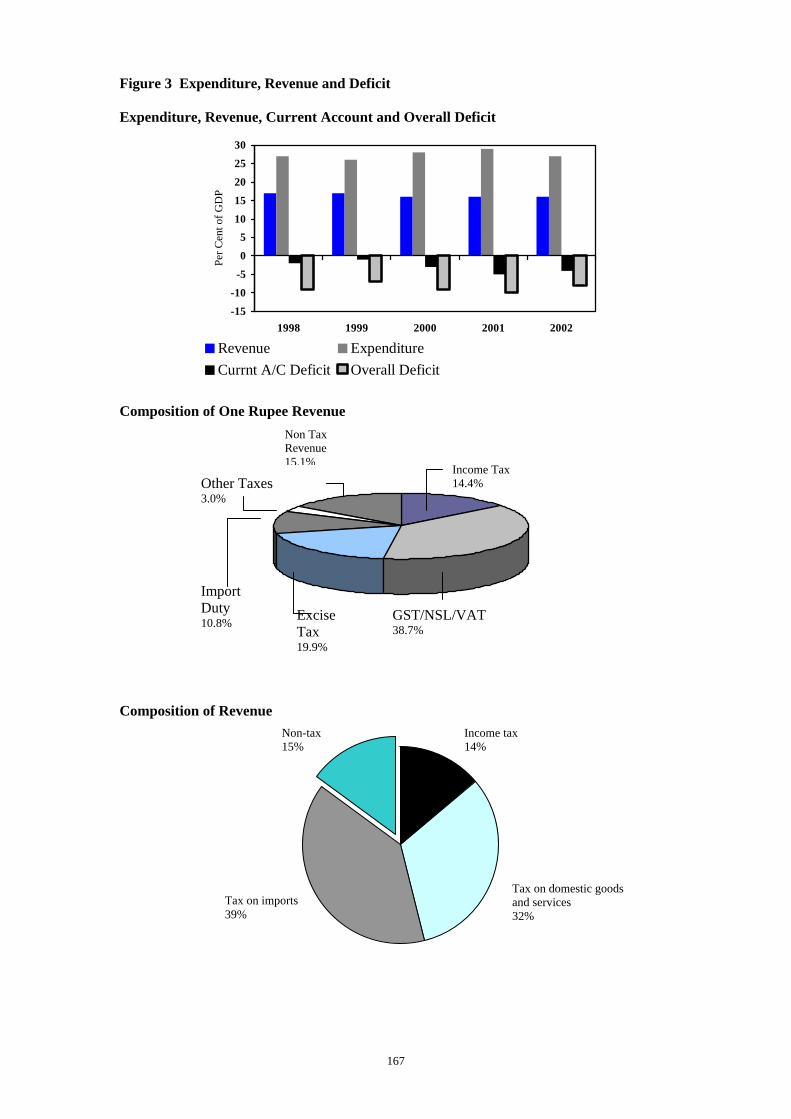
Figure 3 Expenditure, Revenue and Deficit Expenditure, Revenue, Current Account and Overall Deficit
-15
-10
-5
0
510
15
20
25
30
1998 1999 2000 2001 2002
Per C
ent o
f GD
P
Revenue ExpenditureCurrnt A/C Deficit Overall Deficit
Composition of One Rupee Revenue
Other Taxes 3.0%
Import Duty 10.8% Excise
Tax 19.9%
GST/NSL38.7%
Composition of Revenue
Tax on imports 39%
167
Income Tax14.4%
Non Tax Revenue 15.1%
/VAT
Tax on domestic goods and services 32%
Income tax 14%
Non-tax 15%

Financing the Deficit
-202468
10
1998 1999 2000 2001 2002
Per C
ent o
f GD
P
Forein grants and Loans Domestic non-bank borrowingsDomestic bank borrowings Privatisation proceeds
How a Rupee was spent
Defense and Public Order and Safety 21.1%
Source: Central Bank of Sri Lanka
Capital Net lending 18.0%
168
Civil Salaries and Wages 13.1%
Interest Payments 29.0%
Transfers to Households 13.4%
Other Recurrent 10.3%

Table 20 Classification of Revenue (Rs million)
Item 1999 2000 2001 2002
Approved Estimates
2002 Provi- sional
Tax revenue Income taxes
Personal Corporate Save the Nation contribution Tax on interest
Stamp duties Debits lax Taxes on goods and services
Turnover tax GST/VAT
Manufacturing Non- manufacturing Imports
Excise Tax Liquor Cigarettes Petroleum Other
National Security Levy Licence fees/ motor vehicles lax
Taxes on international trade Imports Ports and Airports Levy
Non tax revenue Property income
of which: Central Bank profits interest income
Fees and changes Other non-tax revenue
166,029 28,228
9,169 18,362
697 -
7,690 -
102,391 1,790
35,540 5,533
14,211 15,796 35,928
8,745 17,205
7,241 2,737
28,127 907
27,720 27,720
- 29,877 18,988
3,000 7,056 3,375 7,514
182,392 27,457 10,820 15,757
880 -
8,163 -
122,802 1,708
43,893 11,378 13,643 18,872 42,655
9,531 19,268 10,700
3,156 33,539
1,007 23,970 23,970
- 28,890 18,842
3,200 7,304 3,589 6,459
205,840 34,636 12,203 16,673
1,027 2,733 8,415
- 136,633
1,119 45,900 12,521 14,453 18,961 44,978
9,796 19,475 12,948
2,760 43,066
1,570 28,156 26,156
- 28,456 17,406
5,000 7,628 3,811 7,239
237,149 38,992 13,837 22,906
- 2,250 3,407 2,300
158,475 548
87,835 19,084 25,777 42,974 52,321 10,300 21,204 17,102
3,715 17,211
560 33,975 29,775
4,200 41,053 28,584 10,000 11,203
4,764 7,705
221,786 37,619 12,172 13,934
- 11,513
2,511 1,312
148,540 733
66,458
35,528 30,930 52,099 10,228 20,578 16,706
4,587 28,695
555 31,804 28,307
3,497 39,478 25,808 10,000 11,509
4,370 9,301
Total revenue 195,905 211,282 234,296 278,202 261,264 As a percentage of GDP
Tax revenue Income taxes Stamp duties Debits tax Taxes on goods and services
Turnover tax GST/VAT Excise tax National Security Levy Licence fees/Motor Vehicles tax
Taxes on international trade Non tax revenue
15.0 2.6 0.7
- 9.3 0.2 3.2 3.2 2.5 0.1 2.5 2.7
14.5 2.2 0.6
- 9.8 0.1 3.5 3.4 2.7 0.1 1.9 2.3
14.6 2.5 0.6
- 9.7 0.1 3.3 3.2 3.1 0.1 1.9 2.0
15.0 2.5 0.2 0.1
10.0 …
5.5 3.3 1.1 0.0 2.1 2.6
14.0 2.4 0.2 0.1 9.4 …
4.2 3.3 1.8 0.0 2.0 2.5
Total revenue 17.7 16.8 16.7 17.5 16.5 Source – Ministry of Finance
In 2002, tax revenue was Rs 221.8 billion, with a growth of 8 %. The tax collection to total revenue declined to 85 % from 88 % in 2001. As for the composition of tax revenue 83 % was contributed by the consumption taxes and the rest by income taxes.
A marginal decline was occurred in income taxes, from 2.5 % of GDP in 2001 to 2.4 in 2002. Revenue from corporate taxes declined drastically 0.9 % of GDP from 1.5 in 2001. Personal income tax revenue fell marginally from 1 % of GDP in 2001 to 0.8 in 2002. However, an increase of withholding taxes offset this drop preventing a significant reduction of overall collection of income taxes.
The removal of 20 % surcharge on corporate taxes, the abolition of the imputation system with abolishing of Advance Company Tax (ACT) which reduced the advance collection of Mainstream tax and carried forward unclaimed balances of investment tax allowance (although it was abolished with effect from April 01, 2000) are the main factor in declining of corporate tax
169
revenue. In addition to them, introduction of a lower rate of tax for companies having a taxable income not exceeding Rs 500,000 was also a cause for the reduction of corporate tax revenue.
Revenue from withholding taxes, which have been imposed on salaries and wages, interest, dividends and specified fees increased dramatically in 2002. The collection in 2001 was Rs 2.7 billion and it mounted to Rs 11.5 billion in 2002. The extension of withholding tax to government securities with effect from May 01, 2002 was responsible for this dramatic increase that contributed over 75 % of total withholding tax collection.
Consumption tax revenue declined to 11.6 as a percentage of GDP in 2002 from 12.1 % in 2002. Taxes on imports remained at the same level of 2001 which was 6.4 % of GDP, while taxes on domestic goods and services declined to 5.2 % from 5.7 % in 2001 as a percentage of GDP. In July, 2002, Consolidation of Goods and Services Tax (GST) and National Security Levy (NSL) as one tax was done with the introduction of Value Added Tax (VAT) at the rate of 20 %, for simplifying the tax system and improving revenue collection. However, the combined collection from GST, NSL and VAT fell to 6 % of GDP from 6.3 % in 2001. The irregularities in application of VAT such as exemption of certain financial services and hire purchase transactions which were liable to NSL and application of lower rate of 10 % to some sectors like construction reduced the revenue.
The revenue by stamp duties less than expected level due to large number of exemptions and abolition of stamp duties collected on some transactions, especially on cheque leaves by which revenue streamed automatically with the issuing of cheques. However, the debits tax, introduced as a replacement to the stamp duty did not bring expected results.
Tax revenue by way of excise taxes grew by 16 % to Rs 52 billion in 2002. This represented 3.3 % of GDP. Excise tax collection from petroleum products and motor vehicles rose increasing the total collection of excise tax and the percentage. Excise taxes on petroleum products increased to Rs 16.7 billion by 29 % from 2001, as a result of payment of excise tax arrears by Ceylon Petroleum Corporation. Excise tax on motor vehicles contributed Rs 4.6 billion at an increase of 66 %. Cigarette sales and liquor products contributed Rs 20.6 billion and 10.2 billion respectively to total excise tax revenue in 2002.
Taxes on imports increased to 46 % of total tax revenue from 44 % in 2001. Import duties, although grew by 8 % in 2002, a marginal reduction from 1.9 in 2001 to 1.8 1n 2002 in terms of GDP was notable. That is mainly due to lower collections of the import surcharge which fell to Rs 4.6 billion in 2002 from 5.4 billion in 2001.
170
III. Tax Policy and Structure
Tax policy in Sri Lanka is made and implemented to achieve the fiscal, economic and social goals of the government. Generating revenue for the necessary expenditure of the country, while encouraging the efficient use of country’s resources to achieve the development is what is expected from the current tax policy. After achieving independence in 1948, tax policy and structure underwent a number of reforms from time to time in accordance with the policy changes and needs of the country. The most recent policy changes made according to the instructions of the IMF as to move the tax base towards consumption as a broad tax base, from income by granting many incentives to the corporate sector is outstanding. It has given rise to pros and cons from many different sectors although effective compliance, whilst reducing administrative and compliance costs can be achieved in the long run.
Taxing institutions operate in national level as well as local level. Almost all the major taxes are administered by the Central government under following institutions.
• Inland Revenue Department • Customs department • Excise Department
Tax-collecting institutions functioning in local level comprises following bodies. • Provincial councils – Provincial Revenue Departments • Municipal councils • Urban councils
The tax structure of Sri Lanka consists of major taxes in the calibre of corporate and individual income tax; value added tax, stamp duty and debits tax administered by Inland Revenue Department (IRD), import duty by Customs Department and excise taxes by Excise Department, for carrying out of the tax policy of the government. In addition, Provincial Revenue Offices of the provincial councils administer turnover tax at a rate of 1 % on trading activities which comprise mere buying and selling.
Income tax was introduced in Sri Lanka in 1931 and the Department of Inland Revenue was established in 1932, during the British Rule. The tax system was subject to many reforms in accordance with the change of policies and the development process, after Sri Lanka achieved independence. The official assessment system converted to a self-assessment system in 1973. Major tax reforms were implemented in 1977, few times in 1980s, 1998, 2001 and 2002. The recent reforms were introduced for achieving a broader tax base by transforming into more effective tax on consumption (Value Added Tax instead of Goods and Services Tax and National security Levy) and encouraging corporate sector by way of concessions on income tax. The other objective of these reforms is to encourage foreign investments.
The mission of the IRD as an establishment under the Ministry of Finance has two dimensions. First is to collect taxes under the law by encouraging voluntary compliance and deterring tax evasion and tax avoidance. The other is to enhance the public confidence in the integrity and the efficiency of the tax system by administering tax and related legislation fairly, uniformly and courteously, and thereby facilitate and foster a beneficial tax culture.
The main objective of present tax system is generating revenue for government expenditure while encouraging economic and efficient use of country's resources to accelerate development. 3. 1 The Organization Structure of IRD
The Department of Inland Revenue is the national tax administration, which collects more than 50% of total annual revenue of the Government. Headed by the Commissioner General of Inland Revenue (CGIR) who is appointed by the Cabinet from the Inland Revenue service, the Department has 10 Commissioners of Inland Revenue (CIR). Commissioners are appointed by
171
the public Service Commission out of senior-most Deputy Commissioners (DC) to supervise their group of offices and subject areas.
To carry out statutory functions of legislative enactments there are 42 Deputy Commissioners as the superior officers who are responsible for the administration of their respective units and senior assessors, assessors and tax officers in branches and units located in Colombo and throughout the country.
The head office, which is located in Colombo shelters 20 assessing units while there are 13 regional offices out of Colombo territories. Functions of these offices are assessing and collection of taxes by enforcing compliance. In addition to the above offices there are other units dealing with Organization, Training, Legal, Internal Audit, Information and Computer Service. 3. 2. Taxes Administered by IRD
Inland Revenue Department administers most of the major taxes including several taxes imposed on three tax bases of income, consumption and property. Major legislative enactments and taxes administered by IRD are as follows.
Legislative enactments administered by the Department of Inland Revenue. • Inland Revenue Act, No. 38 of 2000 • Value Added Tax Act, No. 14 of 2002 • Turnover Tax Act, No. 69 of 1981(Abolished/ Outstanding cases only) • Stamp Duty Act, No. 43 of 1982 • Debits Tax Act, No 16 of 2002 • National Security Levy Act, No. 52 of 1991 (Abolished)
Taxes on Income • Personal Income Tax • Corporate Income Tax • Income Tax on other bodies of persons
Taxes on Property Transfers and Withdrawals from Bank Deposits • Stamp Duty • Debits Tax
Taxes on Domestic Goods and Services • Value Added Tax
(A) Law of Income Tax Income tax is governed by the Inland Revenue Act, No. 38 of 2000 and charged in respect of
profits and income of every person for relevant year of assessment. Year of assessment commences on First of April 01 of a calendar year and ends on Thirty First of March of the following year.
Under the self-assessment system, taxpayers shall submit their tax returns with necessary information on or before the Thirtieth day of November of the following year of assessment. Tax payments have to be made in four quarterly self-assessed payments and a final payment if necessary when the return is submitted.
Resident persons are liable to tax on profits and income arising in and out of Sri Lanka (on the basis of world-wide/ global income). Non Resident persons are chargeable on profits and income arising in or derived from Sri Lanka.
“Person” includes following categories according to the definition in the Act. (a) Individuals (b) Companies (c) Any Government (d) Body of persons
172

“Body of persons” includes any local or public authority, any body corporate or collegiate, any fraternity, fellowship, association or society of persons whether corporate or unincorporated and Hindu undivided family, but does not include a company or a partnership.
Sources of Income Profits and income are categorized as follows (sources of income).
• Trade, Business Profession or vocation • Employment • Income from land and improvements thereon - Net annual value of owner-occupied houses - Net annual value as occupier’s income - Rent • Dividends • Interest (withholding tax of 10% is the final tax with effect from April 01, 2002) • Capital gains (abolished with effect from April 01, 2002) • Charges, Annuities, Royalties, Premiums and Discounts • Income from any other source except for casual and non-recurring income
Corporate Income Tax
Corporate income tax is imposed on companies incorporated or registered under any law in force in Sri Lanka and public corporations. Resident and Non resident companies, as legal entities, are liable to income tax on profits and income earned during a year of assessment. Liability of Resident and Non-resident Companies
If a company has its principal or registered office in Sri Lanka or the control and management is carried out in Sri Lanka such company is considered as a resident company and they are categorised as quoted public companies and non-quoted or private companies for tax purposes. Resident companies are liable to pay income tax on profits and income on the basis of wherever arising during the relevant year of assessment (world-wide income). In case of body of persons too, residency is determined according to the same principle of registered office or place of control and management.
The companies that do not belong to the category of resident companies are considered as non-resident companies and they are liable to pay income tax on profits and income arising in or derived from Sri Lanka.
Ascertainment of taxable income of companies explained under ‘Ascertainment of Income’. Computation of taxable profits and income under different sources differ according to the nature of that category. In case of a trade, business, profession or vocation ascertainment of income is same for companies as well as individuals. Ascertainment of Income
In ascertaining the business income of the companies (As defined in the act, business includes any agricultural undertaking, the racing of horses and the letting of premises for commercial purposes by a company.) The methodology enumerated in relevant sections of the Inland Revenue Act must be followed by them. After deducting all necessary expenses in accordance with the sections 23 and 24 of the Inland Revenue Act, the statutory net income for the tax purposes is arrived. These provisions apply for any trade, profession and vocation as well.
Final accounts of a trade, business, profession or vocation, which are produced to IRD with returns of income, should be based on proper books of accounts, maintained in accordance with the generally accepted accounting principles. Sri Lanka Accounting Standards (SLAS) is mainly followed by accountants for this. All outgoings and expenses incurred for the production of
173
income are deductible in ascertaining the net income. Although expenditure of capital nature cannot be deducted, specifically provided depreciation allowances for capital assets are deductible annually. Allowances for Depreciation
Inland Revenue act provides depreciation allowances for the wear and tear of the capital assets in use of the production of the income of a business under several specific rates. The eligibility for the depreciation allowances depend on one principal condition, the owner-user condition. For an example if an asset is leased and used in a company, it cannot claim depreciation allowance, but only lease rentals paid subject to certain limits.
• Qualified buildings used for any trade, business, profession or vocation – Qualified buildings mean any building constructed for the purpose of any trade, business, profession or vocation. The annual depreciation rate is 6.66 % of the cost (deductible in 15 equal instalments) from the year of assessment in which the asset is started to be used. “Qualified buildings” means buildings constructed and used by a person for the purpose of any trade, business, profession or vocation.
• Plant, machinery and fixtures – The rate of depreciation for these assets are 50% of the
cost of acquisition.
• Motor vehicles and office furniture – The allowance is 25% of the cost of acquisition.
• Information technology equipment and software – 100%
• Any motor coach acquired for the sole purpose of transporting employees of the business from and to their residences – The rate is 100%. (Equal to the cost)
When an asset, on which depreciation allowances have been claimed is sold such part of the income not exceeding the cost of the asset minus the unclaimed allowance for depreciation if any, is considered as normal trade income and liable for income tax. Total Statutory Income
The statutory income of each source of income is aggregated for the calculation of the total statutory income. For this purpose income under each source must be calculated in terms of the provisions of the act. Assessable Income
For arriving at the assessable income, some deductions which are not allowed under computation of income of sources can be claimed. These include losses, royalties, annuities, charges and interest on loans for the purposes of construction of buildings, purchase of any company shares and use in any trade, business, profession or vocation carried on or exercised by such person (company, individual etc). Some of these deductions are not available for corporate taxpayers. Deduction and carrying forward of losses
Losses incurred during previous years and/ or current year by companies and other persons shall be deducted, subject to several time periods and restrictions, depending on the nature of the businesses, from current income.
• A loss incurred from the Ordinary trading activities of a trade, business, profession or vocation, other than such part that consists of a capital loss or losses enumerated in following paragraphs, can be deducted against the total statutory income of the year in
174

which the loss is incurred and if there is any balance not deductible against that year’s income it can be carried forward up to immediately succeeding six years of assessment for deduction.
• A loss incurred in agricultural undertaking, other than such part attributable for any allowance for depreciation, is deductible against the total statutory income of that year of assessment and immediately succeeding eleven years of assessment.
• Such part of a loss attributable for allowances for depreciation can be deducted against the total statutory income of that year of assessment and immediately succeeding year of assessment and so on (No time limit for carrying forward).
• Losses incurred from the racing of horses – can be deducted up to the extent of any income from the same source and limited to such income. Any non-deductible balance is carried forward to succeeding year and so on without any time restriction.
• Any loss of a foreign currency banking unit (FCBU) from off-shore foreign currency transactions, which is not exempt – For this, such total statutory income should contain income from the same business. No time limit for carrying forward.
• Loss of a leasing business can be deducted against such income included in the total statutory income and any balance is carried forward without any time limit.
• Tax exempt undertakings – Any loss during the exempt period over exempt income can be carried forward according to the above provisions after the cessation of exempt period.
When a business ceased its operations and if any brought forward losses or current year’s losses are available in accordance with the above provisions, such losses can be carried back for deduction from the total statutory income of the immediately preceding year and so on, up to three years of assessment. Taxable Income
For the computation of taxable income taxpayers, irrespective whether they are corporate or individual can claim the amounts that they spent for qualifying payments as enumerated in the provisions of the Inland Revenue Act. Qualifying payments include donations to government, expenditure incurred by any person on any project included in the development plan of the government, investment in a year over Rs. 500,000 in new venture capital companies, donations to certain organizations named in the Act, expenditure for making films and donations to approved charities etc.
The allowance available for any corporate taxpayer is subject to certain restrictions. In respect of donations to the government, a local government or fund established by the government or a local government, the full amount of such donations, without any restrictions can be deducted and any balance can be carried forward for succeeding years. Expenditure for making a film deemed to have been made by a company shall not exceed Rs. Ten million. The allowance for other qualifying payments has been restricted to one fifth of the assessable income of that year of assessment.
Tax rates applied on income of corporations are different according to the amount of the taxable income and nature of business activities.
175
Table 21 Rates of Corporate Income Tax Nature of the business or Income ceilings Rate of Tax
Exports, Agricultural Undertakings, Promotion of tourism, Construction, Overseas Management Services Companies with a taxable income not exceeding Rs. 5 million Specialized Housing Banks Existing Venture Capital Companies Unit Trusts, Mutual Funds Other Companies except for the above
15% 20% 20% 20% 20% 30%
In addition, dividends including foreign dividends are taxable at 10%. In addition, liability extends to withholding tax on interest at 10%. Tax rate on remittances of
profits is also 10%. The imputation system that was introduced in 1988 under which advanced company tax was payable on qualifying distribution of dividends, was abolished with effect from April 01, 2002 as one step of simplifying the tax system.
Rate of income tax applicable to other entities including bodies of persons varies from 10% - 30%. Charitable institutions and provident funds are taxable at 10%, clubs and associations at 20% and partnerships (when the partnership income is assessed on the partnership), trustees and executers and other bodies at 30%. Any unspecified entity is also taxed at 30%. Personal Income Tax An individual is liable to income tax on what he earns from any source of income. Extent of liability varies in case of residents and non residents. Determination of Residency
Residency of individuals is determined according to the period of stay (physically present) in Sri Lanka. If the aggregate of the number of days which were spent in Sri Lanka are 183 or more such individual is considered as resident and taxed on world-wide income. Where an individual has been deemed as a resident in Sri Lanka for two or more consecutive years of assessment, he shall be deemed to be resident, until he is continuously absent from Sri Lanka for an unbroken period of three hundred and sixty five days. Computation of Income The computation of income is different according to the sources of income. Net income is the tax base for trade, business, profession or vocation as explained in corporate income tax, while individuals have to pay tax on gross amount in case of dividends, interest (Assessment tax is not imposed and subject to 10% withholding tax only), charges, annuities and royalties etc. For the computation of rents, payments of rates and a statutory deduction of 25% of the balance for repairs and other expenses without considering whether the actual amount paid is more or less, is available. Income of every source is aggregated in arriving at the total statutory income. Aggregation of Children’s income
The total statutory income of any unmarried child under 18 years of age is aggregated with the total statutory income of father or mother, subject to certain provisions of the Act. If the marriage of them exists child’s income is added to that of the father and if the marriage of parents does not exist, with the income of the one who maintains the child. Any statutory credit on withholding tax entitled by child is granted for such parent. Assessable Income
Computation of the assessable income is done by deducting any royalty, ground rent, annuity or interest and losses as explained under ‘Ascertainment of Income’ of corporate income tax.
176
Taxable Income After arriving at the assessable income a personal allowance (threshold) is available for them.
Every resident individual is entitled to a tax free allowance amounting to Rs 144,000 for the years of assessment 97/98 to 2001/2002 and Rs 240, 000 from the year of assessment 2002/2003. In addition to this an allowance for qualifying payments as explained under taxable income, is also available. Moreover, new construction or purchase of first house, investments in shares of new venture capital companies, contribution by individuals to provident and pension funds and payments of life and medical insurance premiums are also counted as qualifying payments for individuals. Donations to the government etc can be deducted without any restriction while 50% of investments over Rs. 500,000 per annum in venture capital companies are qualified but limited to one third of the assessable income. The allowance for expenditure on housing is the lower of one third of the assessable income or Rs. 100,000. The allowance for insurance premiums is limited to Rs. 25,000, while the deduction of other qualifying payments is the lower of Rs. 25,000 or one third of the assessable income. Tax Rates
Tax is calculated under progressive rates. The present tax rates are as follows. Taxable Income Rs Rate of Tax (%) Cumulative Tax First 180,000 10 18,000 Next 180,000 20 54,000 Balance above 360,000 30 Withholding Tax
Mechanism adopted for the easy and advanced collection of income tax comprises following streams.
• Withholding Tax on interest paid in Sri Lanka at 10% of gross interest payable to any person for deposits should be deducted by banks and financial institutions and remitted to the IRD. This is a final tax and no credit is available against tax on other income.
• Employment income is subject to WHT under Pay as You Earn (PAYE) scheme. • On interest and royalties paid to persons out of Sri Lanka, WHT is payable at 20%. • WHT on dividends is payable at 10%. • On specified fees paid the tax rate is 5%. • Rewards, fine shares paid by the government at 10% • Lottery prizes, gambling and betting winnings are subject to WHT at 10%.
Furnishing of returns, assessment, appeal and recovery procedures are same for corporate taxpayers as well as individual taxpayers. If a person, who should submit a return as described under 3-2-1 above, fails to do so the Commissioner General of Inland Revenue may either impose a penalty not exceeding Rs. 50,000 and give notice in writing to pay such penalty or prosecute before a magistrate for such offence. Assessment Procedure
Where an assessor thinks that fuller and further returns and information are necessary for determination of liability of a person, he can give notice in writing for furnishing such information, books, deeds, plans, registers, trade lists, auditors reports so on. Furthermore, such person may be called for called for attend in person or by an authorized representative for examination regarding his income. A Deputy Commissioner may call any person, including any officer of a bank to attend for an interview and or submit any information and documents necessary for the determination of tax liability of a person. Field investigations can also be made in this regard.
177
Where any person, in the opinion of an Assessor is liable to income tax, has not paid such tax or has paid less than the proper amount an assessment may, subject to the provisions of the Act, may issue an assessment or additional assessment. When the assessor does not accept the return submitted he shall communicate in writing of any reasons as to why the return is rejected.
A time bar period of three years is applicable under normal circumstances for making assessments and additional assessments. But if the return has been furnished after the due date, November 30, of the immediately succeeding year of assessment, but before March 31, then the time bar is six years. Appeal Procedure
Any person who is aggrieved by the amount of an assessment or valuation made under the Inland Revenue Act may within a period of thirty days appeal against such assessment. The first stage of such appeals is to the Commissioner General of Inland Revenue, where it is settled by agreement between an assessor and such person or the determination by an adjudicator. If the taxpayer is not satisfied with such determination he can appeal to the Board of Review established in terms of the Act for this purpose. The decision of the Board is final. If the taxpayer is still not satisfied with the decision of the Board he can take the case to the court of appeal if it is regarding a question of law.
Any assessment becomes final and conclusive where there is no appeal or any appeal submitted has been rejected, settled, dismissed or determined in terms of the provisions of the Act. Recovery of Default Taxes
Once the assessed tax is not paid or held over it becomes default and an immediate fine of ten % and a monthly penalty of two % calculated in the lapse of every month from such date of default are added to the tax. The total penalty, in any case shall not exceed 50% of the tax amount.
Tax in default is considered to be a first charge upon all the assets of the defaulter. Recovery action is contemplated with notice issued to the defaulter for such purpose. Default tax is collected by using following methods provided in the Act.
• Recovery of tax by seizure and sale of properties of the defaulter. • Recovery by seizure of any bank account of the defaulter and any third parties who owes
money or to the defaulter or who holds assets on his behalf. In this respect the mechanism authorised in the Act includes recovery out of debts, assets of a partnership, income or wealth of a child, income payable to a beneficiary by a trustee or executor and remuneration from an employee if such employee has defaulted taxes. Besides, any default tax payable by defaulters are collected promptly if such defaulter is about to leave the island.
• Proceedings for recovery before a magistrate are also carried out where other means have failed or where it is necessary to do so.
Penal Provisions Relating to Fraud
Any person who attempts to evade tax or assists any other person to evade tax by omitting any income in his return, making false statement in the return, false statement of qualifying payments, giving false answer in verbally or writing for information requested, preparation or maintenance of false books of account and records or making use of any fraud, art or contrivance shall be guilty of any offence and shall be liable for conviction before a magistrate. Punishment is a sum equal to tax evaded or attempted to evade and a sum not exceeding Rs. 10,000 or imprisonment of either description for a term not exceeding six months or both such fine and imprisonment. (B) Value Added Tax
Goods and Services Tax, which was initially implemented from 1st April, 1998 was converted to Value Added Tax (VAT) with effect from August 01, 2002, as a tax on consumption and
178
spending. Being an indirect tax, burden of which is borne by the final consumer of goods and services the vender only collects tax for the government. One of the main objectives of introducing GST /VAT was to eliminate the cascading effect of the turn over tax that was in function up to 1998. The other was to secure continuous revenue without much enforcement cost, whilst widening the tax base. VAT on imports is collected by Customs Department and Board of Investments, and in case of such importer being a manufacturer input credit can be claimed for such payments in finalising liability VAT with the IRD. Tax Base
• Supply of goods and services in Sri Lanka • Import of goods
Value Added Tax is payable on domestic supply of goods and services and import of goods by a registered person according to the requirements of the legislation. With regard to supply of goods and services VAT is charged at the time of supply, on every taxable supply, made in a taxable period by such registered person in the carrying on or carrying out a taxable activity in Sri Lanka. Thus, in case of imports, VAT is charged at the time of import, on importation of goods and services to Sri Lanka. Exclusion from VAT
Certain imports and retail and wholesale supply of goods have been excluded from VAT. Exclusion from local supplies are wholesale and retail trading by persons, who are not manufacturers or importers are not liable to VAT at present. However a person engage in retail and wholesale trading can register voluntarily for VAT. Following imports are excluded from charging VAT.
• Any article which is entered into custom bonded area. • Any fabric imported for the manufacture of garments for export by a person, who has
entered into an agreement with the Board of investments (BOI) and transfer such fabric with the approval of Customs Department or BOI for another person to manufacture garments for export.
• Import of any fabric, yarn, grey cloth, finished cloth etc by a person who has entered into an agreement with the BOI for the manufacture of garments.
• Import of any ship. Threshold
Every person who carries on a taxable activity with taxable supplies over Rs 500,000 for any quarter or Rs 1,800,000 per annum are liable for VAT and required to be registered. Supply of many necessary food items some services like public transportation, education and health have been exempted from taxing. Computation of Tax
The amount of VAT payable is calculated with regard to manufacturing on Sale price excluding VAT multiplied by the VAT rate and deducting input tax, paid on purchases. In case of services, final consumer price excluding VAT multiplied by the VAT rate less input tax and on imports, CIF with the addition of duty, any surcharge and any excise duty payable and multiplied by the VAT rate. Rates of VAT
• The standard VAT rate is 20% • The lower rate is 10%. For example banks and other specified financial sector
organizations are taxed at 10%.
179
• Zero rates (0%) – Export of goods and specified international services comprising of international transportation and services directly connected with any moveable or immovable property outside Sri Lanka are liable at “zero rate”. Services directly connected with, any repair of any foreign ship or aircraft and cargo marine containers, goods imported for re-export and use outside Sri Lanka of any intellectual property such as patents, copyrights etc fall into this category.
• Special Rate – Each piece of garment supplied to the local market by a BOI approved garment manufacturer cum exporter is taxed at Rs. 25 per piece.
Payable amount of VAT is calculated as follows. VAT payable = Output tax – Input tax For the purpose of input tax credit invoices of purchases are the supporting documents and they
are mostly checked in detail for refund cases and inspected cases. . Submission of Returns
There are two taxable periods of VAT, month and quarter. Persons with the total taxable supplies exceeding Rs. 30 million for a 12 months period, persons who have entered into agreements prior to April 04, 2001 with BOI under section 17 of the BOI Law and persons making more than 50% of zero rated supplies and persons having less than 50% zero rated supplies under VAT deferment scheme should submit monthly returns.
VAT is deferred by BOI or Customs for 60 to 90 days in case of goods imported for manufacture and re-export of the goods so manufactured, any project related goods imported by a registered person during project implementation period and any plant or machinery imported by a foreign government or any regional or multilateral agency including United Nations Organization and any purchase of fabric by a person, from a manufacturer who has an agreement with BOI, for the manufacture of garments for export by the first mentioned person. Any goods being plant, machinery or other equipment of high value temporarily imported into Sri Lanka for re-export come under 12months deferment.
Except for the above, all other registered persons should submit quarterly returns. Every registered person shall keep records for VAT on an invoice basis. Thus tax must be
declared according to invoices issued during a taxable period and input tax must be claimed as per invoices received in such period. Assessment Procedure
An assessor has the power to make assessment on a registered person on following situations. • Failure to furnish the return • Failure to pay tax, after submitting the return • Failure to furnish the return, but the payment of tax is less than the amount payable, in
the opinion of the assessor • When any alterations requested by such person for the return, submitted by him • When the return furnished is not accepted by the assessor
Where an assessor does not accept a return submitted by a person, reasons for such rejection shall be communicated in writing.
Three year time bar is applicable in respect of assessments and additional assessments unless a fraud is alleged. Any appeal against an assessment or an additional assessment or penalty must be made in writing within 30 days of the date of assessment to the Commissioner General of Inland Revenue (CGIR).
180
Recovery of VAT If VAT collected from consumers has not been paid, it is an offence against which criminal
proceedings can be initiated. For the recovery of such tax the CGIR can take one or more of the following actions.
• Seizure and sale of movable property • Seizure and sale of the immovable property after obtaining a writ from the District Court
(Distraint Action) • Proceedings for recovery before a magistrate • Recovery the tax from the debtors of the defaulter or by seizure of his bank accounts
(C) Stamp Duty
Stamp duty is charged on the value of transfer of any property by sale or otherwise. Based on the market value of a property or the face value of a deed a fixed rate of stamp duty is payable. Tax rate applicable to first 100,000 is 3% and 4% is charged on the rest of the value. Stamp duty which was payable on cheque leaves obtained by current account holders was abolished in 2002. (D) Debits Tax
Introduced as effective from June 01, 2002 debits tax is payable at the rate of one tenth of one per centum (0.1%) on all debits transactions, proceeds realized by the encashment of certificates of deposits and travelers cheques.
In addition to the above taxes IRD administrates the outstanding cases of already abolished turnover tax and national security levy. 3. 3 Composition of Tax Revenue
The composition of tax revenue collected by IRD in 2001reveals the increasing trend of indirect taxes. Total revenue collected by the Department of Inland Revenue in 2001 was Rs 133230 Million, representing 57.55% of the total government revenue. Excise Levy and Import Duty administered by Excise Duty Department and Customs Department contributed more than 30% and non-tax revenue was approximately 11%. Table 5 24 Composition of Revenue collected by IRD in 2001
Type of Tax Collection (Million Rs) Percentage Income Tax 33615 25.25 Estate Duty 2 - Stamp Duty 8415 6.32 Save the Nation Contribution 1027 0.78 Turnover Tax 1118 0.84 Goods and Services Tax 45972 34.46 National Security Levy 43073 32.35 Betting and Gaming Levy 8 - ______ _____
133230 100.00 3. 4 Steps for Enhance Revenue Mobilization
The persistent decline of revenue mobilization as a percentage of GDP compelled the tax policy to be changed as to encourage the revenue enhancing measures. A major tax reform was made during 2002 along with measures to streamline existing tax incentives and minimize distortions. The government gave priority to reform tax structure by simplifying it and eliminating concessions while broadening the tax base and strengthening the administration with a view to enhance tax collection.
181
As the first step of this four taxes, the capital gain tax, advance company tax (ACT), transfer tax on non-residents and Major part of stamp duty collected by central government were abolished. Furthermore, 20% surcharge on corporate tax was abolished and 40% surcharge on import duty was reduced to 20%.
Introduction of value added tax by consolidating gods and services tax and national security levy was another major reform during 2003. Debits tax on withdrawals from current accounts and ports and airport development levy were introduced during the same year as a part of these reforms. The withholding tax on interest and dividends was made final taxes for non-corporate investors as to broaden the tax base and to avoid problems in administration of them. In case of individual income tax, the maximum tax slabs were reduced to three from four, while the rate of corporate income tax was reduced from 35% to 30%.
In administrative front, steps were taken to reform by taking both income tax and value added tax files of large tax payers under one administrative unit, the Large Taxpayer Unit (LTU) of the IRD, by enhancing activities of this unit.
In addition to the above a tax amnesty was declared under Special Provisions Act No. 7 of 2002 for persons with past undisclosed income, so that they can declare it without paying tax. The main objective of this is to bring these non-taxed proceeds to economic process while enhancing compliance which is a major problem for IRD. The tax amnesty was extended on two occasions and is still in progress. Formation of a Revenue Authority to monitor the activities of Inland Revenue, Customs and Excise was considered and about to be implemented. Both the tax amnesty and Revenue Authority are proposals of the International Monitory Fund (IMF). 3. 5 International Relations Bilateral Measures for Avoidance or Elimination of Double Taxation
With a view for eliminating or mitigating the incidence of double taxation, and to attract potential foreign direct investments for development and maintaining a high level of competition of other countries of the region, Sri Lanka has entered into 37 tax treaties at the end by 2002. These include treaties with United Kingdom, United States of America, Canada, Germany, Japan, Australia, Denmark, Belgium, Netherlands Norway, Poland and some European countries and many Asian countries. These treaties are of great importance for determination of liability of Sri Lankan resident persons having income derived in foreign countries and non-residents who derives income from Sri Lanka. As a developing country Sri Lanka generally follows the United Nations Model Double Tax Conventions in treaties.
• Presence of a permanent establishment (PE) and income attributable for such PE is defined according to the treaty, following the arrangement of the model tax conventions.
• Arms length principle and other commentaries to the articles of the model are followed in determining business profits.
• In case of dividends, treaty does not remove the tax liability on the company in Sri Lanka. Tax rate of a resident of another contracting state deriving such dividends, has been generally restricted to 15%.
• Interest borne by a resident person in Sri Lanka is deemed to be profit or income as the case may be, arising in or derived from Sri Lanka. Tax charged in Sri Lanka may not exceed 10% of the gross interest.
• In case of royalties tax charged does not usually exceed 10%. Section 92 (1) of the Inland Revenue Act enumerates that any arrangement of a treaty supersedes the provisions of the Act and relief from income tax, determining attributable profits and income of non residents of Sri Lanka and residents working on behalf of the non-residents must be adhered according to those arrangements.
182
Arrangements for tax credits and exemptions under these agreements are different according to each treaty. Where the foreign tax paid is lower than the tax in Sri Lanka, no tax is collected on such income. Under the exemption method such exempted income is not considered for calculating tax liability in Sri Lanka of any person. Tax treaties have become vital with the globalization of economic activities, for providing an environment with the legal and fiscal certainty to carry on international operations. In addition to these bilateral measures, Sri Lanka adopts some unilateral measures for this purpose. Unilateral Measures
For avoidance of double taxation Sri Lankan tax administration follows some unilateral measures such as unilateral relief from double taxation for any person or partnership registered outside Sri Lanka, performing certain services. These services include management consultancy services in plantation industry and telecommunication services based on computer technology, architectural, quantity surveying or construction management services and ancillary services thereto performed in Sri Lanka. The relief for income tax in Sri Lanka is such part of tax exceeding the amount of income tax payable for the corresponding period in any other by that person or partnership. If such person or partnership is not liable to pay income tax in respect of such profits and income of source country, the relief equals to the income tax payable in Sri Lanka for such income. 3. 6 Taxes Administered by Other Departments (A) Customs Duty
Imposed under Customs Ordinance No.17 of 1869, as amended from time to time Department of Customs collects import duty on the CIF value of all goods, wares and merchandise imported into Sri Lanka except for those which have been exempted. (B) Excise Duty
Administered by Department of Excise, under Excise Ordinance No. 8 of 1912 and subsequent amendments excise duty is payable on many commodities including soft and hard liquor, cigarettes, petroleum products and motor vehicles etc.
183
IV. Specific Fiscal Issues
As a developing country in the south-Asian region Sri Lanka has been experiencing the fiscal issues, most of which are common in the area. Steps taken to solve these problems are in function for decades, but the improvements of the situation are slow and gradual. Hence the need of stronger policy adjustments as to as to achieve a sustainable high growth of economic activity must be coupled with the elimination or mitigation of these issues. But it is very difficult to reach this target according to the prevailing fiscal situation, which is down with huge deficits.
The present crisis (as experienced in 2001) is the ultimate result of a lot of hostile vehicles that affected the economy severely from mid 1980s. The uncertainties created by the war dragged the country gradually to the political uncertainties which finally led to the economic crisis. The problems of year 2001 were a nightmare according to the views of many knowledgeable circles. In 2002, the situation was much better in comparison to 2001. The long felt need of seeking political solutions for the terrorist problem has now been started. However, main fiscal issues can be categorized as follows. 4. 1 Problems of Financing the Requirements of Defense
As the main course of country’s prevention of sustainable growth for years the present financial crisis was a direct consequence of the war (although some economic problems have also contributed). The need of financing high defense expenditure was a must, whilst terrorism crippled the economic activity of the country. This paved the way for the government to rely on domestic borrowings and foreign debt to finance the deficits of the last two decades.
Even now, although the cease-fire agreement is in function, with the assistance of the International Monitoring Mission, defense expenses are vital in war affected areas, as there are government controlled areas and Liberation Tigers of Tamil Ealam (LTTE) controlled areas in this region. 4. 2 Rehabilitation and Reconstruction
This is another facet of the same war problem. Even during the period of war rehabilitation and reconstruction activities were carried on. As a necessary requirement of the well being of public in these areas programs of this kind is a must. But the present fiscal situation is deteriorating due to this. 4. 3. Social welfare Programs
Despite remaining as a developing country in terms of per capita income and the success of areas of literacy, primary school enrolment, life expectancy and infant and maternity mortality etc, social welfare expenses which are very high in the front of fiscal issues, have being staying as a necessity.
There is a probability of thinking why these expenses are not reduced at this stage. But as a country with a highest share of public affecting from poverty (especially in the rural areas) poverty elimination programs, in spite of having some weaknesses in implementation avoiding expected welfare to public, has become a must. Majority of the population is spread out in these areas and although the per capita income satisfies the needs of a developing country there is a vast disparity of income.
Programs with the aim to create more employment opportunities in these areas by enhancing infrastructure and industries at a large scale will help these people upgrading their living
184
standards. Large scale investments in these areas, which do not attract private sector, have to be considered if the fiscal issues connected with this are to be solved.
Reduction of high fiscal deficit is the main challenge that policy makers face today. Even the foreign debt is instrumental in enhancing future deficits because of repayments of principal and the interest. Acceleration of reforms to improve the efficiency of the economy and optimize use of resources as to achieve high growth and stability, although colossal sums are necessary for implementation, is the needful in this aspect.
185

V. Conclusion – Where We Stand and Where We Go
The economic situation of Sri Lanka has been discussed extensively in the previous chapters of this study. The progressive trend of economic growth had been experiencing many booms and banes from 1983 and was more declining in the last years of 1990s. It was disastrous in 2001, where there was a contraction. One of the main reasons for not getting a sustainable growth has been the security situation of the country for years. In 2001, low demand, low industrial and agricultural production and unhealthy international environment added more woes.
As for the tax system the burden of taxes is shifting from higher income earners, to middle class with the implementation of value added tax. In compliance aspect and cost minimization, it is rational to transform towards an indirect tax from a direct tax. Comparatively, many benefits were granted for income taxpayers, mainly for corporate tax in recent years. A tax amnesty was declared as to bring the persons with undeclared sources of income in to the tax net. But it did not bring any additional revenue, since full amnesty of unrevealed income was declared. Although amnesty may, perhaps, have bad impact on genuine taxpayers it is one of the alternatives that can be followed to increase the number of taxpayers. Follow up action; strict scrutiny and proper guidance are a must to secure the future compliance of these new taxpayers as they tend to play their previous game. Further relief for low income earners, especially those who draw employment income have to be considered at this juncture.
Now that the country is heading towards a historical achievement, if it is successful in finding a political solution for the disastrous situation of war that created economic, political and social chaos, hopefully a better situation, as conveyed by parties who directly involved in the peace process. If the results come up to the expected level a better situation is on the cards.
But to be more specific, a mixture of friendly and unhealthy situations for the economic progress can be expected according to the present signs.
First, foreign grants and loans, as means to come out of the difficult fiscal situation are being been received. The result of the donor countries conference, held in June 2003 in Tokyo was very successful on the side of Sri Lanka as it mobilized funds worth US $ 4.5 billion. If the donor countries and organizations grant them without strict regulations for the actual needs, but with strict monitoring, conditions will be better in the future. Indeed, the government has to take the responsibility of best possible use of them as to get the maximum benefit and to protect sovereignty of the country. Not only Reconstruction activities in war affected areas but recent flood affected areas and activities of economic growth in less-benefited rural areas with infrastructure must be considered at this point. The technical support from the donor countries is a must in this aspect.
Although a better situation can be expected in this aspect, increasing foreign debt will cause heavy repayments in fiscal front, which will not be healthy for the country if expected results are not reached even with foreign aid.
Secondly, a potential high growth can be expected under the new political condition and of economic recovery in 2003 with an increase of foreign investor confidence, which is most probable according to the signs. This situation will definitely increase employment opportunities as well as exports. But a strong international environment with demand for the exports of developing countries cannot be expected as shown in recent years. For Sri Lanka, a drastically reduced demand for textiles and garments which is the main contributor to exports can be experienced in future with the reduction of the quota by the United States. Hence both export products and export markets must be diversified with new avenues to come out of this situation.
Both stock and financial markets are in a progressive move. On the banking front, an increasing trend of granting both business and consumer loans were visible in comparison to previous years. In Colombo Stock Exchange the highest-ever increase of the All Share Price Index of 1386.8 was reported on October 16, 2003. Transactions on last June 26 amounted to Rs
186
1.5 billion the highest on a day so far. Further, turnover of this year up to now marks the highest in a year with Rs. 55,800 million. If this trend goes on, the increased capital flow and investments will better the economic growth of the country. In addition to the above favorable results of tax reforms are helpful in increasing the investments and market activities to some extent.
The income level of people, especially most grades of employment income earners, senior citizens depending on interest income and peasants in less privileged and remote areas creates problems for them to keep pace with the increasing price level. Steps have to be taken to enhance the living standard of them. A stable increase of demand which is a necessity for the economic growth can sometimes be affected due to this problem.
The dedication to peace in either part is not visible on some occasions. There are number of breaches of the peace accord, according to Sri Lanka Monitoring Mission sources. Sri Lanka Monitoring Mission (SLMM) expected to be instrumental in minimizing them although they have failed or been prevented from acting on certain occasions, where potential interference had been vital. These incidents include constructing of camps, series of killing of politicians, members of police and armed forces and ordinary people of all communities and abducting etc. Even the lifted ban on LTTE was withdrawn by the United States and Canada recently. Hence dedication, honesty and compromising are necessary features of a successful and stable peace which anyone who likes the political, economic and social development and well-being of the sons and daughters of the nation without any difference, is craving for.
Finally the trend of all factors shows that a better economic situation with a stable growth can be achieved if everything goes smoothly and in a friendly manner. But over optimism is always not a better thinking as it avoids precautions that should be taken if the political, economic and social environment changes in an unfavorable manner.
187
References Central Bank of Sri Lanka- Annual Report (2002) Colombo Stock Exchange- Annual data Department of census and Statistics- Details of Population Colombo Consumer Price Index Department of Customs- Details relating to Composition of Imports Department of Excise- lists of liable commodities Department of Inland Revenue- Annual Report (2001) Government of Sri Lanka- Inland Revenue Act No 38 of 2000 Value Added Tax Ac No 14 of 2002 Debits Tax Act No 6 of 2002 Stamp Duty Act No 43 of 1982 Ministry of finance- Budget Proposals for Fiscal Year-2003
188


