Embed Size (px)
Citation preview

G5 U4 OVR
LessON 3 seafloor Profiling
Lesson at a Glance In this lesson, students will model a seafl oor with shoeboxes and wood blocks, map the seafl oor using bamboo skewers, plot the data as a line graph, thereby making a profi le of their seafl oor, and identify geological features on the profi le. Then the shoebox seafl oor models are exchanged among the student groups; each group discovers the new shoebox ocean that they have been given.
Lesson DurationThree 45-minute periods
Essential Question(s)How can models and simulations help us understand features of remote areas, such as the seafl oor?
How did early scientists use technology and math to develop scales for maps and navigational charts?
Key Concepts• Simulating the process of early seafl oor mapping and modeling
helps us to understand the limitations of early technology.
Instructional Objectives• I can create a model to simulate how scientists used to map the seafl oor. • I can convert simple units in order to create a scale for a map or chart.
Related HCPSIIIBenchmark(s):
Science SC.5.2.1Use models and/or simulations to represent and investigate features of objects, events, and processes in the real world.
Math MA.5.4.1Convert simple units within a system of measurement.
1
G5 U4 L3
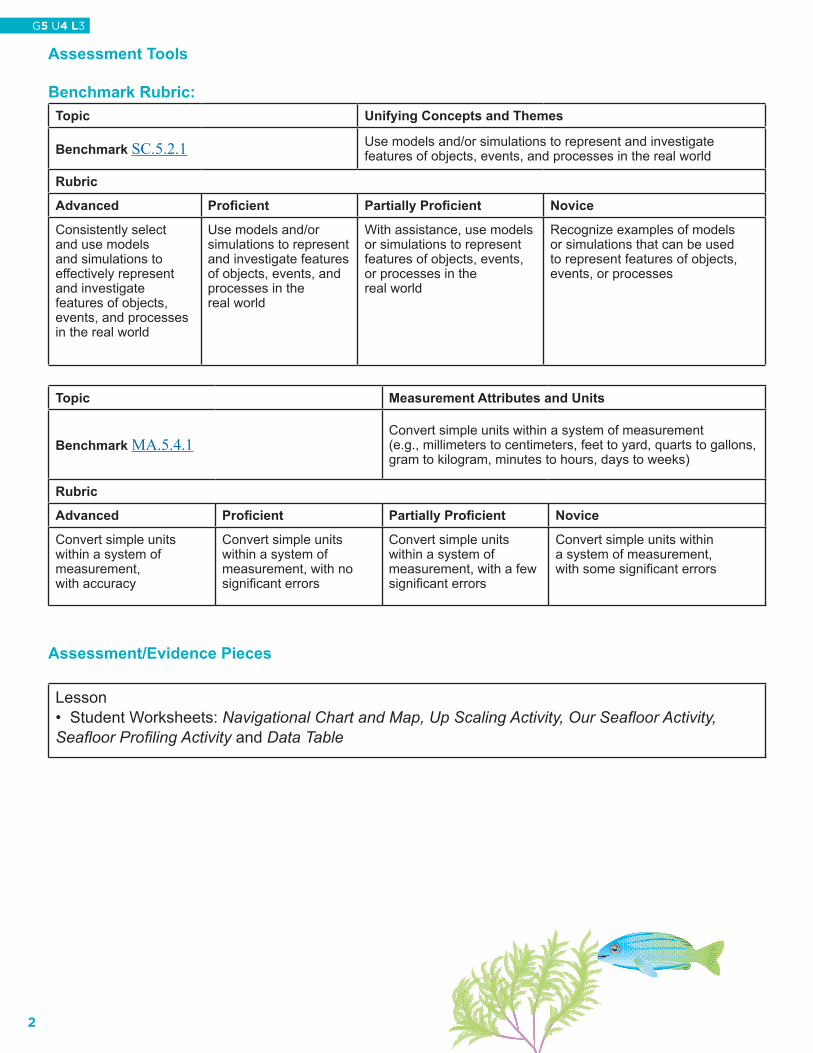
Assessment Tools
Benchmark Rubric:Topic Unifying Concepts and Themes
Benchmark SC.5.2.1 Use models and/or simulations to represent and investigate features of objects, events, and processes in the real world
Rubric
Advanced Profi cient Partially Profi cient Novice
Consistently select and use models and simulations to effectively represent and investigate features of objects, events, and processes in the real world
Use models and/or simulations to represent and investigate features of objects, events, and processes in the real world
With assistance, use models or simulations to represent features of objects, events, or processes in the real world
Recognize examples of models or simulations that can be used to represent features of objects, events, or processes
Topic Measurement Attributes and Units
Benchmark MA.5.4.1Convert simple units within a system of measurement (e.g., millimeters to centimeters, feet to yard, quarts to gallons, gram to kilogram, minutes to hours, days to weeks)
Rubric
Advanced Profi cient Partially Profi cient Novice
Convert simple units within a system of measurement,with accuracy
Convert simple units within a system of measurement, with no signifi cant errors
Convert simple units within a system of measurement, with a few signifi cant errors
Convert simple units within a system of measurement, with some signifi cant errors
Assessment/Evidence Pieces
Lesson• Student Worksheets: Navigational Chart and Map, Up Scaling Activity, Our Seafl oor Activity, Seafl oor Profi ling Activity and Data Table
2
G5 U4 L3
G5 U4 OVR
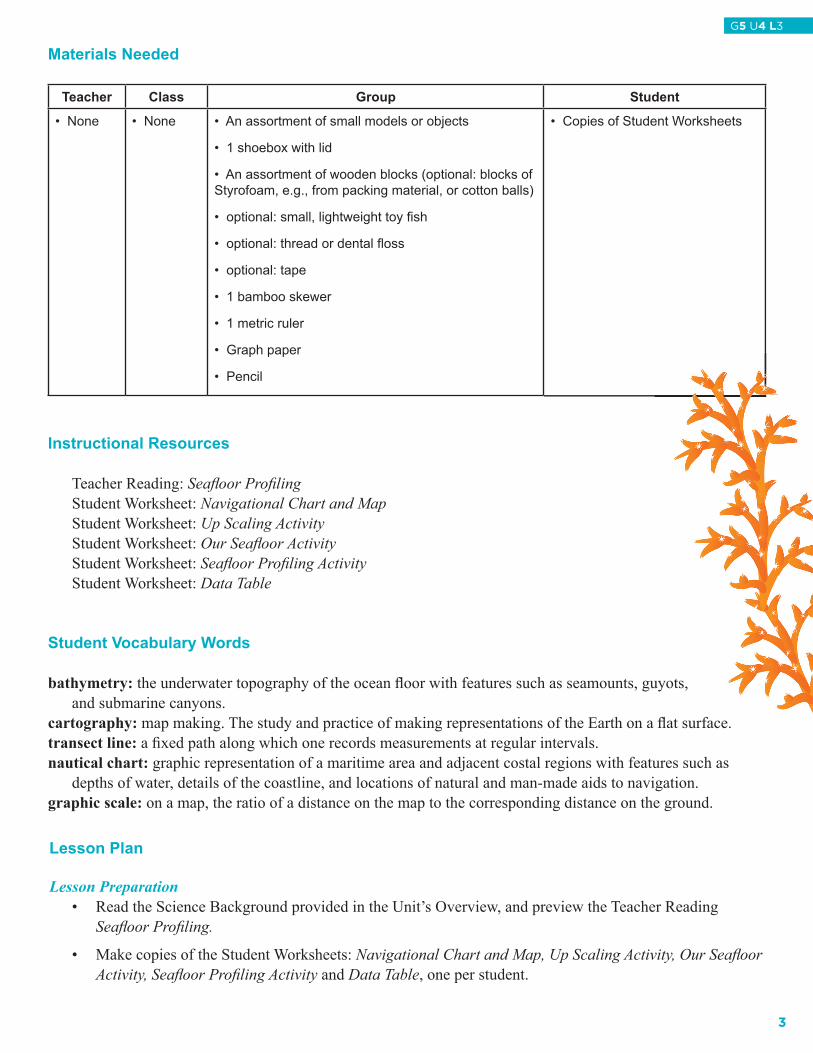
Materials Needed
Teacher Class Group Student
• None • None • An assortment of small models or objects
• 1 shoebox with lid
• An assortment of wooden blocks (optional: blocks of Styrofoam, e.g., from packing material, or cotton balls)
• optional: small, lightweight toy fi sh
• optional: thread or dental fl oss
• optional: tape
• 1 bamboo skewer
• 1 metric ruler
• Graph paper
• Pencil
• Copies of Student Worksheets
Instructional Resources
Teacher Reading: Seafl oor Profi ling Student Worksheet: Navigational Chart and Map Student Worksheet: Up Scaling Activity Student Worksheet: Our Seafl oor Activity Student Worksheet: Seafl oor Profi ling Activity Student Worksheet: Data Table
Student Vocabulary Words
bathymetry: the underwater topography of the ocean fl oor with features such as seamounts, guyots, and submarine canyons.cartography: map making. The study and practice of making representations of the Earth on a fl at surface.transect line: a fi xed path along which one records measurements at regular intervals.nautical chart: graphic representation of a maritime area and adjacent costal regions with features such as depths of water, details of the coastline, and locations of natural and man-made aids to navigation.graphic scale: on a map, the ratio of a distance on the map to the corresponding distance on the ground.
Lesson Plan
Lesson Preparation • Read the Science Background provided in the Unit’s Overview, and preview the Teacher Reading
Seafl oor Profi ling.
• Make copies of the Student Worksheets: Navigational Chart and Map, Up Scaling Activity, Our Seafl oor Activity, Seafl oor Profi ling Activity and Data Table, one per student.
3
G5 U4 L3

• Make an example of a seafl oor box.
• Write out Instructional Objective I can statement for this lesson and post.
• Visit web site http://www.nauticalcharts.noaa.gov/ for additional navigational charts.
I. Charts and Scales A. Begin the activity by organizing the students into pairs or small groups (create groups according to what works in your class); distribute the Student Worksheet: Navigational Chart and Map. Have them brainstorm and record what they notice to be signifi cant about the chart. Guide them in thinking about differences between the chart and a typical map; also, what is unique. Give them a time limit of about 5 minutes. Have the groups share their observations as you record their answers.
B. Ensure that the students can locate the map scale as well as the graphic scale located on the chart. Introduce the topic of using “scale” as a means to draw charts or maps to a size that will fi t the media.
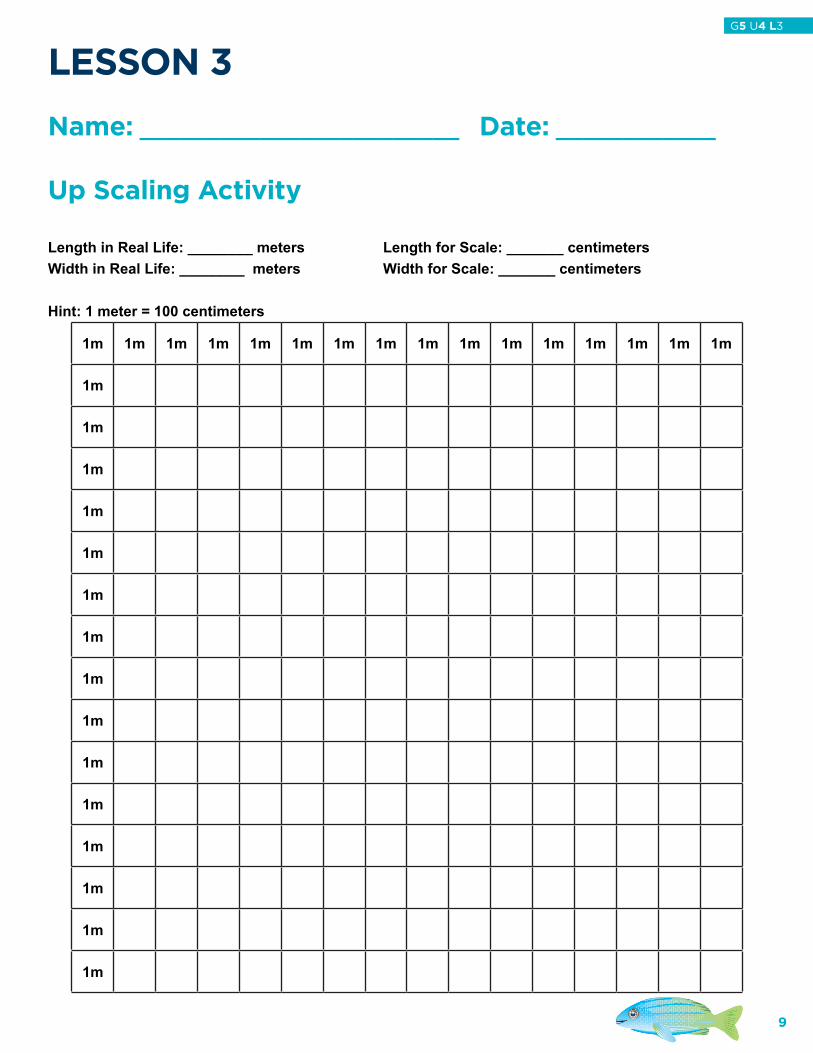
C. Distribute Student Worksheet: Up Scale and the models or objects that will be used to work on scale. Instruct students that these models represent “real-sized” objects and they are to place their model on the graph. One student should hold the model while the other traces the outline of the object on the graph paper. They should then remove the model and count the number of squares to fi nd the “real life” length and “real life” width. Instruct the students to approximate the size of their model according to the scale on the graph paper. Students will then convert the size of their object from the real life measurements in meters to centimeters.
i. 1 meter = 100 cm
ii. The students should multiply the real life length, then their real life width (in meters) by 100 to get the size of their object in centimeters.
iii. This will result in the students completing a simple unit conversion.
D. Conclude activity with discussing the importance of charts correctly identifying seafl oor features and properly measuring their size (reference Teacher Background Seafl oor Profi ling). This will serve as a point of introduction for the next activity.
II. Creating the Seafl oor Features A. Begin the activity by organizing students into pairs or small groups (whatever grouping size works for your class) and assign each group a number. Distribute the Student Worksheet: Our Seafl oor Activity to each group. Explain to the students that they will be building their own seafl oor. Instruct the students that some of the work will be done in class, but they will also be working together outside of school to complete their seafl oor. Depending on your available time, you may give the students the option to create some of their features at home and assemble their seafl oor during class time.
B. As a review, ask students to describe the types of features that might be on the ocean fl oor. Then, as a class, brainstorm materials that may be used to represent the various seafl oor features. Suggest the use of Styrofoam, cotton balls, and other types of soft material, because when they begin to profi le their seafl oors, these materials will result in different measurements depending how fi rmly the skewer is pushed. Explain that variables, like soft substrates, simulates the diffi culties scientists faced with the early techniques of mapping the seafl oor.
C. Each group should create, on a piece of scrap paper, a rough diagram of what their seafl oor will include. The diagram should have the different features labeled.
4
G5 U4 L3
G5 U4 OVR
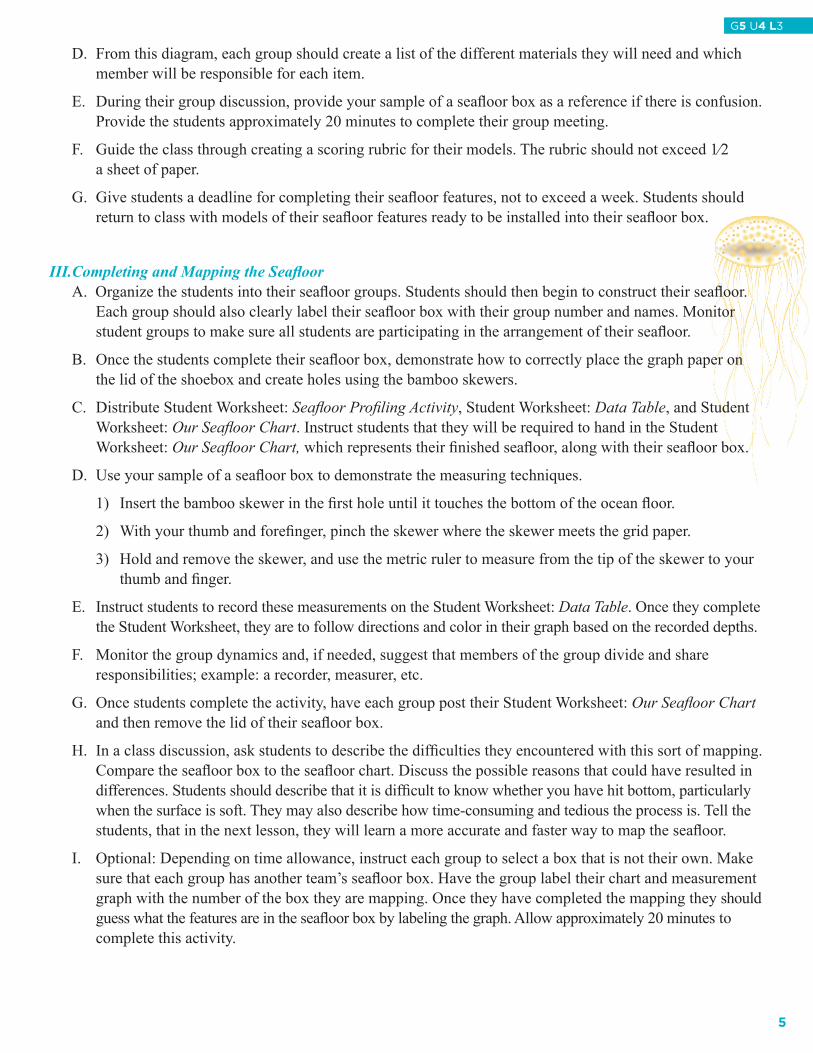
D. From this diagram, each group should create a list of the different materials they will need and which member will be responsible for each item.
E. During their group discussion, provide your sample of a seafl oor box as a reference if there is confusion. Provide the students approximately 20 minutes to complete their group meeting.
F. Guide the class through creating a scoring rubric for their models. The rubric should not exceed 1⁄2 a sheet of paper.
G. Give students a deadline for completing their seafl oor features, not to exceed a week. Students should return to class with models of their seafl oor features ready to be installed into their seafl oor box.
III.Completing and Mapping the Seafl oor A. Organize the students into their seafl oor groups. Students should then begin to construct their seafl oor. Each group should also clearly label their seafl oor box with their group number and names. Monitor student groups to make sure all students are participating in the arrangement of their seafl oor.
B. Once the students complete their seafl oor box, demonstrate how to correctly place the graph paper on the lid of the shoebox and create holes using the bamboo skewers.
C. Distribute Student Worksheet: Seafl oor Profi ling Activity, Student Worksheet: Data Table, and Student Worksheet: Our Seafl oor Chart. Instruct students that they will be required to hand in the Student Worksheet: Our Seafl oor Chart, which represents their fi nished seafl oor, along with their seafl oor box.
D. Use your sample of a seafl oor box to demonstrate the measuring techniques.
1) Insert the bamboo skewer in the fi rst hole until it touches the bottom of the ocean fl oor.
2) With your thumb and forefi nger, pinch the skewer where the skewer meets the grid paper.
3) Hold and remove the skewer, and use the metric ruler to measure from the tip of the skewer to your thumb and fi nger.
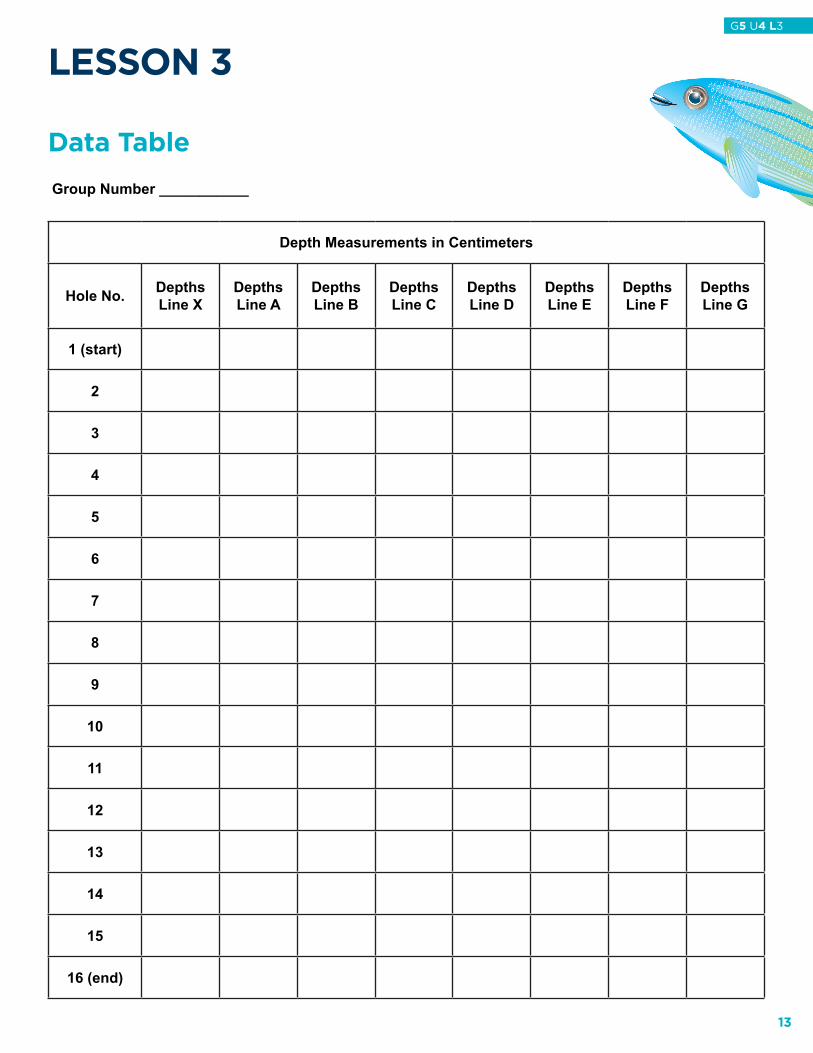
E. Instruct students to record these measurements on the Student Worksheet: Data Table. Once they complete the Student Worksheet, they are to follow directions and color in their graph based on the recorded depths.
F. Monitor the group dynamics and, if needed, suggest that members of the group divide and share responsibilities; example: a recorder, measurer, etc.
G. Once students complete the activity, have each group post their Student Worksheet: Our Seafl oor Chart and then remove the lid of their seafl oor box.
H. In a class discussion, ask students to describe the diffi culties they encountered with this sort of mapping. Compare the seafl oor box to the seafl oor chart. Discuss the possible reasons that could have resulted in differences. Students should describe that it is diffi cult to know whether you have hit bottom, particularly when the surface is soft. They may also describe how time-consuming and tedious the process is. Tell the students, that in the next lesson, they will learn a more accurate and faster way to map the seafl oor.
I. Optional: Depending on time allowance, instruct each group to select a box that is not their own. Make sure that each group has another team’s seafl oor box. Have the group label their chart and measurement graph with the number of the box they are mapping. Once they have completed the mapping they should guess what the features are in the seafl oor box by labeling the graph. Allow approximately 20 minutes to complete this activity.
5
G5 U4 L3
LessON 3 - Teacher Reading
seafloor Profiling
In this lesson, students explore one of the early methods to measure the depth of the ocean by using a scientifi c model.
The British ship, H.M.S. Challenger, was the fi rst ship to carry a scientifi c expedition to map the depths of the ocean. By using weighted wires lowered over the side of the ship, scientists were able to collect measurements of depth at 361 sites. They also collected samples of water as well as biological and sediment samples.
There are a number of problems with using weighted wires, as students will discover in this lesson. First and foremost, it is often diffi cult to know when the weighted wire has hit the bottom of the ocean, particularly when the surface is soft. Second, this method is time-consuming and tedious, and can often overlook small changes between sites where measurements have been taken.
Vessels often follow a transect line, which allows scientists to take measurements at regular intervals along a fi xed path. The data collected is then used to create nautical charts. The measurements recorded refl ect the depth of the water, including natural features and navigational hazards. Charts provide detailed information about the area beneath the water surface. In this next lesson, students will explore how multibeam mapping gives more precise and accurate measurements.
For Sounding Box Activity details, refer to:http://oceanservice.noaa.gov/education/seafl oor-mapping/sounding_box1.html
For an excellent video on the history of charting our nation’s coasts, see: http://www.nauticalcharts.noaa.gov/staff/education_surveyors.htm
6
G5 U4 L3
G5 U4 OVR
LessON 3
Name: ________________________ Date: ____________
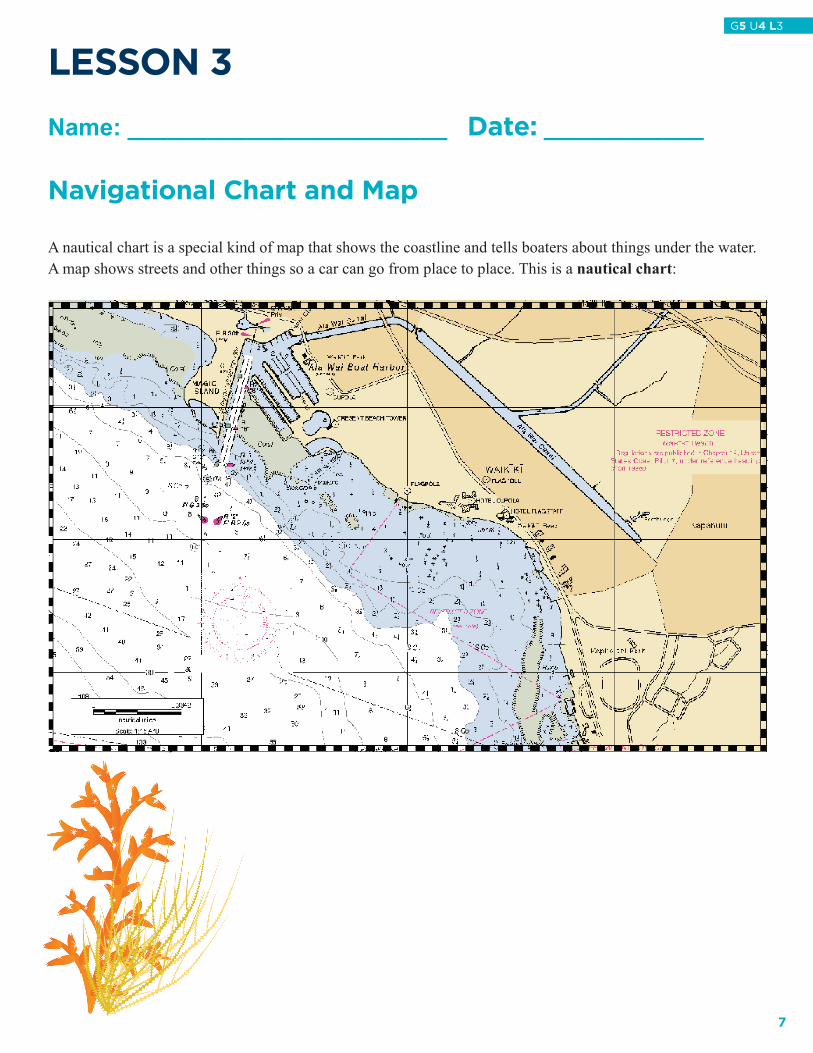
Navigational Chart and Map
A nautical chart is a special kind of map that shows the coastline and tells boaters about things under the water. A map shows streets and other things so a car can go from place to place. This is a nautical chart:
7
G5 U4 L3

This is a map of the same area as the chart on the previous page:
What do you notice to be signifi cant about the chart?
What are unique features of a chart?
What are signifi cant features of a map?
What is the chart and map scale?
8
G5 U4 L3
G5 U4 OVR
LessON 3
Name: ________________________ Date: ____________
Up scaling Activity
Length in Real Life: ________ meters Length for Scale: _______ centimeters Width in Real Life: ________ meters Width for Scale: _______ centimeters
Hint: 1 meter = 100 centimeters
1m 1m 1m 1m 1m 1m 1m 1m 1m 1m 1m 1m 1m 1m 1m 1m
1m
1m
1m
1m
1m
1m
1m
1m
1m
1m
1m
1m
1m
1m
1m
9
G5 U4 L3
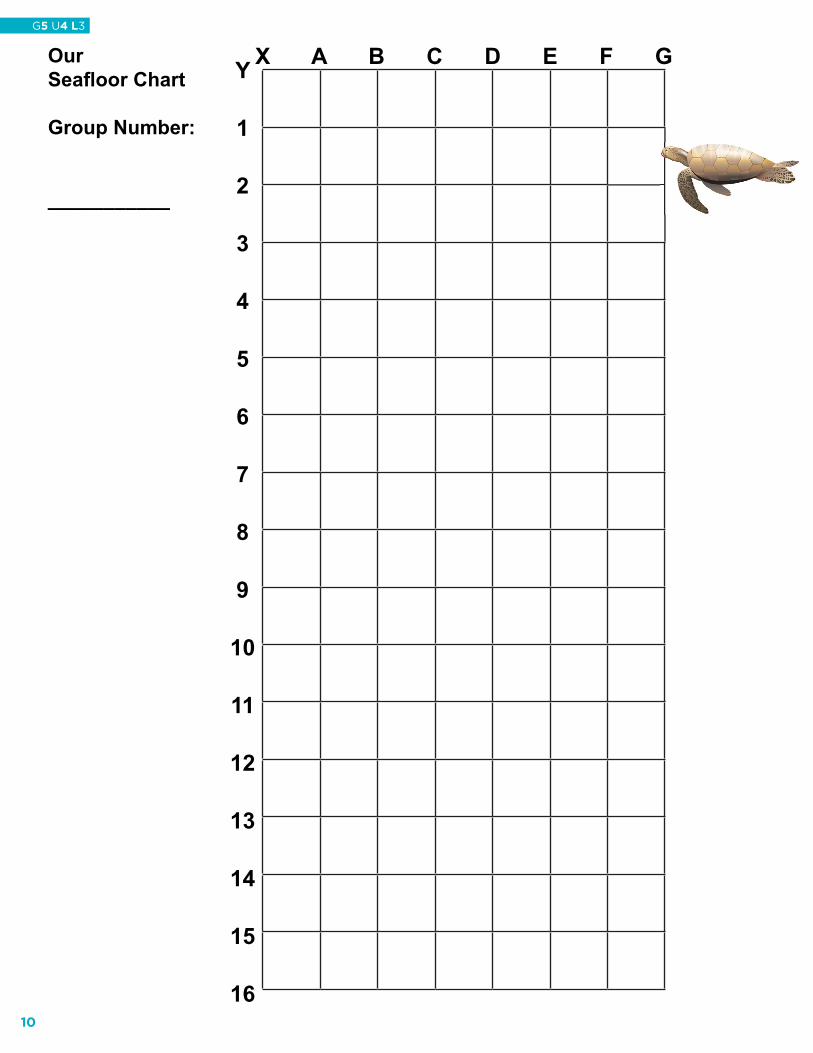
X A B C D E F GY
1
2
3
4
5
6
7
8
9
10
11
12
13
14
15
16
Our Seafl oor Chart
Group Number:
___________
10
G5 U4 L3
G5 U4 OVR
LessON 3
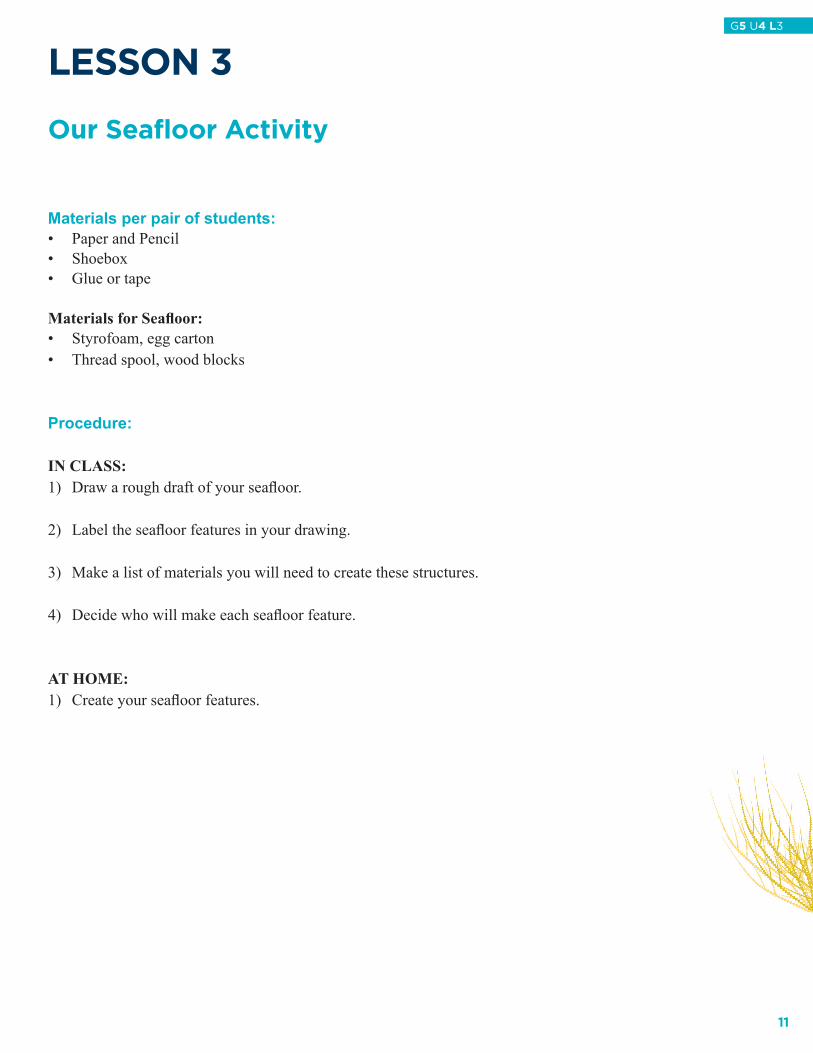
Our seafloor Activity
Materials per pair of students:• Paper and Pencil• Shoebox • Glue or tape
Materials for Seafl oor:• Styrofoam, egg carton• Thread spool, wood blocks
Procedure:
IN CLASS:1) Draw a rough draft of your seafl oor.
2) Label the seafl oor features in your drawing.
3) Make a list of materials you will need to create these structures.
4) Decide who will make each seafl oor feature.
AT HOME: 1) Create your seafl oor features.
11
G5 U4 L3

LessON 3
seafloor Profiling Activity
Materials per pair of students:• Seafl oor Features• Shoebox• Glue or tape• Metric Ruler• Paper & pencil• Bamboo skewer• Lid Graph• Our Seafl oor Chart
Procedure:
AT SCHOOL: 1) In your group, stick your seafl oor features to the box.
2) Label the box with your group number.
3) Paste the Lid Graph onto the lid.
4) Use the bamboo skewer to poke holes at each intersection of the graph.
5) Begin taking measurements by... i. Push the bamboo skewer in the fi rst hole until it touches the bottom of the ocean fl oor. ii. With your thumb and forefi nger, pinch the skewer where the skewer meets the grid paper. iii. Hold and remove the skewer, and use the metric ruler to measure from the tip of the skewer to your thumb and fi nger. iv. Record the measurements in the Data Table
6) Repeat measuring across the whole box.
7) Complete the Data Table.
8) Choose a color for each depth range, one color per centimeter.
(9) On Our Seafl oor Chart, color each square depending on the depth.
(10) Discuss with your group what the graph indicates about your seafl oor.
12
G5 U4 L3
G5 U4 OVR
LessON 3
Data Table
Group Number ___________
Depth Measurements in Centimeters
Hole No. DepthsLine X
Depths Line A
DepthsLine B
DepthsLine C
DepthsLine D
Depths Line E
Depths Line F
DepthsLine G
1 (start)
2
3
4
5
6
7
8
9
10
11
12
13
14
15
16 (end)
13
G5 U4 L3

Y
1
2
3
4
5
6
7
8
9
10
11
12
13
14
15
16
The following is a sample of what one box had in it:
This is a sample map a student might make. In this box were 3 blocks. 6W X 9L X 4H6W X 11L X 8HLast setting on second block is a 3W X 6L X 2 H or 10 H from bottom.
8 cm
4 cm
2 cm
White is sea fl oor 12 cm
X A B C D E F G12 12 12 12 12 12 12
12 12 12 12 12 12 12
12 12 12 8 8 8 8
12 12 12 8 8 8 8
12 12 12 8 8 8 8
12 12 12 12 12 12 12
12 12 12 12 12 12 12
12 12 12 12 12 12 12
12 12 12 12 12 12 12
12 12 12 12 12 12 12
12 12 12 12 12 12 12
12 12 12 12 12 12 12
4 4 4 4 4 4 12
4 4 2 2 2 12
4 4 4 4 4 4 12
12 12 12 12 12 12 12
14
G5 U4 L3