Embed Size (px)
Citation preview
4finance Holding SA
Investor Presentation for full year 2017 results
1 March 2018
2
Disclaimer
While all reasonable care has been taken to ensure that the facts stated herein are accurate and that the forecasts, opinions and expectations contained herein, are fair and reasonable, no representation
or warranty, express or implied, is made as to, and no reliance should be placed on, the fairness, accuracy, completeness or correctness of the information, or opinions contained herein. Neither 4finance
nor any of 4finance`s advisors or representatives shall have any responsibility or liability whatsoever (for negligence or otherwise) for any loss howsoever arising from any use of this document or its
contents or otherwise arising in connection with this document. The information set out herein may be subject to updating, completion, revision, verification and amendment and such information may
change materially.
This presentation is based on the economic, regulatory, market and other conditions as in effect on the date hereof. It should be understood that subsequent developments may affect the information
contained in this document, which neither 4finance nor its advisors are under an obligation to update, revise or affirm.
The distribution of this presentation in certain jurisdictions may be restricted by law. Persons into whose possession this presentation comes are required to inform themselves about and to observe any
such restrictions.
The following information contains, or may be deemed to contain, “forward-looking statements”. These statements relate to future events or our future financial performance, including, but not limited to,
strategic plans, potential growth, planned operational changes, expected capital expenditures, future cash sources and requirements, liquidity and cost savings that involve known and unknown risks,
uncertainties and other factors that may cause 4finance’s or its businesses’ actual results, levels of activity, performance or achievements to be materially different from those expressed or implied by any
forward-looking statements. In some cases, such forward-looking statements can be identified by terminology such as “may,” “will,” “could,” “would,” “should,” “expect,” “plan,” “anticipate,” “intend,”
“believe,” “estimate,” “predict,” “potential,” or “continue,” or the negative of those terms or other comparable terminology. By their nature, forward-looking statements involve risks and uncertainties because
they relate to events and depend on circumstances that may or may not occur in the future. Future results may vary from the results expressed in, or implied by, the following forward-looking statements,
possibly to a material degree. All forward-looking statements made in this presentation are based on information presently available to management and 4finance assumes no obligation to update any
forward-looking statements.

3
Agenda
• Year-end operational progress update
• Review of full year 2017 results
• Loan portfolio and asset quality
• Conclusion
4
Operational progress: momentum continues
• Growth in our existing markets, complemented by continued product and market
diversification
• Accelerating quarterly growth in overall loan sales, with over 57% of applications
now on mobile devices
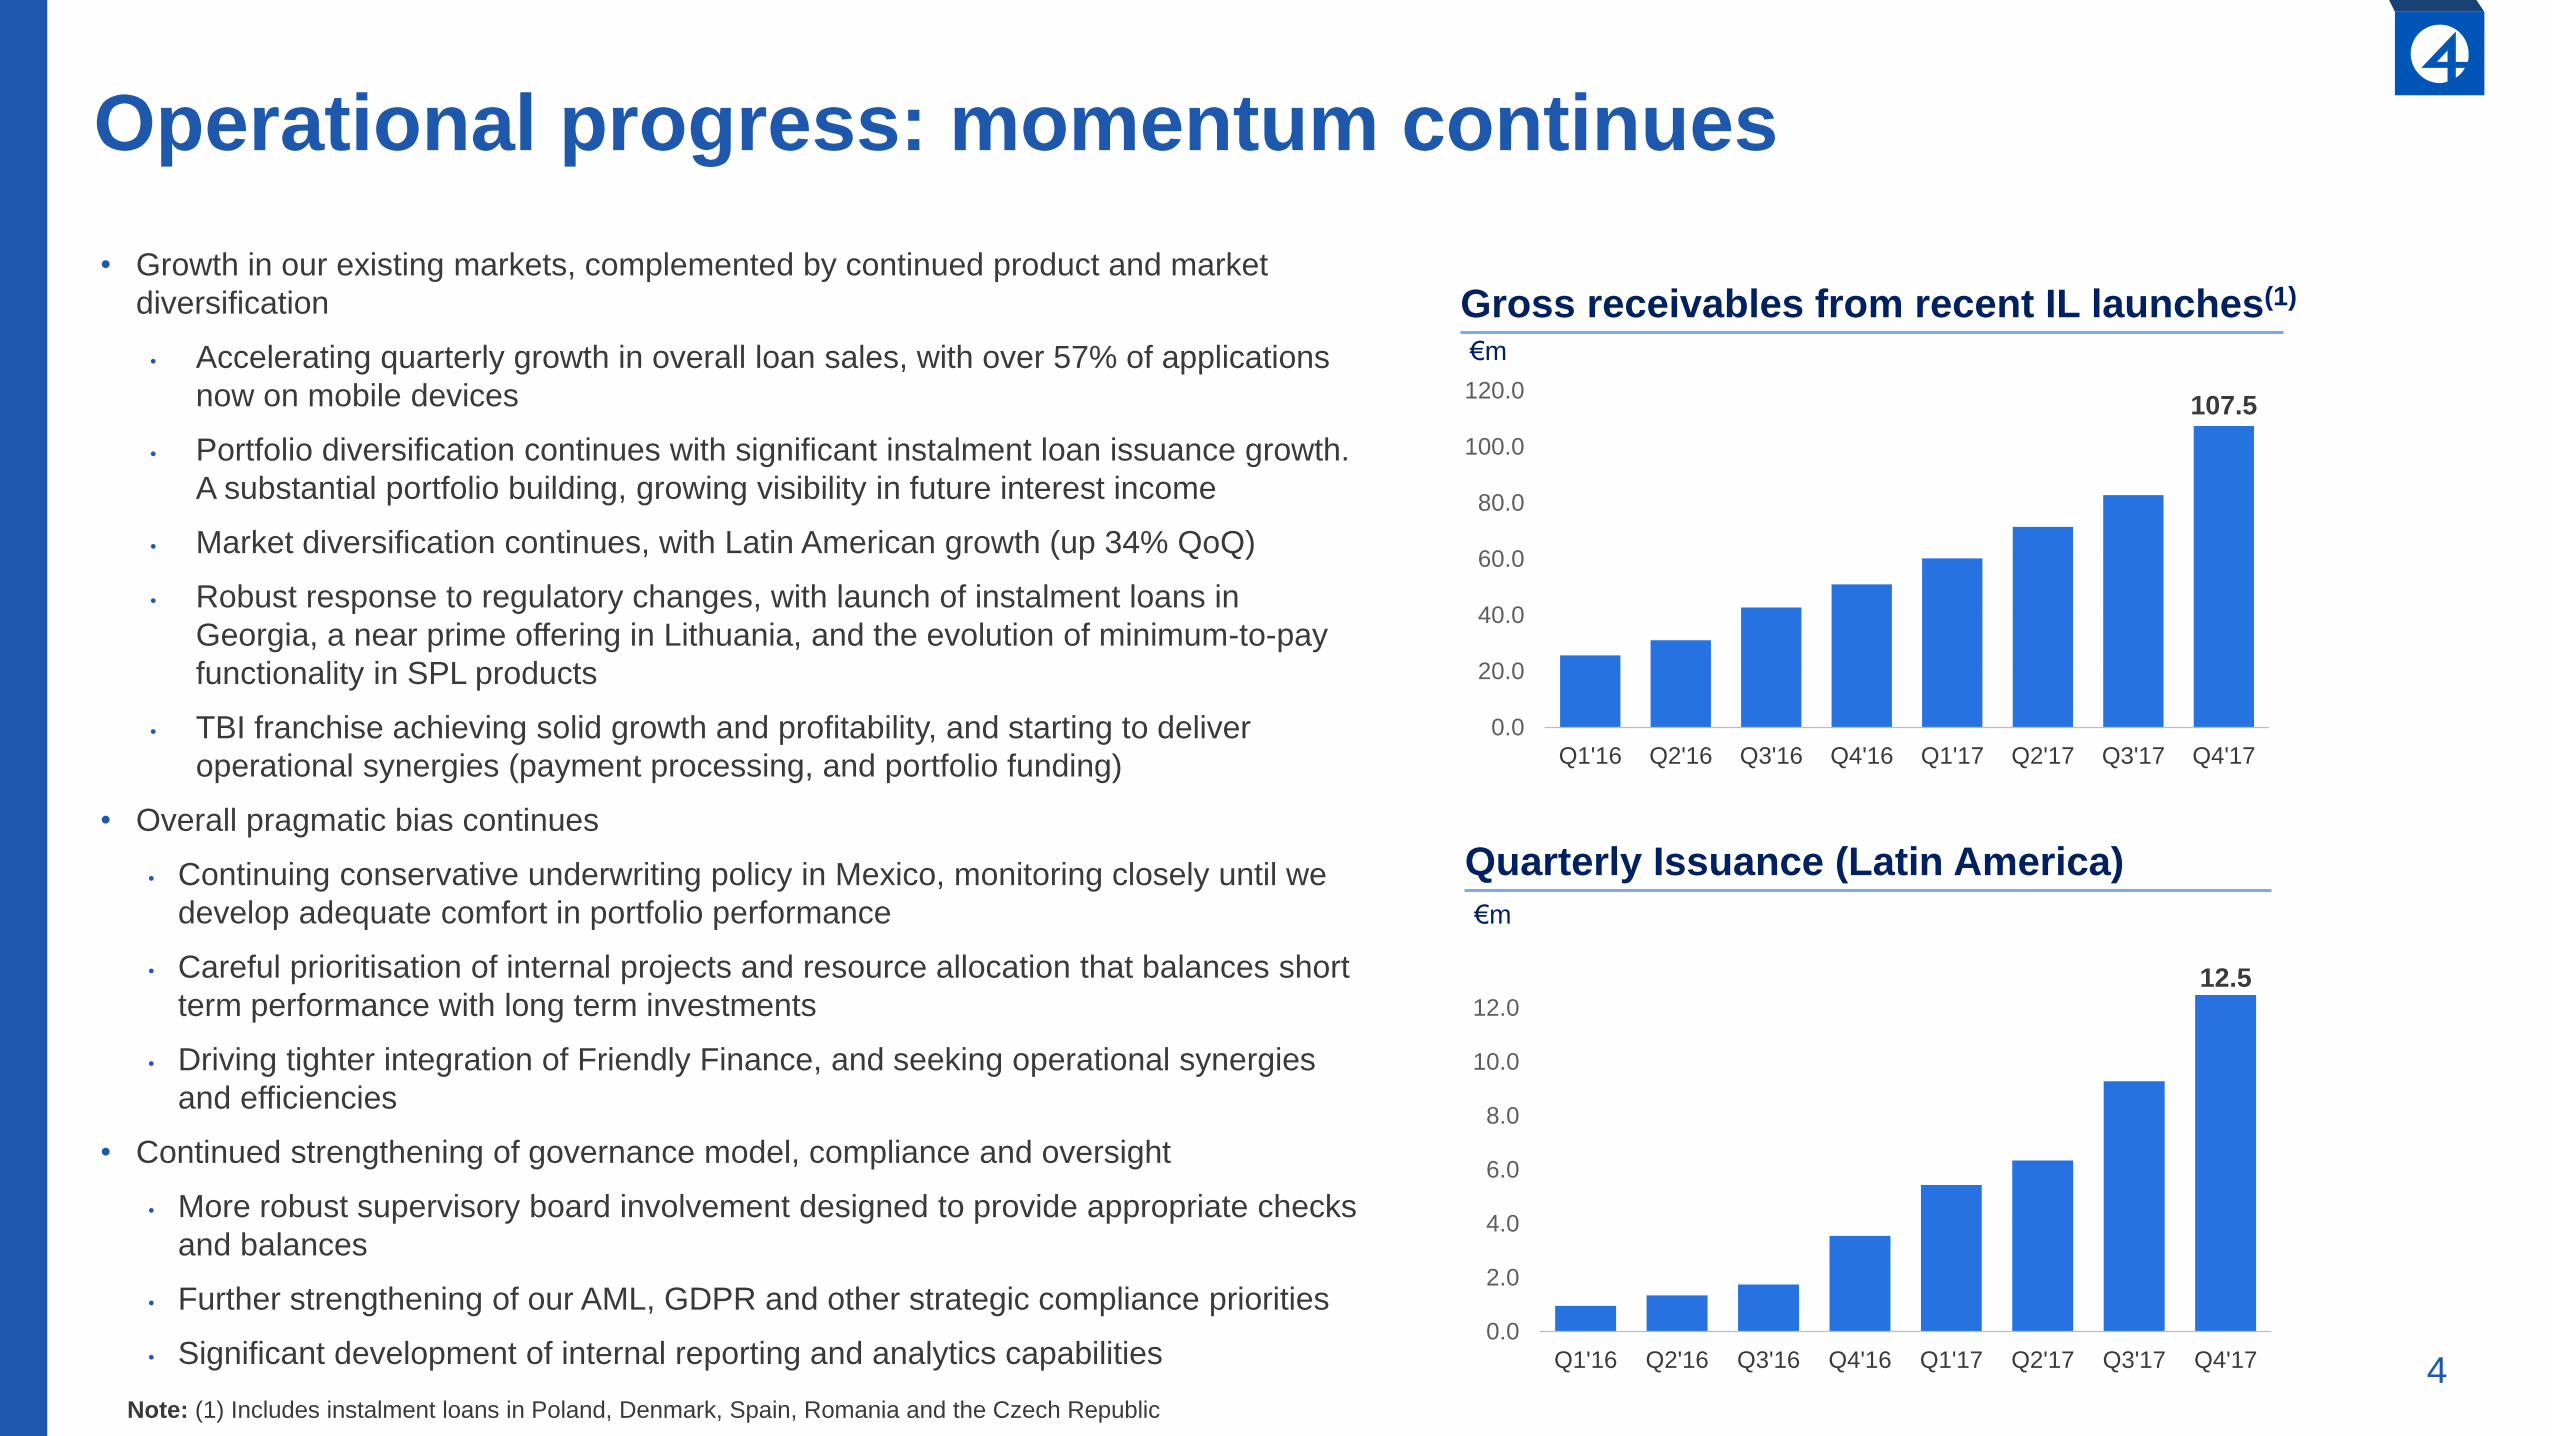
• Portfolio diversification continues with significant instalment loan issuance growth.
A substantial portfolio building, growing visibility in future interest income
• Market diversification continues, with Latin American growth (up 34% QoQ)
• Robust response to regulatory changes, with launch of instalment loans in
Georgia, a near prime offering in Lithuania, and the evolution of minimum-to-pay
functionality in SPL products
• TBI franchise achieving solid growth and profitability, and starting to deliver
operational synergies (payment processing, and portfolio funding)
• Overall pragmatic bias continues
• Continuing conservative underwriting policy in Mexico, monitoring closely until we
develop adequate comfort in portfolio performance
• Careful prioritisation of internal projects and resource allocation that balances short
term performance with long term investments
• Driving tighter integration of Friendly Finance, and seeking operational synergies
and efficiencies
• Continued strengthening of governance model, compliance and oversight
• More robust supervisory board involvement designed to provide appropriate checks
and balances
• Further strengthening of our AML, GDPR and other strategic compliance priorities
• Significant development of internal reporting and analytics capabilities
Gross receivables from recent IL launches(1)
107.5
0.0
20.0
40.0
60.0
80.0
100.0
120.0
Q1'16 Q2'16 Q3'16 Q4'16 Q1'17 Q2'17 Q3'17 Q4'17
Quarterly Issuance (Latin America)
12.5
0.0
2.0
4.0
6.0
8.0
10.0
12.0
Q1'16 Q2'16 Q3'16 Q4'16 Q1'17 Q2'17 Q3'17 Q4'17
€m
€m
Note: (1) Includes instalment loans in Poland, Denmark, Spain, Romania and the Czech Republic
5
Operational progress: building a bridge to the future
• Accelerating development of new IT platform capable of powering all of
our products going forward, including SPL, IL, LOC, Credit Card and
Deposits, allowing faster rollout speeds at lower cost
• Smart blend of internal (differentiating) and external (best-in-class)
components
• Pragmatic review of existing IT platform: write-down of intangible
assets at year end, with limited capitalisation going forward
• Next generation project for Sweden on track to launch in closed beta in
late Q1 2018 with powerful new risk based pricing functionality, risk
based limits, smart/adaptive on-boarding, behavioural driven anti-fraud
capabilities and a new mobile-friendly UX
• Streamlining of our brand strategy. Gradual migration of our multiple
brands to a single sub-prime brand. Development of a new brand for our
more near-prime customers. Designed to improve marketing efficiencies
• Partnership established for near-prime products in Poland for launch
later in 2018
• Partnership established with major utility in Mexico for targeted rollout to
their customers in 2018 (scoring data and authenticated customers)
• Progress on diversifying our sources of loan book funding. Several
funding projects underway, both ‘in house’ (TBI Bank, deposits) and
external secured funding
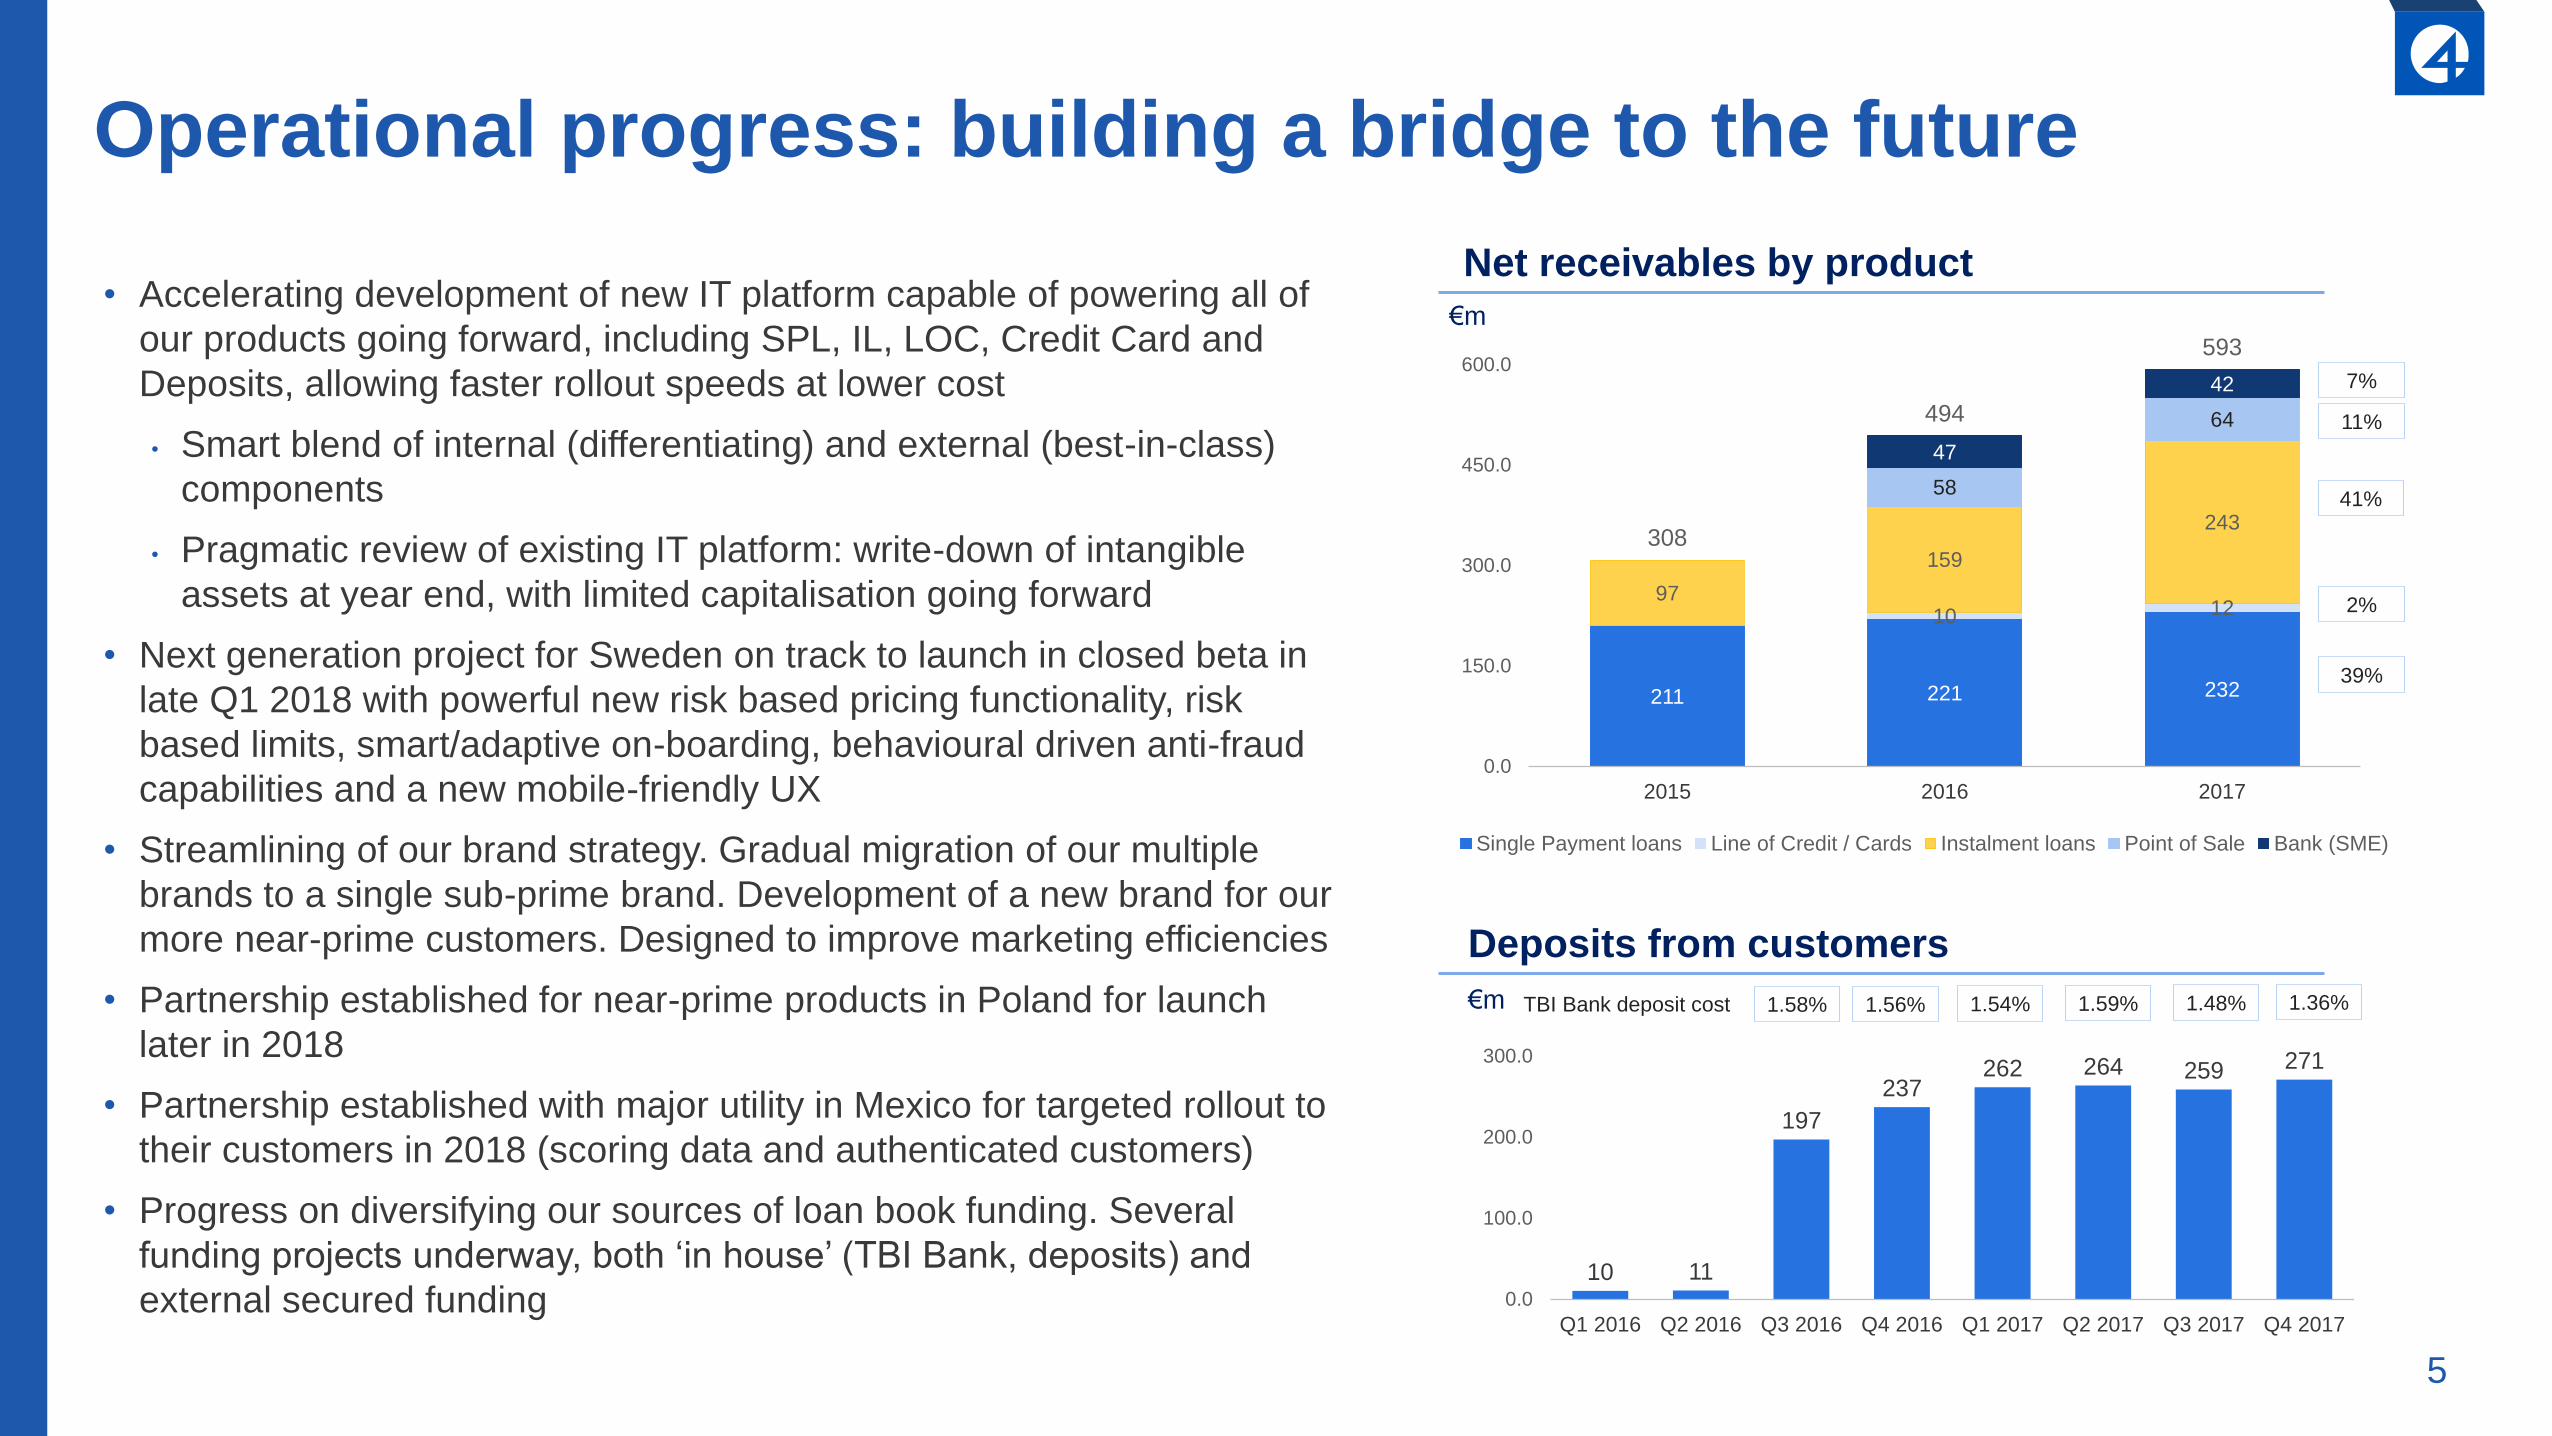
Net receivables by product
Deposits from customers
10 11
197
237262 264 259 271
0.0
100.0
200.0
300.0
Q1 2016 Q2 2016 Q3 2016 Q4 2016 Q1 2017 Q2 2017 Q3 2017 Q4 2017
€m
211 221 232
10 1297
159
243
58
64
47
42
308
494
593
0.0
150.0
300.0
450.0
600.0
2015 2016 2017
Single Payment loans Line of Credit / Cards Instalment loans Point of Sale Bank (SME)
€m
1.58% 1.56% 1.54% 1.59% 1.48%TBI Bank deposit cost
7%
11%
41%
2%
39%
1.36%
6
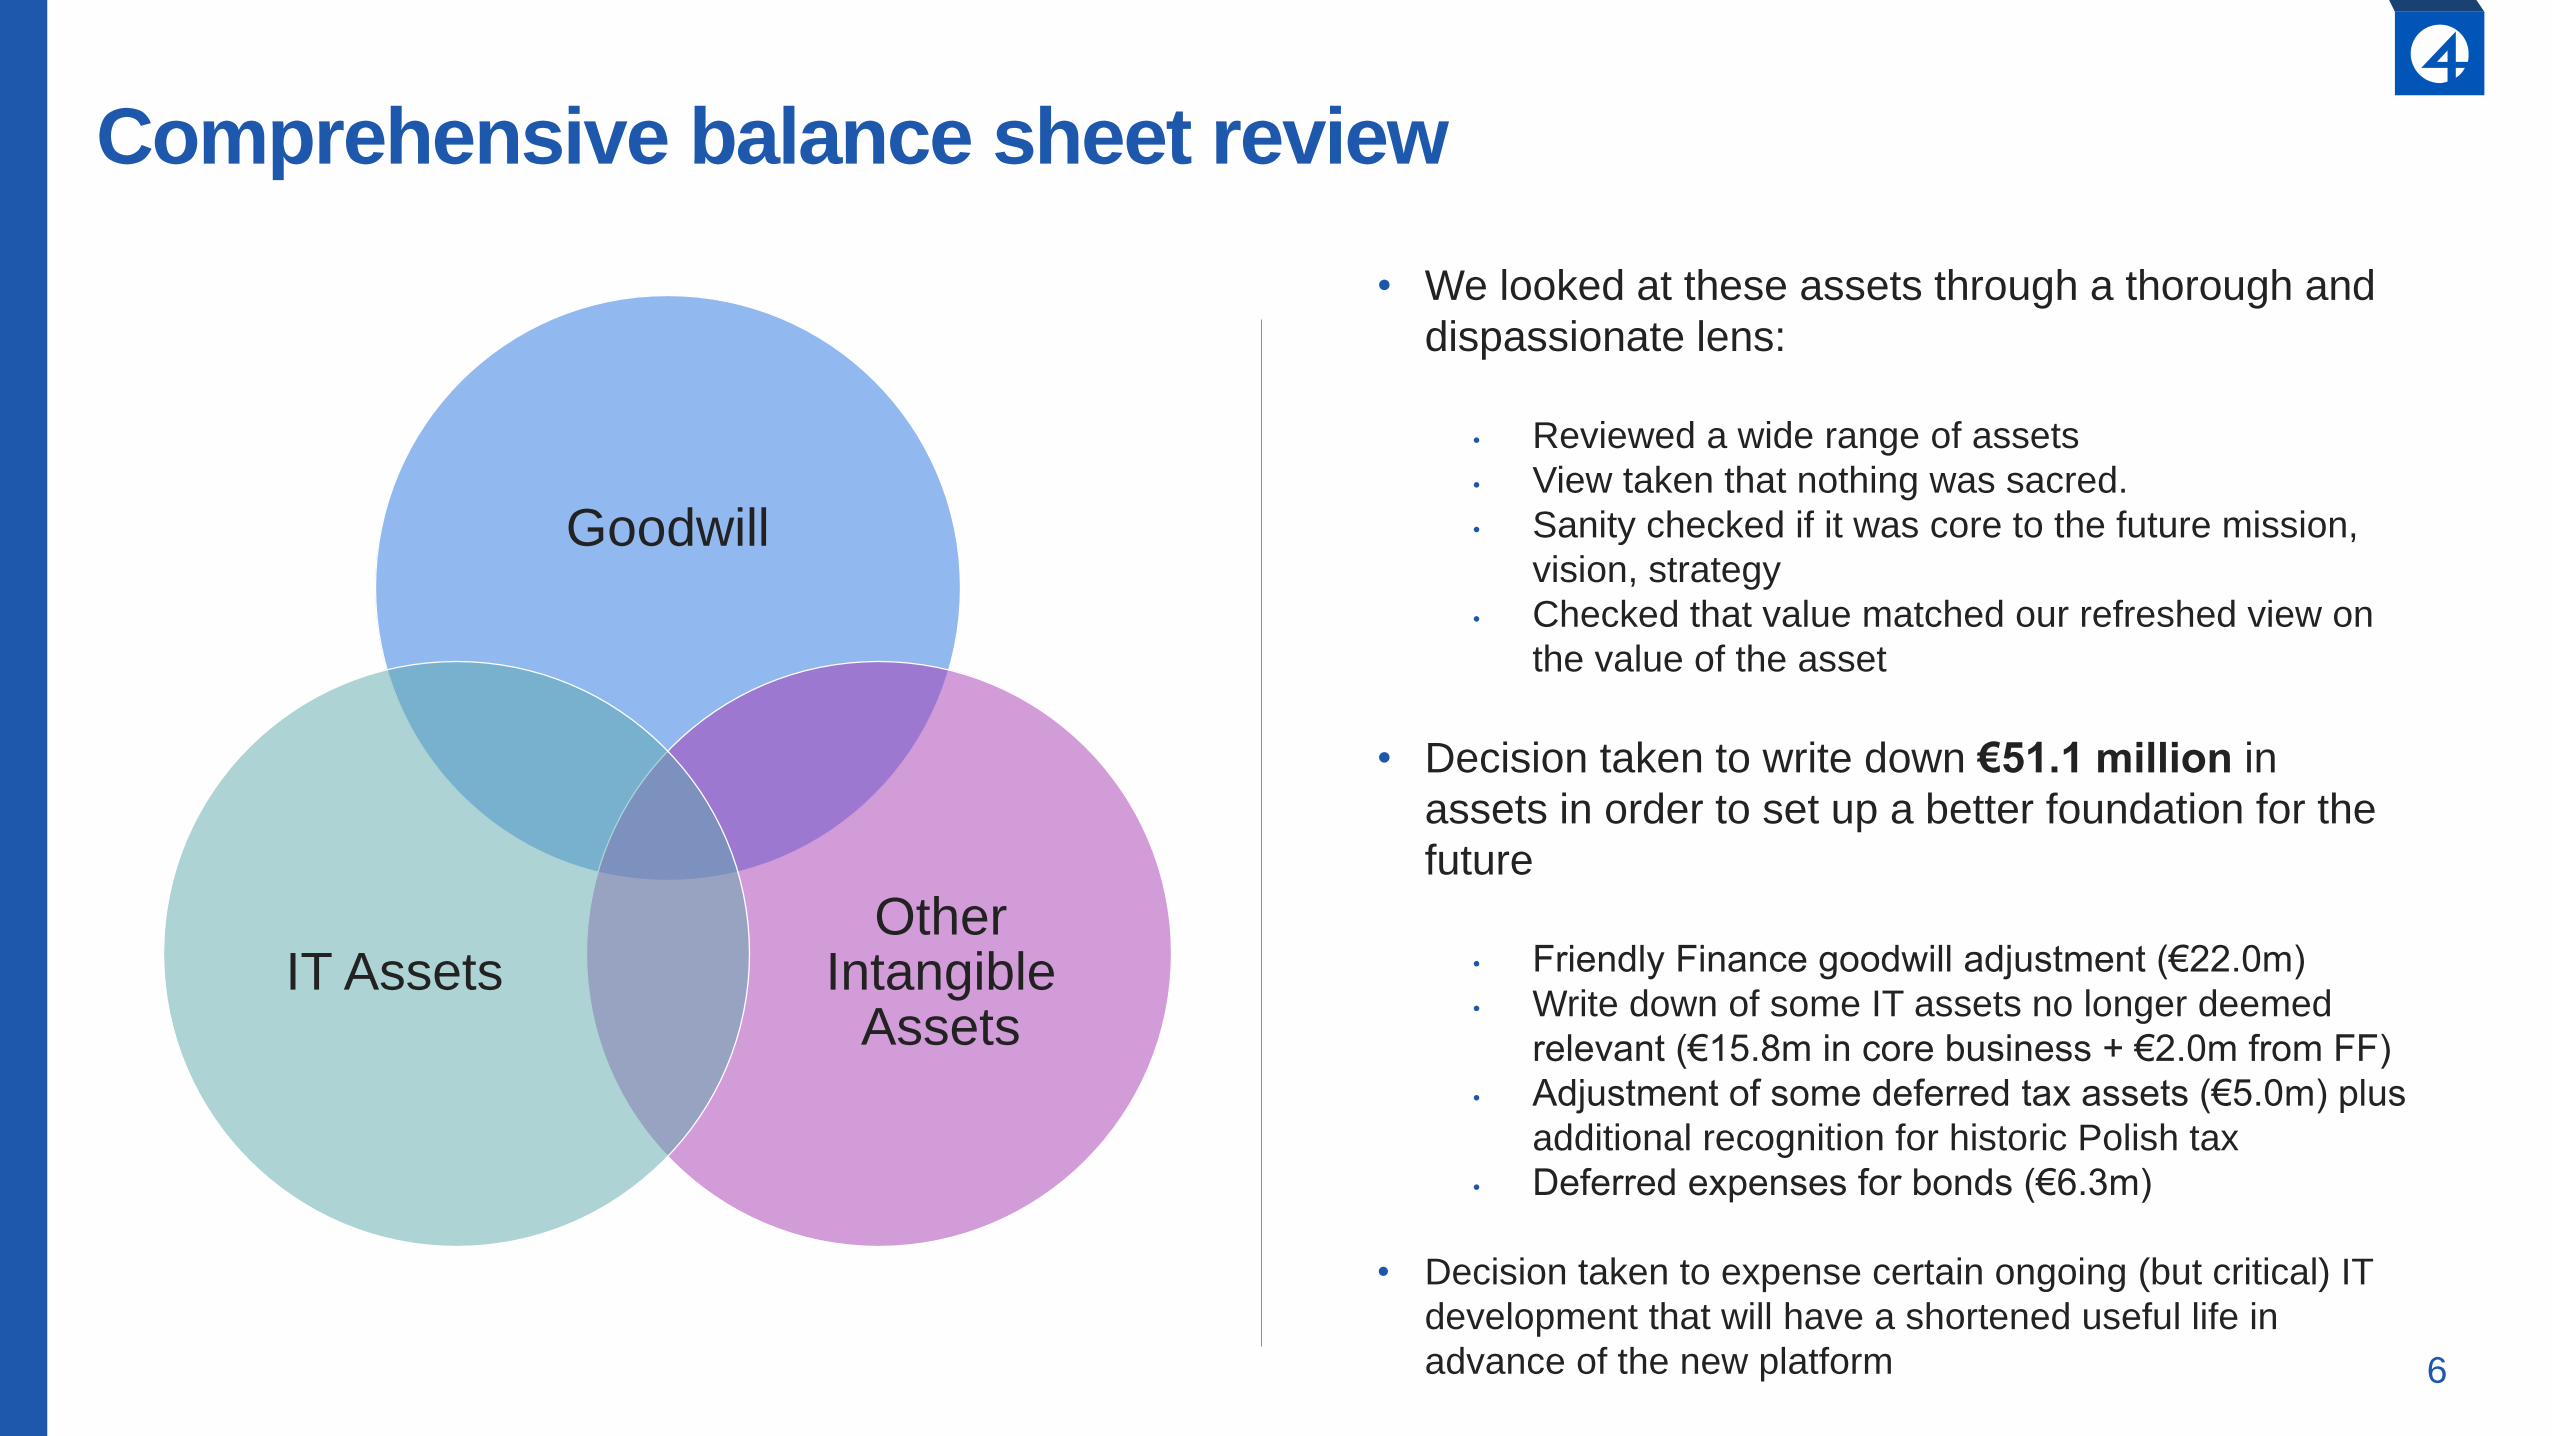
Comprehensive balance sheet review
Goodwill
Other Intangible
AssetsIT Assets
• We looked at these assets through a thorough and
dispassionate lens:
• Reviewed a wide range of assets
• View taken that nothing was sacred.
• Sanity checked if it was core to the future mission,
vision, strategy
• Checked that value matched our refreshed view on
the value of the asset
• Decision taken to write down €51.1 million in
assets in order to set up a better foundation for the
future
• Friendly Finance goodwill adjustment (€22.0m)
• Write down of some IT assets no longer deemed
relevant (€15.8m in core business + €2.0m from FF)
• Adjustment of some deferred tax assets (€5.0m) plus
additional recognition for historic Polish tax
• Deferred expenses for bonds (€6.3m)
• Decision taken to expense certain ongoing (but critical) IT
development that will have a shortened useful life in
advance of the new platform
7
Progress on responsible lending and regulatory compliance
• Taking action to put customers first, and seek to deliver
good customer outcomes
• Draft Customer Charter established
• Firm wide Code of Conduct introduced
• Refreshed corporate values
• Whistle blower website introduced
• Tightening credit policies to ensure we only lend to
people who can afford to pay us back
• Broadening use of risk based lending limits
• Additional predictive variables in our scorecards to
better assess affordability
• Working to ensure customers have safe landings
when they signal difficulties.
• Ensuring deep and meaningful regulatory relationships
• Appointment of Chief Compliance Officer
• Ensuring best practice throughout the business
• What does responsible lending mean to 4finance?
• Marketing: clear, simple and transparent products
and terms
• Pricing: typically position rates at lower end of market
to ‘self select’ responsible borrowers who ‘shop
around’
• Underwriting: credit check and underwriting for ALL
loans, including returning, with 30% average new
customer acceptance
• Customer care: local language, well staffed and
responsive teams
• Extensions: no ballooning interest (interest paid for
prior month) or ‘cycle of debt’
• Repayments: “push” payments from customer to
4finance, no automatic withdrawal from bank
accounts
8
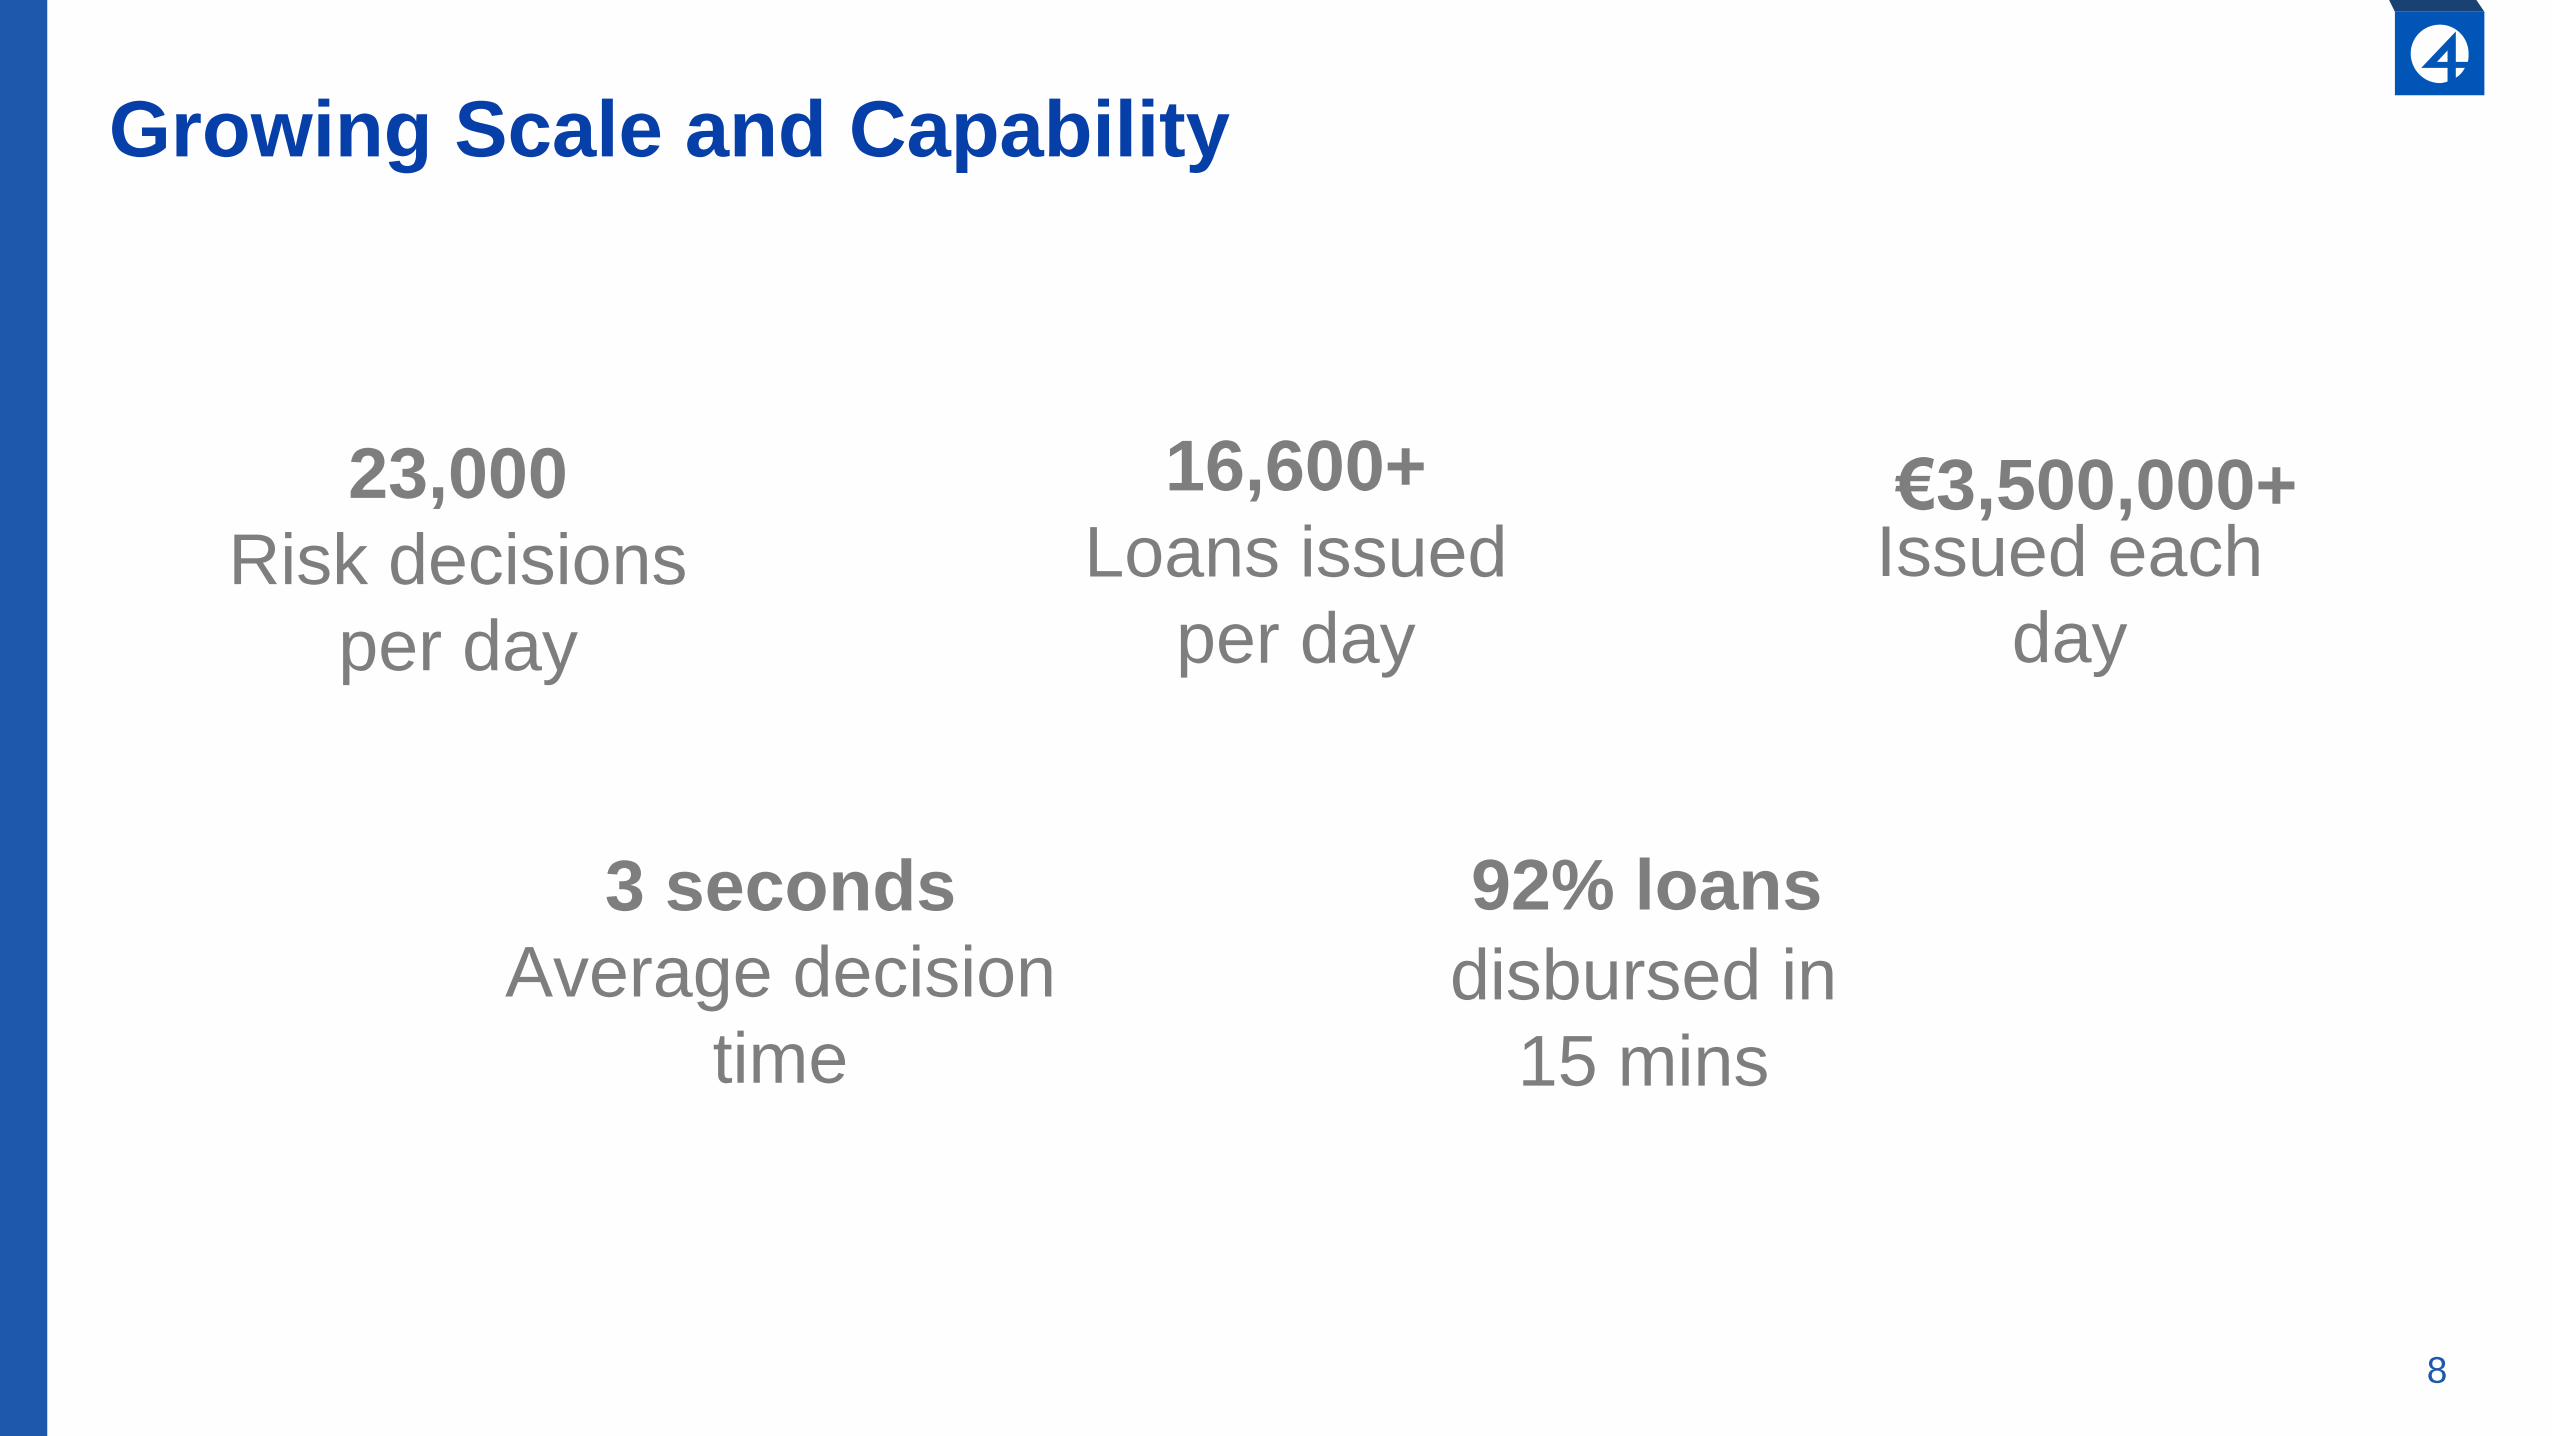
Growing Scale and Capability
3 seconds
Average decision
time
23,000
Risk decisions
per day
16,600+
Loans issued
per day
92% loans
disbursed in
15 mins
€3,500,000+Issued each
day

9
Review of full year results
10
Pre-provisionoperating profit
€m
81.0
10.9 (reported)
57.0 (Normalised)
2016 2017
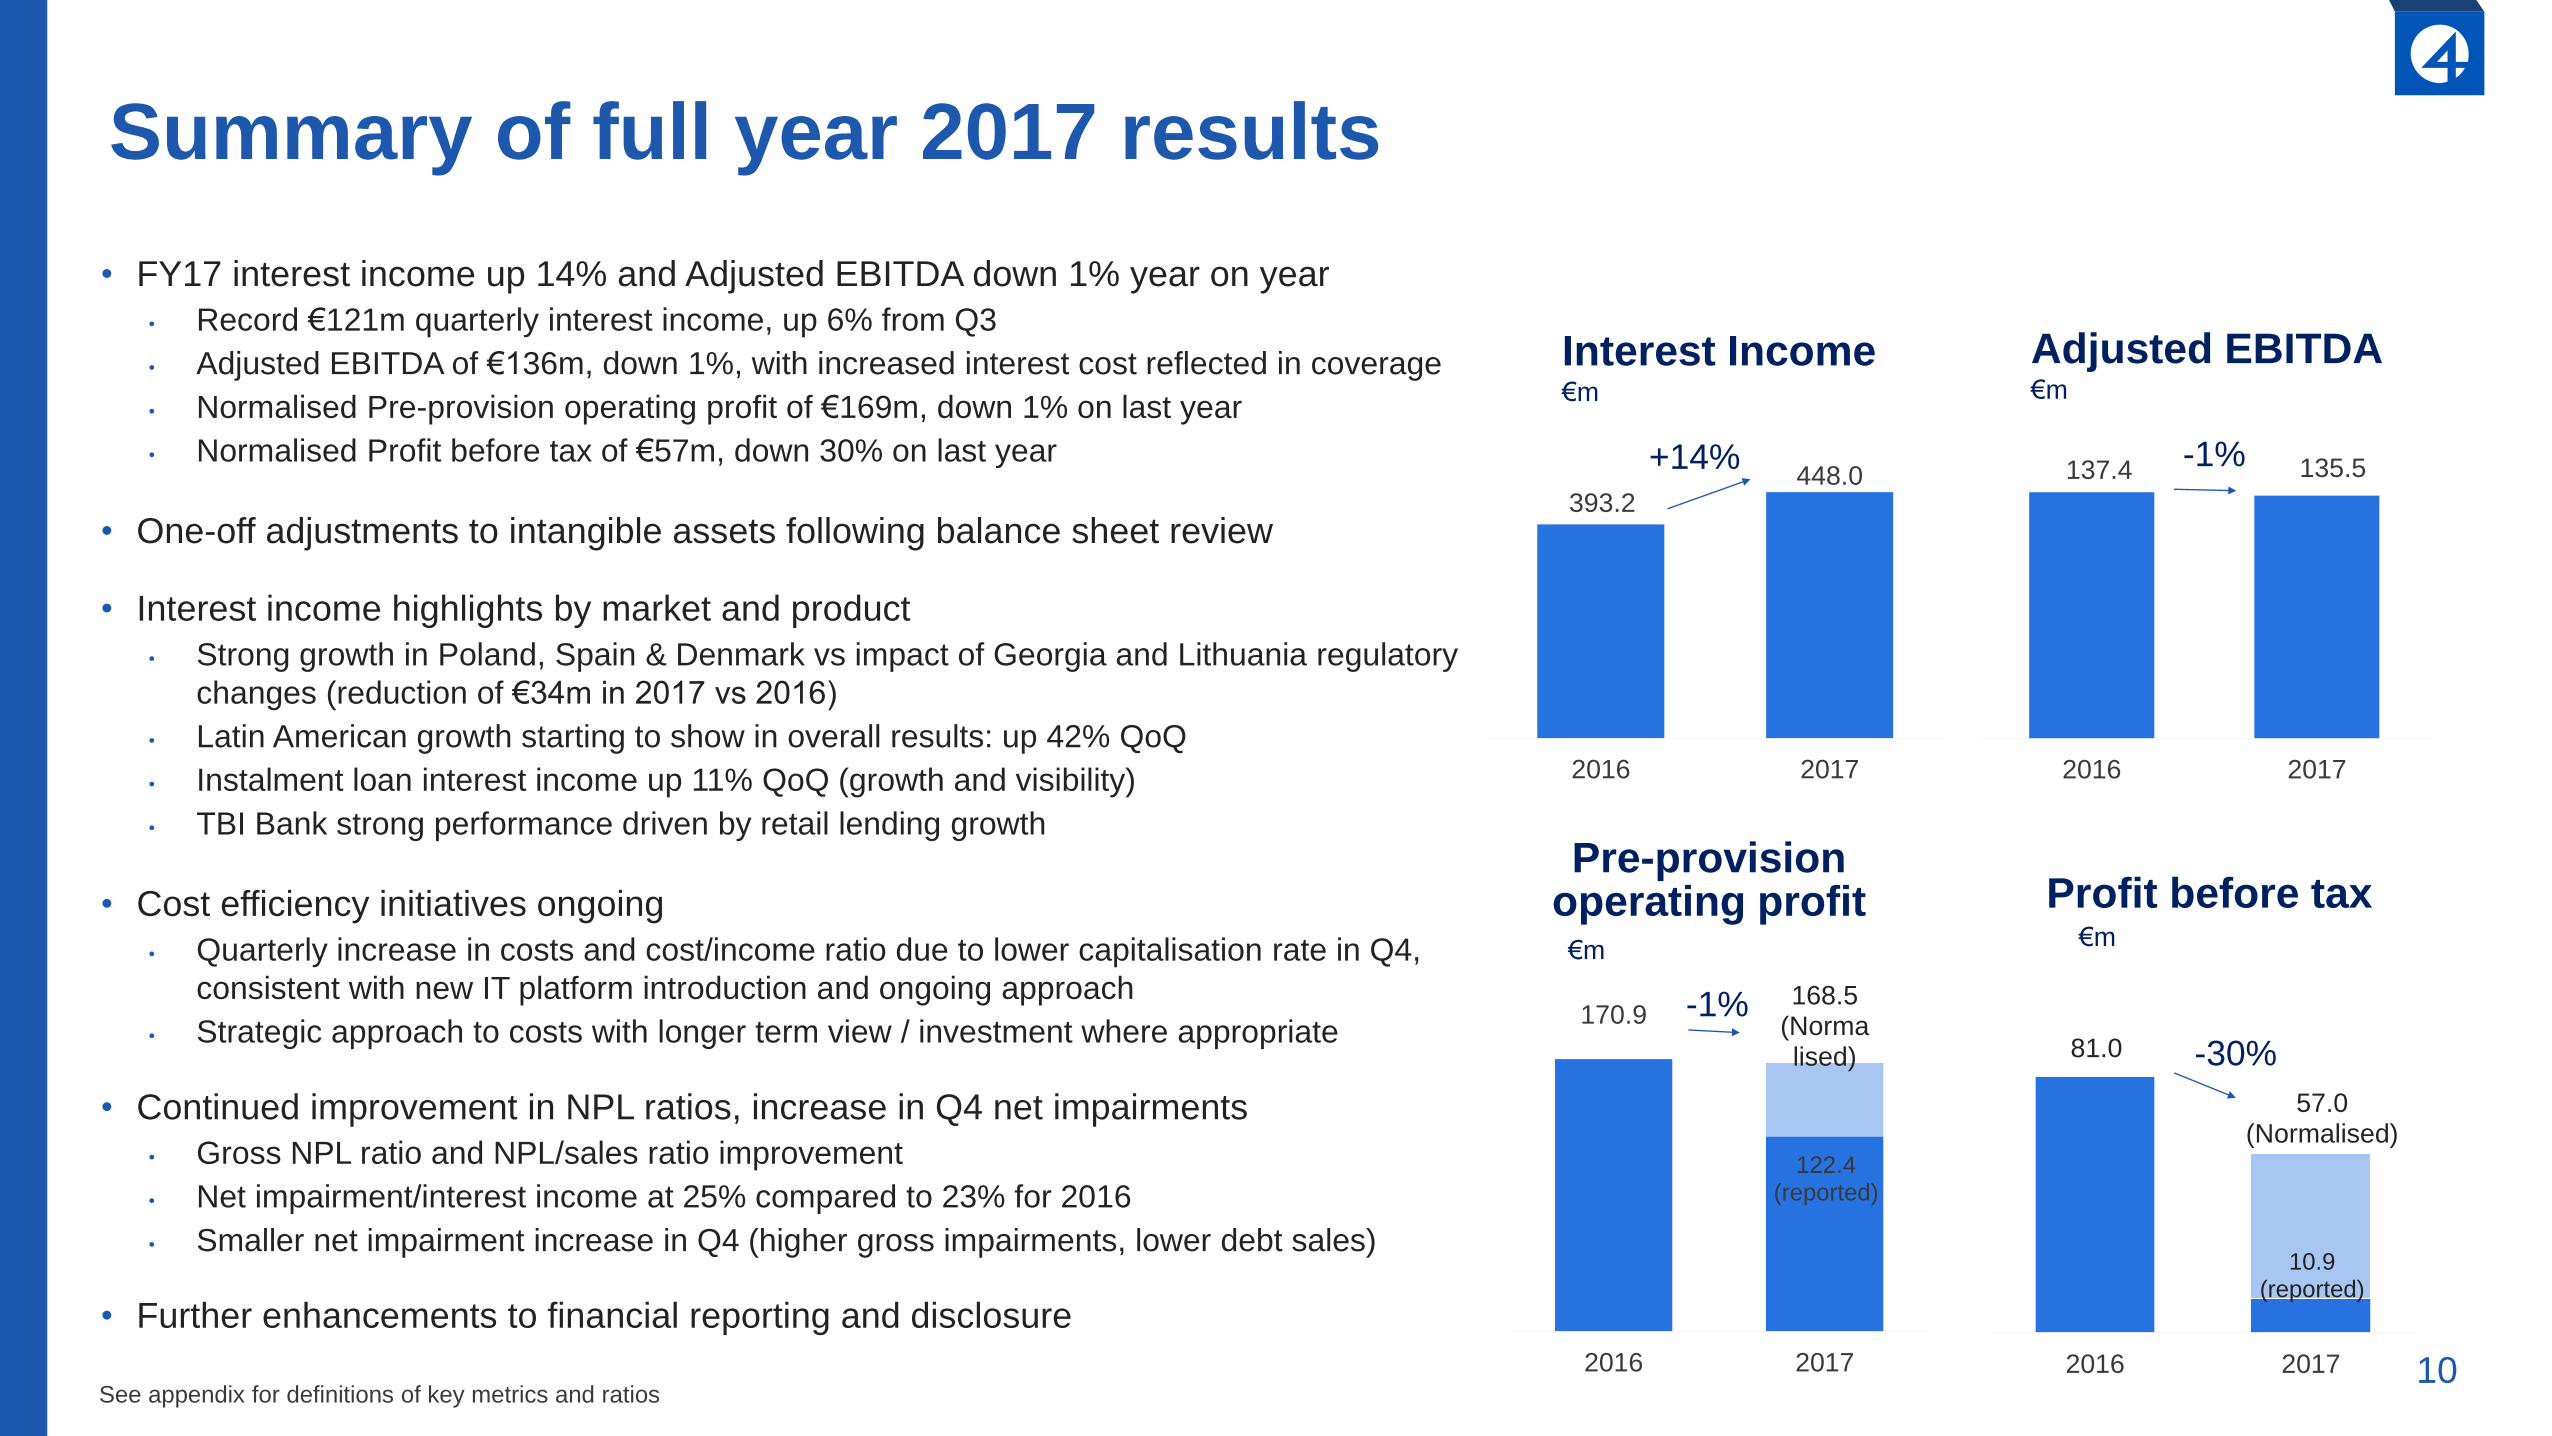
Summary of full year 2017 results
• FY17 interest income up 14% and Adjusted EBITDA down 1% year on year
• Record €121m quarterly interest income, up 6% from Q3
• Adjusted EBITDA of €136m, down 1%, with increased interest cost reflected in coverage
• Normalised Pre-provision operating profit of €169m, down 1% on last year
• Normalised Profit before tax of €57m, down 30% on last year
• One-off adjustments to intangible assets following balance sheet review
• Interest income highlights by market and product
• Strong growth in Poland, Spain & Denmark vs impact of Georgia and Lithuania regulatory
changes (reduction of €34m in 2017 vs 2016)
• Latin American growth starting to show in overall results: up 42% QoQ
• Instalment loan interest income up 11% QoQ (growth and visibility)
• TBI Bank strong performance driven by retail lending growth
• Cost efficiency initiatives ongoing
• Quarterly increase in costs and cost/income ratio due to lower capitalisation rate in Q4,
consistent with new IT platform introduction and ongoing approach
• Strategic approach to costs with longer term view / investment where appropriate
• Continued improvement in NPL ratios, increase in Q4 net impairments
• Gross NPL ratio and NPL/sales ratio improvement
• Net impairment/interest income at 25% compared to 23% for 2016
• Smaller net impairment increase in Q4 (higher gross impairments, lower debt sales)
• Further enhancements to financial reporting and disclosure
137.4 135.5
2016 2017
393.2448.0
2016 2017
Interest Income€m
+14%
Profit before tax€m
Adjusted EBITDA€m
See appendix for definitions of key metrics and ratios
170.9
122.4 (reported)
168.5 (Normalised)
2016 2017
-1%
-30%
-1%
11
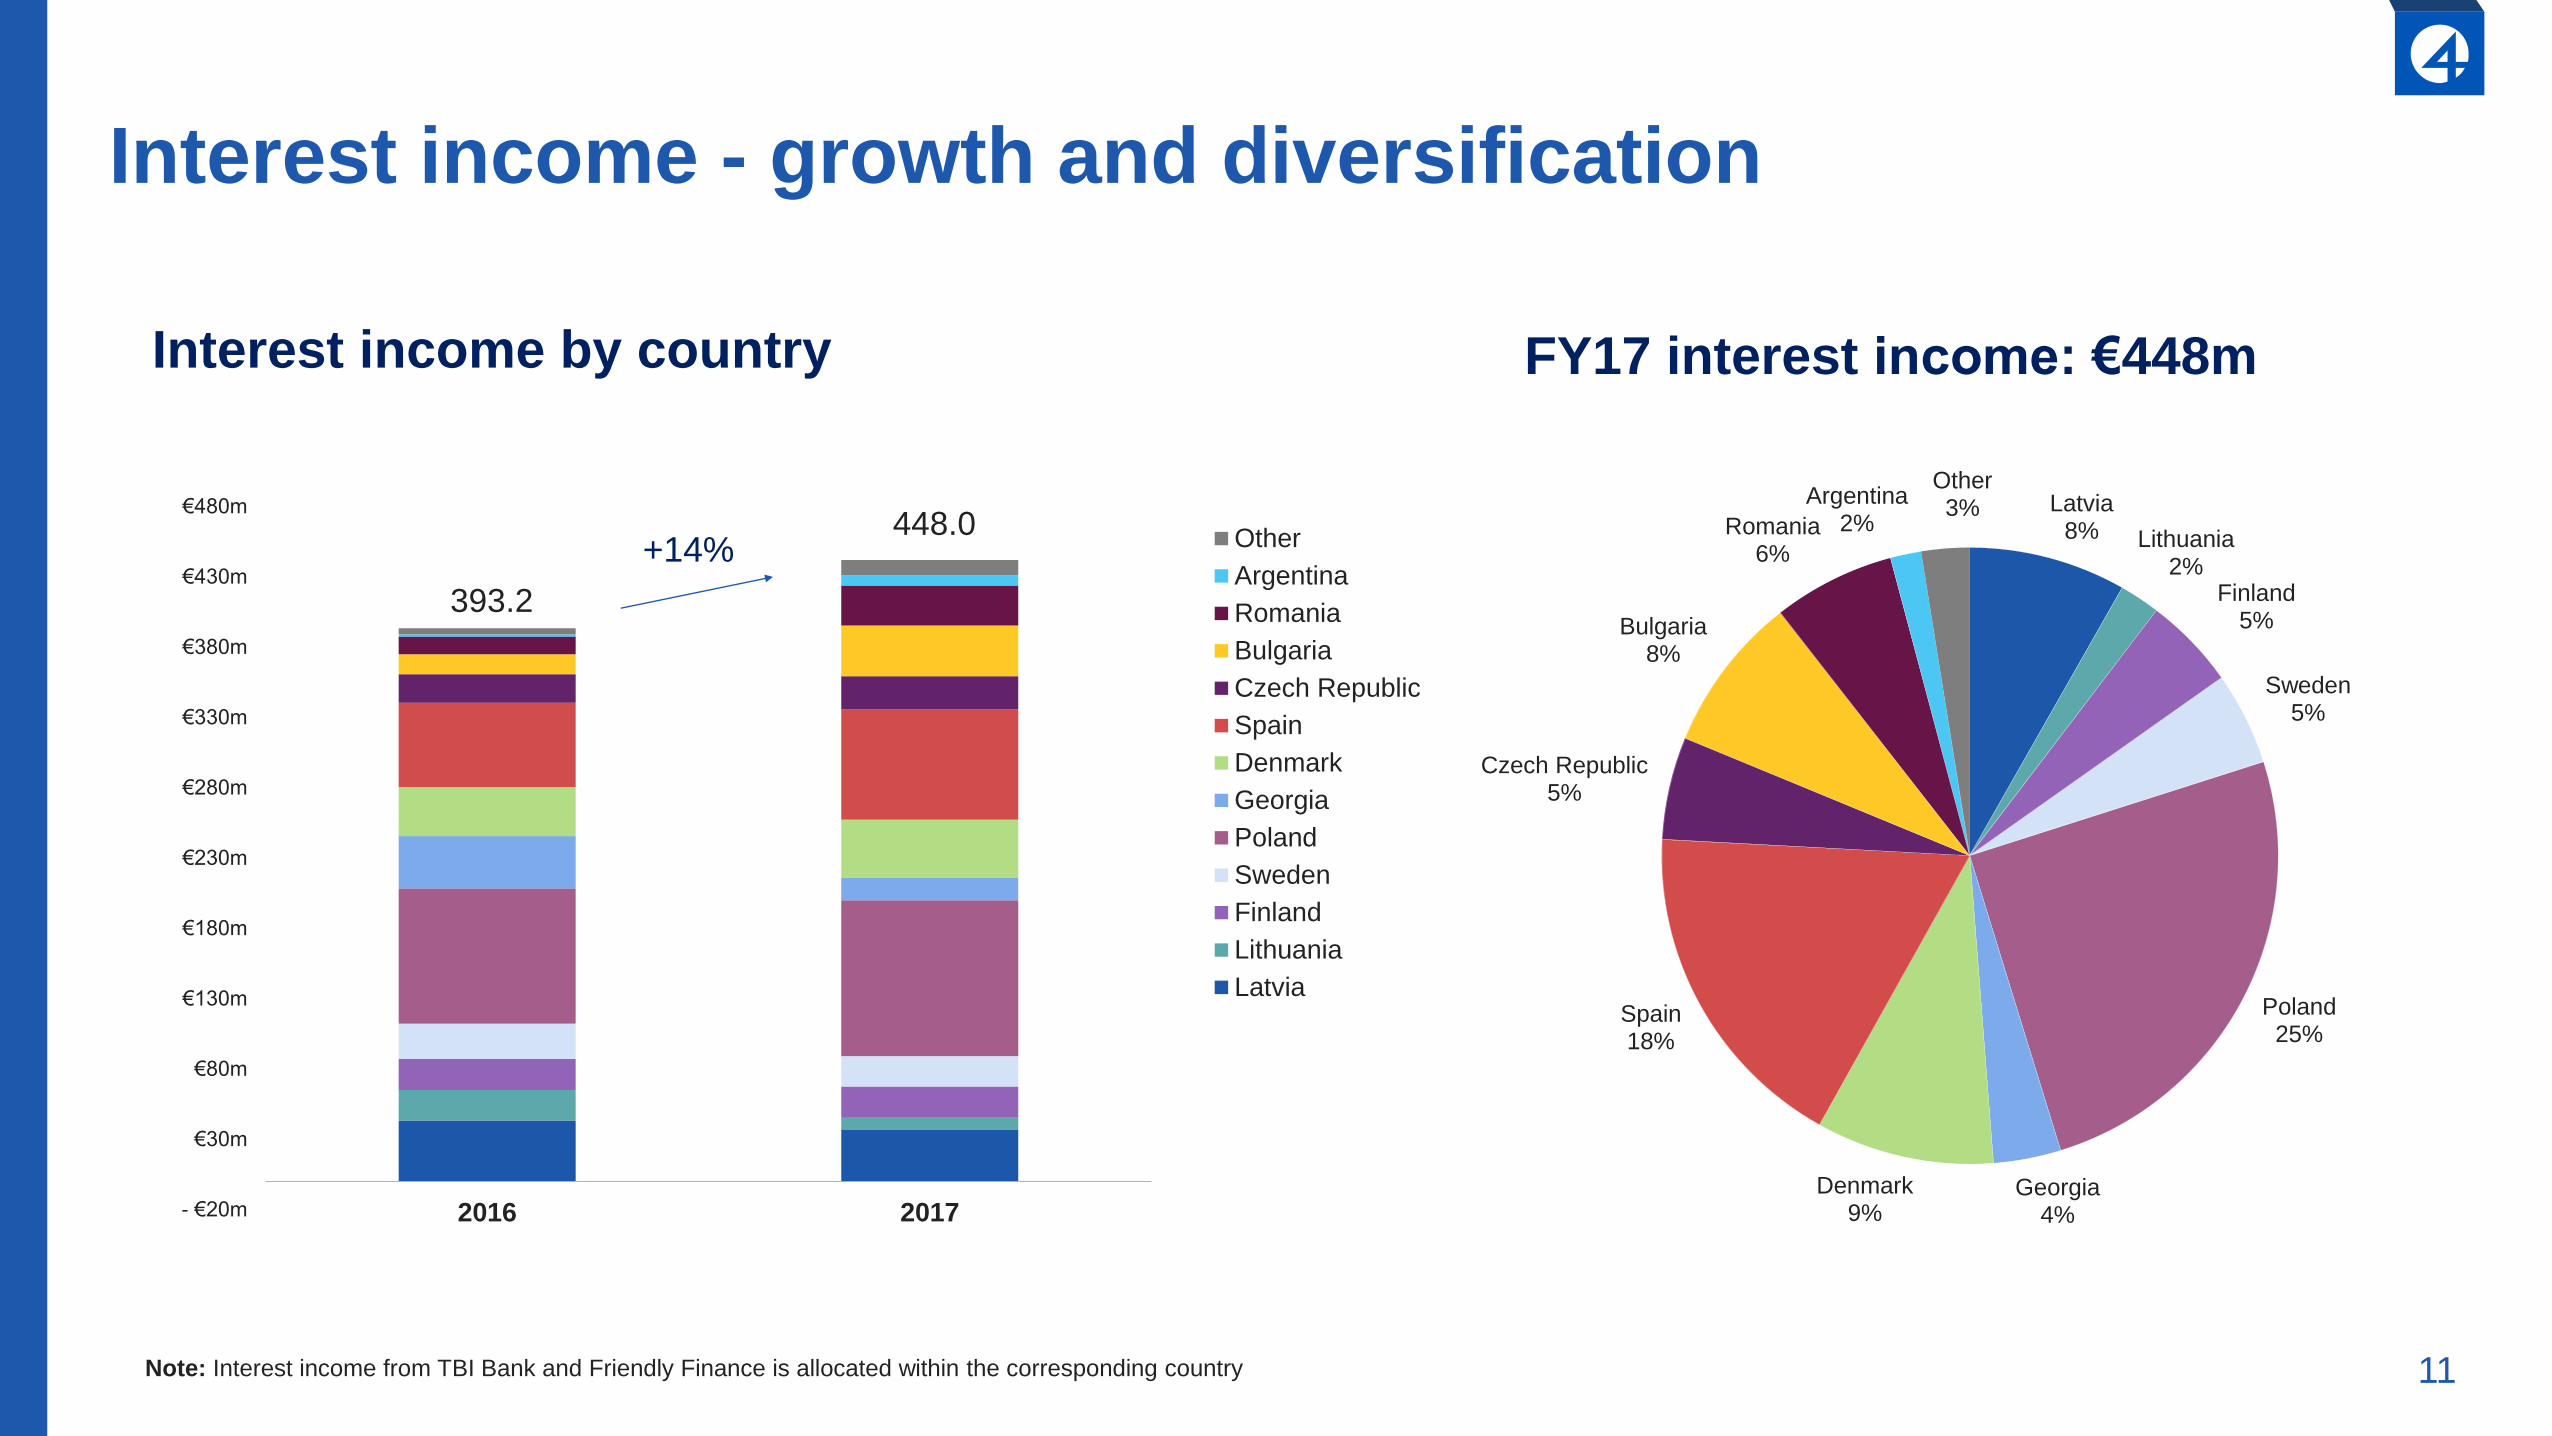
Interest income - growth and diversification
Interest income by country
393.2
448.0
- €20m
€30m
€80m
€130m
€180m
€230m
€280m
€330m
€380m
€430m
€480m
2016 2017
Other
Argentina
Romania
Bulgaria
Czech Republic
Spain
Denmark
Georgia
Poland
Sweden
Finland
Lithuania
Latvia
Latvia8% Lithuania
2%Finland
5%
Sweden5%
Poland25%
Georgia4%
Denmark9%
Spain18%
Czech Republic5%
Bulgaria8%
Romania6%
Argentina2%
Other3%
FY17 interest income: €448m
Note: Interest income from TBI Bank and Friendly Finance is allocated within the corresponding country
+14%
12
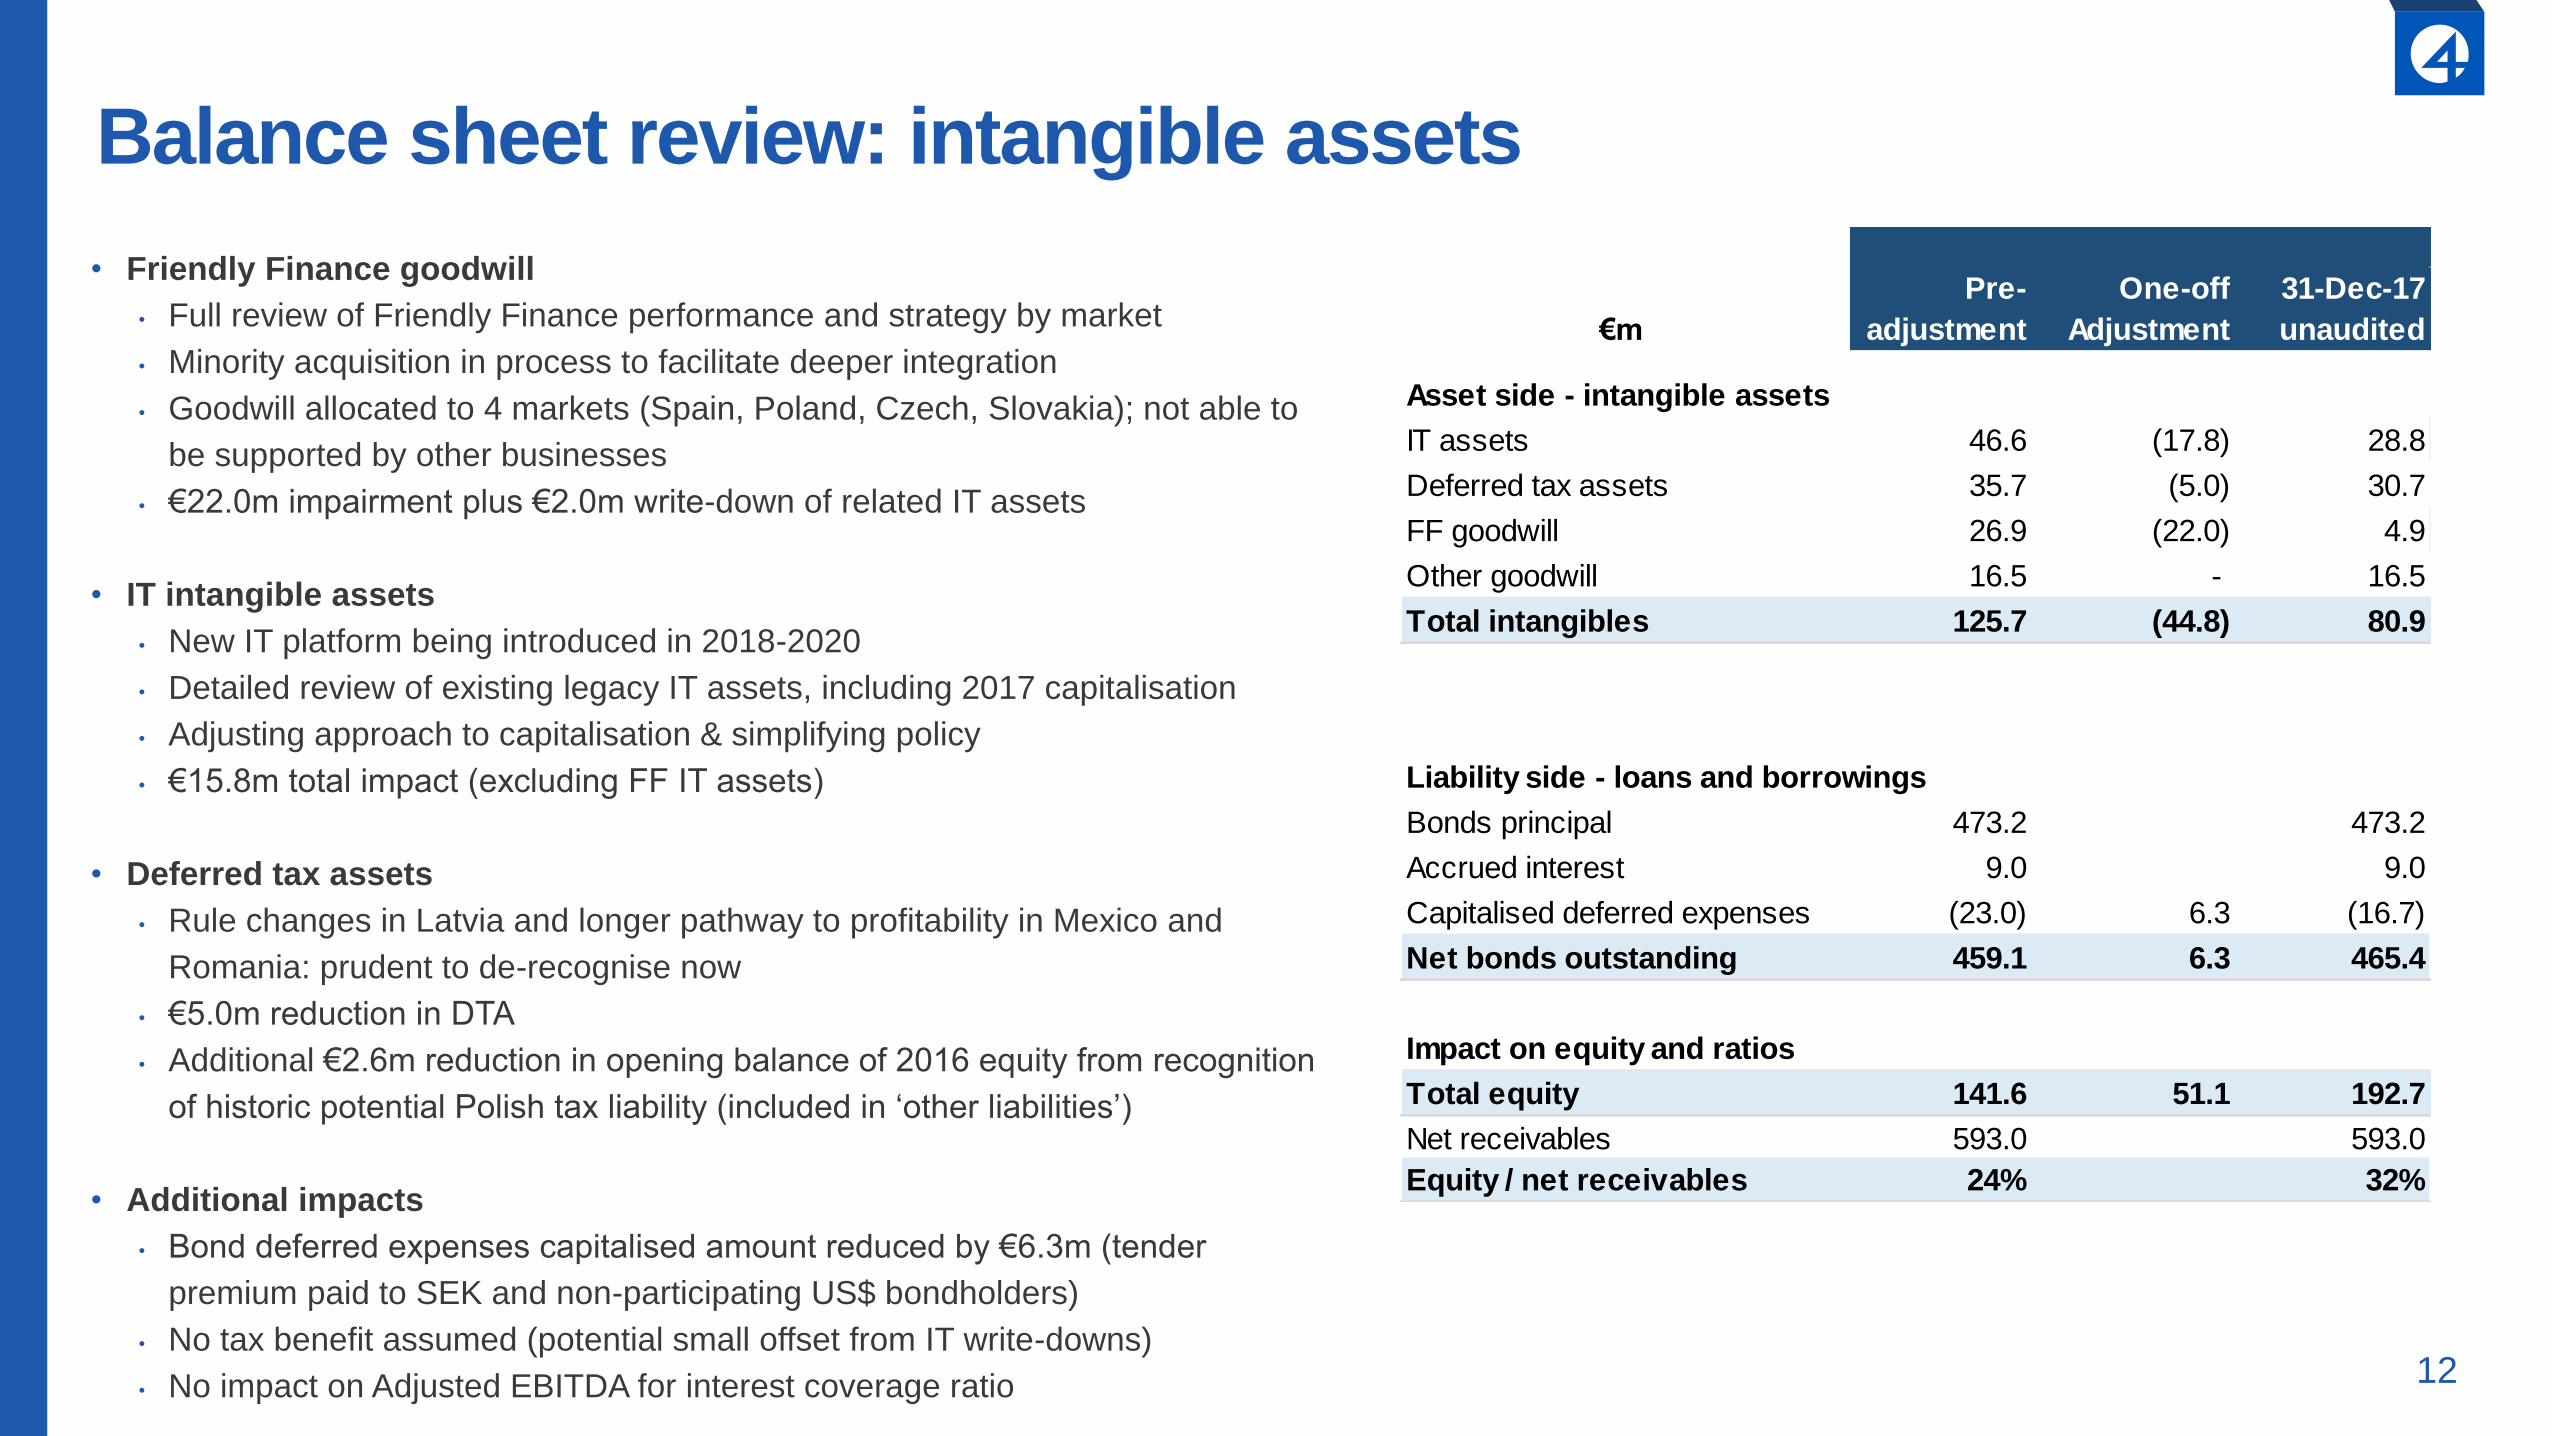
Balance sheet review: intangible assets
• Friendly Finance goodwill
• Full review of Friendly Finance performance and strategy by market
• Minority acquisition in process to facilitate deeper integration
• Goodwill allocated to 4 markets (Spain, Poland, Czech, Slovakia); not able to
be supported by other businesses
• €22.0m impairment plus €2.0m write-down of related IT assets
• IT intangible assets
• New IT platform being introduced in 2018-2020
• Detailed review of existing legacy IT assets, including 2017 capitalisation
• Adjusting approach to capitalisation & simplifying policy
• €15.8m total impact (excluding FF IT assets)
• Deferred tax assets
• Rule changes in Latvia and longer pathway to profitability in Mexico and
Romania: prudent to de-recognise now
• €5.0m reduction in DTA
• Additional €2.6m reduction in opening balance of 2016 equity from recognition
of historic potential Polish tax liability (included in ‘other liabilities’)
• Additional impacts
• Bond deferred expenses capitalised amount reduced by €6.3m (tender
premium paid to SEK and non-participating US$ bondholders)
• No tax benefit assumed (potential small offset from IT write-downs)
• No impact on Adjusted EBITDA for interest coverage ratio
After adjustments
31-Dec-17
unaudited
Asset side - intangible assets
IT assets 46.6 (17.8) 28.8
Deferred tax assets 35.7 (5.0) 30.7
FF goodwill 26.9 (22.0) 4.9
Other goodwill 16.5 - 16.5
Total intangibles 125.7 (44.8) 80.9
Liability side - loans and borrowings
Bonds principal 473.2 473.2
Accrued interest 9.0 9.0
Capitalised deferred expenses (23.0) 6.3 (16.7)
Net bonds outstanding 459.1 6.3 465.4
Impact on equity and ratios
Total equity 141.6 51.1 192.7
Net receivables 593.0 593.0
Equity / net receivables 24% 32%
€m
One-off
Adjustment
Pre-
adjustment
13
41.2 41.1 41.2 42.244.5 43.6
39.7
47.8
4.7
9.48.0 9.9
10.8
10.8
3.2
2.23.1
3.4
3.7
5.4
49%48%
50%
56%
58% 58%
53%
58%
0%
10%
20%
30%
40%
50%
60%
70%
0.0
10.0
20.0
30.0
40.0
50.0
60.0
70.0
Q1 Q2 Q3 Q4 Q1 Q2 Q3 Q4
4finance TBI Friendly Finance Quarterly cost/income ratio, %
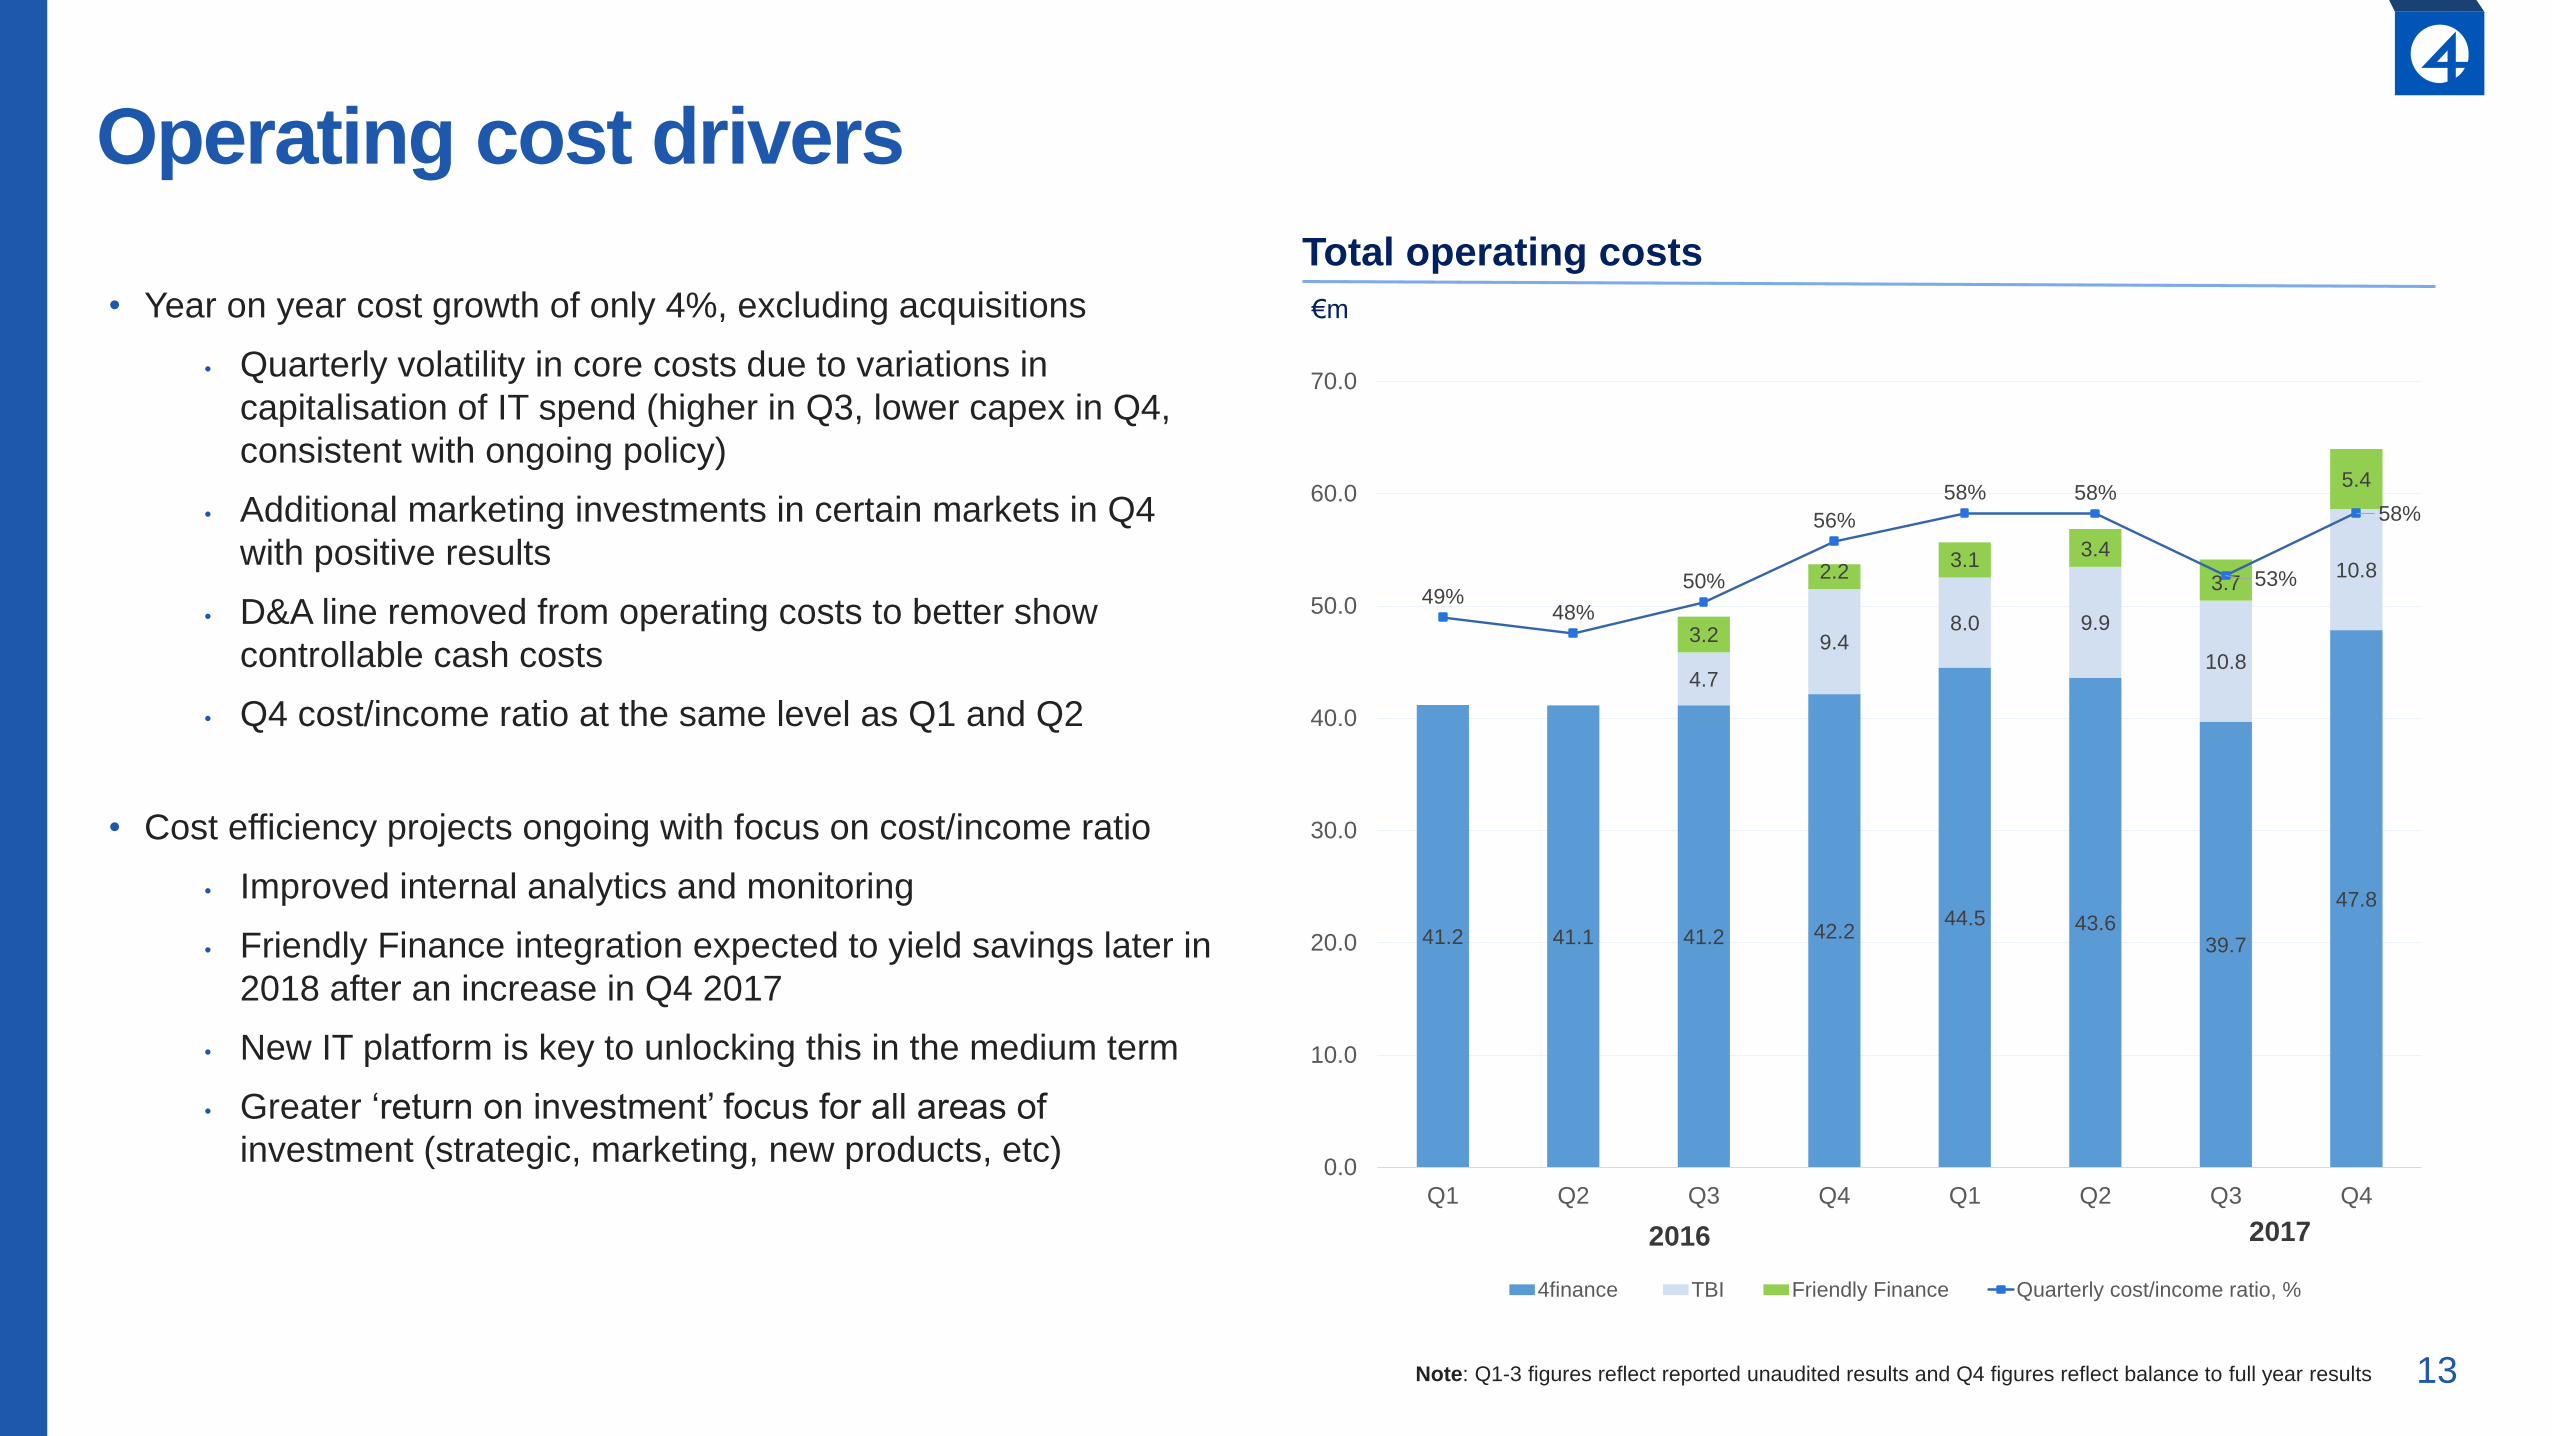
Operating cost drivers
2016
• Year on year cost growth of only 4%, excluding acquisitions
• Quarterly volatility in core costs due to variations in
capitalisation of IT spend (higher in Q3, lower capex in Q4,
consistent with ongoing policy)
• Additional marketing investments in certain markets in Q4
with positive results
• D&A line removed from operating costs to better show
controllable cash costs
• Q4 cost/income ratio at the same level as Q1 and Q2
• Cost efficiency projects ongoing with focus on cost/income ratio
• Improved internal analytics and monitoring
• Friendly Finance integration expected to yield savings later in
2018 after an increase in Q4 2017
• New IT platform is key to unlocking this in the medium term
• Greater ‘return on investment’ focus for all areas of
investment (strategic, marketing, new products, etc)
2017
Note: Q1-3 figures reflect reported unaudited results and Q4 figures reflect balance to full year results
Total operating costs
€m
14
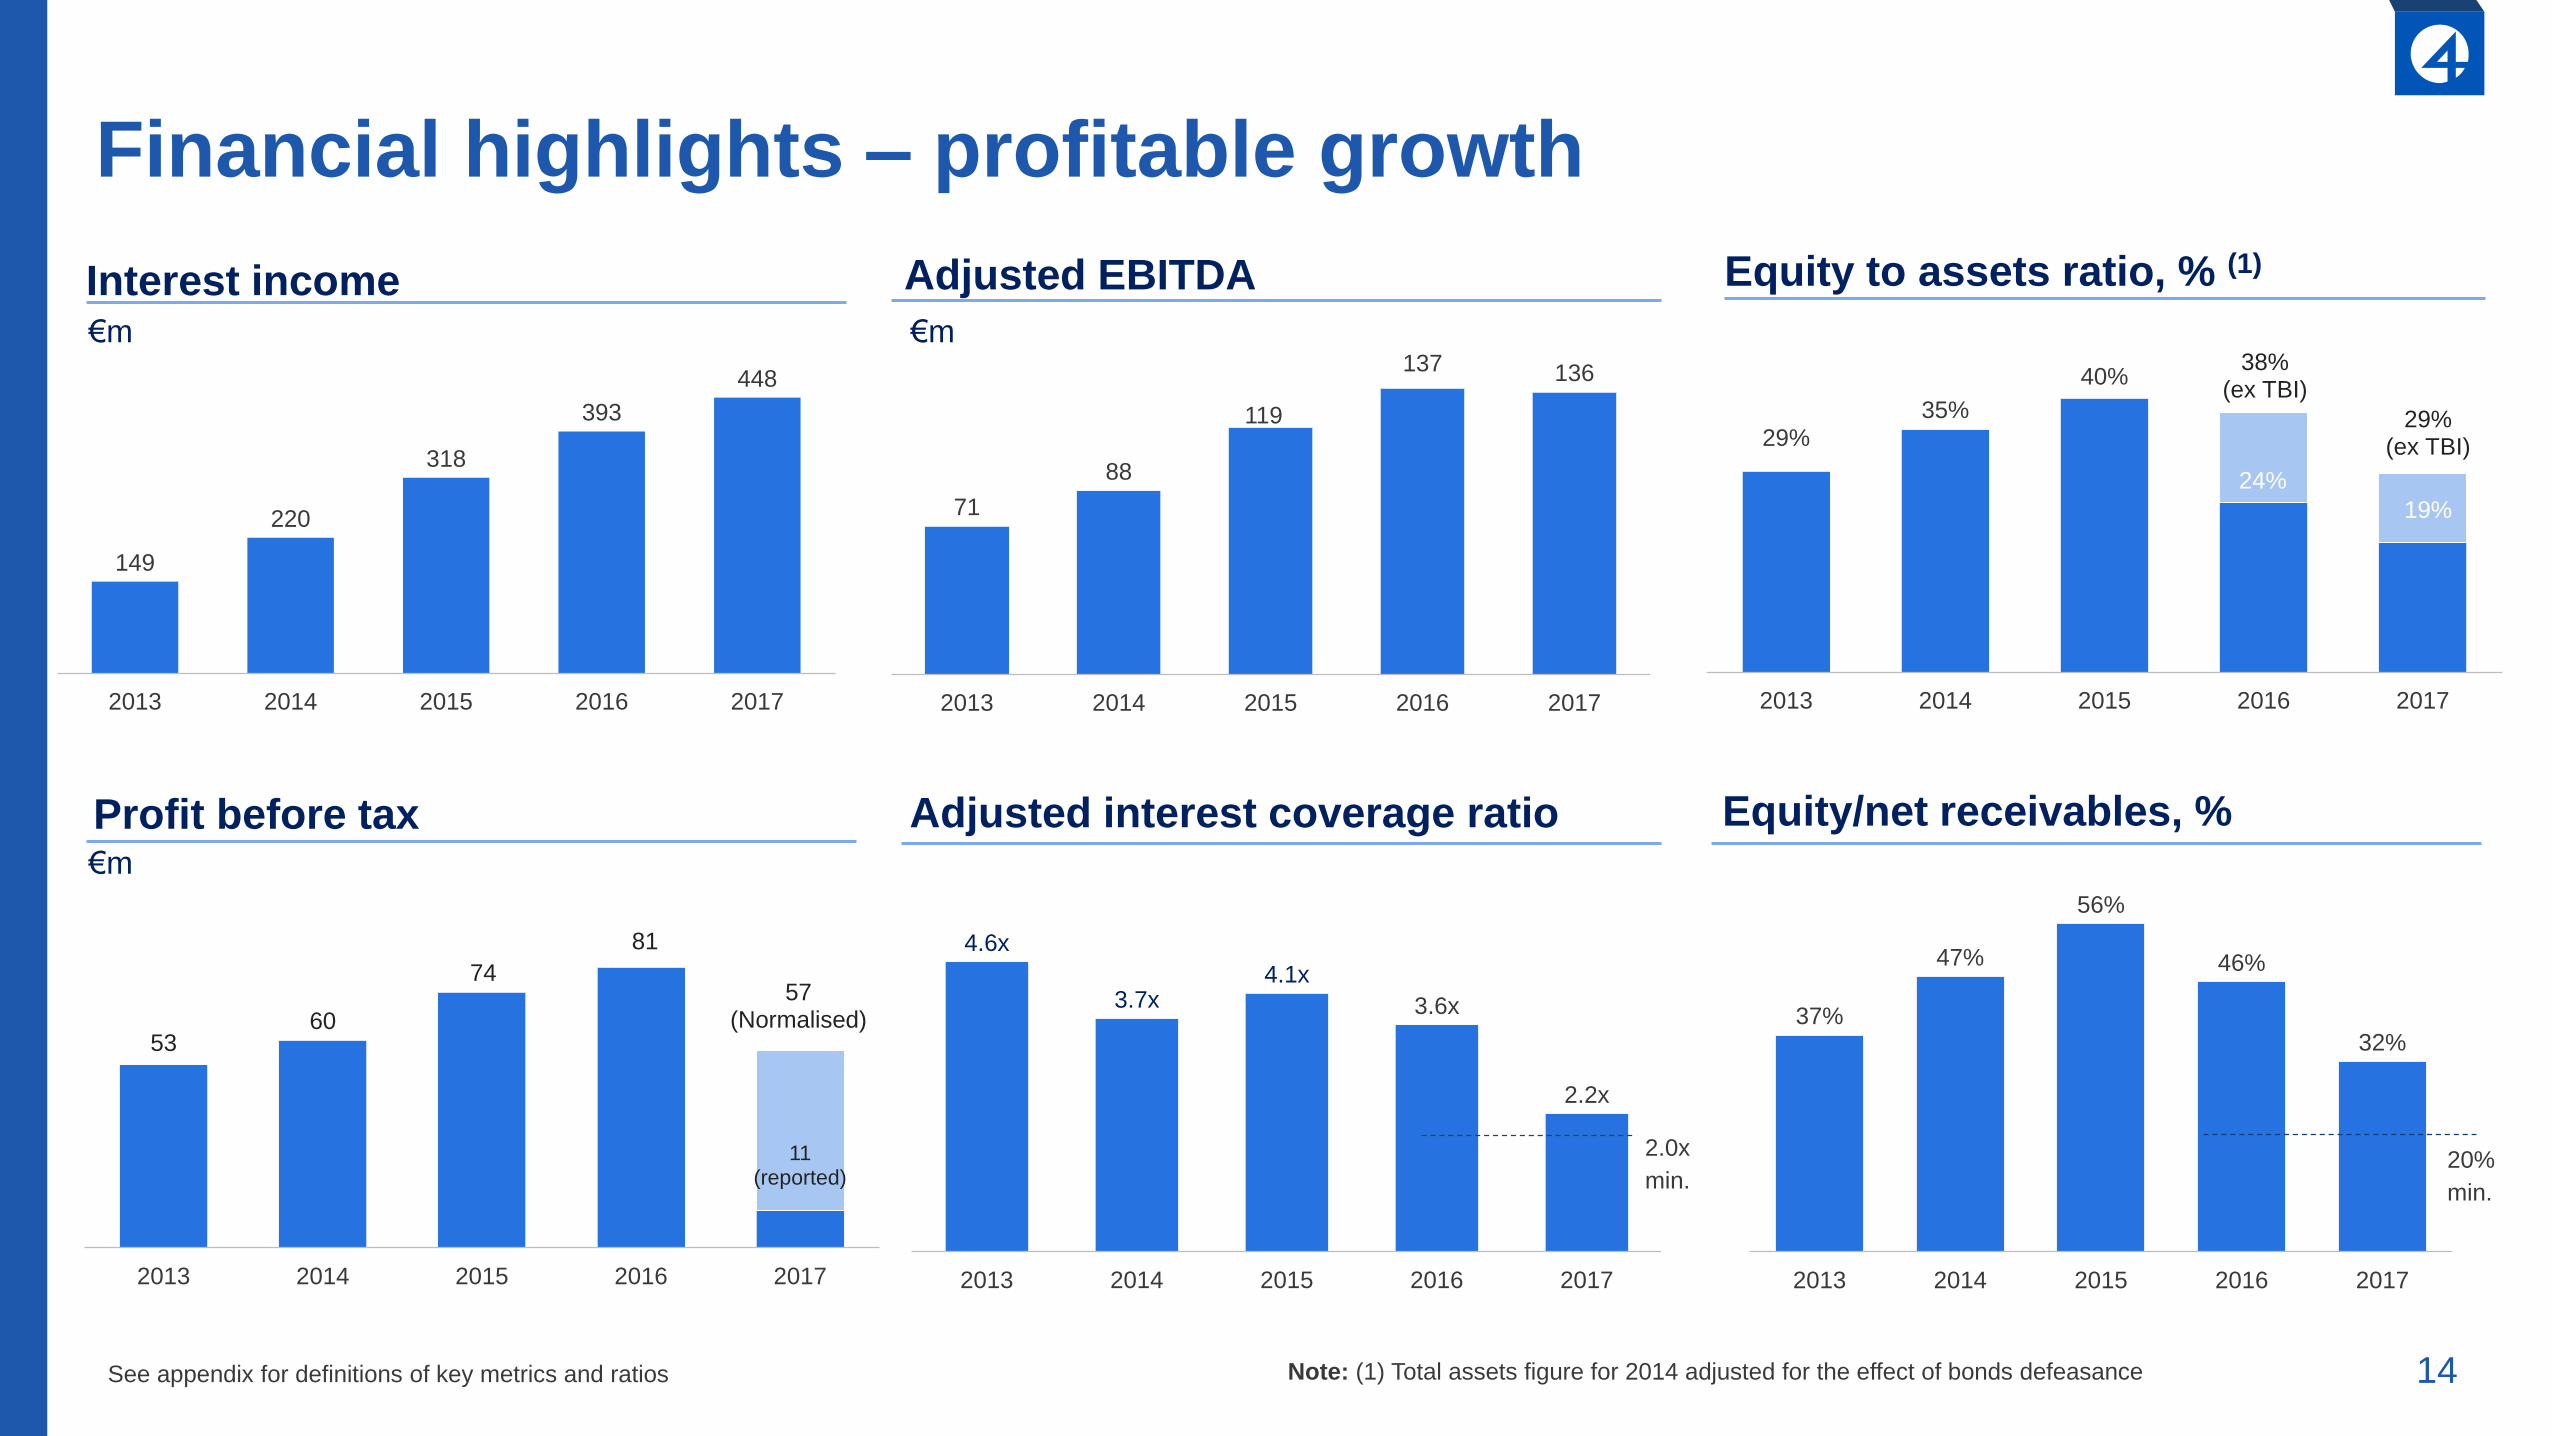
Profit before tax
29%35%
40%
24%
19%
38% (ex TBI)
29% (ex TBI)
2013 2014 2015 2016 2017
Financial highlights – profitable growth
Interest income
149
220
318
393
448
2013 2014 2015 2016 2017
71
88
119
137 136
2013 2014 2015 2016 2017
€m
Adjusted EBITDA Equity to assets ratio, % (1)
4.6x
3.7x4.1x
3.6x
2.2x
2013 2014 2015 2016 2017
Adjusted interest coverage ratio
37%
47%
56%
46%
32%
2013 2014 2015 2016 2017
Equity/net receivables, %
Note: (1) Total assets figure for 2014 adjusted for the effect of bonds defeasance
2.0x
min.20%
min.
See appendix for definitions of key metrics and ratios
€m
€m
5360
74
81
11 (reported)
57 (Normalised)
2013 2014 2015 2016 2017
15
Baltics11%
Scandinavia13%
Poland21%
Spain7%
Czech/Slovakia
4%
Georgia/Armenia
5%
LatAm0.9%
BG/RO (online)1%
Bulgaria (TBI)17%
Romania (TBI)13%
SME (TBI)7%
538
805
1,0621,157
1,276
2013 2014 2015 2016 2017
€m
178
241
308 316369
178
224494
593
2013 2014 2015 2016 2017
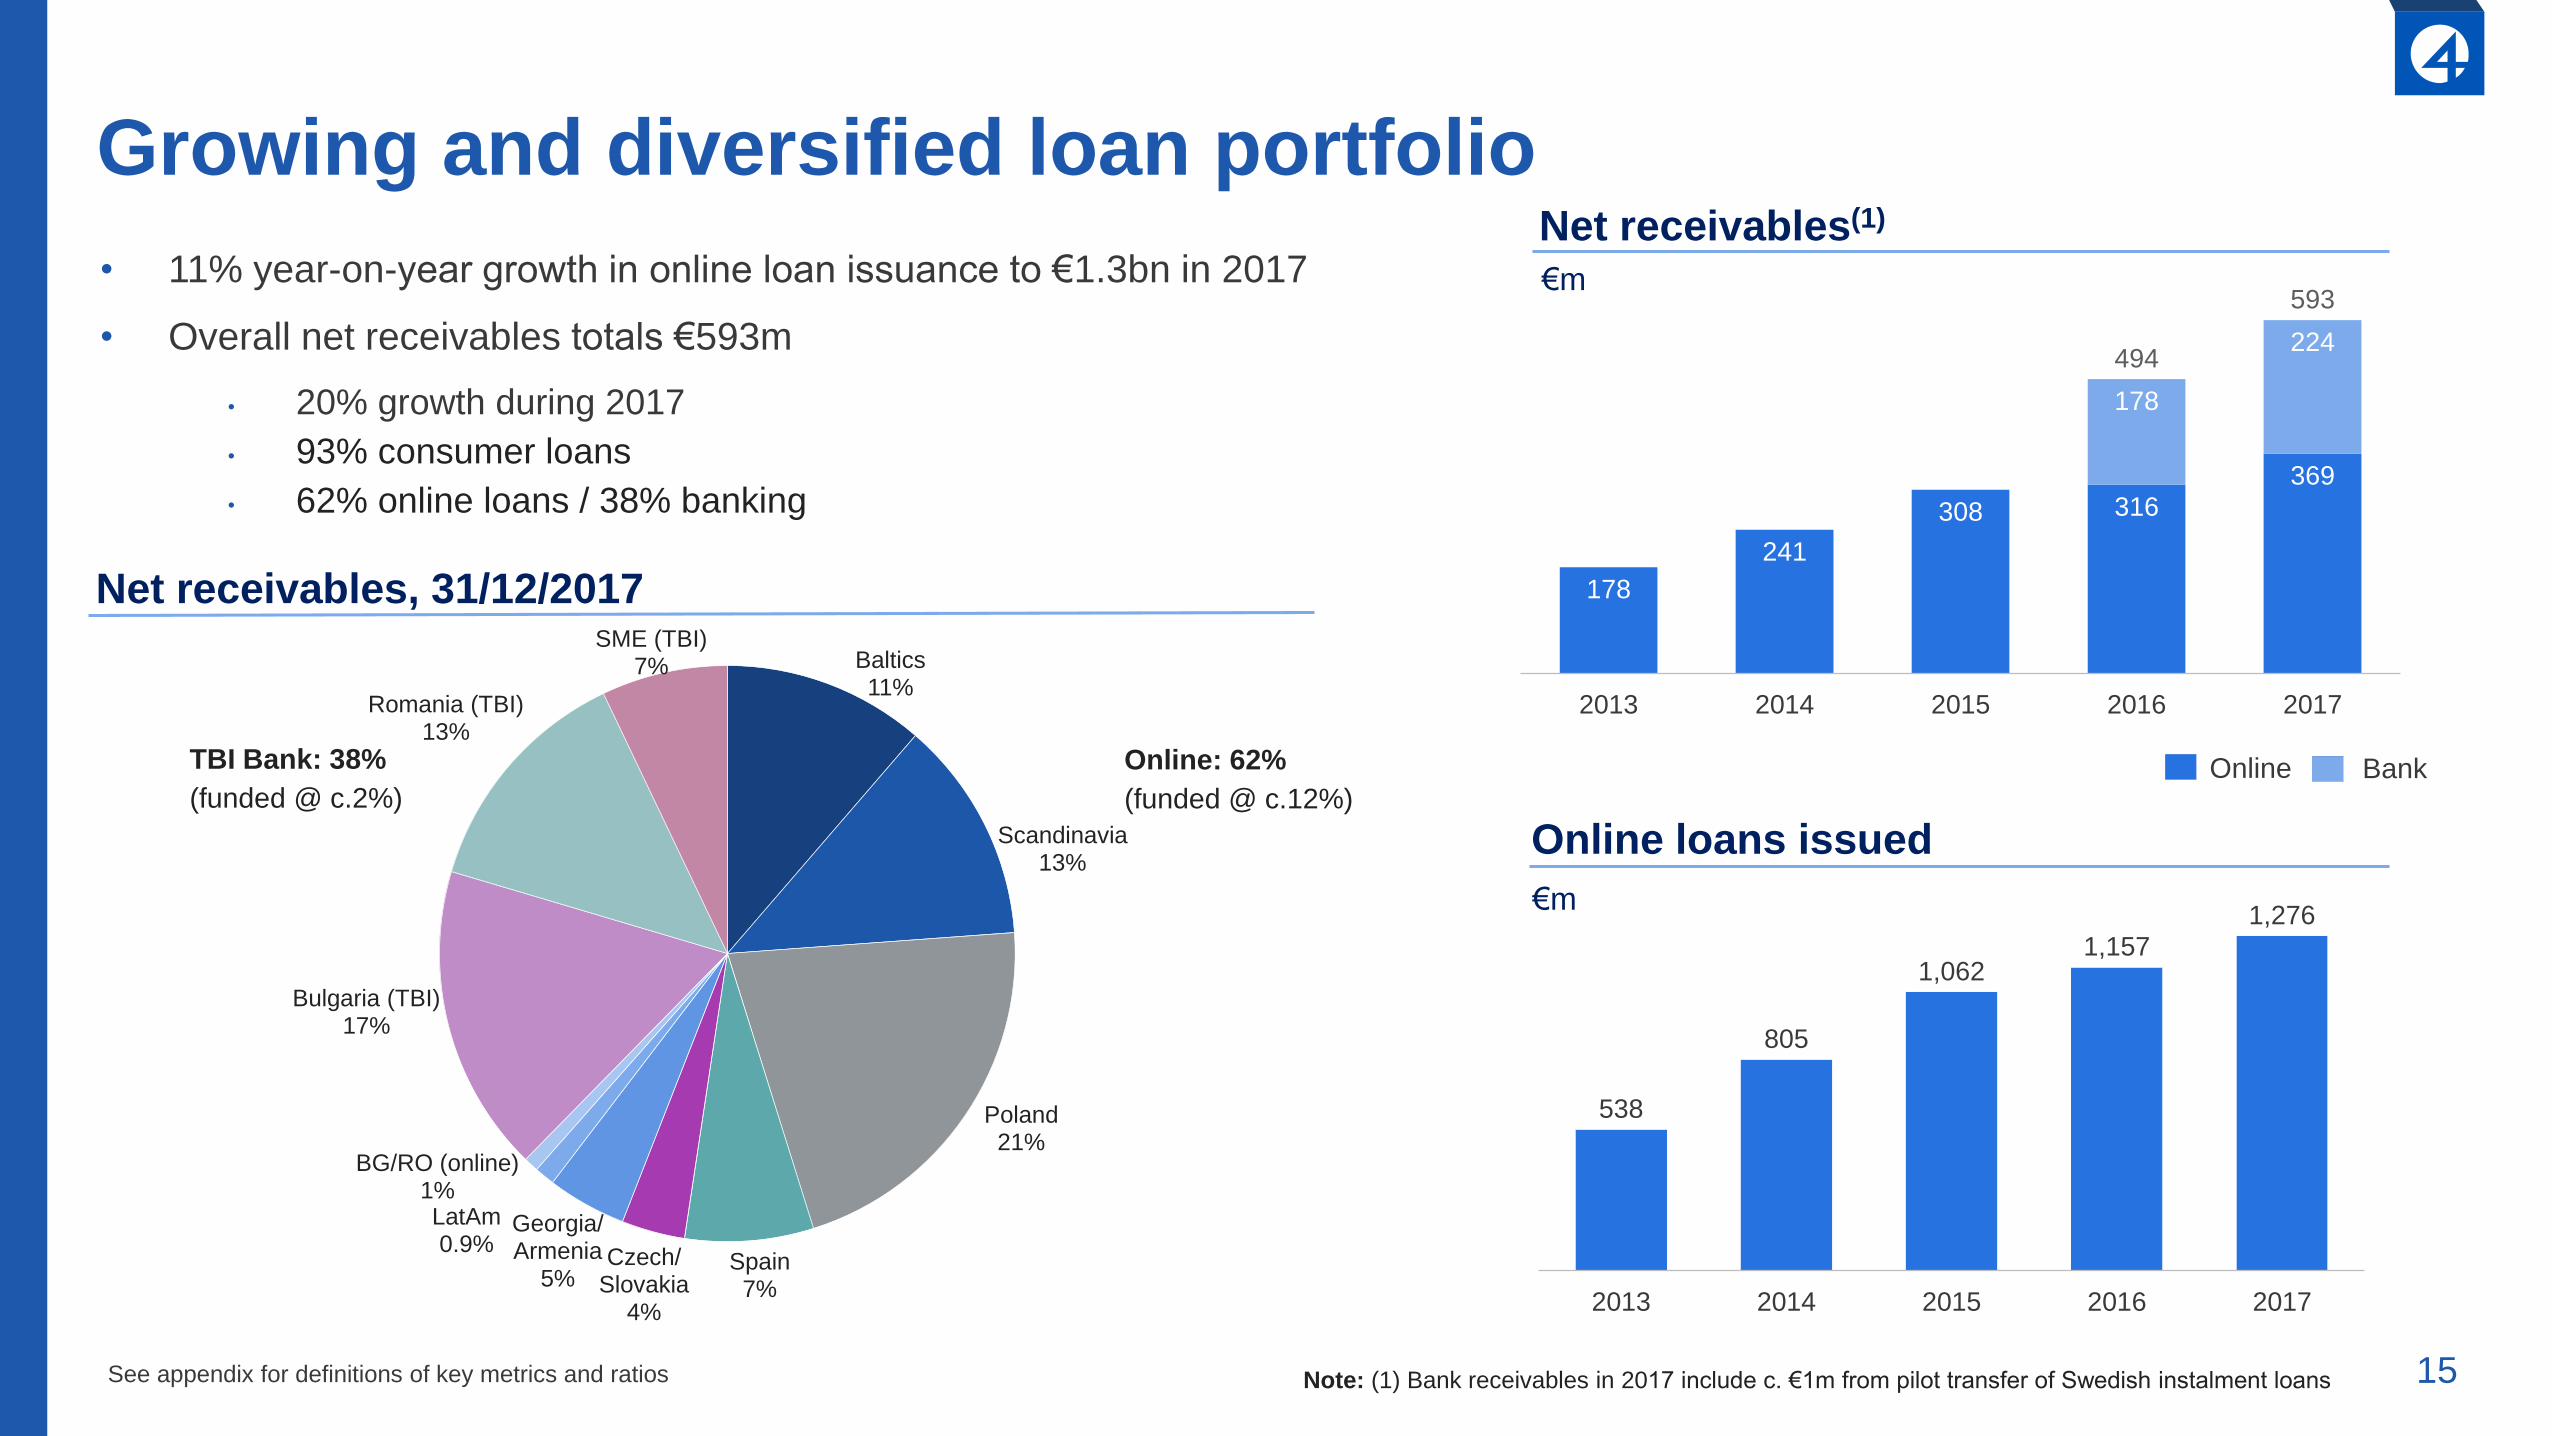
Growing and diversified loan portfolioNet receivables(1)
Net receivables, 31/12/2017
Note: (1) Bank receivables in 2017 include c. €1m from pilot transfer of Swedish instalment loans
• 11% year-on-year growth in online loan issuance to €1.3bn in 2017
• Overall net receivables totals €593m
• 20% growth during 2017
• 93% consumer loans
• 62% online loans / 38% banking
Online loans issued
BankOnlineTBI Bank: 38%
(funded @ c.2%)
Online: 62%
(funded @ c.12%)
€m
See appendix for definitions of key metrics and ratios
16
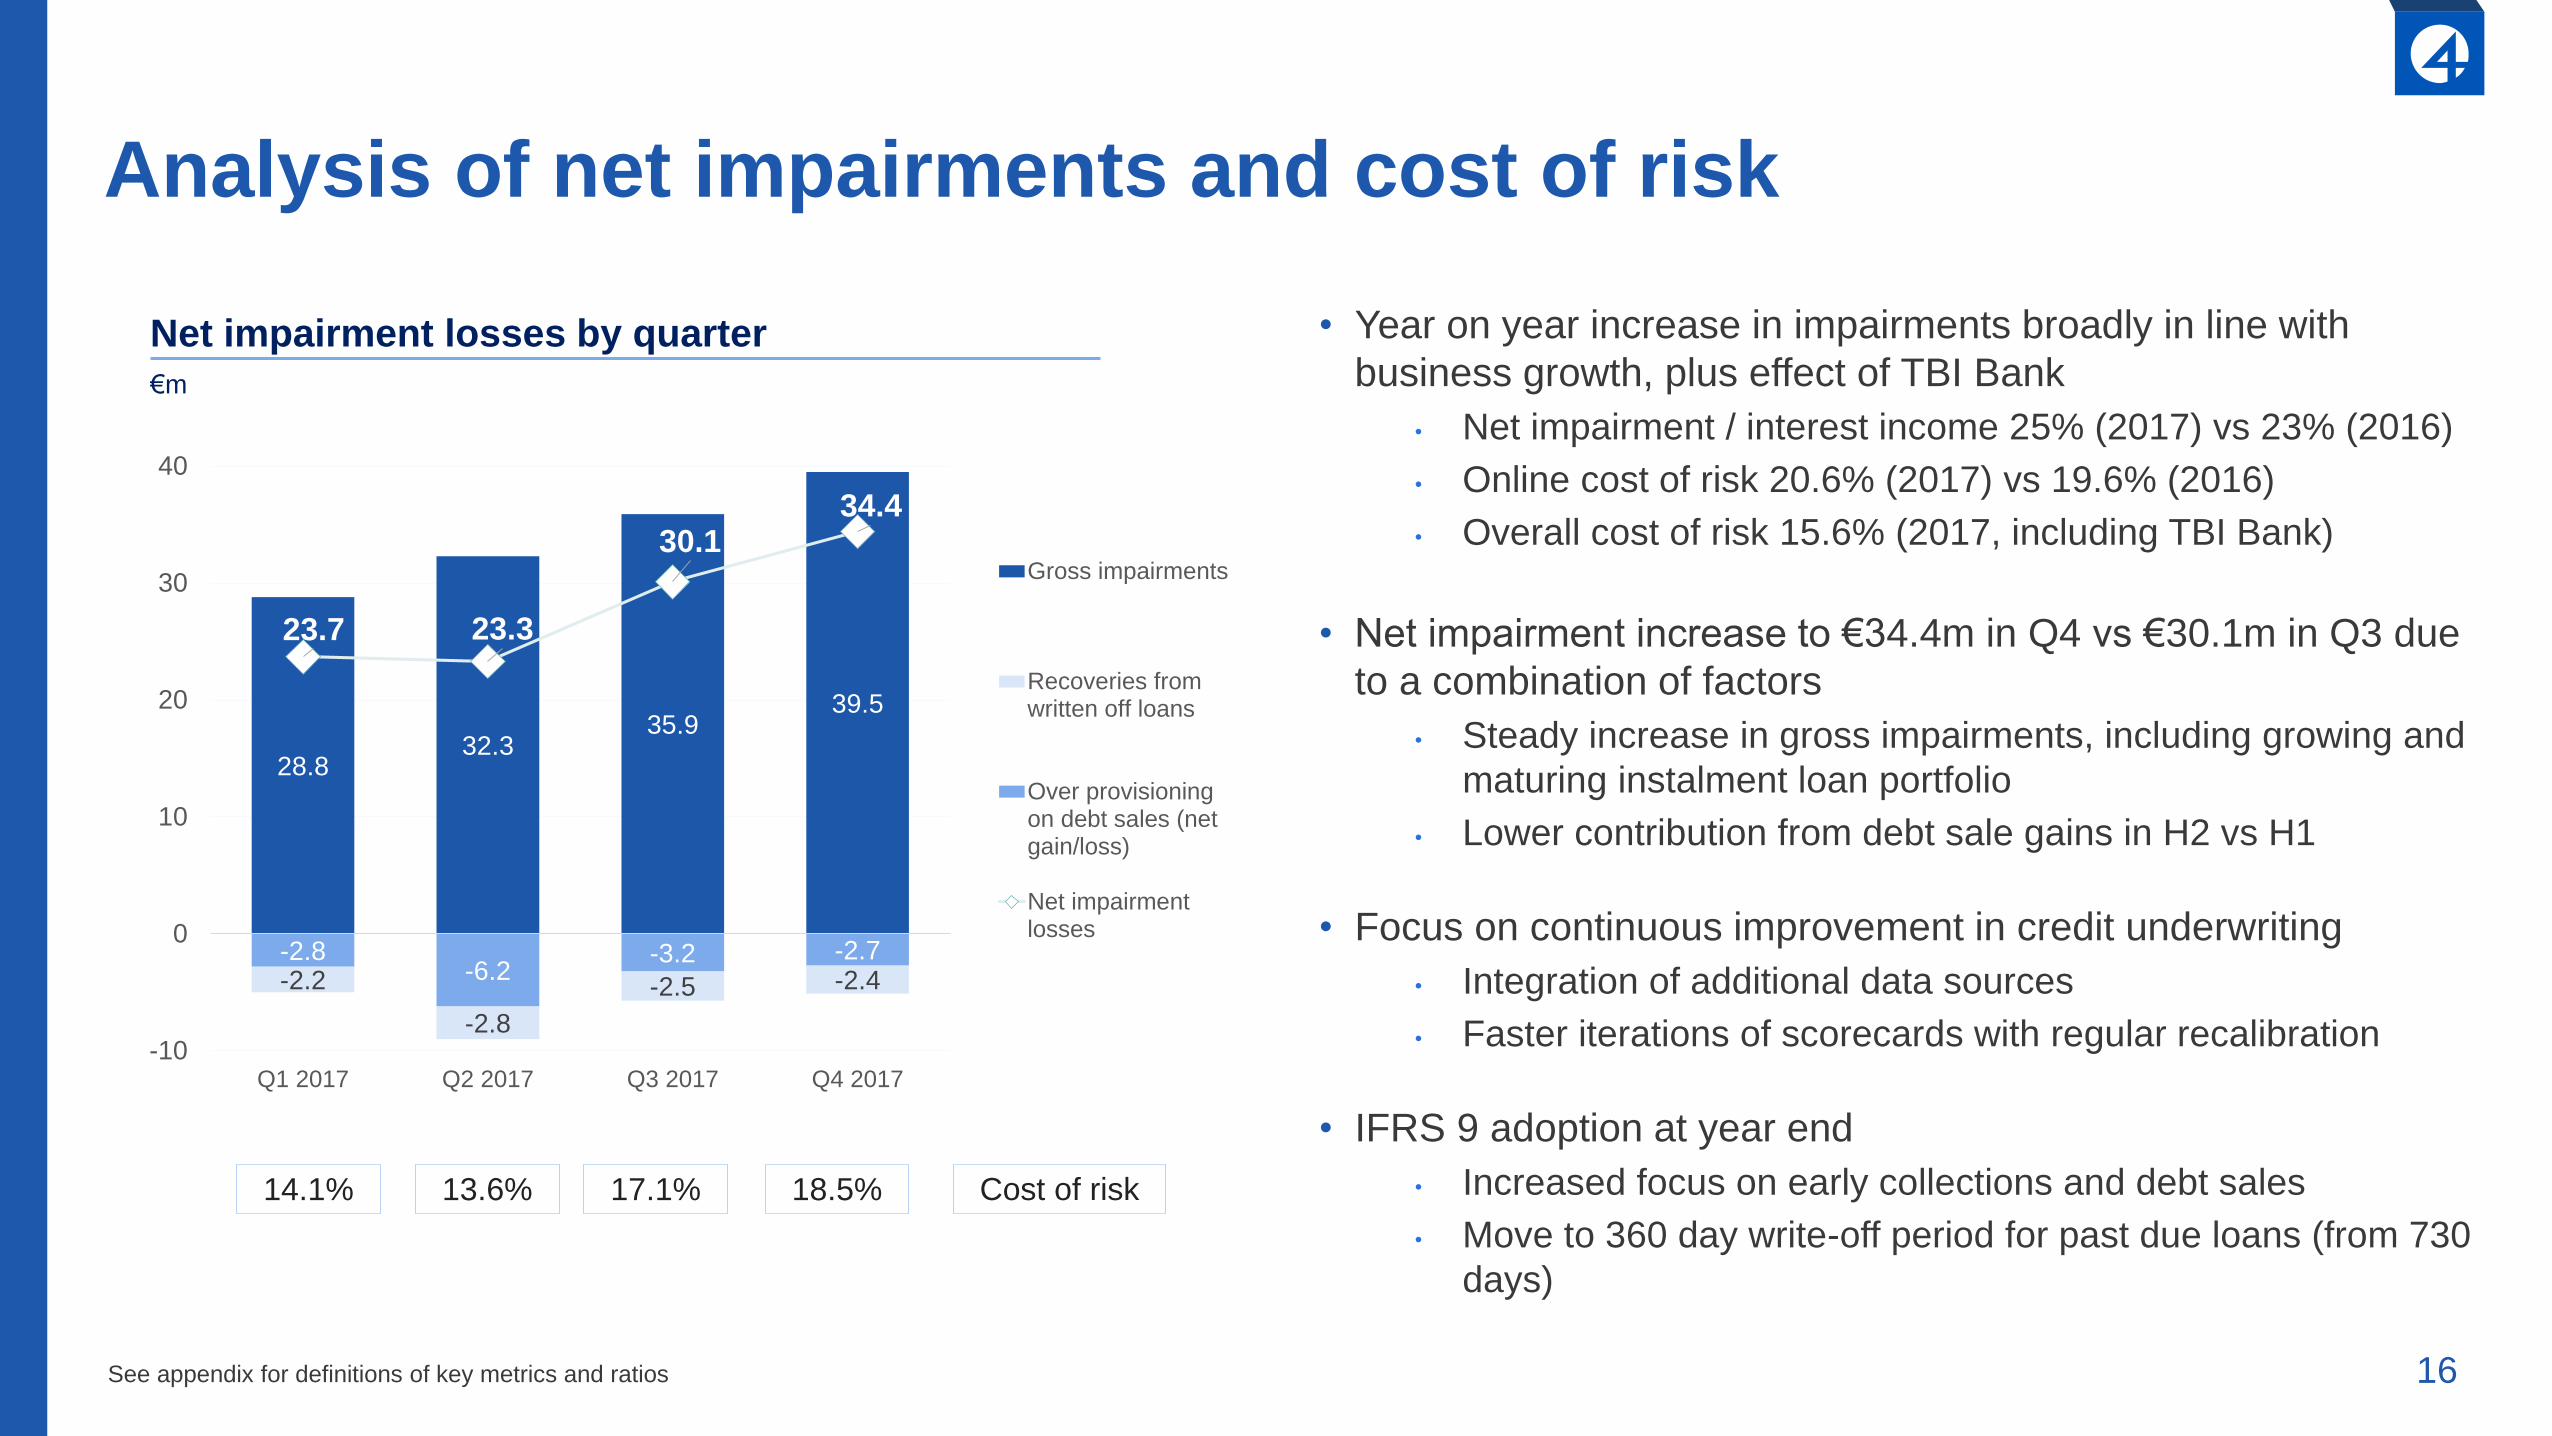
Analysis of net impairments and cost of risk
• Year on year increase in impairments broadly in line with
business growth, plus effect of TBI Bank
• Net impairment / interest income 25% (2017) vs 23% (2016)
• Online cost of risk 20.6% (2017) vs 19.6% (2016)
• Overall cost of risk 15.6% (2017, including TBI Bank)
• Net impairment increase to €34.4m in Q4 vs €30.1m in Q3 due
to a combination of factors
• Steady increase in gross impairments, including growing and
maturing instalment loan portfolio
• Lower contribution from debt sale gains in H2 vs H1
• Focus on continuous improvement in credit underwriting
• Integration of additional data sources
• Faster iterations of scorecards with regular recalibration
• IFRS 9 adoption at year end
• Increased focus on early collections and debt sales
• Move to 360 day write-off period for past due loans (from 730
days)
Net impairment losses by quarter
€m
14.1% 13.6% 17.1% Cost of risk
See appendix for definitions of key metrics and ratios
-2.8-6.2
-3.2 -2.7-2.2
-2.8
-2.5 -2.4
28.832.3
35.939.5
23.7 23.3
30.134.4
-10
0
10
20
30
40
Q1 2017 Q2 2017 Q3 2017 Q4 2017
Gross impairments
Recoveries fromwritten off loans
Over provisioningon debt sales (netgain/loss)
Net impairmentlosses
18.5%
17
Gross amount % of gross
Impairment
allowance
Net
amount
Impairment /
gross
Gross
amount % of gross
Impairment
allowance
Net
amount
Impairment /
gross
Online receivables
DPD 0 274.3 53.0% 8.2 266.1 3.0% 216.7 45.7% 6.3 210.4 2.9%
DPD 1-30 30.1 5.8% 8.0 22.1 26.5% 25.6 5.4% 6.2 19.3 24.4%
DPD 31-60 22.3 4.3% 9.6 12.7 42.9% 17.8 3.7% 7.8 10.0 43.8%
DPD 61-90 18.0 3.5% 8.8 9.1 49.1% 14.6 3.1% 7.3 7.3 50.1%
Performing 344.7 66.6% 34.6 310.1 10.0% 274.7 58.0% 27.7 247.0 10.1%
DPD 91-360 97.4 18.8% 55.8 41.6 57.3% 102.8 21.7% 57.0 45.8 55.5%
DPD 361-730 75.7 14.6% 58.7 17.0 77.5% 96.5 20.4% 72.9 23.6 75.6%
Non-performing 173.1 33.4% 114.5 58.6 66.1% 199.3 42.0% 129.9 69.4 65.2%
Online total 517.8 100.0% 149.1 368.7 28.8% 474.0 100.0% 157.6 316.4 33.3%
TBI Bank receivables
Performing 214.3 87.4% 4.4 209.9 2.1% 170.3 89.1% 1.4 168.9 0.8%
Non-performing 31.0 12.6% 16.6 14.4 53.5% 20.8 10.9% 12.2 8.6 58.5%
TBI Bank total 245.3 100.0% 21.0 224.3 8.6% 191.1 100.0% 13.6 177.5 7.1%
Overall group receivables
Performing 559.0 73.3% 39.0 520.0 7.0% 445.0 66.9% 29.1 415.9 6.5%
Non-performing 204.1 26.7% 131.1 73.0 64.2% 220.1 33.1% 142.1 78.0 64.6%
Overall total 763.1 100.0% 170.1 593.0 22.3% 665.1 100.0% 171.2 493.9 25.7%
(in millions of €, except percentages) (in millions of €, except percentages)
31 December 2017 31 December 2016
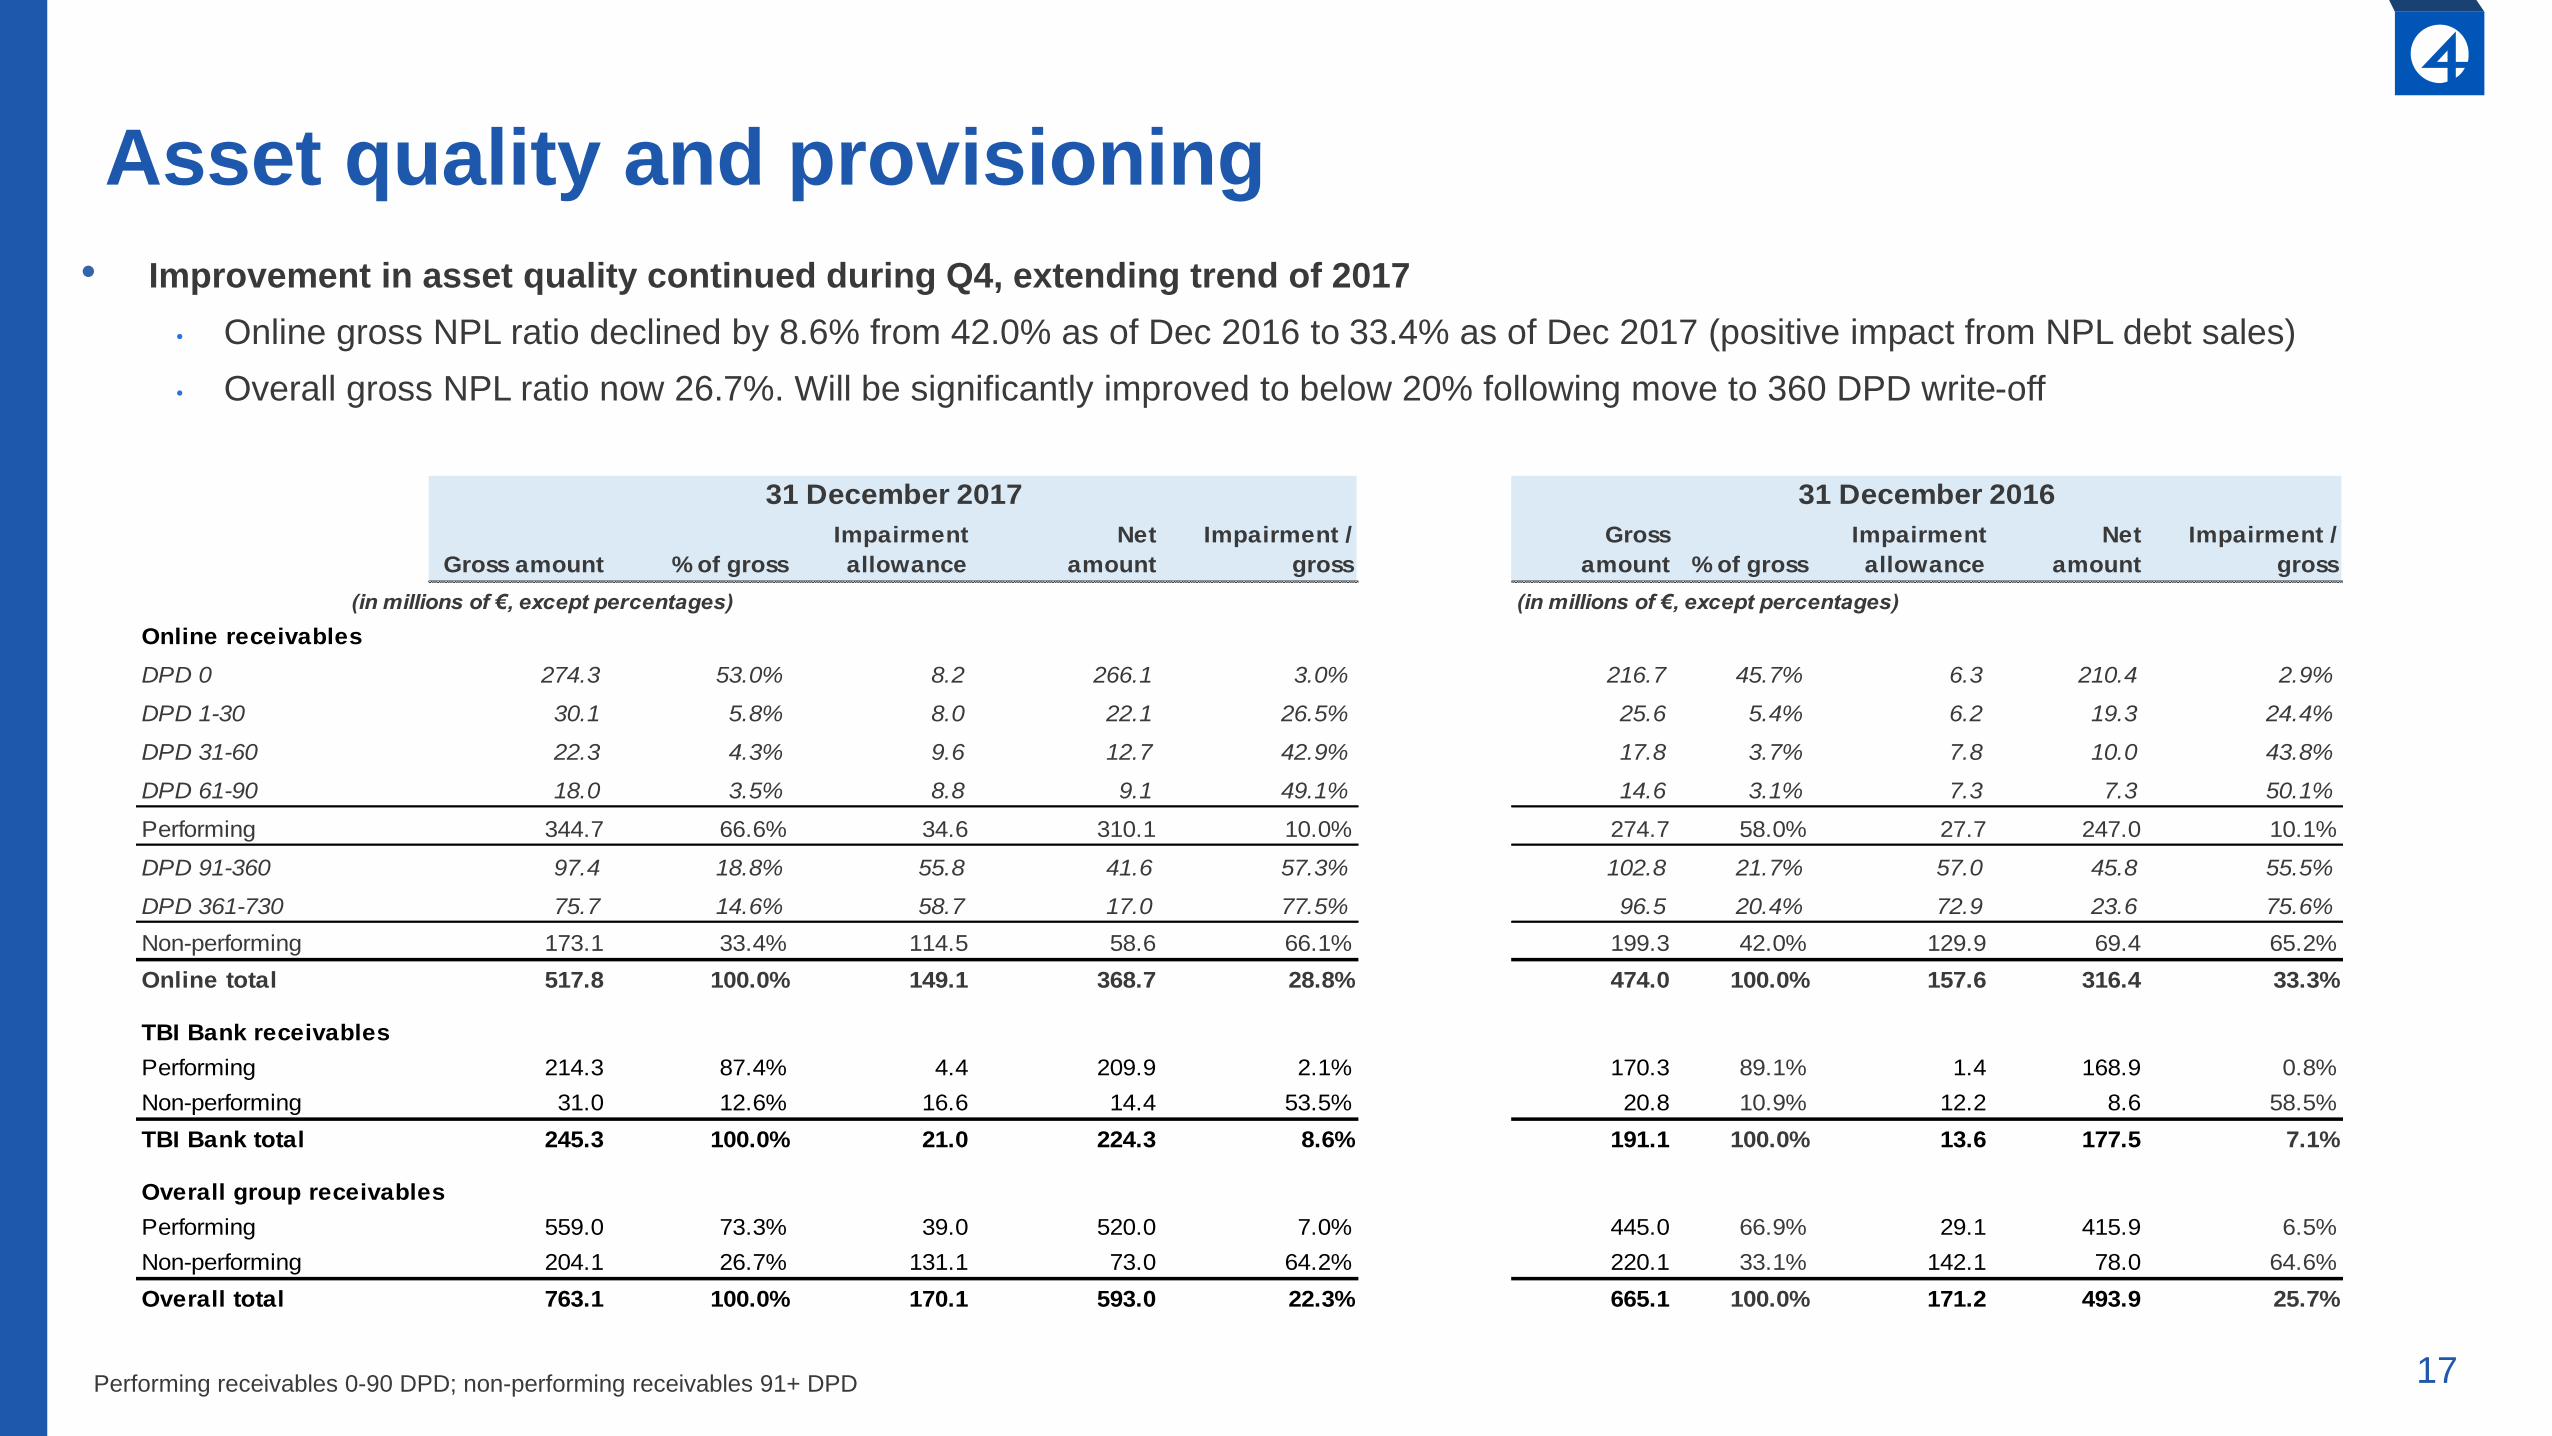
Asset quality and provisioning
• Improvement in asset quality continued during Q4, extending trend of 2017
• Online gross NPL ratio declined by 8.6% from 42.0% as of Dec 2016 to 33.4% as of Dec 2017 (positive impact from NPL debt sales)
• Overall gross NPL ratio now 26.7%. Will be significantly improved to below 20% following move to 360 DPD write-off
Performing receivables 0-90 DPD; non-performing receivables 91+ DPD
18
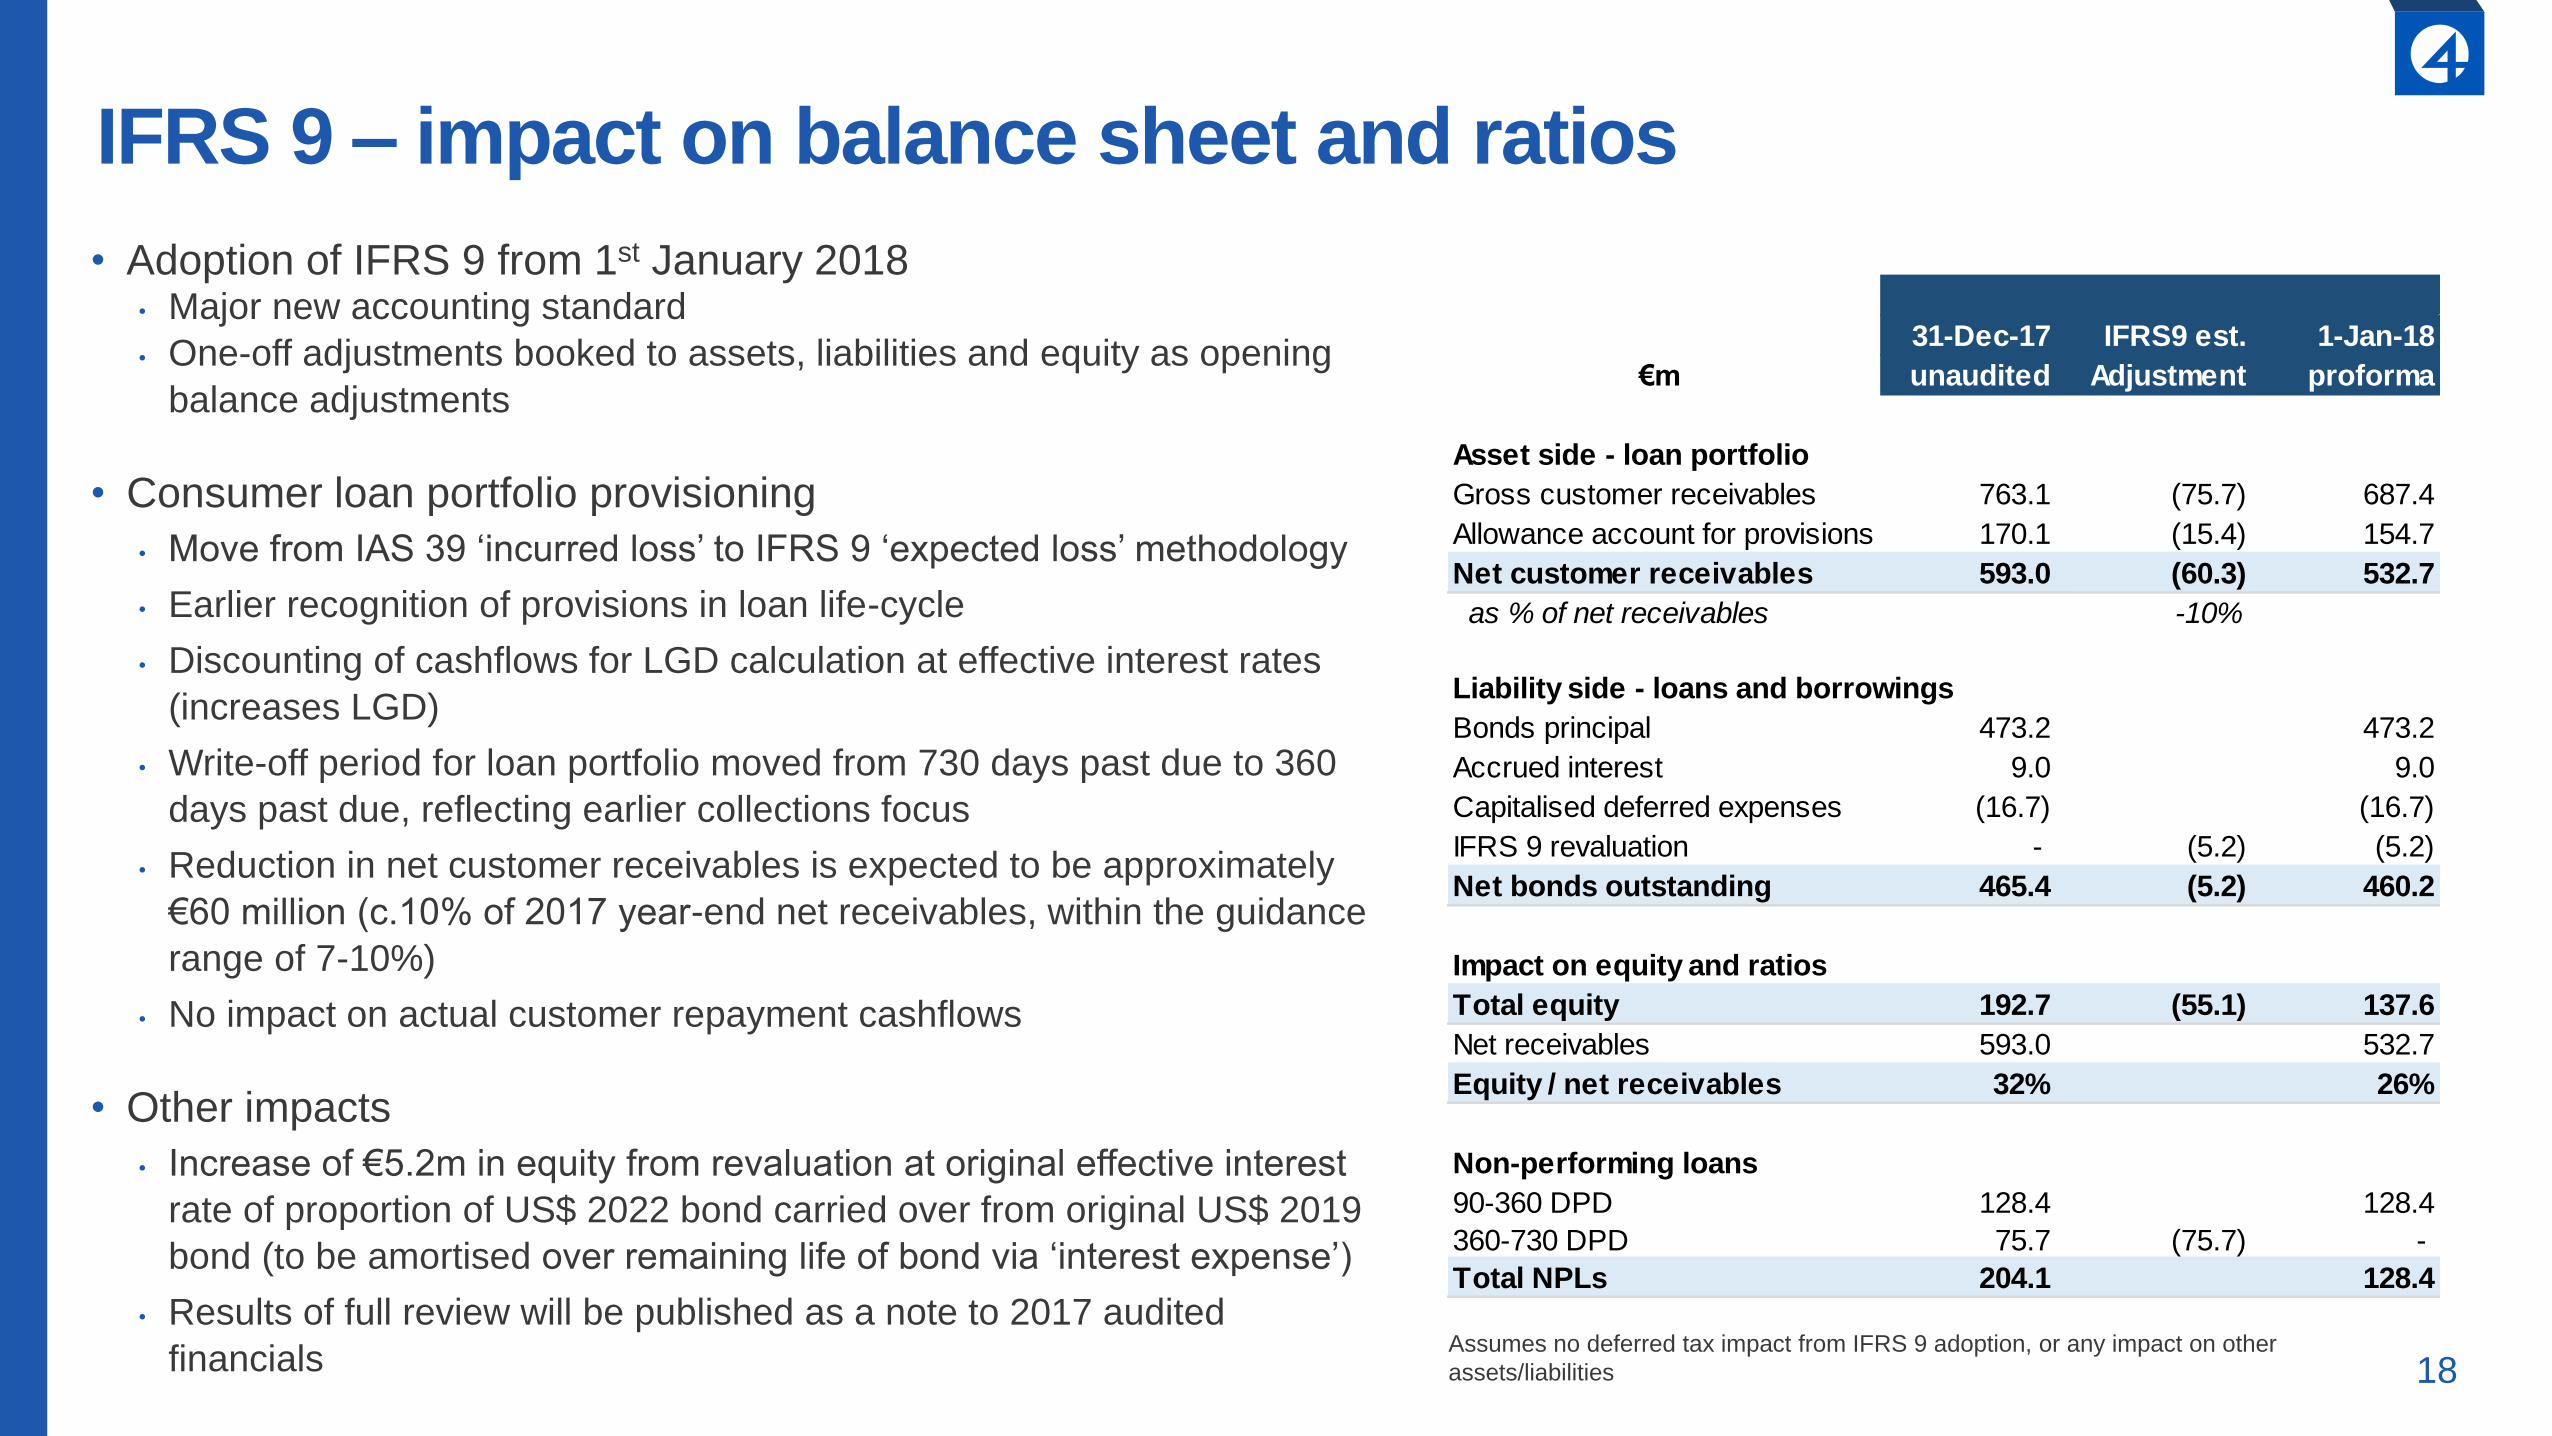
IFRS 9 – impact on balance sheet and ratios
• Adoption of IFRS 9 from 1st January 2018• Major new accounting standard
• One-off adjustments booked to assets, liabilities and equity as opening
balance adjustments
• Consumer loan portfolio provisioning
• Move from IAS 39 ‘incurred loss’ to IFRS 9 ‘expected loss’ methodology
• Earlier recognition of provisions in loan life-cycle
• Discounting of cashflows for LGD calculation at effective interest rates
(increases LGD)
• Write-off period for loan portfolio moved from 730 days past due to 360
days past due, reflecting earlier collections focus
• Reduction in net customer receivables is expected to be approximately
€60 million (c.10% of 2017 year-end net receivables, within the guidance
range of 7-10%)
• No impact on actual customer repayment cashflows
• Other impacts
• Increase of €5.2m in equity from revaluation at original effective interest
rate of proportion of US$ 2022 bond carried over from original US$ 2019
bond (to be amortised over remaining life of bond via ‘interest expense’)
• Results of full review will be published as a note to 2017 audited
financials
After adjustments
31-Dec-17 1-Jan-18
unaudited proforma
Asset side - loan portfolio
Gross customer receivables 763.1 (75.7) 687.4
Allowance account for provisions 170.1 (15.4) 154.7
Net customer receivables 593.0 (60.3) 532.7
as % of net receivables -10%
Liability side - loans and borrowings
Bonds principal 473.2 473.2
Accrued interest 9.0 9.0
Capitalised deferred expenses (16.7) (16.7)
IFRS 9 revaluation - (5.2) (5.2)
Net bonds outstanding 465.4 (5.2) 460.2
Impact on equity and ratios
Total equity 192.7 (55.1) 137.6
Net receivables 593.0 532.7
Equity / net receivables 32% 26%
Non-performing loans
90-360 DPD 128.4 128.4
360-730 DPD 75.7 (75.7) -
Total NPLs 204.1 128.4
€m
IFRS9 est.
Adjustment
Assumes no deferred tax impact from IFRS 9 adoption, or any impact on other
assets/liabilities
19
• The opportunity for 4finance is significant
• Clear mission and vision
• 4finance is uniquely positioned given existing scale and experience
• Twin track strategy: near term performance and foundation for the future
• Tough financial decisions taken in Q4 2017 put us in a more robust position for the future
• Addressed intangible assets and set appropriate 2018 policies
• Accelerating migration to new IT platform
• Strong operational momentum within the business
• Instalment loan and LatAm growth continues, with careful monitoring of risk metrics
• Pilots of next-generation products over next few months
• Partnership initiatives and funding projects to support future business growth
• Greater supervisory board involvement in strategic development and monitoring
Conclusion

20
Thank you and Questions

21
Appendix
22
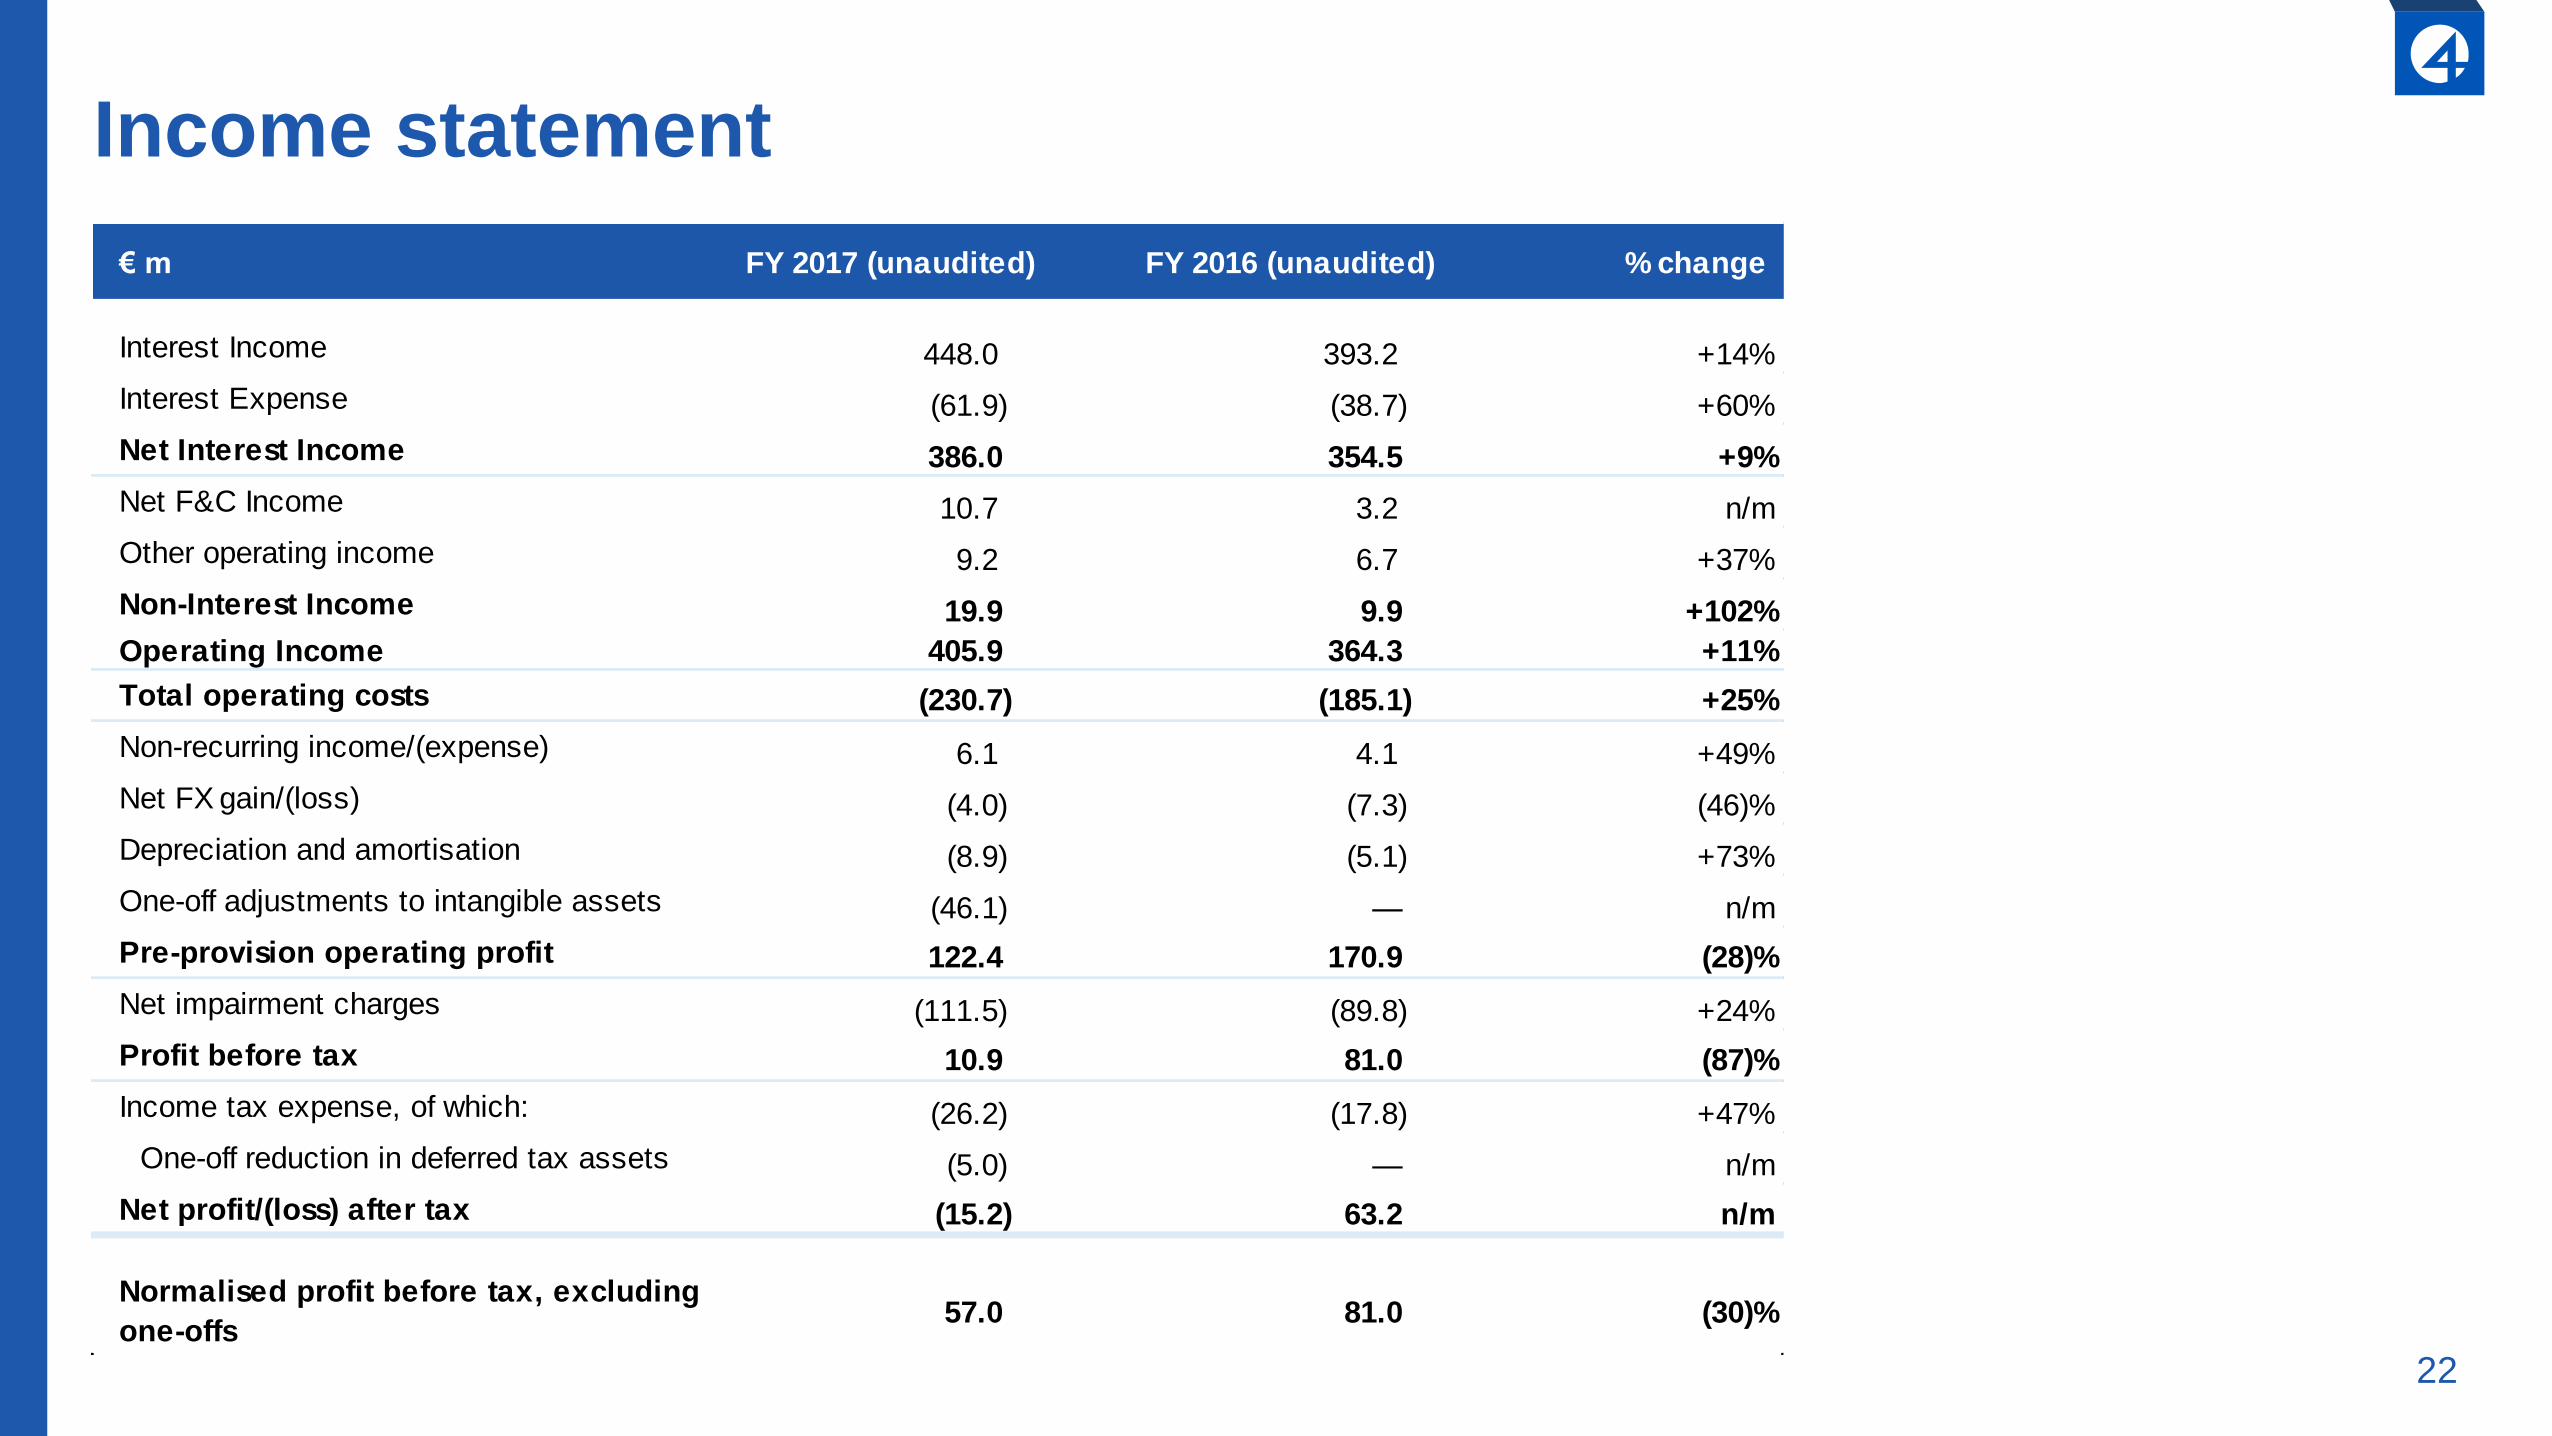
Income statement
€ m FY 2017 (unaudited) FY 2016 (unaudited) % change
Interest Income 448.0 393.2 +14%
Interest Expense (61.9) (38.7) +60%
Net Interest Income 386.0 354.5 +9%
Net F&C Income 10.7 3.2 n/m
Other operating income 9.2 6.7 +37%
Non-Interest Income 19.9 9.9 +102%
Operating Income 405.9 364.3 +11%
Total operating costs (230.7) (185.1) +25%
Non-recurring income/(expense) 6.1 4.1 +49%
Net FX gain/(loss) (4.0) (7.3) (46)%
Depreciation and amortisation (8.9) (5.1) +73%
One-off adjustments to intangible assets (46.1) — n/m
Pre-provision operating profit 122.4 170.9 (28)%
Net impairment charges (111.5) (89.8) +24%
Profit before tax 10.9 81.0 (87)%
Income tax expense, of which: (26.2) (17.8) +47%
One-off reduction in deferred tax assets (5.0) — n/m
Net profit/(loss) after tax (15.2) 63.2 n/m
Normalised profit before tax, excluding
one-offs57.0 81.0 (30)%
23
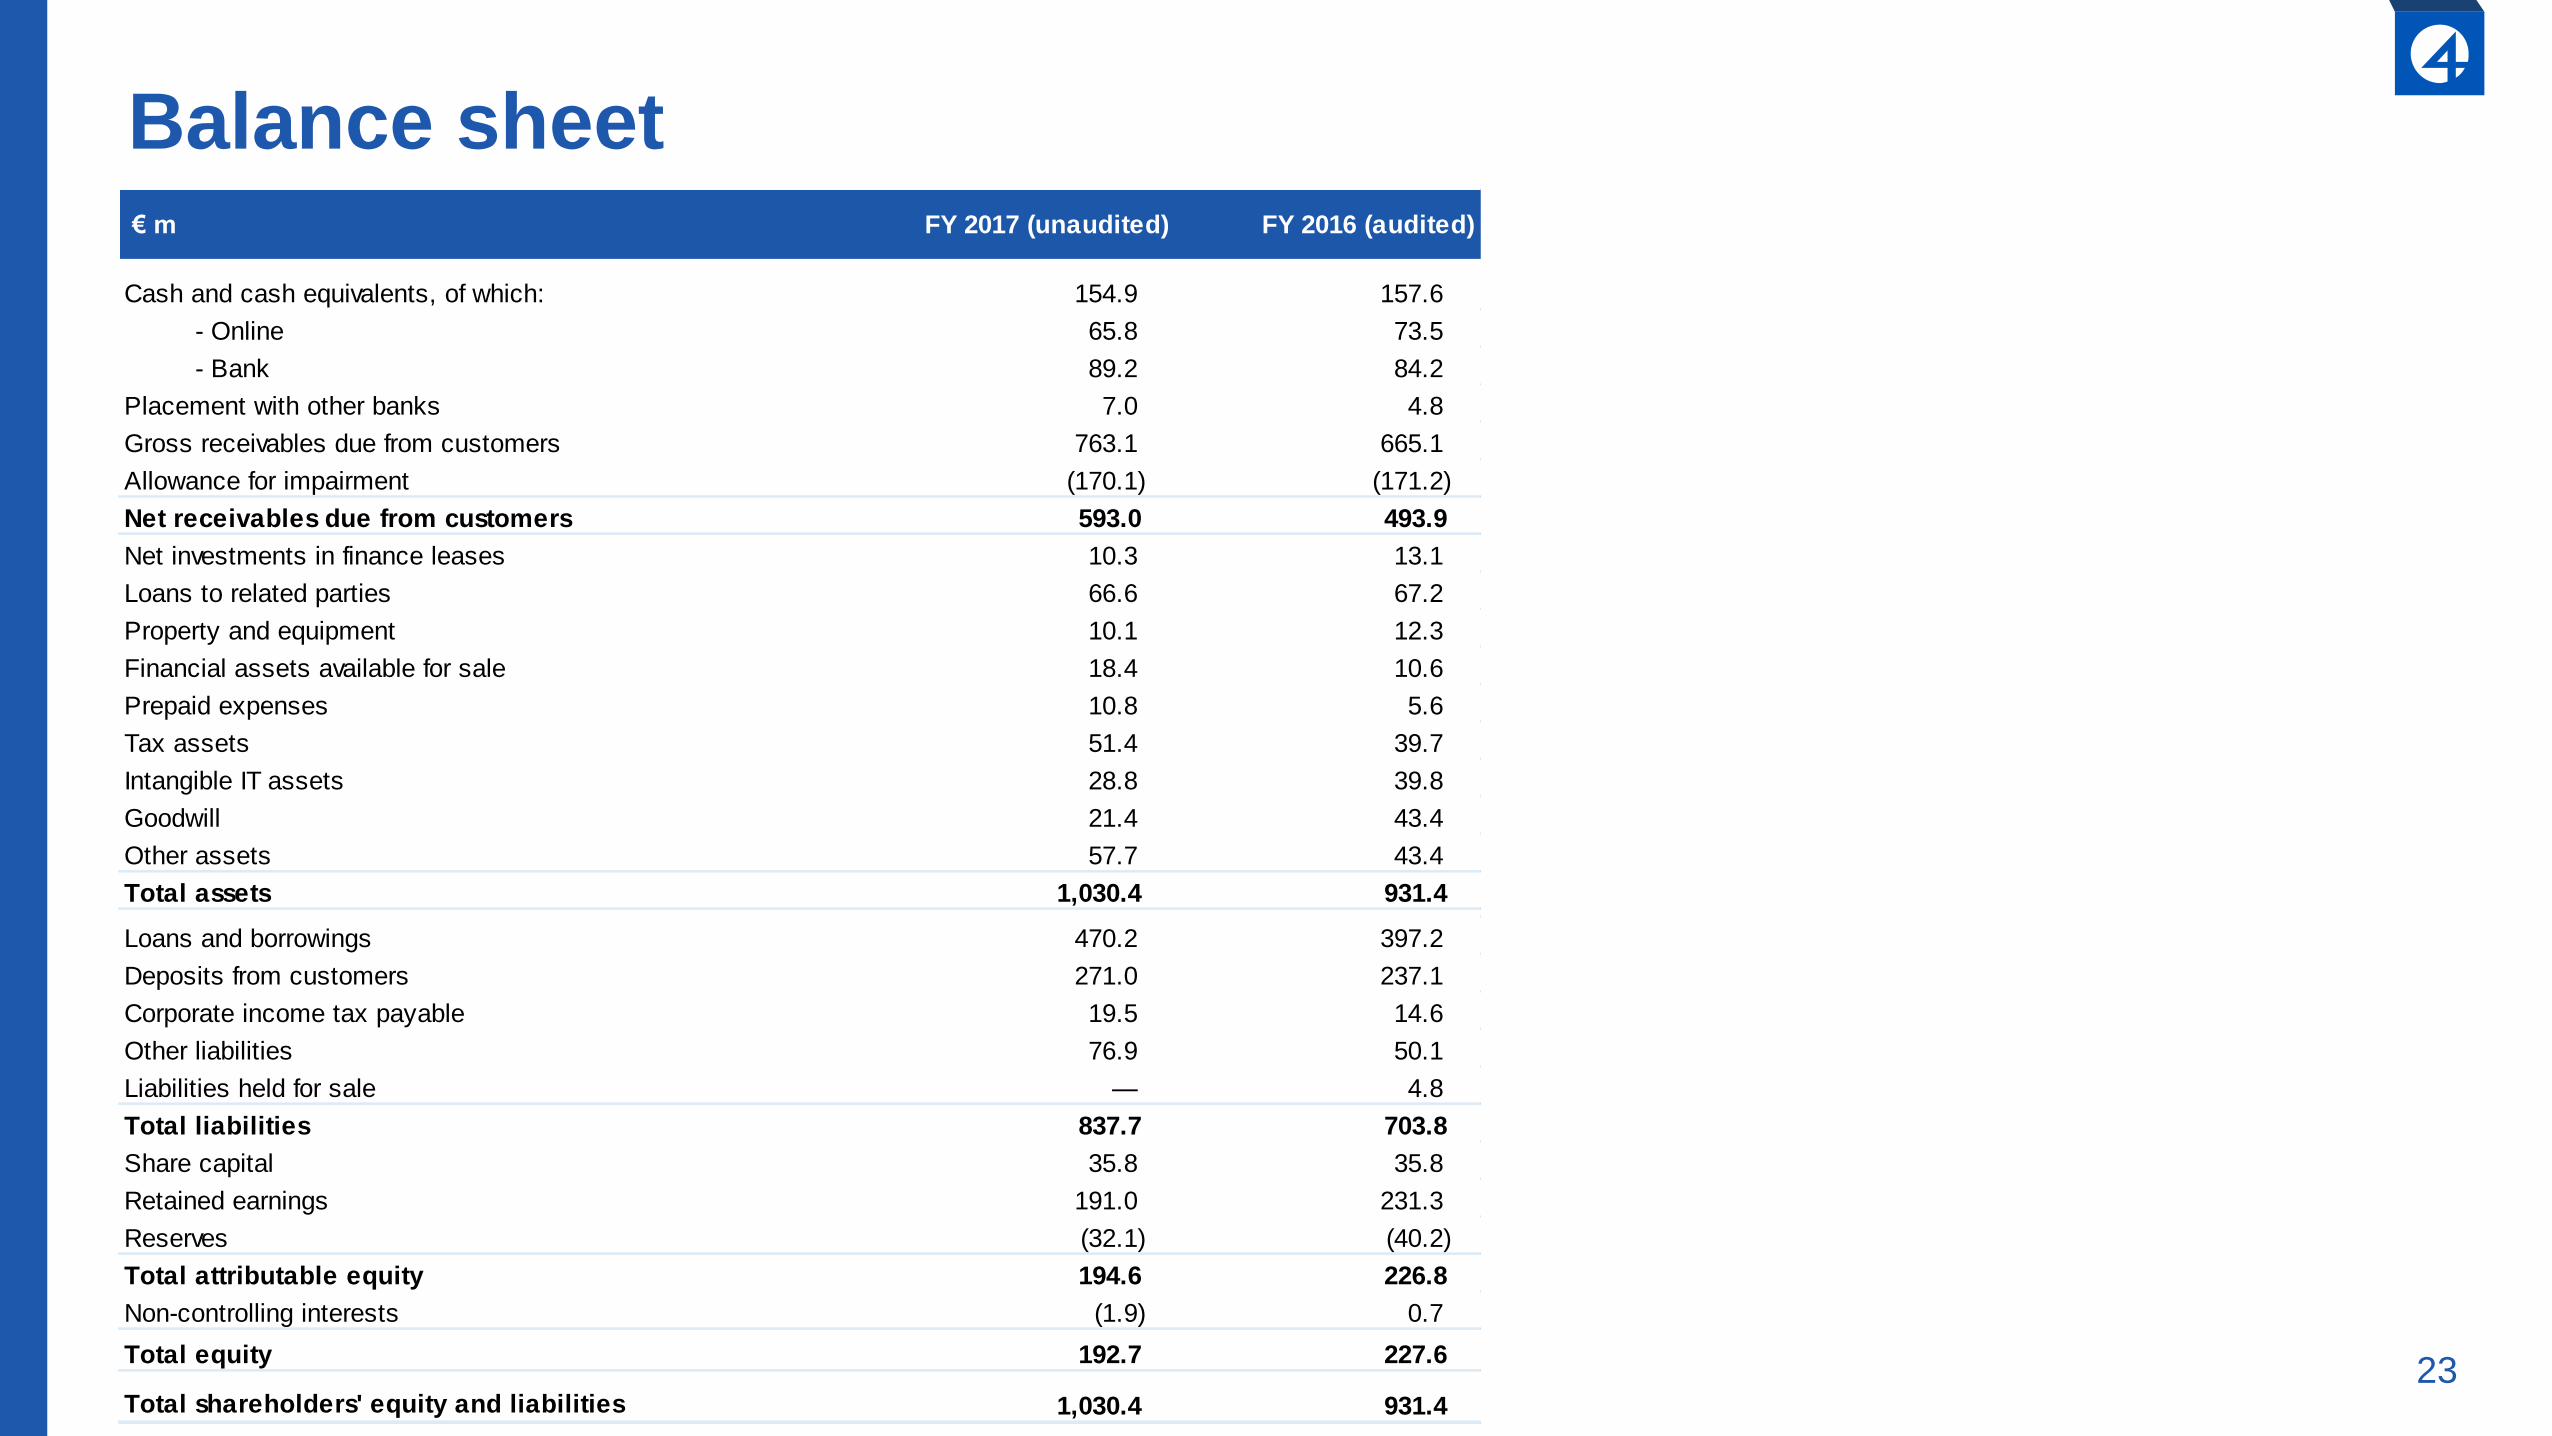
Balance sheet€ m FY 2017 (unaudited) FY 2016 (audited)
Cash and cash equivalents, of which: 154.9 157.6
- Online 65.8 73.5
- Bank 89.2 84.2
Placement with other banks 7.0 4.8
Gross receivables due from customers 763.1 665.1
Allowance for impairment (170.1) (171.2)
Net receivables due from customers 593.0 493.9
Net investments in finance leases 10.3 13.1
Loans to related parties 66.6 67.2
Property and equipment 10.1 12.3
Financial assets available for sale 18.4 10.6
Prepaid expenses 10.8 5.6
Tax assets 51.4 39.7
Intangible IT assets 28.8 39.8
Goodwill 21.4 43.4
Other assets 57.7 43.4
Total assets 1,030.4 931.4Calculation for Presentation - other assets (not loans or cash) 698.3 597.8
Loans and borrowings 470.2 397.2
Deposits from customers 271.0 237.1
Corporate income tax payable 19.5 14.6
Other liabilities 76.9 50.1
Liabilities held for sale — 4.8
Total liabilities 837.7 703.8
Share capital 35.8 35.8
Retained earnings 191.0 231.3
Reserves (32.1) (40.2)
Total attributable equity 194.6 226.8
Non-controlling interests (1.9) 0.7
Total equity 192.7 227.6
Total shareholders' equity and liabilities 1,030.4 931.4
24
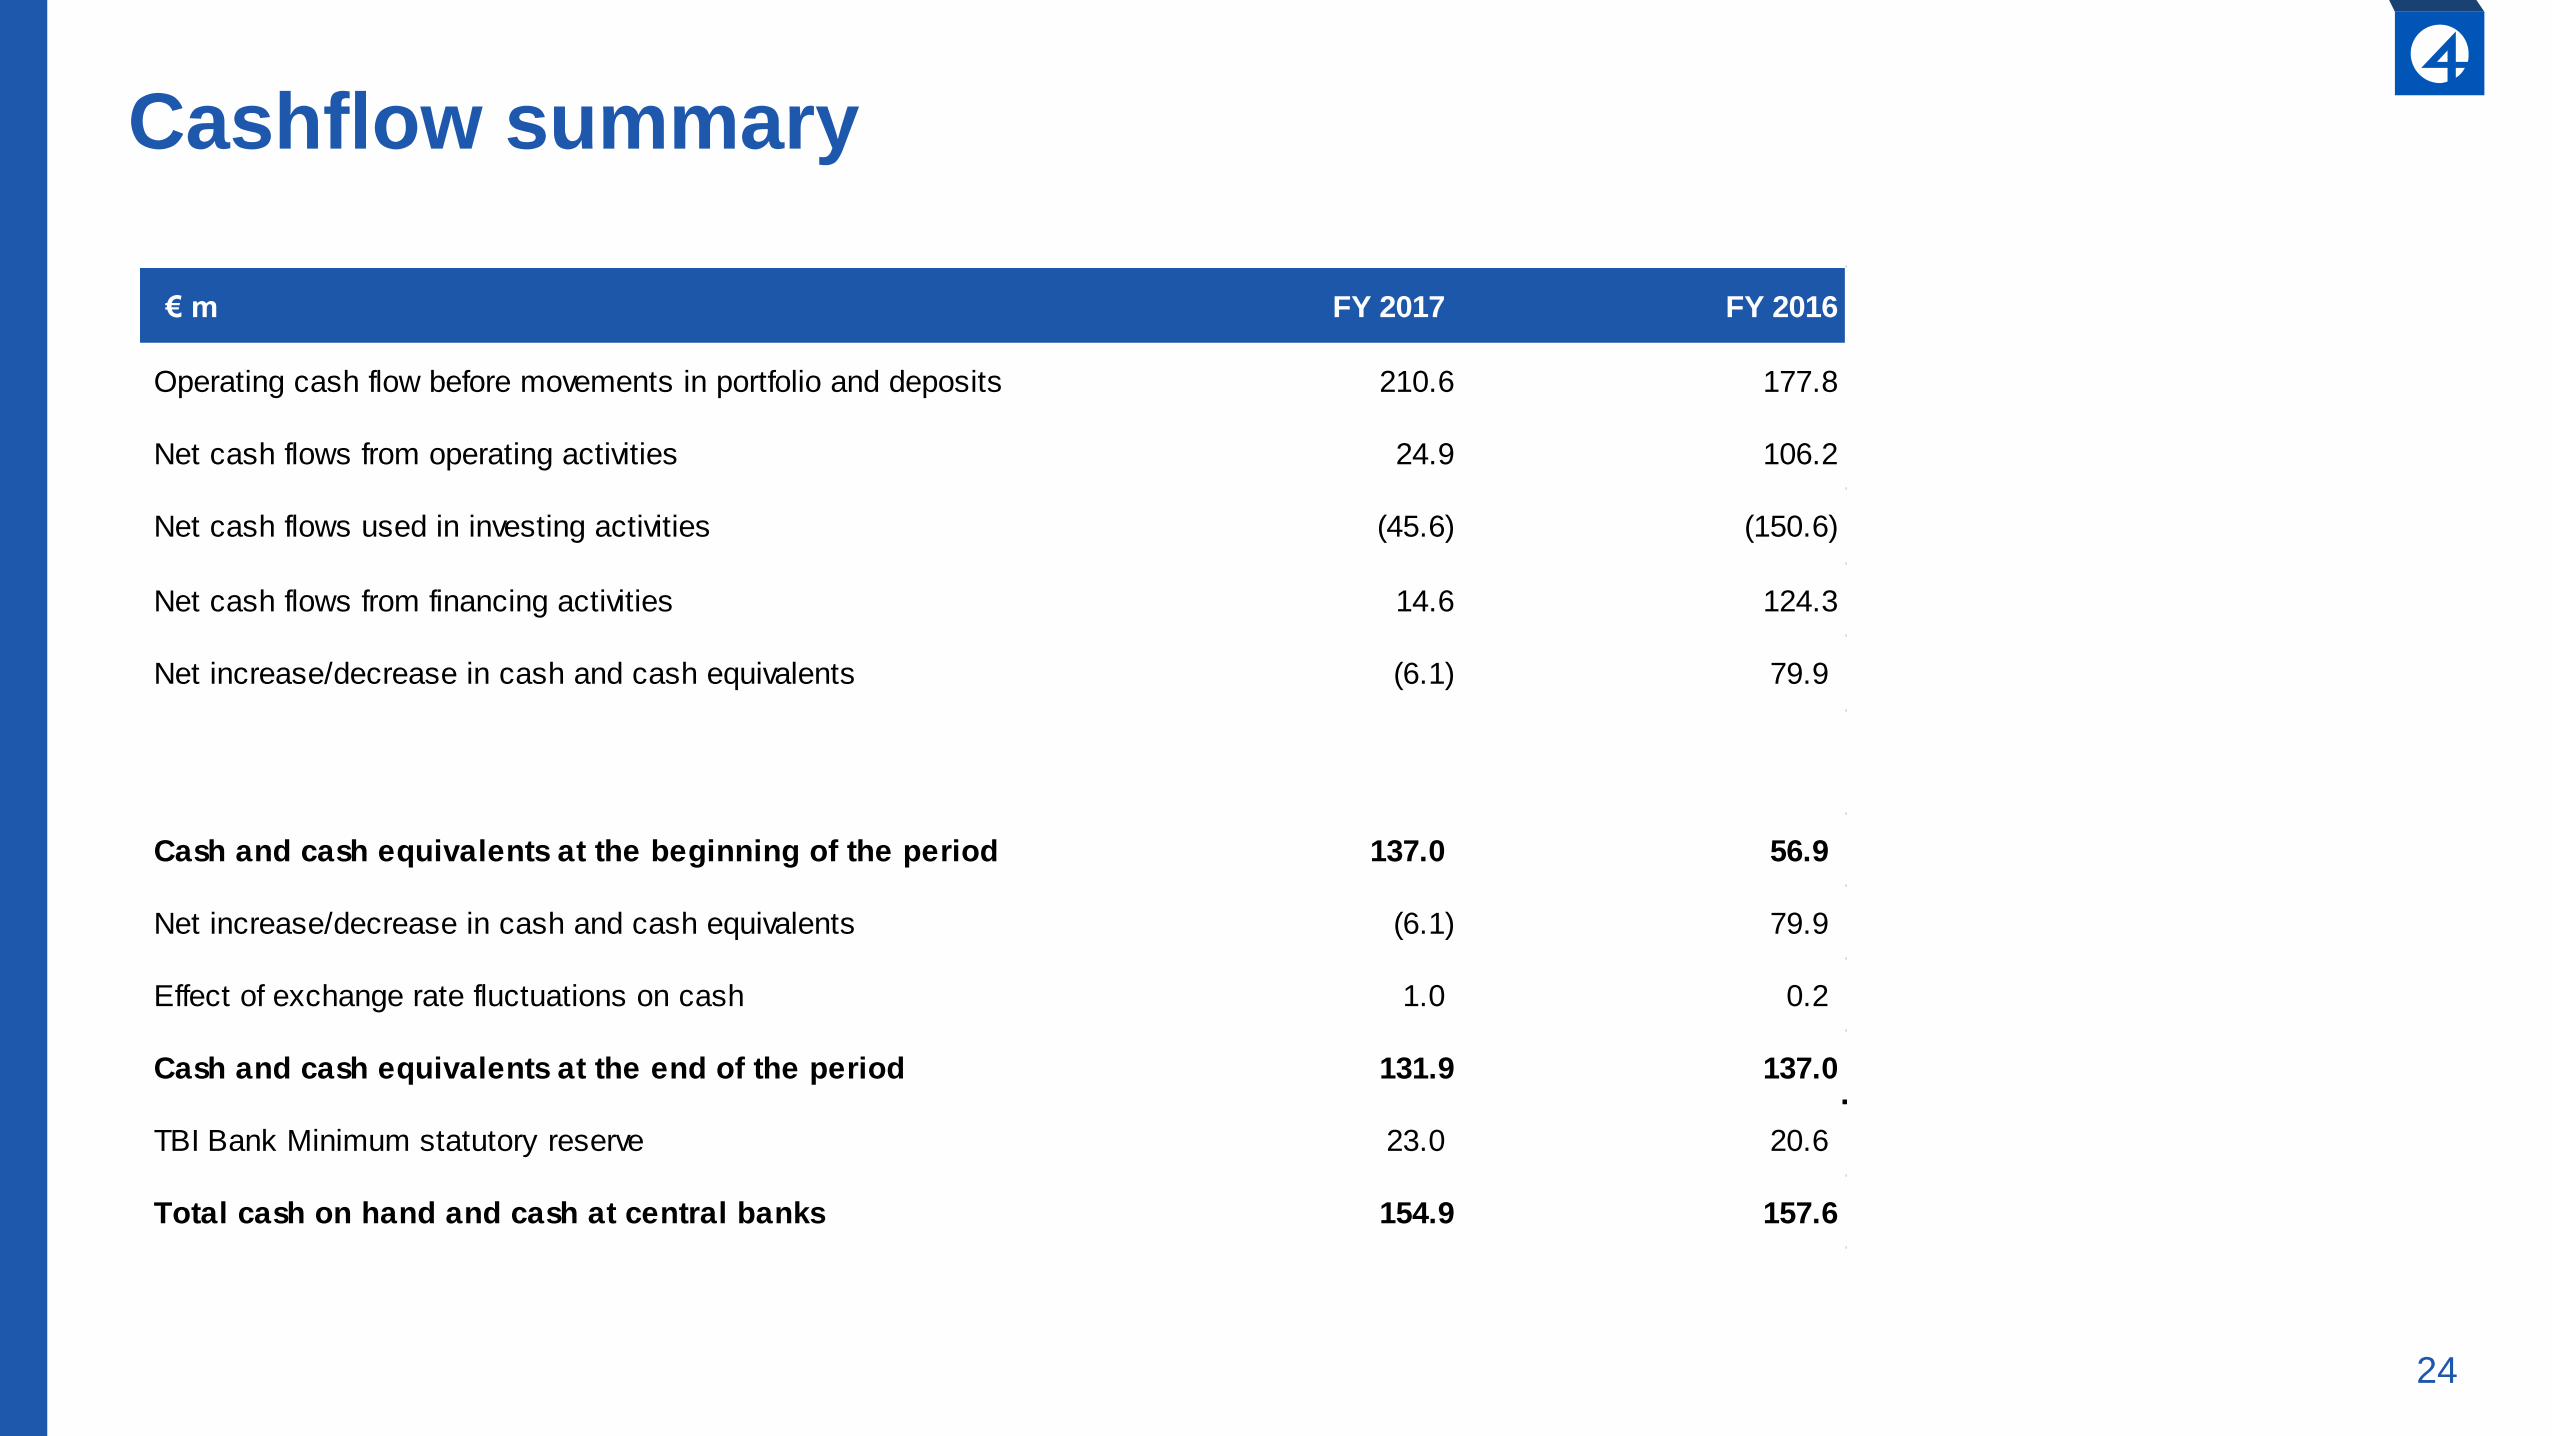
Cashflow summary
€ m FY 2017 FY 2016
Operating cash flow before movements in portfolio and deposits 210.6 177.8
Net cash flows from operating activities 24.9 106.2
Net cash flows used in investing activities (45.6) (150.6)
Net cash flows from financing activities 14.6 124.3
Net increase/decrease in cash and cash equivalents (6.1) 79.9
Cash and cash equivalents at the beginning of the period 137.0 56.9
Net increase/decrease in cash and cash equivalents (6.1) 79.9
Effect of exchange rate fluctuations on cash 1.0 0.2
Cash and cash equivalents at the end of the period 131.9 137.0
TBI Bank Minimum statutory reserve 23.0 20.6
Total cash on hand and cash at central banks 154.9 157.6
25
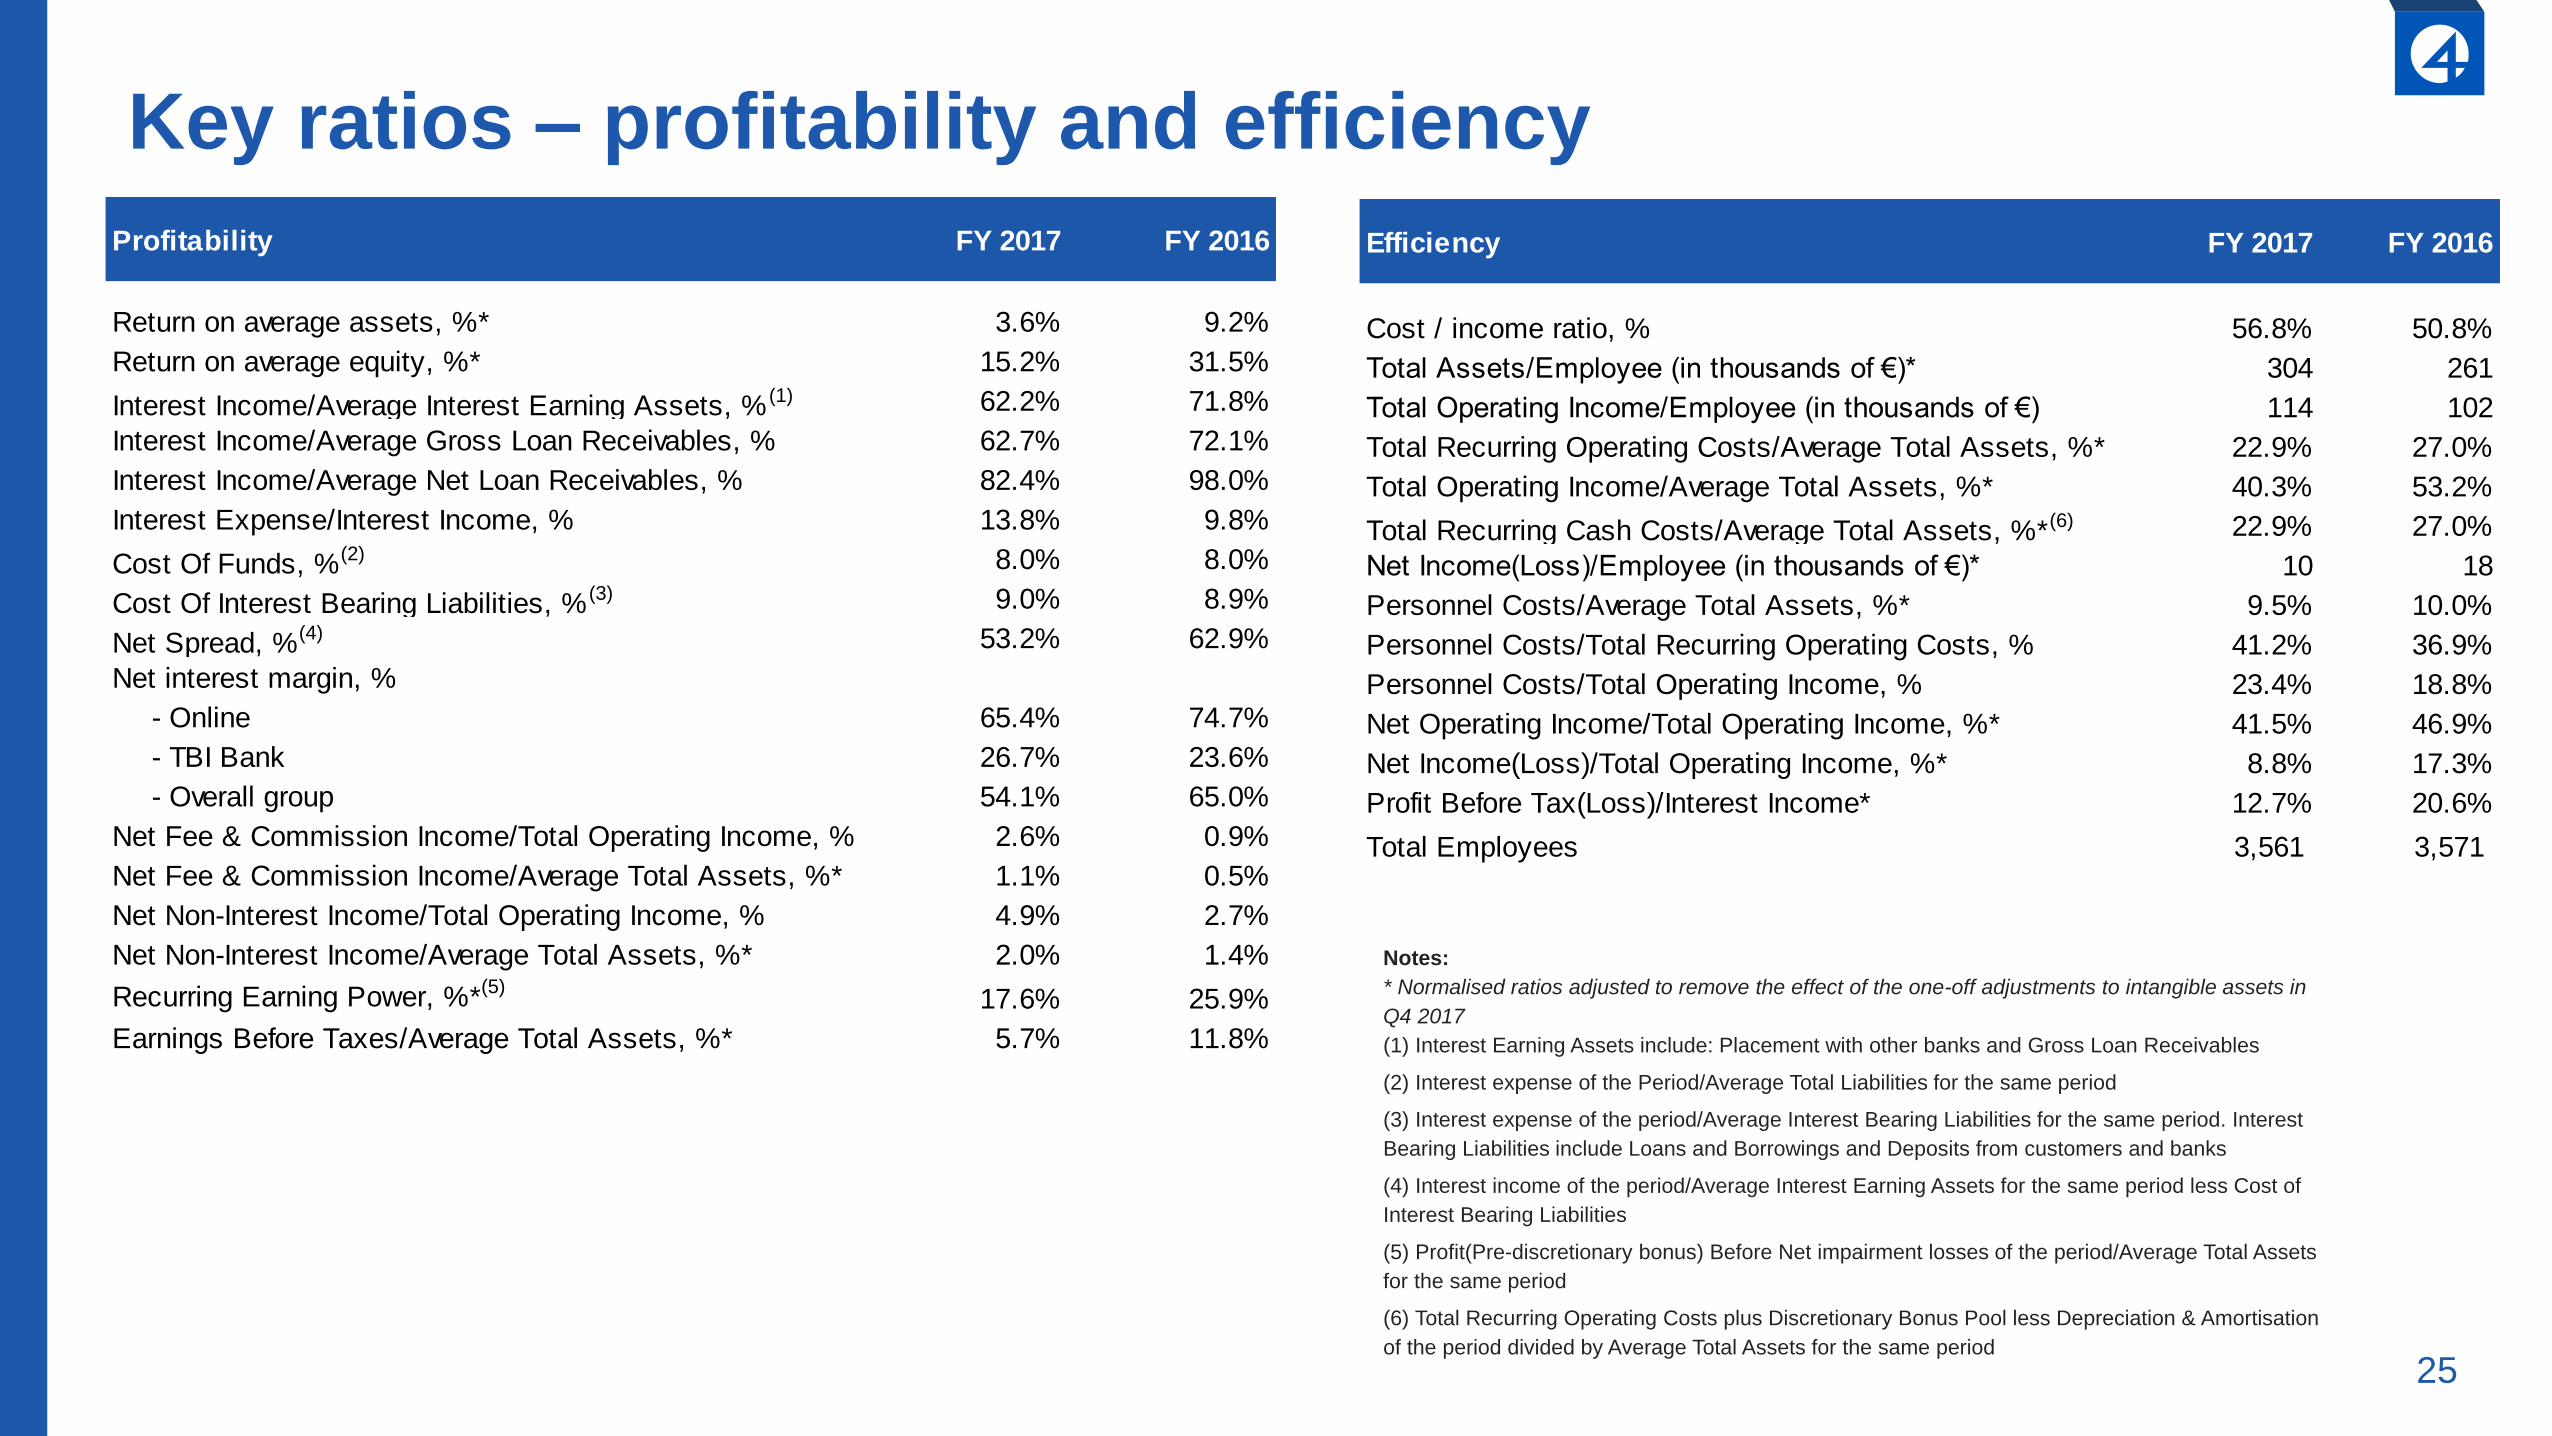
Key ratios – profitability and efficiency
Profitability FY 2017 FY 2016
Return on average assets, %* 3.6% 9.2%
Return on average equity, %* 15.2% 31.5%
Interest Income/Average Interest Earning Assets, % (1) 62.2% 71.8%
Interest Income/Average Gross Loan Receivables, % 62.7% 72.1%
Interest Income/Average Net Loan Receivables, % 82.4% 98.0%
Interest Expense/Interest Income, % 13.8% 9.8%
Cost Of Funds, %(2) 8.0% 8.0%
Cost Of Interest Bearing Liabilities, % (3) 9.0% 8.9%
Net Spread, %(4) 53.2% 62.9%
Net interest margin, %
- Online 65.4% 74.7%
- TBI Bank 26.7% 23.6%
- Overall group 54.1% 65.0%
Net Fee & Commission Income/Total Operating Income, % 2.6% 0.9%
Net Fee & Commission Income/Average Total Assets, %* 1.1% 0.5%
Net Non-Interest Income/Total Operating Income, % 4.9% 2.7%
Net Non-Interest Income/Average Total Assets, %* 2.0% 1.4%
Recurring Earning Power, %*(5)17.6% 25.9%
Earnings Before Taxes/Average Total Assets, %* 5.7% 11.8%
Efficiency FY 2017 FY 2016
Cost / income ratio, % 56.8% 50.8%
Total Assets/Employee (in thousands of €)* 304 261
Total Operating Income/Employee (in thousands of €) 114 102
Total Recurring Operating Costs/Average Total Assets, %* 22.9% 27.0%
Total Operating Income/Average Total Assets, %* 40.3% 53.2%
Total Recurring Cash Costs/Average Total Assets, %*(6) 22.9% 27.0%
Net Income(Loss)/Employee (in thousands of €)* 10 18
Personnel Costs/Average Total Assets, %* 9.5% 10.0%
Personnel Costs/Total Recurring Operating Costs, % 41.2% 36.9%
Personnel Costs/Total Operating Income, % 23.4% 18.8%
Net Operating Income/Total Operating Income, %* 41.5% 46.9%
Net Income(Loss)/Total Operating Income, %* 8.8% 17.3%
Profit Before Tax(Loss)/Interest Income* 12.7% 20.6%
Total Employees 3,561 3,571
Notes:
* Normalised ratios adjusted to remove the effect of the one-off adjustments to intangible assets in
Q4 2017
(1) Interest Earning Assets include: Placement with other banks and Gross Loan Receivables
(2) Interest expense of the Period/Average Total Liabilities for the same period
(3) Interest expense of the period/Average Interest Bearing Liabilities for the same period. Interest
Bearing Liabilities include Loans and Borrowings and Deposits from customers and banks
(4) Interest income of the period/Average Interest Earning Assets for the same period less Cost of
Interest Bearing Liabilities
(5) Profit(Pre-discretionary bonus) Before Net impairment losses of the period/Average Total Assets
for the same period
(6) Total Recurring Operating Costs plus Discretionary Bonus Pool less Depreciation & Amortisation
of the period divided by Average Total Assets for the same period
26
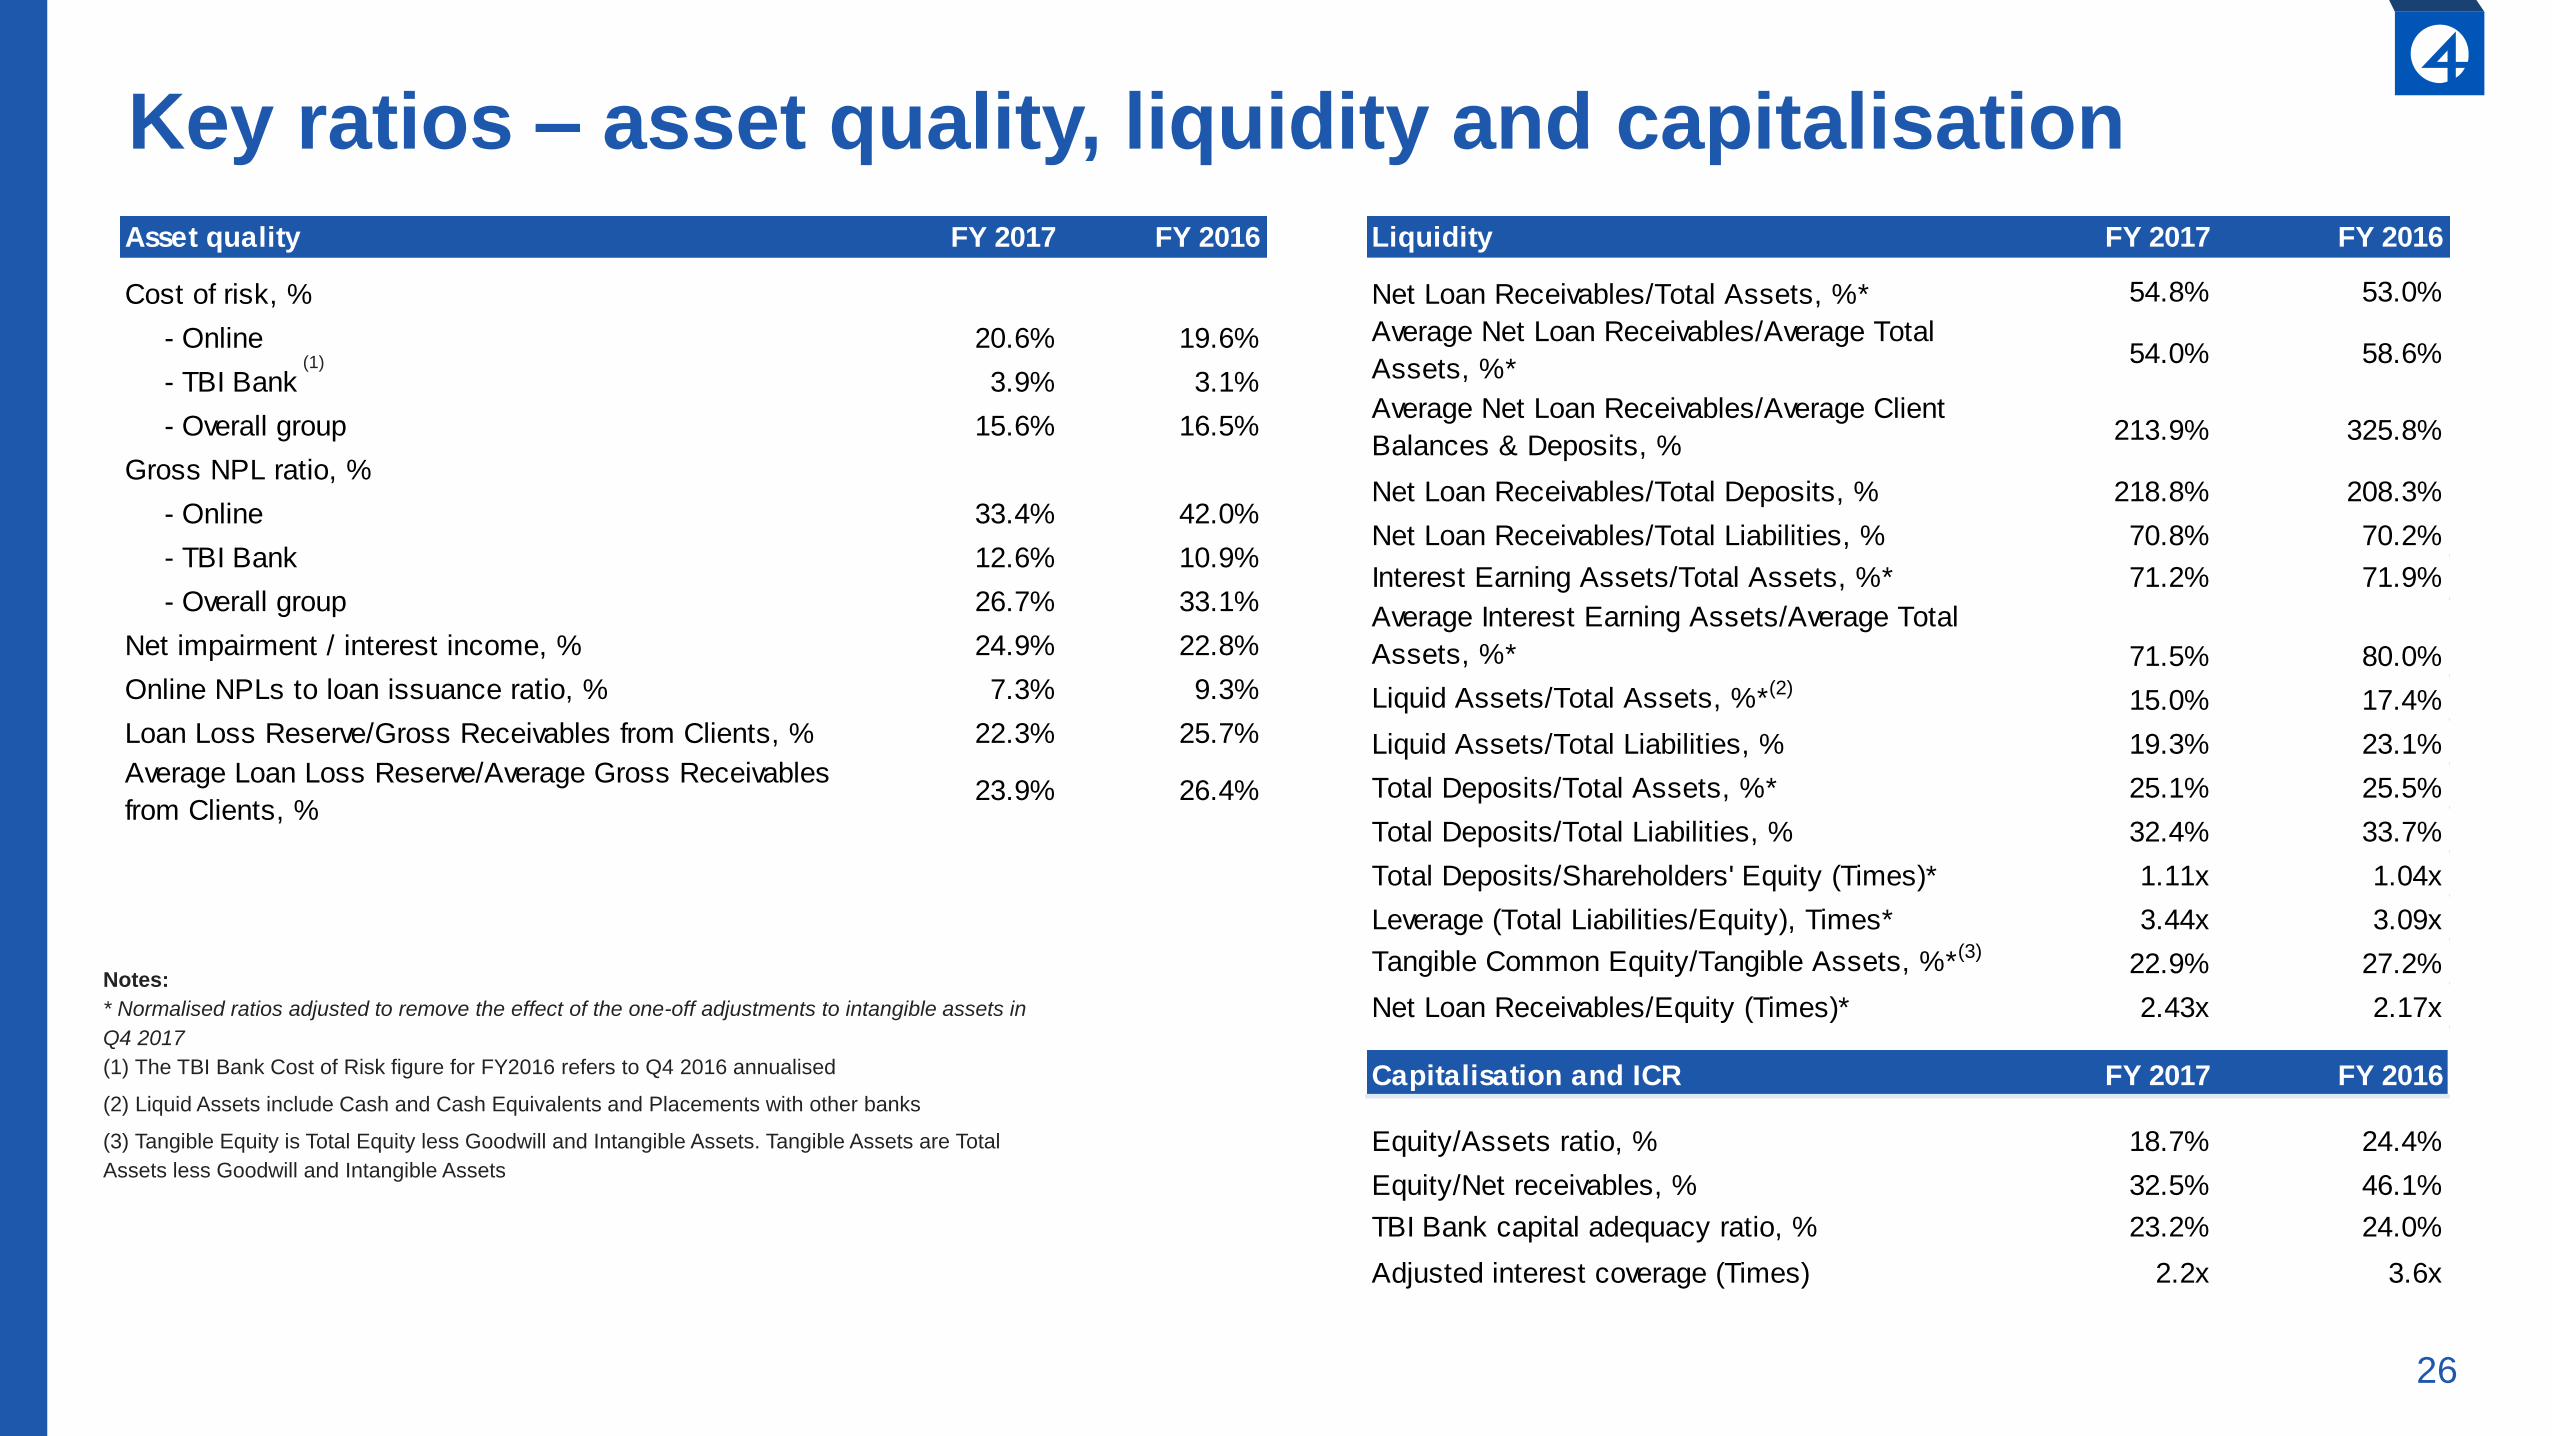
Key ratios – asset quality, liquidity and capitalisation
Asset quality FY 2017 FY 2016
Cost of risk, %
- Online 20.6% 19.6%
- TBI Bank 3.9% 3.1%
- Overall group 15.6% 16.5%
Gross NPL ratio, %
- Online 33.4% 42.0%
- TBI Bank 12.6% 10.9%
- Overall group 26.7% 33.1%
Net impairment / interest income, % 24.9% 22.8%
Online NPLs to loan issuance ratio, % 7.3% 9.3%
Loan Loss Reserve/Gross Receivables from Clients, % 22.3% 25.7%
Average Loan Loss Reserve/Average Gross Receivables
from Clients, %23.9% 26.4%
(1)
Liquidity FY 2017 FY 2016
Net Loan Receivables/Total Assets, %* 54.8% 53.0%
Average Net Loan Receivables/Average Total
Assets, %*54.0% 58.6%
Average Net Loan Receivables/Average Client
Balances & Deposits, %213.9% 325.8%
Net Loan Receivables/Total Deposits, % 218.8% 208.3%
Net Loan Receivables/Total Liabilities, % 70.8% 70.2%
Interest Earning Assets/Total Assets, %* 71.2% 71.9%
Average Interest Earning Assets/Average Total
Assets, %* 71.5% 80.0%
Liquid Assets/Total Assets, %*(2)15.0% 17.4%
Liquid Assets/Total Liabilities, % 19.3% 23.1%
Total Deposits/Total Assets, %* 25.1% 25.5%
Total Deposits/Total Liabilities, % 32.4% 33.7%
Total Deposits/Shareholders' Equity (Times)* 1.11x 1.04x
Leverage (Total Liabilities/Equity), Times* 3.44x 3.09x
Tangible Common Equity/Tangible Assets, %*(3)22.9% 27.2%
Net Loan Receivables/Equity (Times)* 2.43x 2.17x
Capitalisation and ICR FY 2017 FY 2016
Equity/Assets ratio, % 18.7% 24.4%
Equity/Net receivables, % 32.5% 46.1%
TBI Bank capital adequacy ratio, % 23.2% 24.0%
Adjusted interest coverage (Times) 2.2x 3.6x
Notes:
* Normalised ratios adjusted to remove the effect of the one-off adjustments to intangible assets in
Q4 2017
(1) The TBI Bank Cost of Risk figure for FY2016 refers to Q4 2016 annualised
(2) Liquid Assets include Cash and Cash Equivalents and Placements with other banks
(3) Tangible Equity is Total Equity less Goodwill and Intangible Assets. Tangible Assets are Total
Assets less Goodwill and Intangible Assets
27
€2,373m€2,200m
€173m
Loans issued 10/2015-09/2017(730 days)
NPLs as of 31/12/2017 Repaid and performing loans31/12/2017
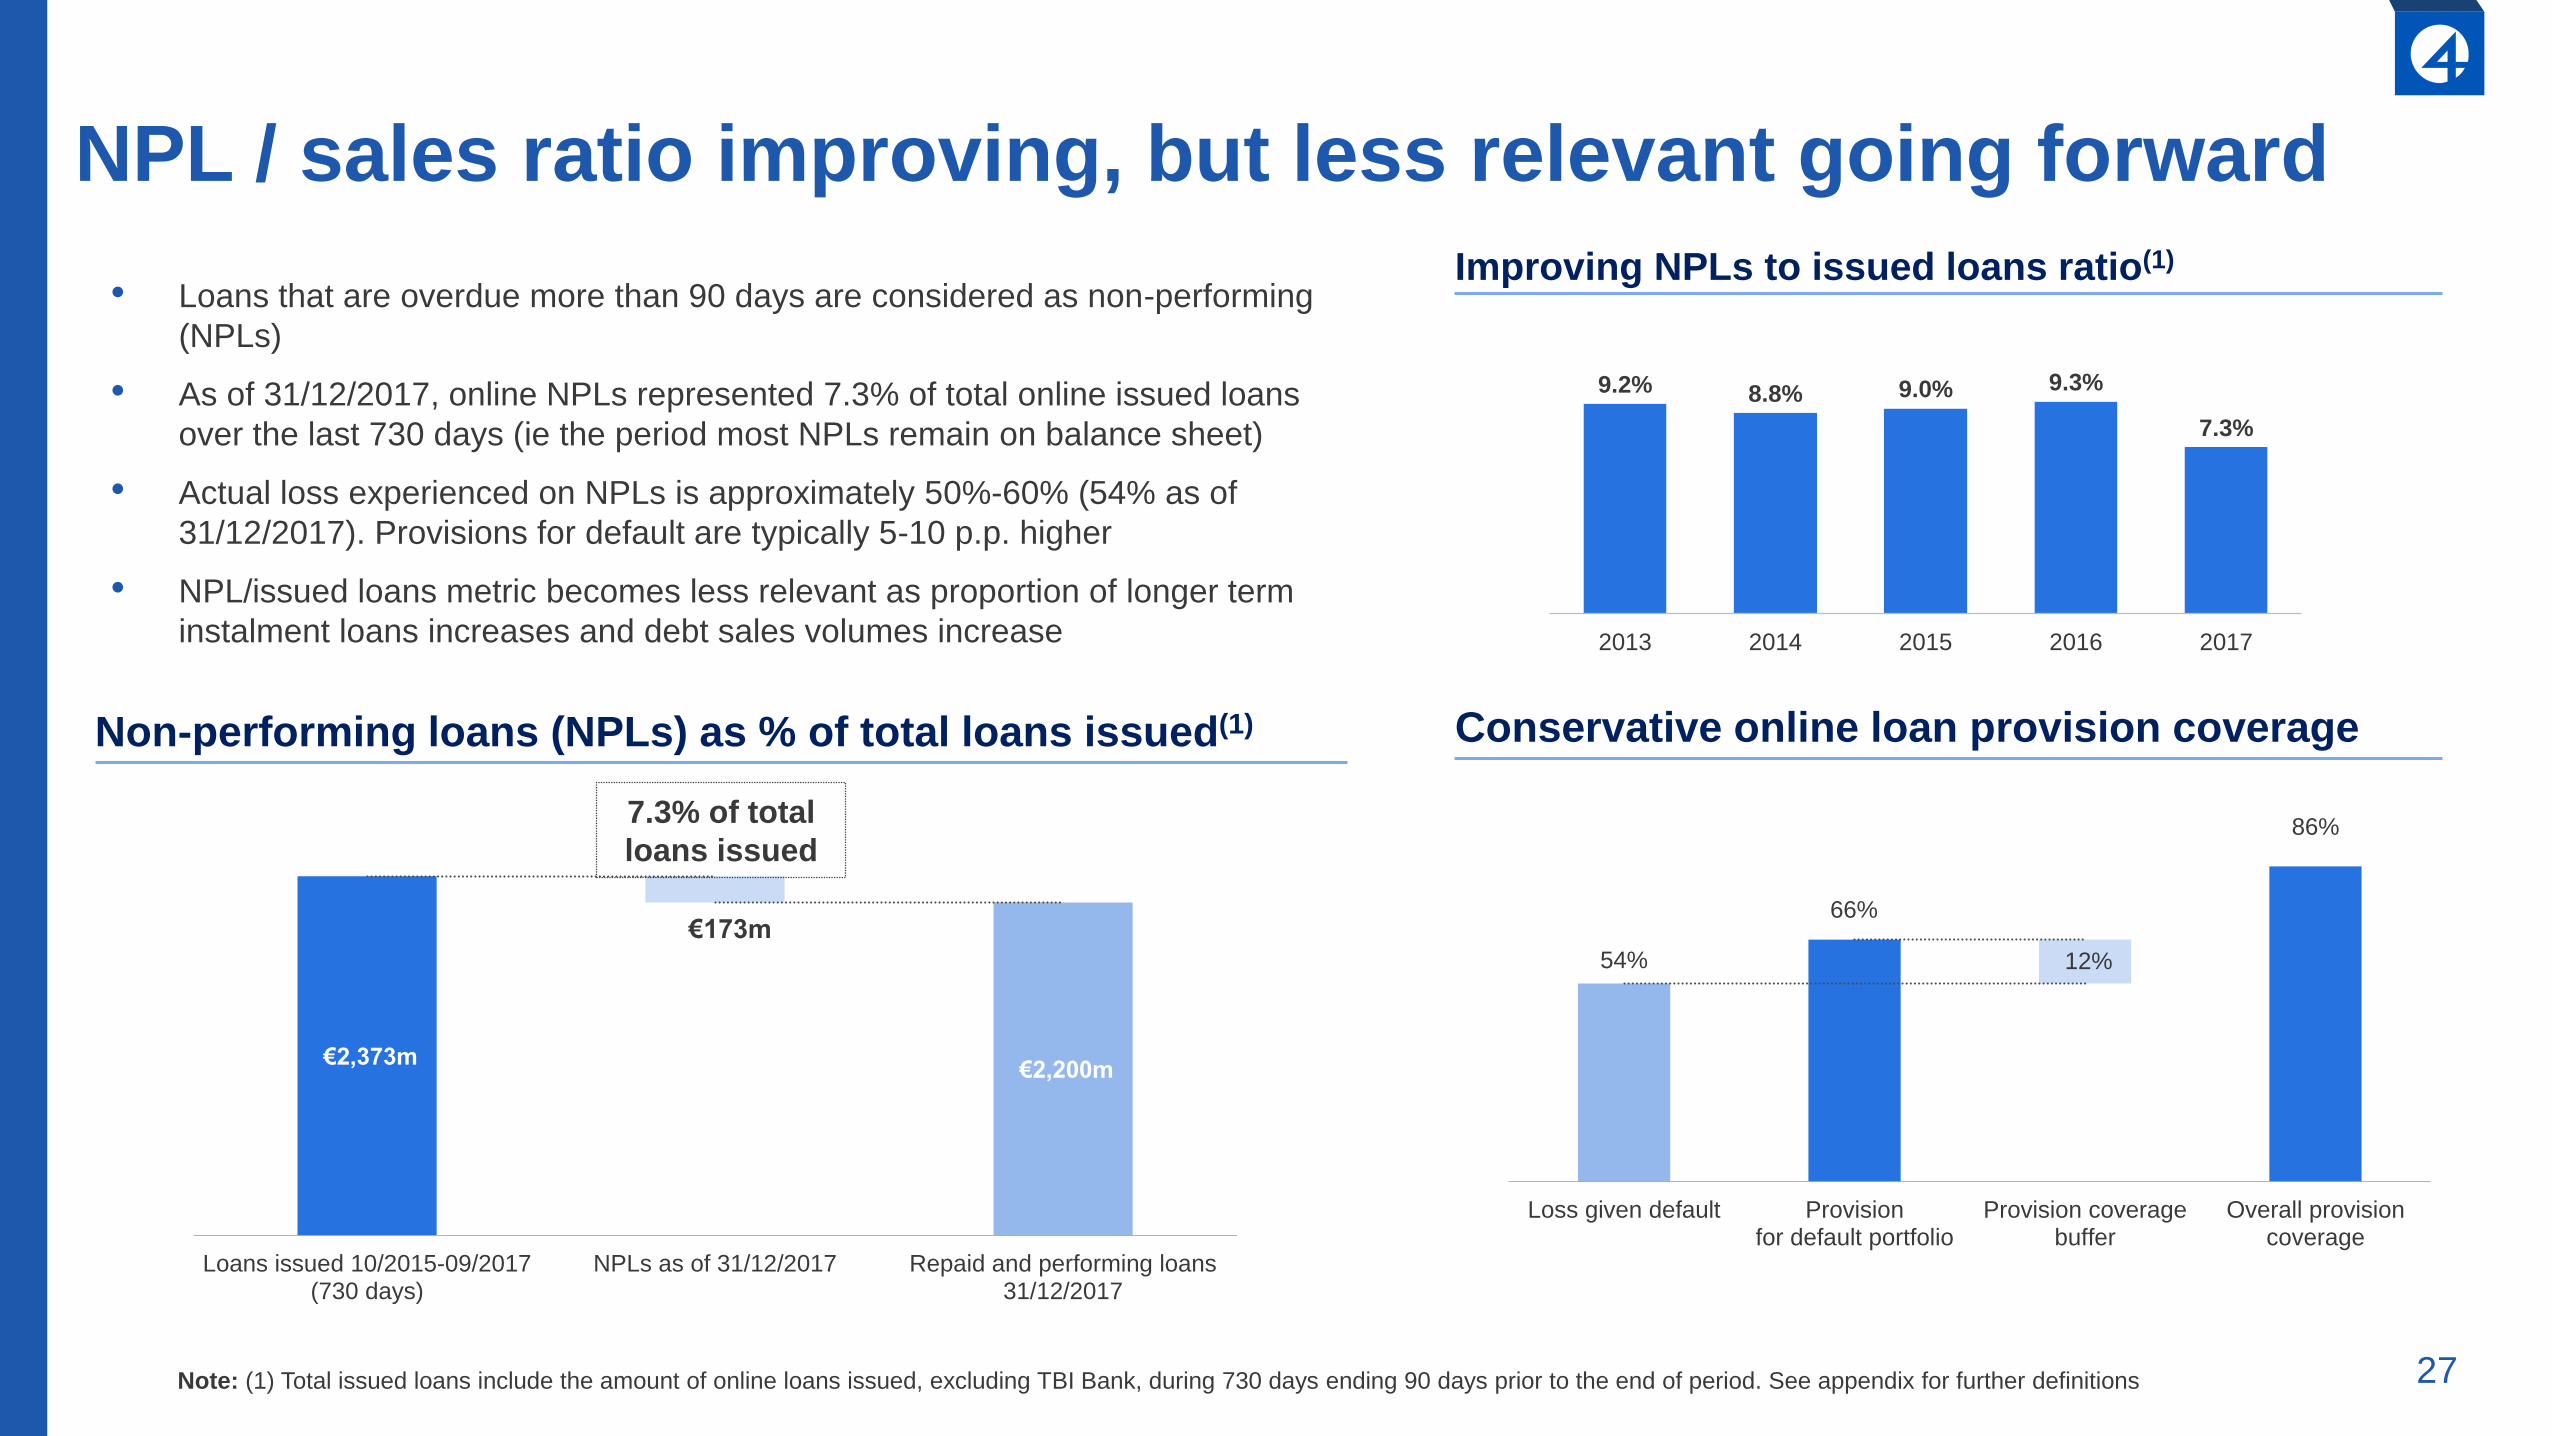
NPL / sales ratio improving, but less relevant going forward
Conservative online loan provision coverageNon-performing loans (NPLs) as % of total loans issued(1)
7.3% of total
loans issued
Improving NPLs to issued loans ratio(1)
9.2% 8.8% 9.0% 9.3%
7.3%
2013 2014 2015 2016 2017
• Loans that are overdue more than 90 days are considered as non-performing
(NPLs)
• As of 31/12/2017, online NPLs represented 7.3% of total online issued loans
over the last 730 days (ie the period most NPLs remain on balance sheet)
• Actual loss experienced on NPLs is approximately 50%-60% (54% as of
31/12/2017). Provisions for default are typically 5-10 p.p. higher
• NPL/issued loans metric becomes less relevant as proportion of longer term
instalment loans increases and debt sales volumes increase
Note: (1) Total issued loans include the amount of online loans issued, excluding TBI Bank, during 730 days ending 90 days prior to the end of period. See appendix for further definitions
54%
66%
86%
12%
Loss given default Provisionfor default portfolio
Provision coveragebuffer
Overall provisioncoverage
28
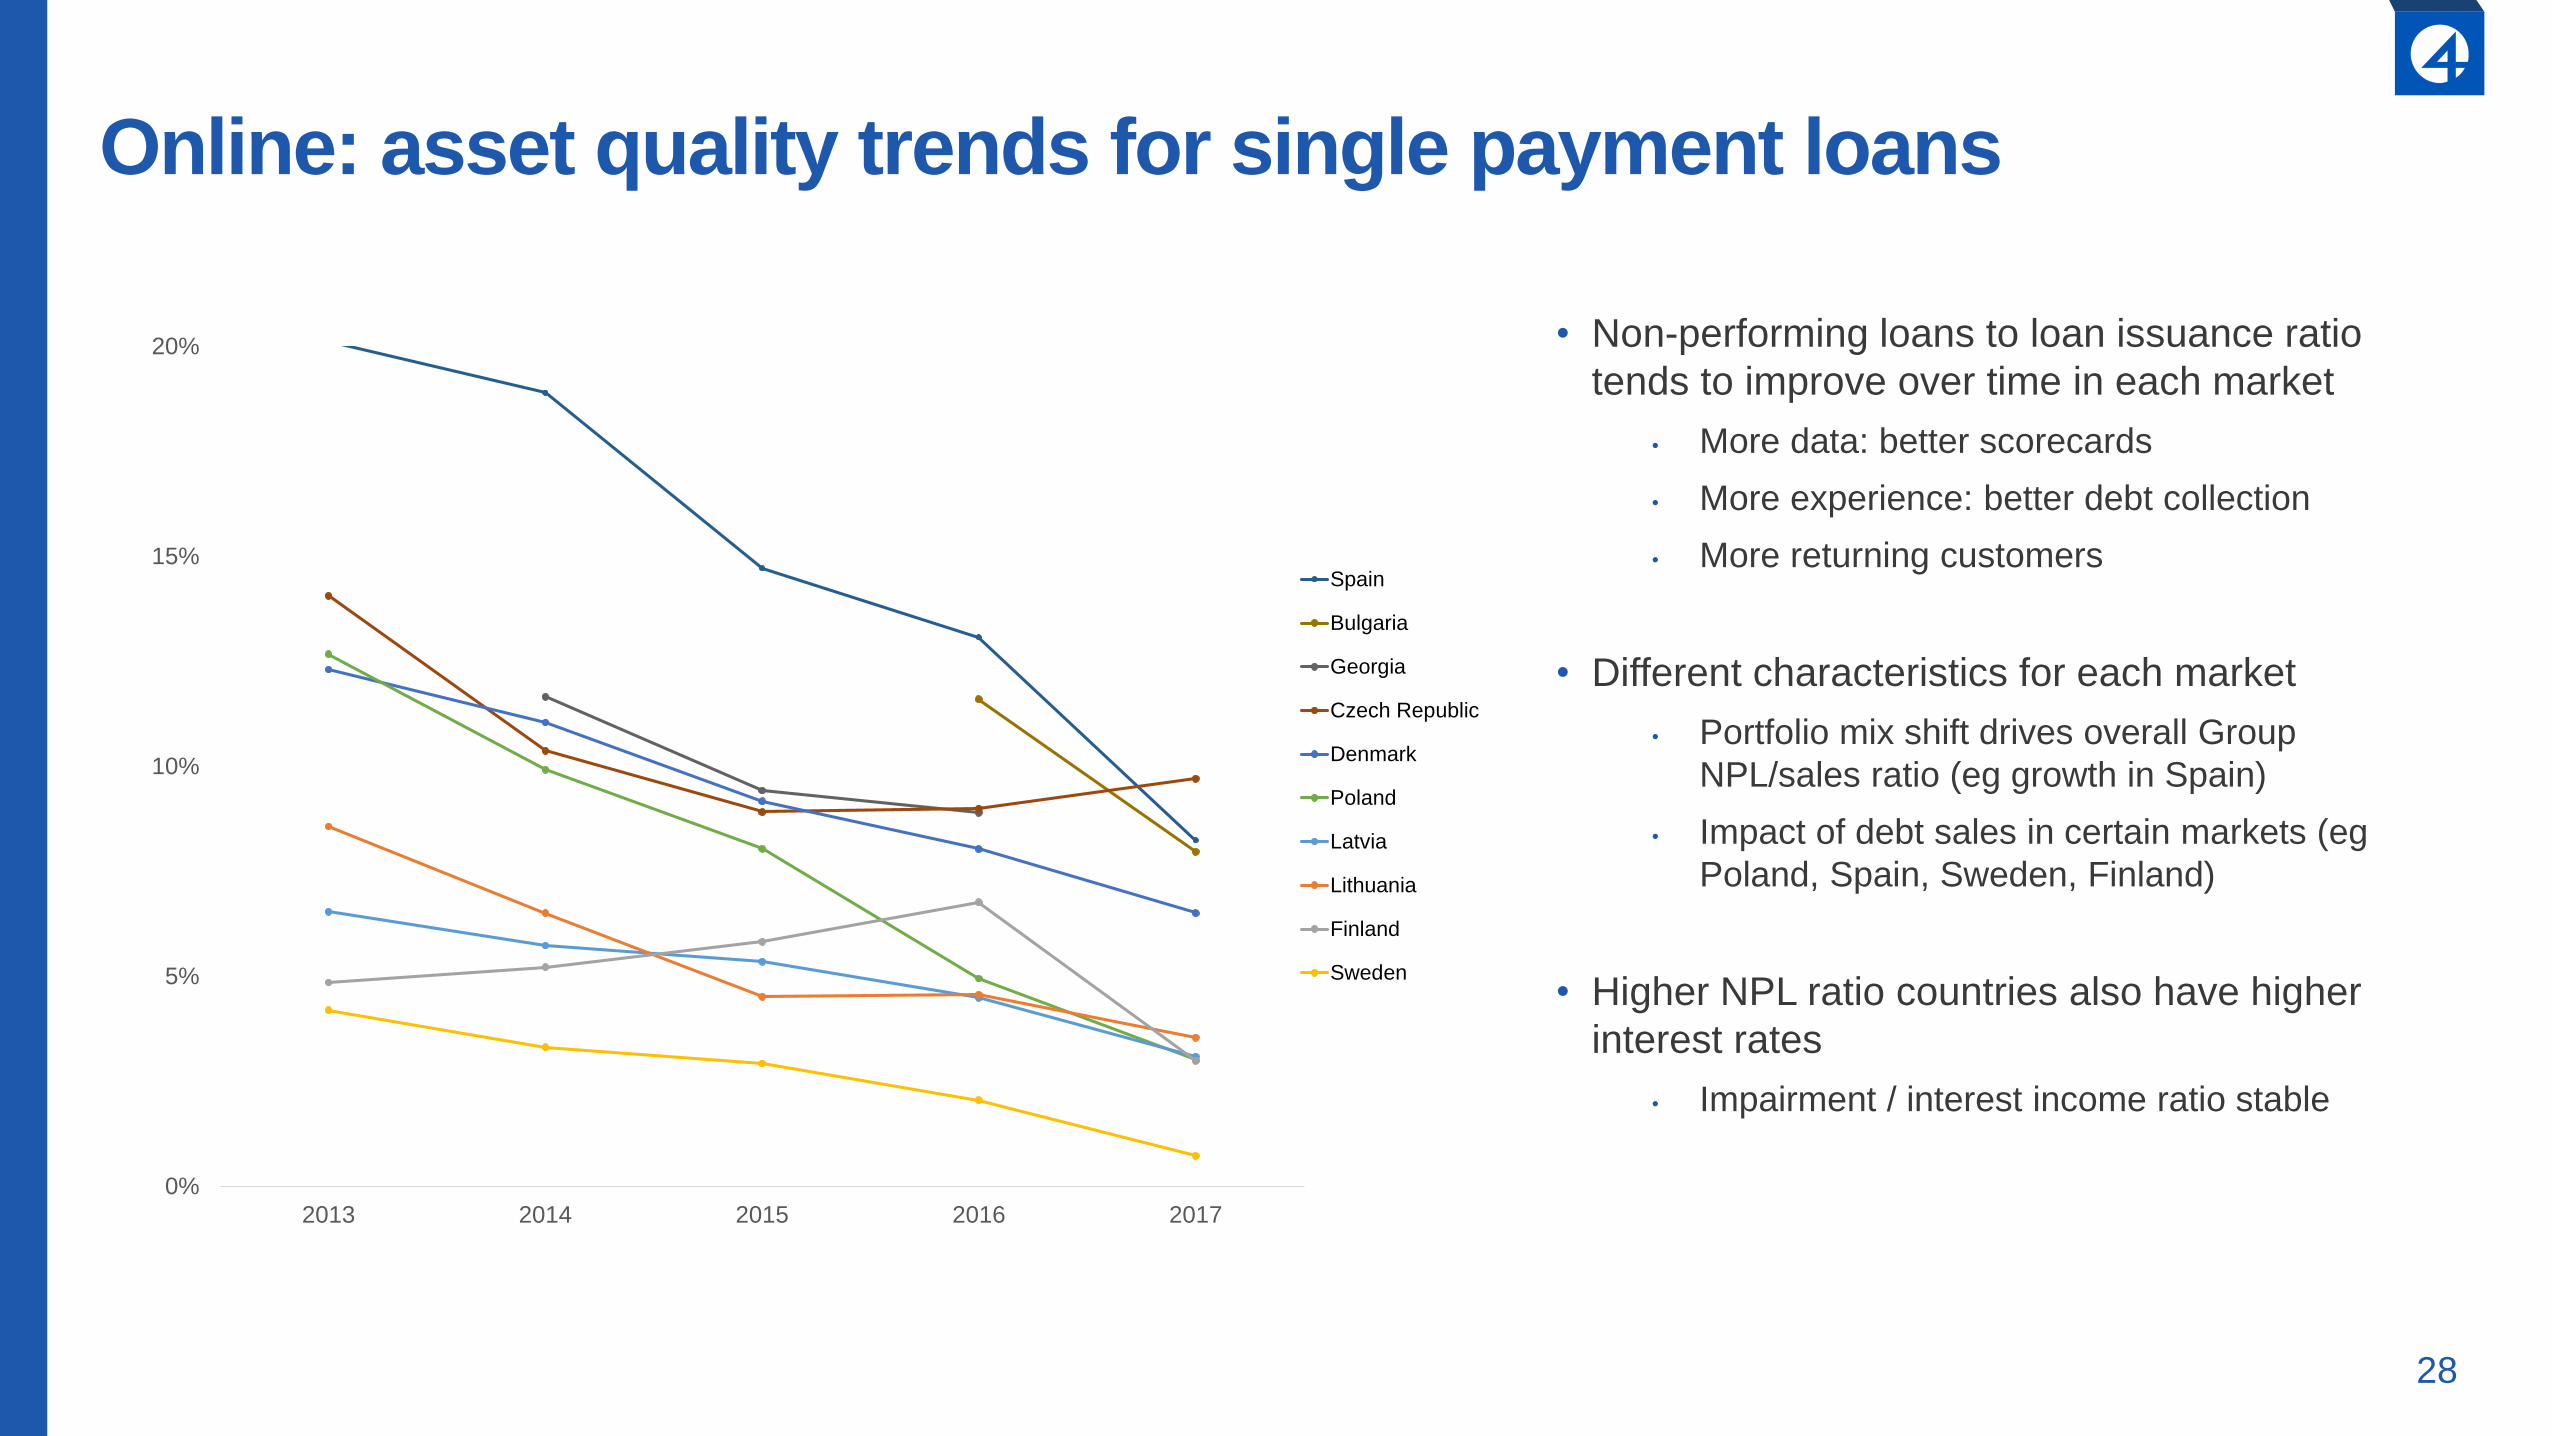
Online: asset quality trends for single payment loans
• Non-performing loans to loan issuance ratio
tends to improve over time in each market
• More data: better scorecards
• More experience: better debt collection
• More returning customers
• Different characteristics for each market
• Portfolio mix shift drives overall Group
NPL/sales ratio (eg growth in Spain)
• Impact of debt sales in certain markets (eg
Poland, Spain, Sweden, Finland)
• Higher NPL ratio countries also have higher
interest rates
• Impairment / interest income ratio stable
0%
5%
10%
15%
20%
2013 2014 2015 2016 2017
Spain
Bulgaria
Georgia
Czech Republic
Denmark
Poland
Latvia
Lithuania
Finland
Sweden
29
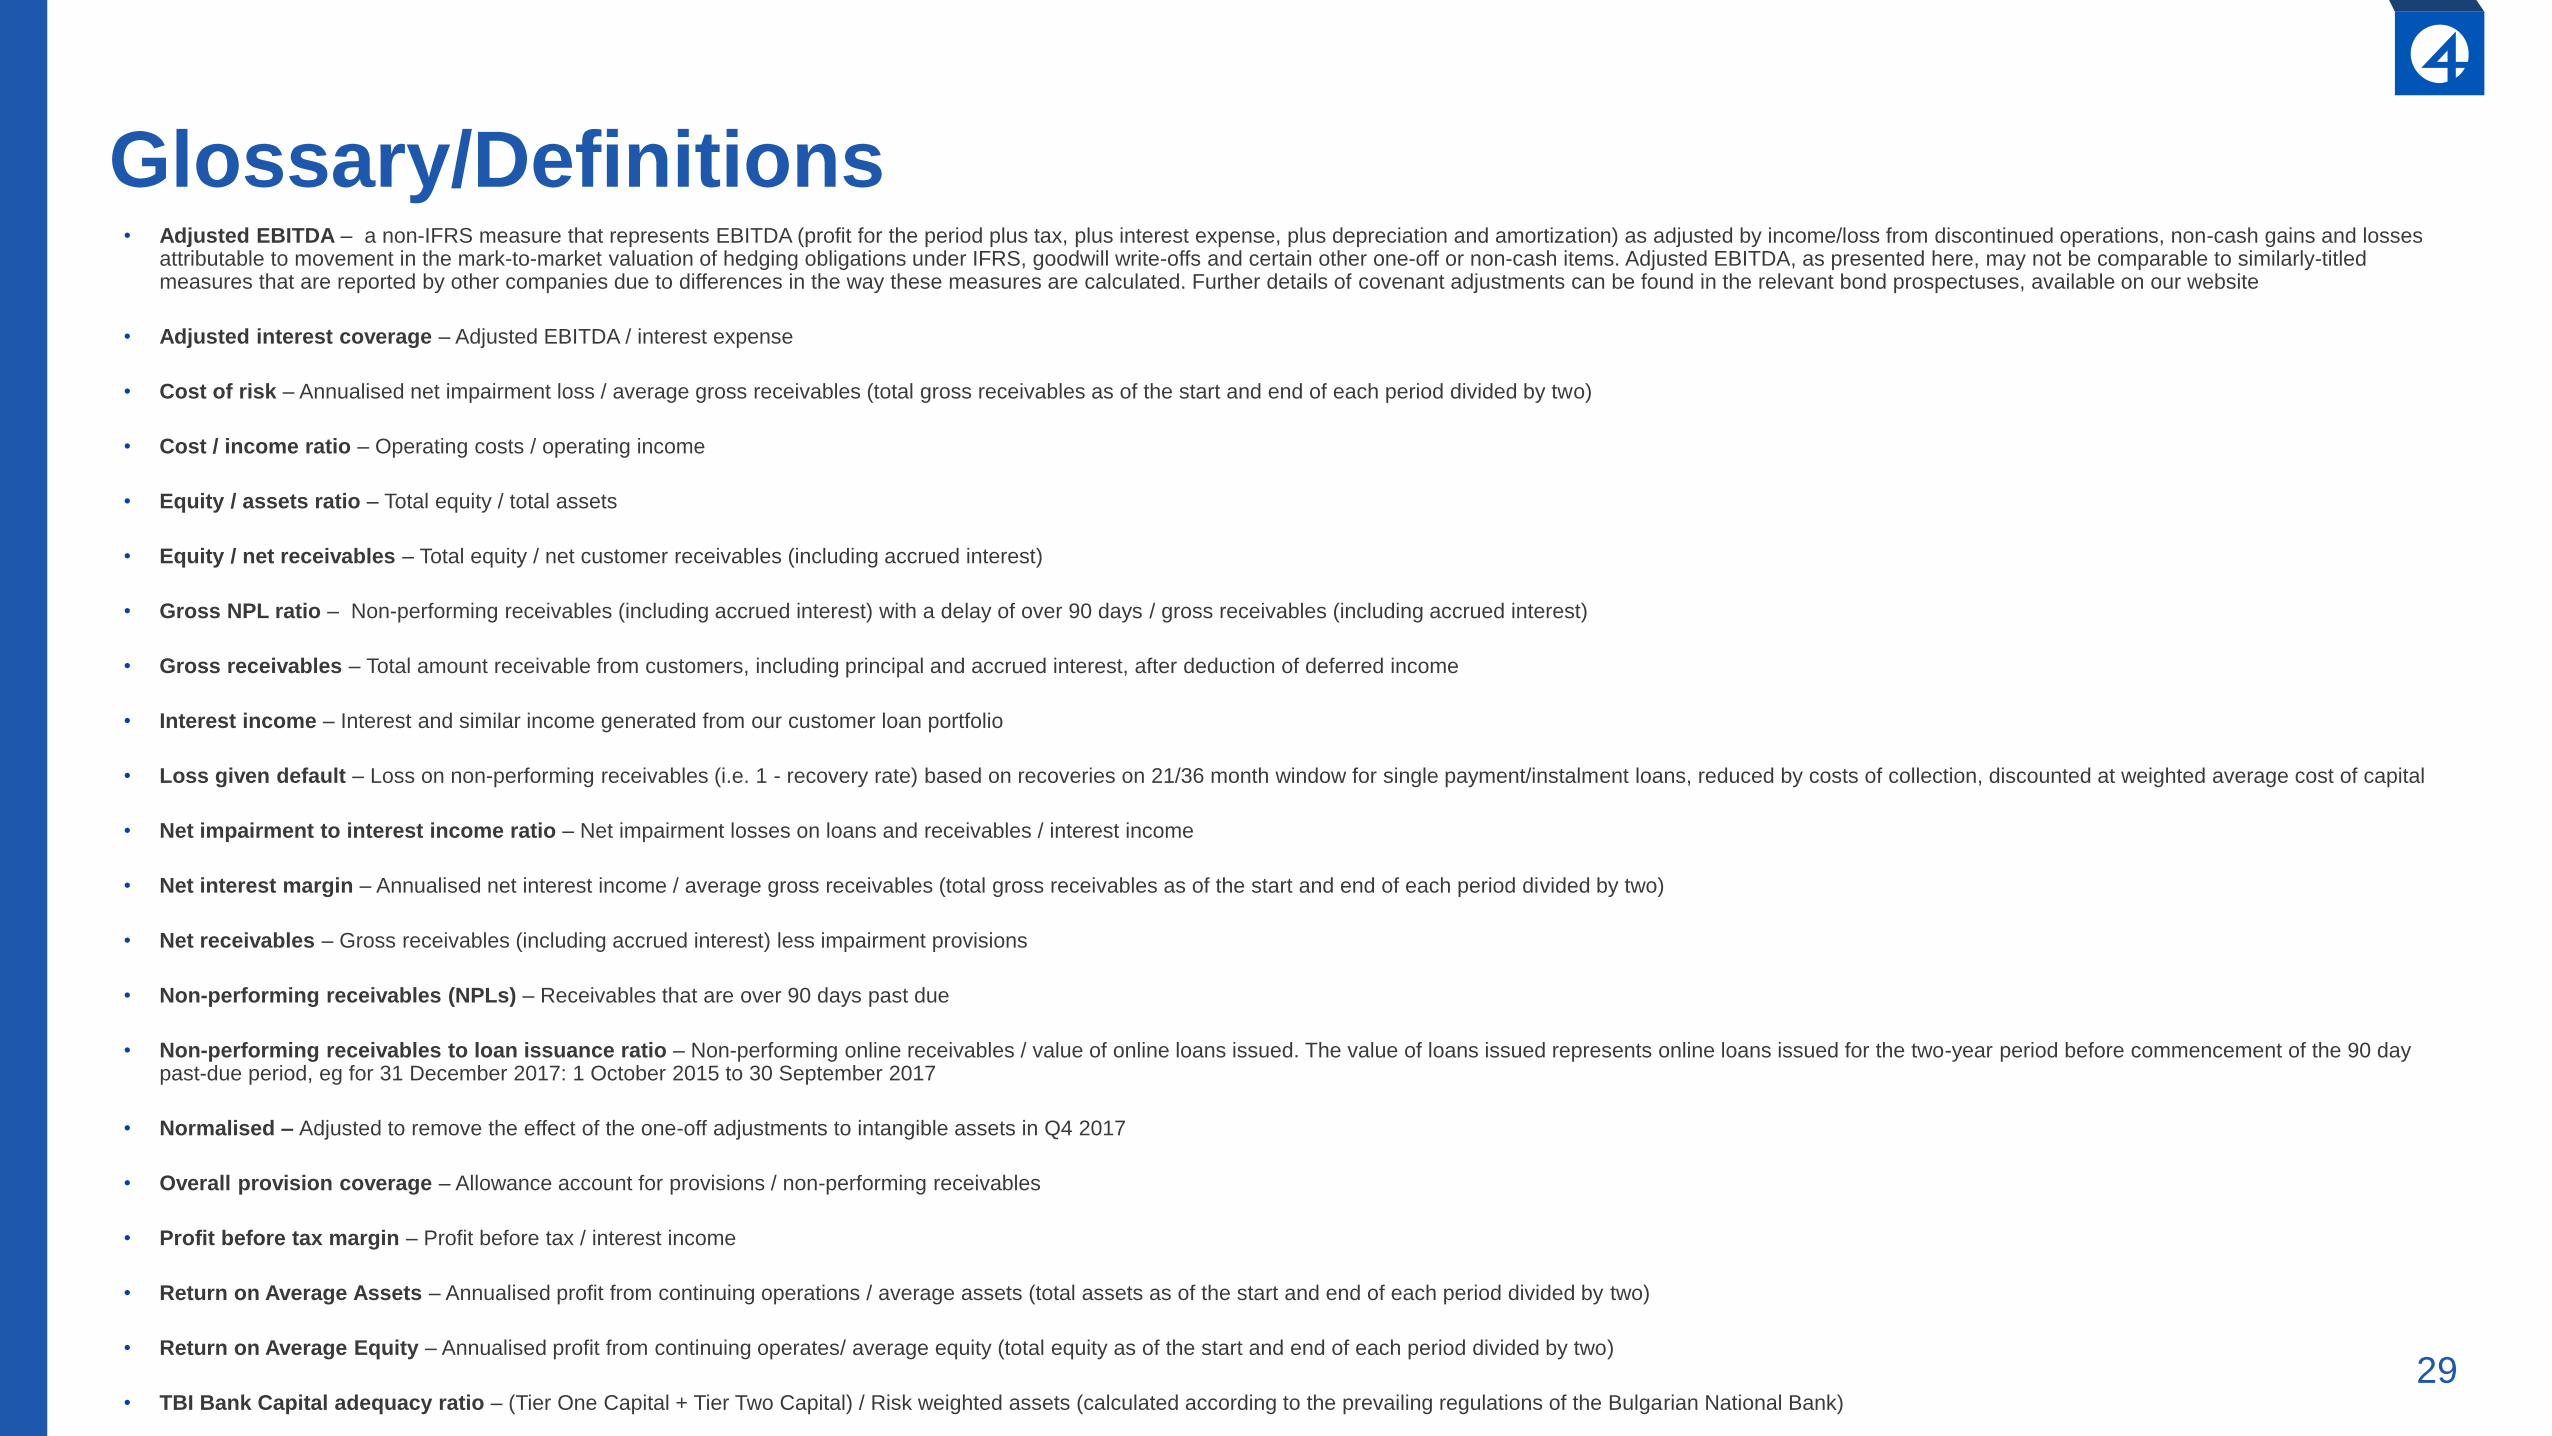
Glossary/Definitions• Adjusted EBITDA – a non-IFRS measure that represents EBITDA (profit for the period plus tax, plus interest expense, plus depreciation and amortization) as adjusted by income/loss from discontinued operations, non-cash gains and losses
attributable to movement in the mark-to-market valuation of hedging obligations under IFRS, goodwill write-offs and certain other one-off or non-cash items. Adjusted EBITDA, as presented here, may not be comparable to similarly-titled measures that are reported by other companies due to differences in the way these measures are calculated. Further details of covenant adjustments can be found in the relevant bond prospectuses, available on our website
• Adjusted interest coverage – Adjusted EBITDA / interest expense
• Cost of risk – Annualised net impairment loss / average gross receivables (total gross receivables as of the start and end of each period divided by two)
• Cost / income ratio – Operating costs / operating income
• Equity / assets ratio – Total equity / total assets
• Equity / net receivables – Total equity / net customer receivables (including accrued interest)
• Gross NPL ratio – Non-performing receivables (including accrued interest) with a delay of over 90 days / gross receivables (including accrued interest)
• Gross receivables – Total amount receivable from customers, including principal and accrued interest, after deduction of deferred income
• Interest income – Interest and similar income generated from our customer loan portfolio
• Loss given default – Loss on non-performing receivables (i.e. 1 - recovery rate) based on recoveries on 21/36 month window for single payment/instalment loans, reduced by costs of collection, discounted at weighted average cost of capital
• Net impairment to interest income ratio – Net impairment losses on loans and receivables / interest income
• Net interest margin – Annualised net interest income / average gross receivables (total gross receivables as of the start and end of each period divided by two)
• Net receivables – Gross receivables (including accrued interest) less impairment provisions
• Non-performing receivables (NPLs) – Receivables that are over 90 days past due
• Non-performing receivables to loan issuance ratio – Non-performing online receivables / value of online loans issued. The value of loans issued represents online loans issued for the two-year period before commencement of the 90 day past-due period, eg for 31 December 2017: 1 October 2015 to 30 September 2017
• Normalised – Adjusted to remove the effect of the one-off adjustments to intangible assets in Q4 2017
• Overall provision coverage – Allowance account for provisions / non-performing receivables
• Profit before tax margin – Profit before tax / interest income
• Return on Average Assets – Annualised profit from continuing operations / average assets (total assets as of the start and end of each period divided by two)
• Return on Average Equity – Annualised profit from continuing operates/ average equity (total equity as of the start and end of each period divided by two)
• TBI Bank Capital adequacy ratio – (Tier One Capital + Tier Two Capital) / Risk weighted assets (calculated according to the prevailing regulations of the Bulgarian National Bank)

30
Contacts
Investor [email protected]
James EtheringtonHead of Investor RelationsPhone: +44 7766 697 950E-mail: [email protected]
Paul GoldfinchChief Financial OfficerPhone: +371 2572 6422E-mail: [email protected]
Headquarters17a-8 Lielirbes street, Riga, LV-1046, Latvia