Embed Size (px)
Citation preview

Streamline Your Costing Function to Support Strategic Decision Making
Aaron Frazier
LifePoint Hospitals
D
avid Janotha
K
aufman Hall & Associates

Our Speakers
2
Aaron FrazierDirector, Decision Support Services, LifePoint Hospitals
David JanothaVice President, Kaufman Hall & AssociatesDavid has been in healthcare for over 25 years in various roles including clinical, management, consulting and software. Currently David focuses on building decision support tools and services to facilitate improved operational, strategic and clinical results at customer facilities.
As Director of Decision Support Services at LifePoint Hospitals, Aaron leads the decision support team that supports 68 hospitals in 21 states. Aaron has more than 15 years of experience in healthcare decision support and cost accounting.
Learning ObjectivesWe plan to …
3
• Share how industry dynamics was a catalyst to improve our cost accounting processes;
• Review 4 ways we optimized our costing model to improve costing accuracy and efficiency;
• Highlight how executive reporting is evolving to improve visibility to performance trends and support more detailed ‘population analysis’;
• Discuss future plans we have to improve the value we provide as a Decision Support team.

Agenda
4
I. About LifePoint Hospitals
II. Our need to redesign our cost accounting model
III. Four significant ways we streamlined our process
IV. Our approach to Executive Reporting – today and future state
About LifePoint Hospitals
5
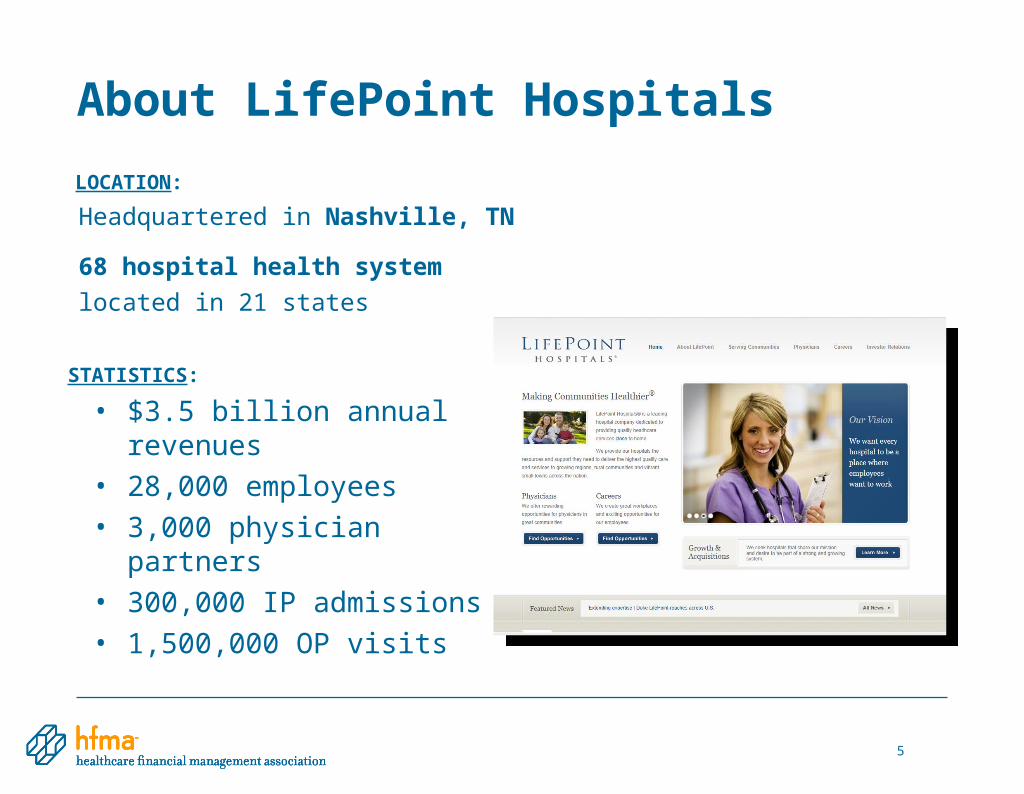
Headquartered in Nashville, TN
68 hospital health system
located in 21 states
LOCATION:
• $3.5 billion annual revenues
• 28,000 employees
• 3,000 physician partners
• 300,000 IP admissions
• 1,500,000 OP visits
STATISTICS:

6
Uhhhh…Aaron, Our Product Line
Assignment Process has been running for
2 weeks! Is this normal???
Our Costing Initiative
What drove our need for an improved ‘costing’ process?
• Executive demand for reports
• Need for more timely data
• Technology improvements
• Cumbersome tools
• Extended auditing cycles
• Shift focus from data to analysis

Key Goals to transform Cost Accounting into a more Strategic Function
7
Let’s AIM HIGH….Let’s AIM HIGH….
What’s the worst that could happen??
What’s the worst that could happen??
1. IMPLEMENT – Migrate 50+ hospitals
to a new system in 1 year.
2. STREAMLINE - data reconciliation
and validation tasks
3. IMPROVE - executive reporting, more
timely and insightful views
4. SHIFT - our teams focus away from
auditing tasks and move to more
strategic analysis

Define Cost Accounting:
Overview of Data and Process Flows
8
OverheadAllocations
Cost FactorWorkbooks
Cost Assignment
Allocations to Patient
Cost Summary
Derive Product LinesEstimate Net Revenue
ENCOUNTER
Clinical, Demographic and Financial Data by
Patient Encounter.
ENCOUNTER CHARGE DETAILEncounter Charge Item
Detail by Date of Service.
CHARGE SUMMARY
RVU’s, Cost Per Unit stored by Department
Charge Item.
• Service Line Trends• Population Analysis• Payor Trends• Physician Analysis• Strategic Modeling• Workload Projections• Ad Hoc and distributed
reporting
REPORTINGREPORTING
Financial
Patient Detail
Reference Tables
INPUTSINPUTS OUTPUTSOUTPUTSVALUE ADDED PROCESSINGVALUE ADDED PROCESSING

Define Cost Accounting:
Overview of Data and Process Flows
9
OverheadAllocations
Cost FactorWorkbooks
Cost Assignment
Allocations to Patient
Cost Summary
Derive Product LinesEstimate Net Revenue
ENCOUNTER
Clinical, Demographic and Financial Data by
Patient Encounter.
ENCOUNTER CHARGE DETAILEncounter Charge Item
Detail by Date of Service.
CHARGE SUMMARY
RVU’s, Cost Per Unit stored by Department
Charge Item.
• Service Line Trends• Population Analysis• Payor Trends• Physician Analysis• Strategic Modeling• Workload Projections• Ad Hoc and distributed
reporting
REPORTINGREPORTING
Financial
Patient Detail
Reference Tables
INPUTSINPUTS OUTPUTSOUTPUTSVALUE ADDED PROCESSINGVALUE ADDED PROCESSING
Example:
Radiology
6200-Supervisor6300-Tech 1 S/W7400-Film7400-Contrast H/M
GL Accounts: Cost Types:
Labor $Labor $
Supplies $Supplies $
Implants $Implants $

Define Cost Accounting:
Overview of Data and Process Flows
10
OverheadAllocations
Cost FactorWorkbooks
Cost Assignment
Allocations to Patient
Cost Summary
Derive Product LinesEstimate Net Revenue
ENCOUNTER
Clinical, Demographic and Financial Data by
Patient Encounter.
ENCOUNTER CHARGE DETAILEncounter Charge Item
Detail by Date of Service.
CHARGE SUMMARY
RVU’s, Cost Per Unit stored by Department
Charge Item.
• Service Line Trends• Population Analysis• Payor Trends• Physician Analysis• Strategic Modeling• Workload Projections• Ad Hoc and distributed
reporting
REPORTINGREPORTING
Financial
Patient Detail
Reference Tables
INPUTSINPUTS OUTPUTSOUTPUTSVALUE ADDED PROCESSINGVALUE ADDED PROCESSING
Example:
Radiology
Chest X-Ray W/C
Arm X-RayPelvis X-Ray 1 V
Ankle 3 View
Procedures:
Cost Per Test:
Labor $Labor $ Supplies $Supplies $
$12$12 $6$6
$12$12 $3$3
$15$15 $3$3
$10$10 $3$3

Define Cost Accounting:
Overview of Data and Process Flows
11
OverheadAllocations
Cost FactorWorkbooks
Cost Assignment
Allocations to Patient
Cost Summary
Derive Product LinesEstimate Net Revenue
ENCOUNTER
Clinical, Demographic and Financial Data by
Patient Encounter.
ENCOUNTER CHARGE DETAILEncounter Charge Item
Detail by Date of Service.
CHARGE SUMMARY
RVU’s, Cost Per Unit stored by Department
Charge Item.
• Service Line Trends• Population Analysis• Payor Trends• Physician Analysis• Strategic Modeling• Workload Projections• Ad Hoc and distributed
reporting
REPORTINGREPORTING
Financial
Patient Detail
Reference Tables
INPUTSINPUTS OUTPUTSOUTPUTSVALUE ADDED PROCESSINGVALUE ADDED PROCESSING
Example:
Charge DetailEncounter XYZ
(Rad)Chest X-Ray
(Lab) CBC(Lab) WBC
(ICU) Private Rm
Procedures:
Cost:
LaborLabor
11
11
11
11
Date:
6/126/12
6/126/12
6/126/12
6/126/12
$12$12
$9$9
$8$8
$450$450
Qty:

Define Cost Accounting:
Overview of Data and Process Flows
12
OverheadAllocations
Cost FactorWorkbooks
Cost Assignment
Allocations to Patient
Cost Summary
Derive Product LinesEstimate Net Revenue
ENCOUNTER
Clinical, Demographic and Financial Data by
Patient Encounter.
ENCOUNTER CHARGE DETAILEncounter Charge Item
Detail by Date of Service.
CHARGE SUMMARY
RVU’s, Cost Per Unit stored by Department
Charge Item.
• Service Line Trends• Population Analysis• Payor Trends• Physician Analysis• Strategic Modeling• Workload Projections• Ad Hoc and distributed
reporting
REPORTINGREPORTING
Financial
Patient Detail
Reference Tables
INPUTSINPUTS OUTPUTSOUTPUTSVALUE ADDED PROCESSINGVALUE ADDED PROCESSING
Example:
XYX
ABC
Encounters:
Encounters
LaborLabor SupplySupply
DEF
$2500$2500
$1200$1200
$750$750
$5600$5600
$350$350
$200$200
Summarized Cost:

13
INPUTSINPUTS OUTPUTSOUTPUTS
1 week
System & time intensive process.
Reconciliationto Financials
$Re-process
Costing & Patient Assignment Process
Process
!OutliersExist
2.5 weeks
Time consuming effort,facility-by-facility
(50+ in total).
AssignProduct Lines
2 days
A pre-requisite step to report
distribution that took days.
Ad hoc
Very manual process, data downloads to Excel
& emailed
Our Challenges
Compute & assign costsCompute & assign costs
Assign product lines
Assign product lines Distribute reportsDistribute reportsLoad dataLoad data
Old Costing Model Separate Query Tool
Reformat in Excel, then Distribute.

14
Four significant ways we’ve streamlined the process

15
Cost Accounting:Streamline the process
1. An improved data model2. Efficient data reconciliation3. Improved RVU & Cost Modeling4. Improved transparency to cost allocations

1 – Improved Data Model
16
Variable cost of $1,974,426?Where does this number comprise?
Labor?, Drugs?, Other Medical Supplies?
Variable cost of $1,974,426?Where does this number comprise?
Labor?, Drugs?, Other Medical Supplies?
PROBLEM:
Detail established during cost modeling is LOST when it is summarized to Patient Level.

1 – Improved Data Model
17
PROBLEM:
Detail established during cost modeling is LOST when it is summarized to Patient Level.
COSTSUMMARY
COSTSUMMARY
ENCOUNTERCHARGE DETAIL
ENCOUNTERCHARGE DETAIL
CHARGE ITEM SUMMARY
CHARGE ITEM SUMMARY ENCOUNTERENCOUNTER
Medical SuppliesMedical Supplies
ImplantsImplants
PharmacyPharmacy
Patient Care LaborPatient Care Labor
Purchased ServicesPurchased Services
Indirect Facilities
Indirect Facilities
Medical SuppliesMedical Supplies
ImplantsImplants
PharmacyPharmacy
Patient Care LaborPatient Care Labor
Purchased ServicesPurchased Services
Indirect Facilities
Indirect Facilities
Medical SuppliesMedical Supplies
ImplantsImplants
PharmacyPharmacy
Patient Care LaborPatient Care Labor
Purchased ServicesPurchased Services
Indirect Facilities
Indirect Facilities
Medical SuppliesMedical Supplies
ImplantsImplants
PharmacyPharmacy
Patient Care LaborPatient Care Labor
Purchased ServicesPurchased Services
Indirect Facilities
Indirect Facilities
Table:
Dimensions:
Detail:
Process:
DepartmentDepartment Encounter/Charge Item
Encounter/Charge Item
Department/Charge Item
Department/Charge Item EncounterEncounter
CostsMapped
CostsMapped
CostAssigned
CostAssigned
CostsDerived
CostsDerived
CostsSummarized
CostsSummarized
SOLUTION:
Intuitive data model where cost detail is retained across financial and patient views.
Additional detail helps reveal outlier trends related to cost of care.
Consistent Detail Captured thru Encounter DetailConsistent Detail Captured thru Encounter Detail

2 - Efficient Data Reconciliation
18
PROBLEM:
Auditing 50+ hospitals each month was incredibly tedious and time consuming.
Next Page
PreviousPage
Is it supposed to take 2 minutes each time I hit
NEXT PAGE?
Example Facility Level Audit Report:

2 - Efficient Data Reconciliation
19
PROBLEM:
Auditing 50+ hospitals each month is incredibly tedious and time consuming.
SOLUTION:
• Scheduled audit checks
• Automated for 50+ hospitals
• Data-driven exceptions (alerts)Process: Costs
Mapped
CostsMapped
CostAssigned
CostAssigned
CostsDerived
CostsDerived
CostsSummarized
CostsSummarized
Outliers Flagged
Automated ReviewBy Facility
Example Audit Alert Template:

3 – Online & Intuitive RVU Input
20
PROBLEM:
Cost Assignment process was an off-line manual process, prone to error.
Re-formatted to Excel
Re-formatted to Excel
Changes are uploaded
Changes are uploaded
Offline RVU
model
Offline RVU
model
Query downloads
Query downloads !
!
Technical Process
Time Intensive!Technical
Process
RVU Updates
Manager Review
Manager Review
Old Costing Model Separate Query Tool

3 – Online & Intuitive RVU Input
21
PROBLEM:
Cost Assignment process was an off-line manual process, prone to error.
SOLUTION:
• Leverage RVU plan file
• Leverages GL $ mapping
• RVU updates are interactive,
change DB in real-time
GL Accounts and $’s are mapped to
cost pools
GL Accounts and $’s are mapped to
cost pools
Example RVU Modeling Plan File:
Cost per Charge Item
logic is EASY to understand
Cost per Charge Item
logic is EASY to understand

4 – Transparent Cost Allocations
22
PROBLEM:
• Allocations were difficult to audit and (more importantly) explain.
• Direct patient support costs were being assigned to patients based on utilization instead of benefit and being categorized as indirect expense Improved Reporting:
Audit Reports that validate resulting for each Department by Allocation
Category.
Improved Reporting:Audit Reports that validate resulting for
each Department by Allocation Category.
CLINICAL ADMINCLINICAL ADMIN
4 South4 South
3 North3 North
RadiologyRadiology
ADMISSIONSADMISSIONSPatient PopulationPatient Population
Allocation OUT Allocation TO
9,8989,898
Indirect DepartmentGroupings
Indirect DepartmentGroupings
Direct Departments
Direct Departments

4 – Transparent Cost Allocations
23
PROBLEM:
Allocations were difficult to audit and (more importantly) explain.
SOLUTION:
• Tailored reports to clearly show how dollars map from Indirect to Direct Departments.
• Identified areas where costs could be allocated directly to patients.
Improved Reporting:Audit Reports that validate resulting for
each Department by Allocation Category.
Improved Reporting:Audit Reports that validate resulting for
each Department by Allocation Category.
CLINICAL ADMINCLINICAL ADMIN
4 South4 South
3 North3 North
RadiologyRadiology
ADMISSIONSADMISSIONSPatient PopulationPatient Population
Allocation OUT Allocation TO
9,8989,898
Indirect DepartmentGroupings
Indirect DepartmentGroupings
Direct Departments
Direct Departments

24
Service Line Reporting:Strategies that worked
1. Updated Product Line Definitions2. Redesigned key reports3. Provide more comprehensive views of
performance
Reporting Objectives:What did we hope to accomplish?
25
As Analysts:
•To be more responsive with an improved toolset
•Shift time from tedious downloads and reformatting to more analysis
•To deliver comprehensive reports that answered first line questions about performance trends.
For the Executives (CFO’s):
•For data to be timely, well-understood, trusted
•Reports that are intuitive, easy to comprehend

#1 – Update Product Line Groupings
26
OBJECTIVE:
• Develop a consistent set of services lines across all facilities
• Provide consistency where possible across IP & OP populations.
APPROACH:
• Derive Service Lines across populations using PROCEDURES
• Where necessary, we are evaluating Department & Charges Detail for assignments
Derived by Procedure for IP & OP
Populations.
Derived by Procedure for IP & OP
Populations.

27
#2 – More Intuitive Report Formats
• Excel Pivot Tables• Prohibitively large files• Not terribly intuitive
MOVE AWAY FROM:• Refined Report Templates• Filter-”Wizards” to streamline qualifications• Pre-formatted, efficiently distributed
Filter & QualifyFilter & Qualify
Choose Primary and Secondary
Break Fields
Choose Primary and Secondary
Break Fields
Per Case TrendsPer Case Trends
ADOPTING MORE DYNAMIC REPORTING:

# 3 – Comprehensive Trend Reporting
28
OBJECTIVE:
• Shift time away from reacting to various ad hoc request to comprehensive reporting
• Isolate variables – volume, payor and cost per case measures.
Snapshots in time show raise more questions: (*) Sample data is being used.
CASE VOLUME•Is the volume changing overall?•Increasing year-over-year?•Or, Shifting across service lines?
CASE VOLUME•Is the volume changing overall?•Increasing year-over-year?•Or, Shifting across service lines?
REVENUE•Increasing?, Decreasing?•What’s driving change?•Mix? Cost Per Case?
REVENUE•Increasing?, Decreasing?•What’s driving change?•Mix? Cost Per Case?
MARGIN•What’s change to prior year?•Are high margin services up?•Shifts due to revenue or cost?
MARGIN•What’s change to prior year?•Are high margin services up?•Shifts due to revenue or cost?
VAR COST•Is it cost or utilization driven?•Do outliers exist?•Increasing in certain services?
VAR COST•Is it cost or utilization driven?•Do outliers exist?•Increasing in certain services?

# 3 – Comprehensive Trend Reporting
29
OBJECTIVE:
• Shift time away from reacting to various ad hoc request to comprehensive reporting
• Isolate variables – volume, payor and cost per case measures.
APPROACH:
• Deliver a consistent set of reports (“push”) to Division CFO’s
• Engage in follow-up to understand where additional review or analysis is needed.
Service Line Margin Analysis
Service Line Margin Analysis
Payor Mix & RateAnalysis
Payor Mix & RateAnalysis
Cost Per CaseAnalysis
Cost Per CaseAnalysis
Highlight Trends in Service Line Margins
across volume, revenue and cost drivers.
Evaluate the impact of volume, payor mix and rate changes by Service
Line (or population).
Understand Cost Drivers, by Department, by
Physician.

Benefits Achieved
30
• Reporting flexibility has led to wider utilization of Axiom by non-financial users:
• EXAMPLE #1 - Our Physician Relation Initiative teams lacked sufficient data when engaging w/ our physicians.
– We overcame this by creating physician volume reports now being utilized by facility growth teams
– The reports allow the user to see, by product line, physician volume over time and to see referral patterns across four different physician fields.
– This is leading to more accurate physician metric tracking and more effective tools to drive positive physician engagement
– Provides visualization of missing physician data points

Benefits Achieved
31
• EXAMPLE #2 - ED Dept Acuity Level Reporting
– Is now being utilized in the Emergency Rooms
– Tailored reporting now provides effective visualization trends of ER volume by acuity level

Next Steps & Future Plans
32
• Continue partnering with Divisional CFO’s
• Dashboards

33
Questions & Answers